
Abstract
Brain arteriolosclerosis (B-ASC) is characterized by pathologically altered brain parenchymal arterioles. B-ASC is associated with cognitive impairment and increased likelihood of clinical dementia. To date, no study has been conducted on genome-wide genetic risk of autopsy-proven B-ASC. We performed a genome-wide association study (GWAS) of the B-ASC phenotype using multiple independent aged neuropathologic cohorts. Included in the study were participants with B-ASC autopsy and genotype data available from the NACC, ROSMAP, ADNI, and ACT data sets. Initial Stage 1 GWAS (n = 3382) and Stage 2 mega-analysis (n = 4569) were performed using data from the two largest cohorts (NACC and ROSMAP). Replication of top variants and additional Stage 3 mega-analysis were performed incorporating two smaller cohorts (ADNI and ACT). Lead variants in the top two loci in the Stage 2 mega-analysis (rs7902929, p =
Introduction
Brain arteriolosclerosis (B-ASC) is a subtype of cerebral small vessel neuropathologic change characterized by thickening of arteriole walls in the brain. These changes can include hypertrophy or atrophy of vascular smooth muscle and luminal extracellular deposition of collagen.1–4 B-ASC is commonly found in autopsied elderly individuals, with more than 50% of participants showing some B-ASC pathology in large autopsy studies.1,3,5 B-ASC is often comorbid with multiple neuropathologies including limbic-predominant age-related TDP-43 encephalopathy (LATE), Alzheimer’s disease (AD), hippocampal sclerosis (HS), micro-infarcts, and large-vessel infarcts.1,6,7 B-ASC is also associated with cognitive decline, even after adjusting for age and the presence of other neuropathologies.1,6 Despite the clinical importance of B-ASC, its risk factors – other than age and sex – remain largely uncharacterized. 1 Hypertension (HTN) and diabetes mellitus (DM) are established clinical risk factors for arteriolosclerosis in the kidneys, but their association with B-ASC is inconsistent; in an autopsy based cohort stratified by age at death (<80 years vs. ≥80 years), HTN was significantly associated with B-ASC in the younger group only, and DM was not associated with B-ASC in either group.1,8–10
Genome-wide association studies (GWAS) have proven useful for investigating genomic risk of complex diseases via analysis of millions of genetic variants and have to date identified many thousands of genetic variants associated with disease phenotypes. 11 For example, GWAS have identified genetic risk loci for stroke and for imaging-based phenotypes of cerebrovascular disease such as white matter hyperintensities (WMH) and brain infarcts.5,12 Studies of monogenic cerebrovascular disorders have identified genes associated with collagen and basement membrane formation, vascular smooth muscle, inflammation, and potassium ion channels. 4 GWAS of HS have identified multiple ion channel-associated genes 12 that have since been replicated in gene-based studies. 13
There has been no published GWAS for autopsy-proven B-ASC to date.14–16 Given the unique and complex structures of brain arterioles and their associated structures, including astrocytes and other components of the blood-brain barrier, there is reason to suspect that the genetic risk for B-ASC may not be wholly shared with other cerebrovascular phenotypes.
4
In one previous study of Religious Orders Study/Memory and Aging Project (ROSMAP) participants, 167 independent genetic variants meeting genome-wide significance threshold (p <
In the present study, we conducted a GWAS using B-ASC pathology as an endophenotype in four independent autopsy cohorts with genotype data available.
Methods
An outline of our study design is shown in Figure 1. In Stage 1, a GWAS was performed on neuropathology data from the National Alzheimer’s Coordinating Center (NACC) Neuropathology data set linked to GWAS genotype data from the Alzheimer’s Disease Genetics Consortium (ADGC). In Stage 2, top variants from the NACC GWAS were first analyzed in ROSMAP, and then the two data sets were merged and mega-analyzed. In Stage 3, we analyzed the top variants from Stage 2 in two smaller autopsy cohorts from the Alzheimer’s Disease Neuroimaging Initiative (ADNI) and the Adult Changes in Thought (ACT) study. We then mega-analyzed all four cohorts together. To investigate potential biologically functional correlates to disease risk, we then performed colocalization analysis on B-ASC-associated variants identified as quantitative trait loci (QTL) using data from the Genetic Tissue Expression (GTEx) Project and gene-based association analyses. 17 To investigate the potential of HTN or DM acting as mediators on B-ASC risk, we performed mediation analyses on a subset of NACC participants with available clinical data.
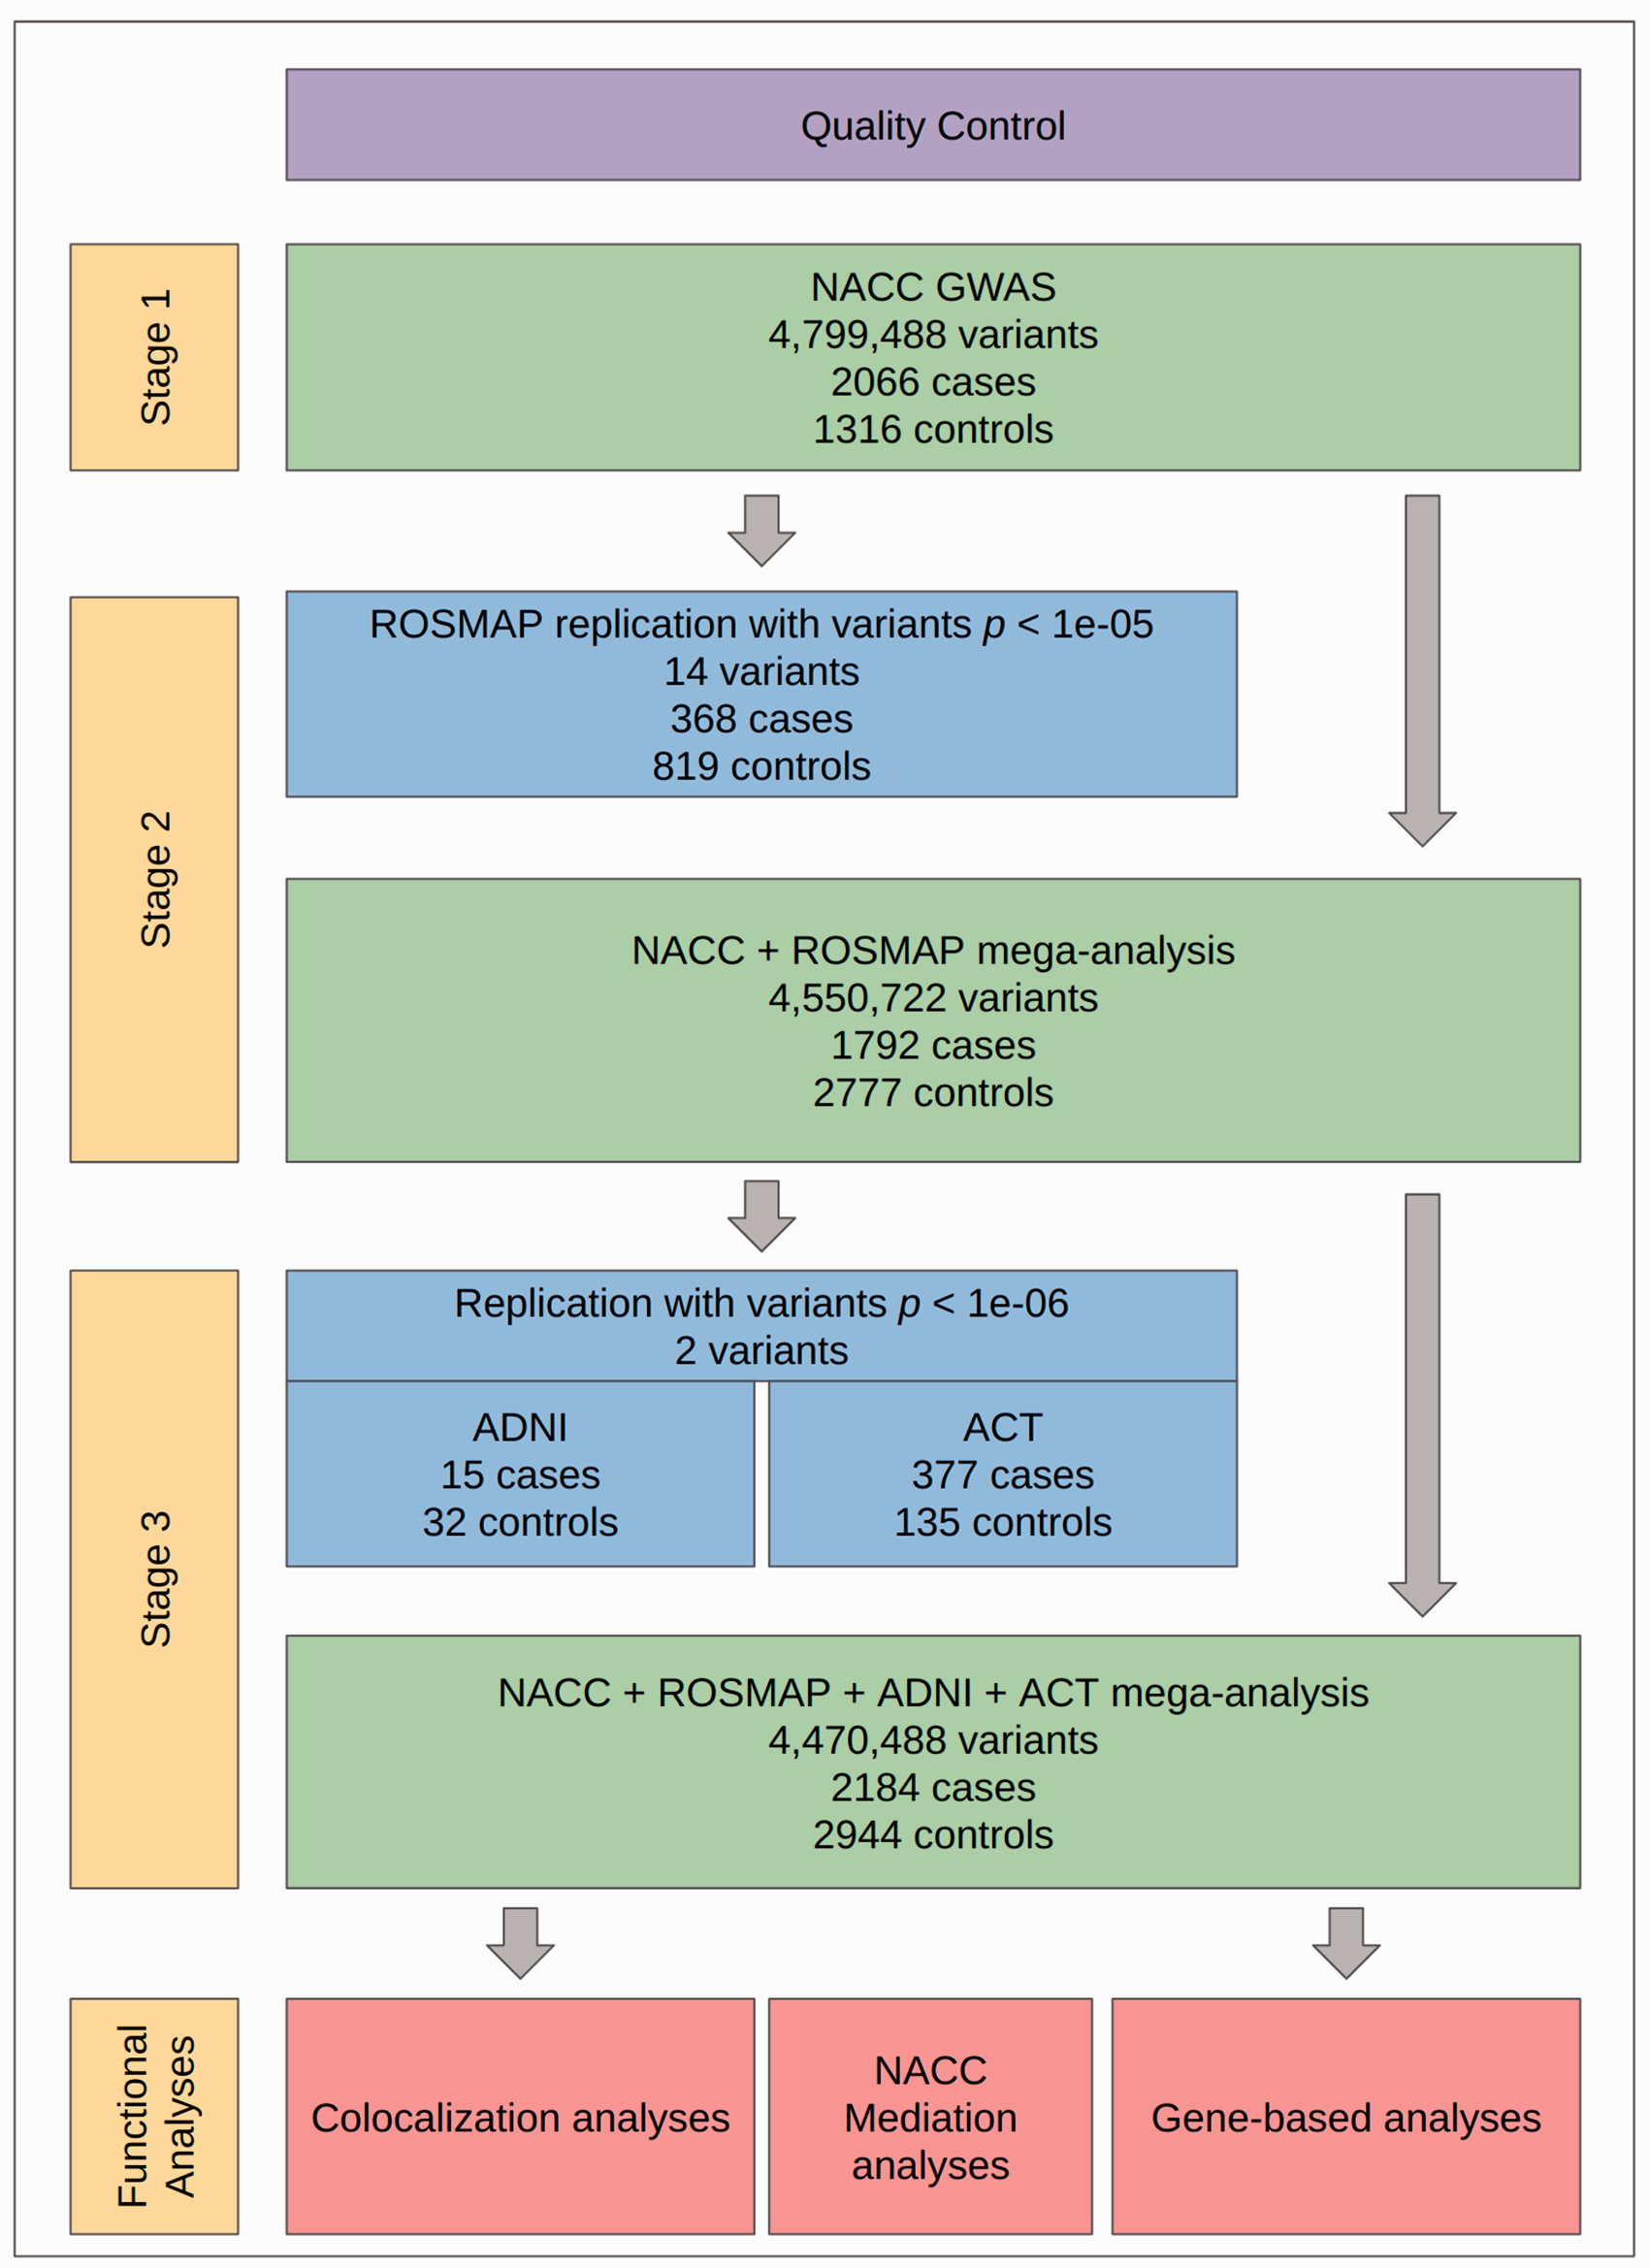
Overall study design. First, quality control (QC) was performed on all neuropathological and genotype data sets used (see Methods). GWAS were performed across three stages. In Stage 1, GWAS was performed on NACC participants (n = 3382). In Stage 2, all variants with p <
Study participants
All study participants were de-identified and deceased, so that archival samples were exclusively used. Thus our study did not fall under the definition of ‘Human Subjects Research’, according to the University of Kentucky Institutional Review Board, because of NIH Exemption #4–involving the collection/study of data or specimens if publicly available, and/or recorded such that subjects cannot be identified.
For the Stage 1 GWAS, neuropathology data from participants in >30 National Institute on Aging-funded Alzheimer’s Disease Research Centers (ADRCs) studies in the NACC Neuropathology Data Set were linked to ADGC genotype data.18,19 Each ADRC has its own study population, design, and participant recruitment strategies. Data are uniformly collected data and subsequently aggregated by NACC. Participants diagnosed with any of 19 unusual neurological conditions were then excluded because B-ASC may represent something different in the presence of these rare diseases (see Supplementary Table S1 for full exclusion criteria). Similar exclusion criteria were not applied to other studies’ participants due to lack of data availability. A total of 3501 participants had both B-ASC neuropathology and genotype data available and passed initial inclusion criteria.
The ROSMAP study has been previously described in detail and consists of harmonized data from two longitudinal cohorts: The Religious Orders Study (ROS) and the Memory and Aging Project (MAP). 20 ROS began in 1994 and recruited older Catholic Priests and Sisters from around the United States. MAP began in 1997 and recruited older adults who at the time had no diagnosis of dementia. A total of 1213 ROSMAP participants had both autopsy and genotype data available.
The ADNI (adni.loni.usc.edu) was launched in 2003 as a public-private research partnership, led by Principal Investigator Michael W. Weiner, MD. The primary goal of ADNI has been to test whether serial magnetic resonance imaging (MRI), positron emission tomography (PET), other biological markers, and clinical and neuropsychological assessment can be combined to measure the progression of mild cognitive impairment (MCI) and early AD. A subset of ADNI participants undergo autopsy and receive neuropathological phenotyping. A total of 60 ADNI participants had both B-ASC and genotype data available.
The ACT study began in 1994 and recruited residents in the greater Seattle area aged 65 years and older without dementia at time of enrollment. 21 The goal of the study has expanded to include three cohorts and continuous enrollment using the same enrollment criteria and has a current total of 4,960 participants across all three cohorts. A total of 518 ACT participants had both B-ASC and genotype data available.
Definitions of B-ASC variables used
In the NACC Neuropathology Data Set, B-ASC was graded as an ordinal variable with possible values of 0 (none), 1 (mild), 2 (moderate), or 3 (severe). Grading was performed by trained neuropathologists at each ADRC. The NACC NP v10 Coding Guidebook (https://files.alz.washington.edu/documentation/np10-guidebook.pdf) instructs examiners to grade B-ASC based on subcortical white or gray matter and to exclude arteriolar thickening due secondary to cerebral amyloid angiopathy. On page 13, the Guidebook defines B-ASC as, “concentric hyaline thickening of the media of arterioles. Intimal fibrosis may also accompany this change. The term ‘lipo-hyalinosis’ is sometimes used to refer to the same pathologic change.” The B-ASC variable in ROSMAP was graded on B-ASC histological changes exclusively in the basal ganglia. Vessel intimal pathology is first graded on a scale from 0 (none) to 6 (severe), and then collapsed to a four-level ordinal variable with the same labels as in NACC. 22 ADNI and ACT autopsy procedures followed the NACC Neuropathology codebook. 23
Identifying ethnic outliers
In all cohorts, principal component analysis (PCA) in PLINK v1.924 was performed with a pruned subset of independent (linkage disequilibrium (LD) r2 < 0.05) variants from each data set merged to data from the 1000 Genomes Project Phase 3 (1000 Genomes, n = 2504). 25 All variants were checked to ensure that major and minor alleles matched in the study data sets and 1000 Genomes. The standardized first and second principal components (PCs) were then plotted for each participant using the ggplot2 R package in R version 4.0.4. 26 All participants within a Euclidean distance of 0.35 from the centroid of 1000 Genomes participants in the EUR superpopulation were considered to be of European descent and included in analyses. We then re-ran PCA for the included participants and included the first five PCs as covariates in regression models.
Quality control (QC) of participants and genotype data
Imputation for ADGC was performed using the Haplotype Reference Consortium (HRC) panel
27
(workflow can be found at https://github.com/KBoehme/ADGC_HRC_MERGE). The ROSMAP genotype QC workflow has been previously described.
28
Briefly, imputation was performed for ROSMAP on the Michigan Imputation Server
29
using the HRC panel. Imputation for ACT was performed on the Michigan Imputation Server using the Trans-Omics for Precision Medicine (TOPMed) reference panel.30,31 We performed additional standard QC procedures on all genotyping data using PLINK v1.9 and KING.24,32–35 Variants were excluded if they had (1) a minor allele frequency (MAF) less than 5%; (2) a call rate of less than 95%; or (3) a Hardy-Weinberg equilibrium exact test p <
Participants were removed if they had a genotype missingness rate above 5% or a heterozygosity rate more than 3 standard deviations above or below the mean of their cohort. All participants were checked for duplicate genotype information across studies. All participants with duplicate information within one cohort were removed, while participants with duplicate information across cohorts were preferentially kept in the data set analyzed first and removed from cohorts used later in the study (i.e. NACC > ROSMAP > ADNI and ACT). Participant relatedness, as measured by proportion identity by descent (
Statistical analyses
Single-variant analyses
Single-variant association analyses for NACC were performed using logistic regression in PLINK v1.9 and ordinal regression in R using the MASS package.26,32 To create a dichotomous outcome variable for logistic regression, participants with none or mild B-ASC were treated as controls and those with moderate or severe B-ASC as cases. This decision was made because previous studies have found that moderate-to-severe B-ASC is associated with worse cognitive functioning.1,6 Covariates in the regression models included age at death, sex, ADGC genotyping cohort, and the first five PCs. An additive mode of inheritance was assumed in all analyses. A Bonferroni-corrected threshold of p <
In the ROSMAP analyses, single-variant regression analyses were performed using variants identified as suggestively significant in the NACC analyses, using a significance threshold of p < 0.05 for these variants. Covariates included age at death, sex, study (ROS vs. MAP) and the first five PCs. We then performed a mega-analysis on both cohorts. We also performed both fixed- and random-effects meta-analyses in PLINK v1.9 for NACC and ROSMAP logistic GWAS results.
To seek replication of our results, variants with NACC + ROSMAP mega-analytic p <
To test if variants associated with B-ASC were also associated with large-vessel cerebrovascular disease, we tested the association of variants with p <
Gene-based analyses
Following single-variant analyses, we performed gene-based analyses using MAGMA.
38
Variants were mapped to genes within 1000 kilo-base pairs (kb) using the Genome Reference Consortium Human Build 37 (GRCh37/hg19) positions available on the MAGMA website (https://ctg.cncr.nl/software/magma), producing a total of 18473 genes with at least one annotated variant. We then performed gene-based analyses in MAGMA using a Bonferroni-corrected significance threshold of p <
Colocalization analyses
To investigate potential functional mechanisms of variants driving GWAS signals for B-ASC, we performed colocalization analyses for suggestive variants using the coloc R package and QTL summary statistic data from The GTEx project V8 publicly available data (accessible at https://www.gtexportal.org/home/datasets).17,39–41 QTL are calculated in GTEx by performing single-variant analysis of gene expression for all variants within 1000 kb of the transcription start and end sites for each gene. First, we systematically checked to determine if suggestive variants (p <
Mediation analyses
To test the hypotheses that variants associated with B-ASC risk may be mediated by HTN or DM, we performed mediation analyses using R on the subset of NACC participants with clinical variables available.1,42 Participants were labeled as DM or HTN cases if they had at least one of 1) self-reported diagnosis, 2) clinician-reported diagnoses, or 3) reported use of DM or HTN medication on their most recent clinical visit prior to death.
Sensitivity analyses
Given previously identified potential differences in clinical risk factors for B-ASC in participants stratified by age at death, we re-analyzed our analyses in NACC and ROSMAP using only participants with an age at death of 80 or above. To further assess the robustness of our results under different model assumptions, we performed several sensitivity analyses in our NACC data set using the binary B-ASC outcome variable. We first performed single-variant analyses on each ADGC cohort and then meta-analyzed in PLINK v1.9 rather than using fixed-effect cohort indicators in our regression models. For variants meeting our suggestive threshold, we included related participants and performed mixed-effects analyses with a random effect incorporating the kinship matrix estimated from KING in R using the GMMAT, GENESIS, and SNPRelate packages.43–46 To overcome issues with computing PCs with samples with related participants, we used the PC-AiR method. 45
Results
Of the 3382 NACC participants that met inclusion criteria for analysis, 935 (27.6%) had no B-ASC, 1023 (30.2%) had mild B-ASC, 1043 (30.8%) had moderate B-ASC, and 381 (11.3%) had severe B-ASC (Table 1). ROSMAP participants that met inclusion for analysis had comparatively less B-ASC pathology (p = 0.002): 414 (34.9%) had no B-ASC, 405 (34.1%) had mild B-ASC, 284 (23.9%) had moderate B-ASC, and 84 (7.1%) had severe B-ASC. NACC participants were also significantly more likely to be male (50% vs.33%, p < 0.001) and had younger ages at death on average (mean age at death 82 vs. 89.6, p < 0.001) compared to ROSMAP participants. ADNI had the highest proportion of male participants of any cohort at 83%, while ACT had the lowest percentage at participant with no B-ASC with 7 (1.4%) participants.
Cohorts used in study.
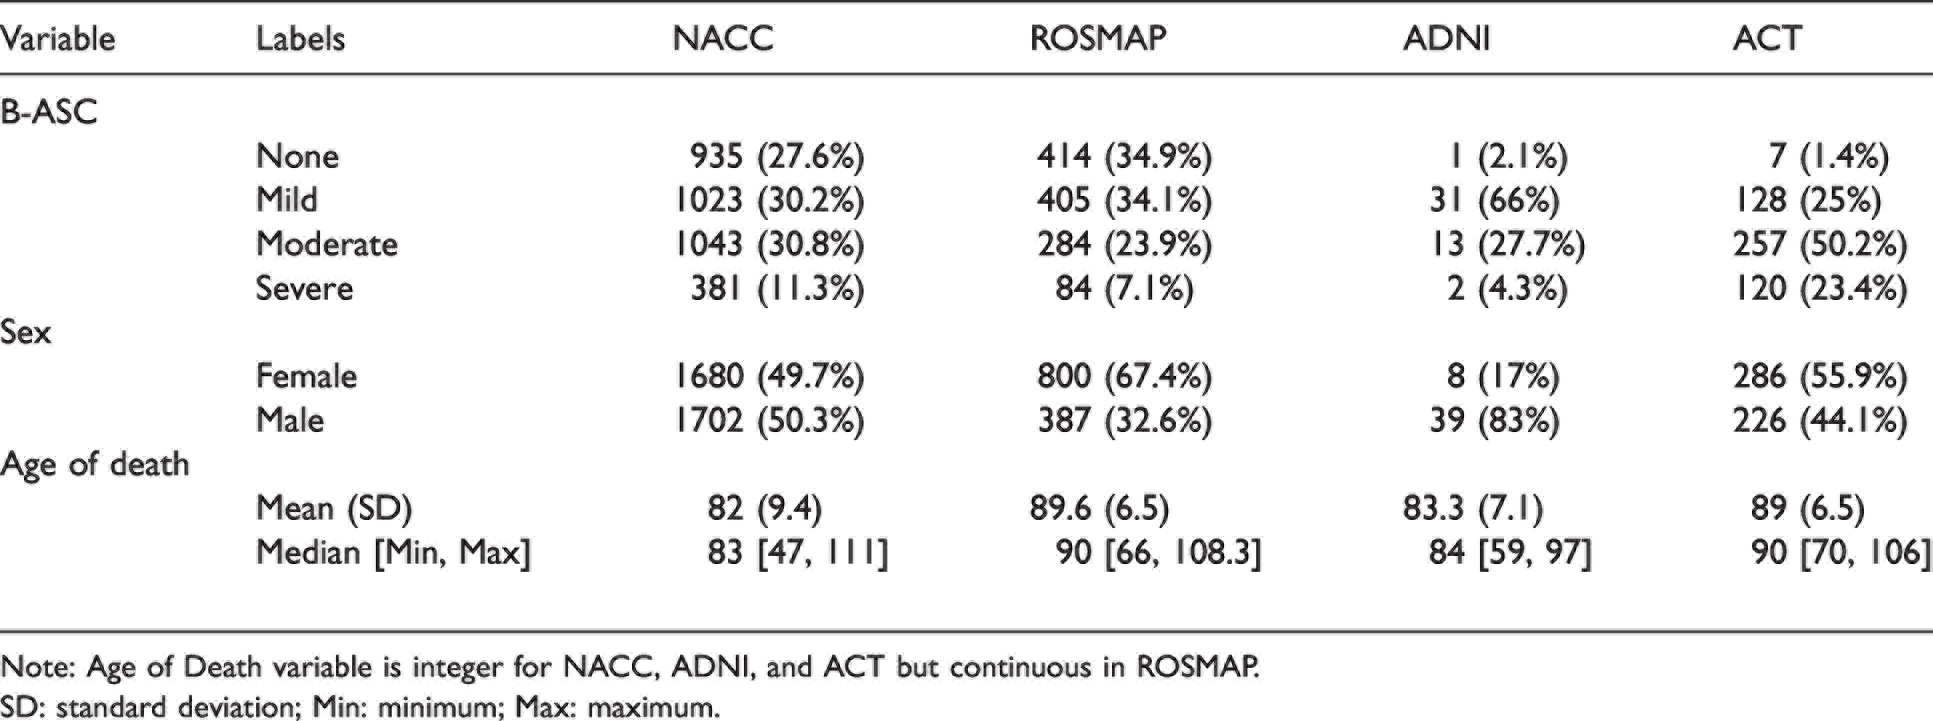
Note: Age of Death variable is integer for NACC, ADNI, and ACT but continuous in ROSMAP.
SD: standard deviation; Min: minimum; Max: maximum.
Single-variant analyses
In the NACC and ROSMAP cohorts, 1424 (42.1%) and 368 (31%) of participants had either moderate or severe B-ASC and were counted as cases, respectively. In the Stage 1 NACC GWAS (n = 3382), one locus on Chromosome 6q14.1 with lead variant rs2603462 was genome-wide significantly associated with B-ASC (odds ratio [OR] = 1.45, p =
Stage 1 GWAS results.
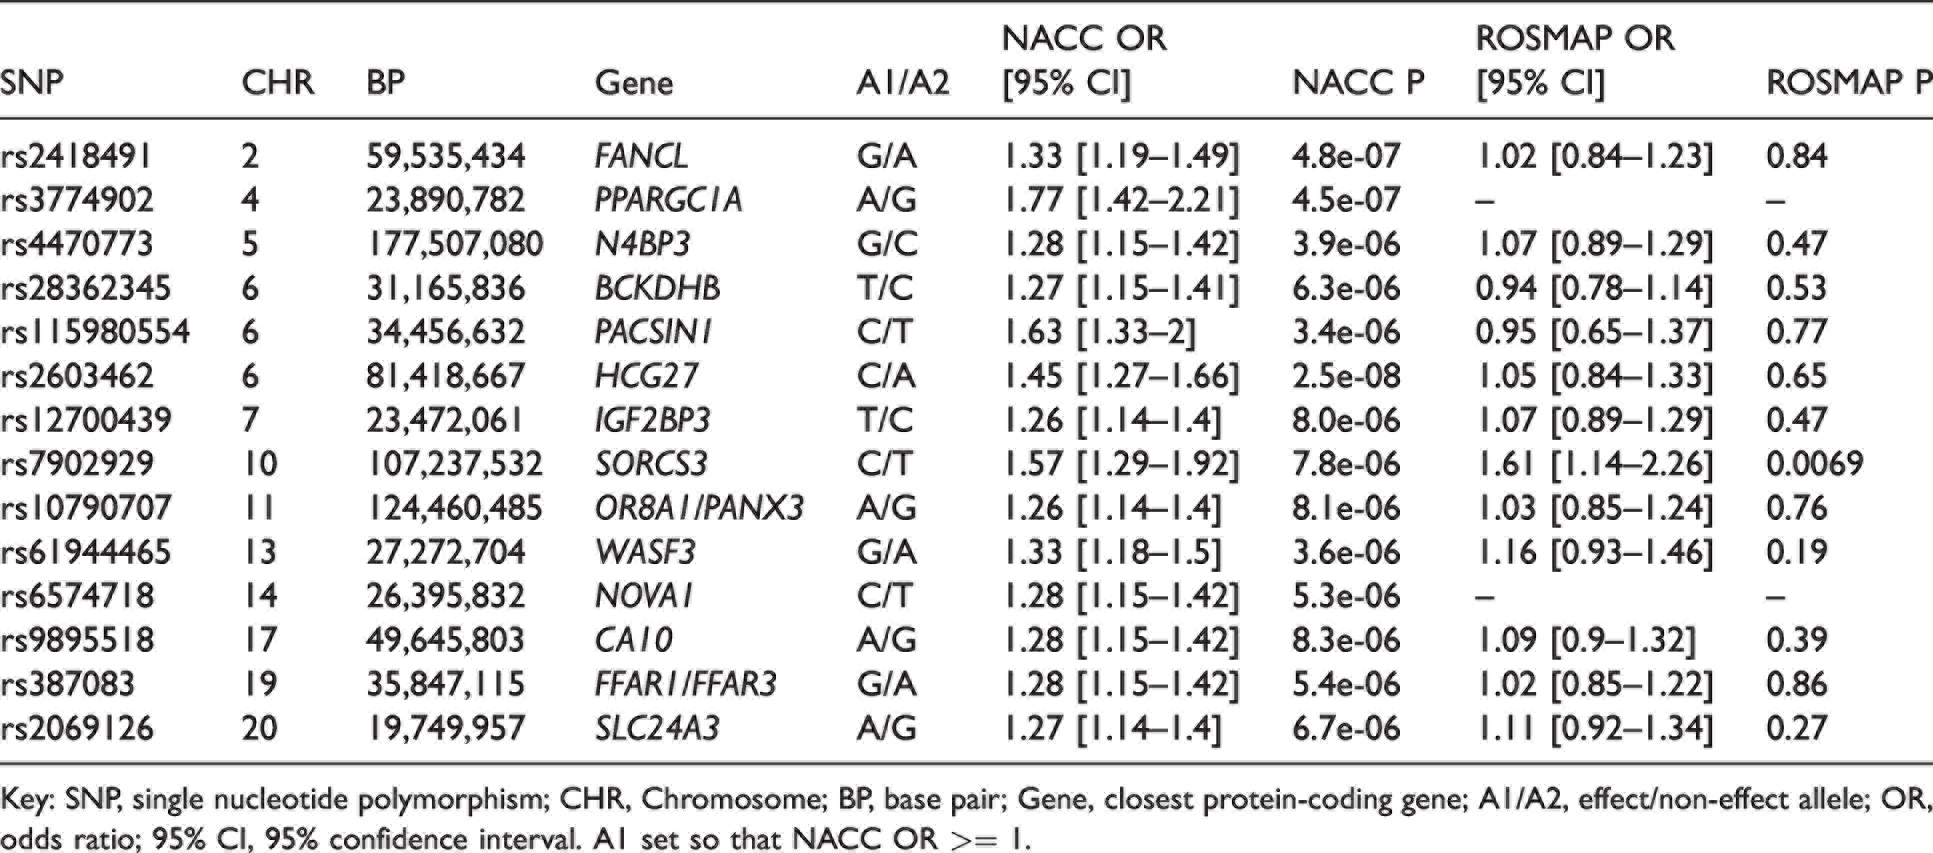
Key: SNP, single nucleotide polymorphism; CHR, Chromosome; BP, base pair; Gene, closest protein-coding gene; A1/A2, effect/non-effect allele; OR, odds ratio; 95% CI, 95% confidence interval. A1 set so that NACC OR >= 1.
In the Stage 2 NACC and ROSMAP mega-analysis (n = 4569), 11 loci met the suggestive significance threshold, with rs7902929 (OR = 1.58, p =
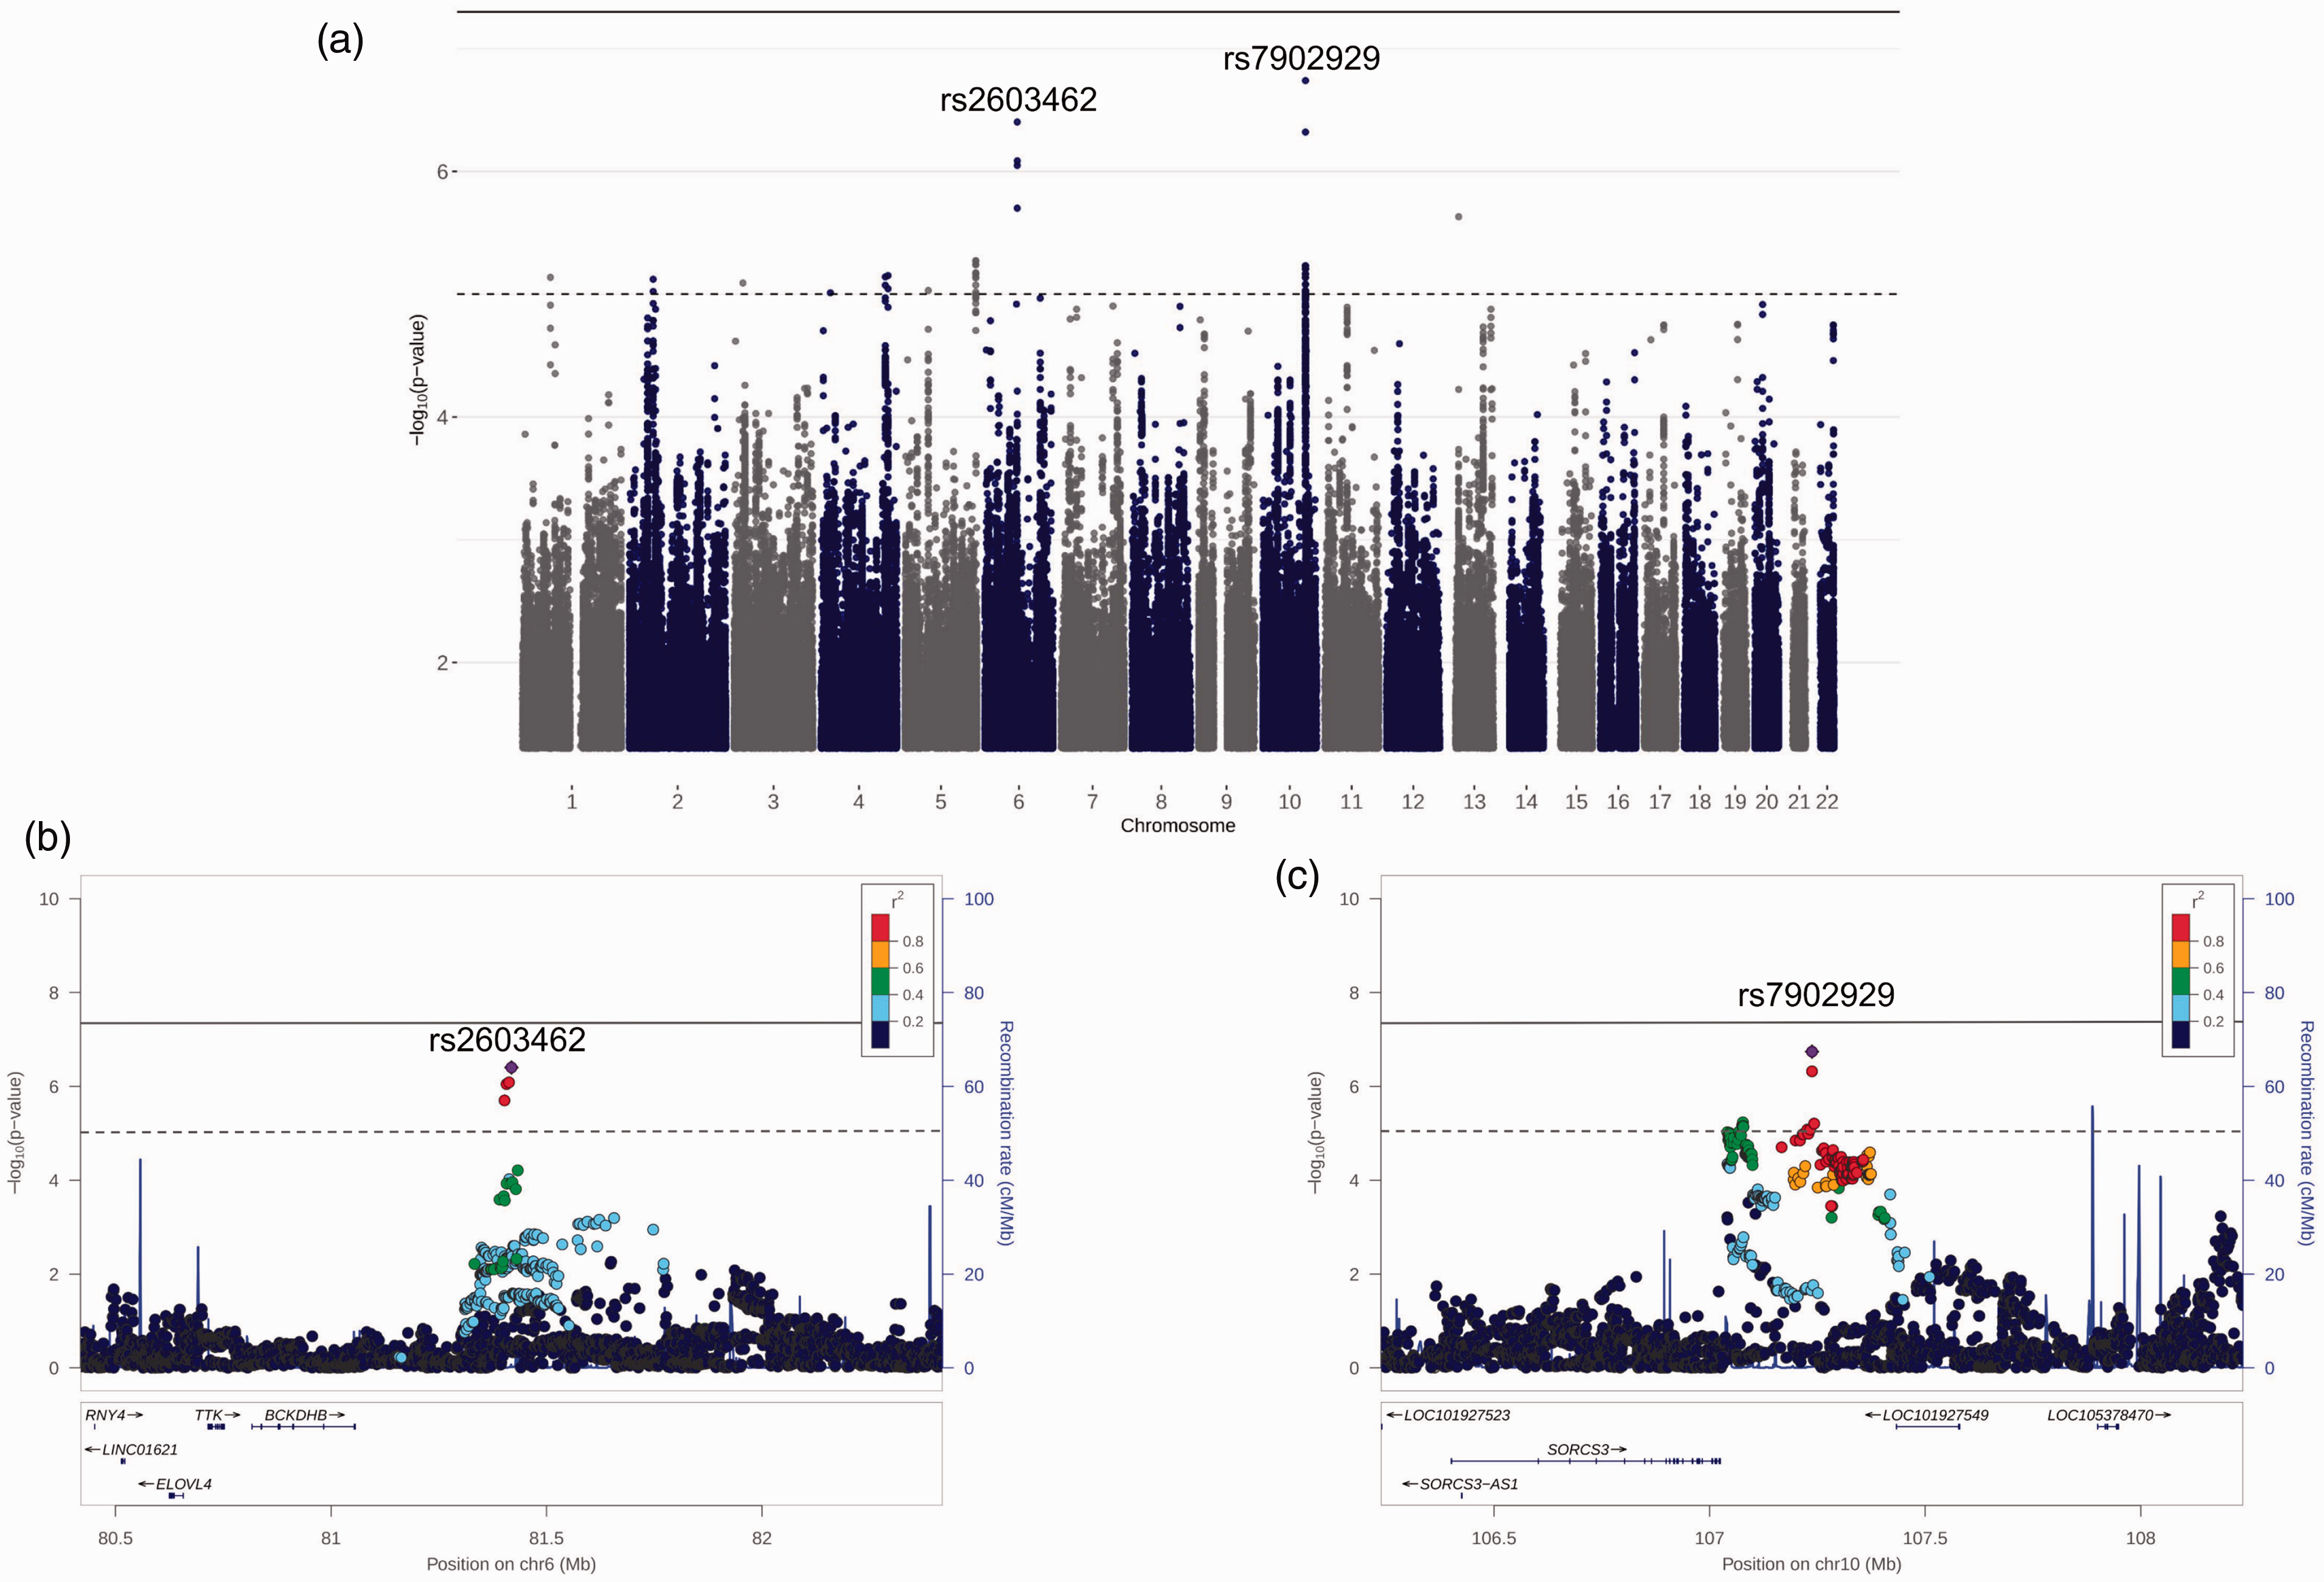
Stage 2 mega-analysis results. (a) Manhattan plot of Stage 2 GWAS mega-analysis of NACC and ROSMAP. The horizontal dashed line in each plot is the suggestive threshold (p <
Stage 2 mega-analysis and replication results.
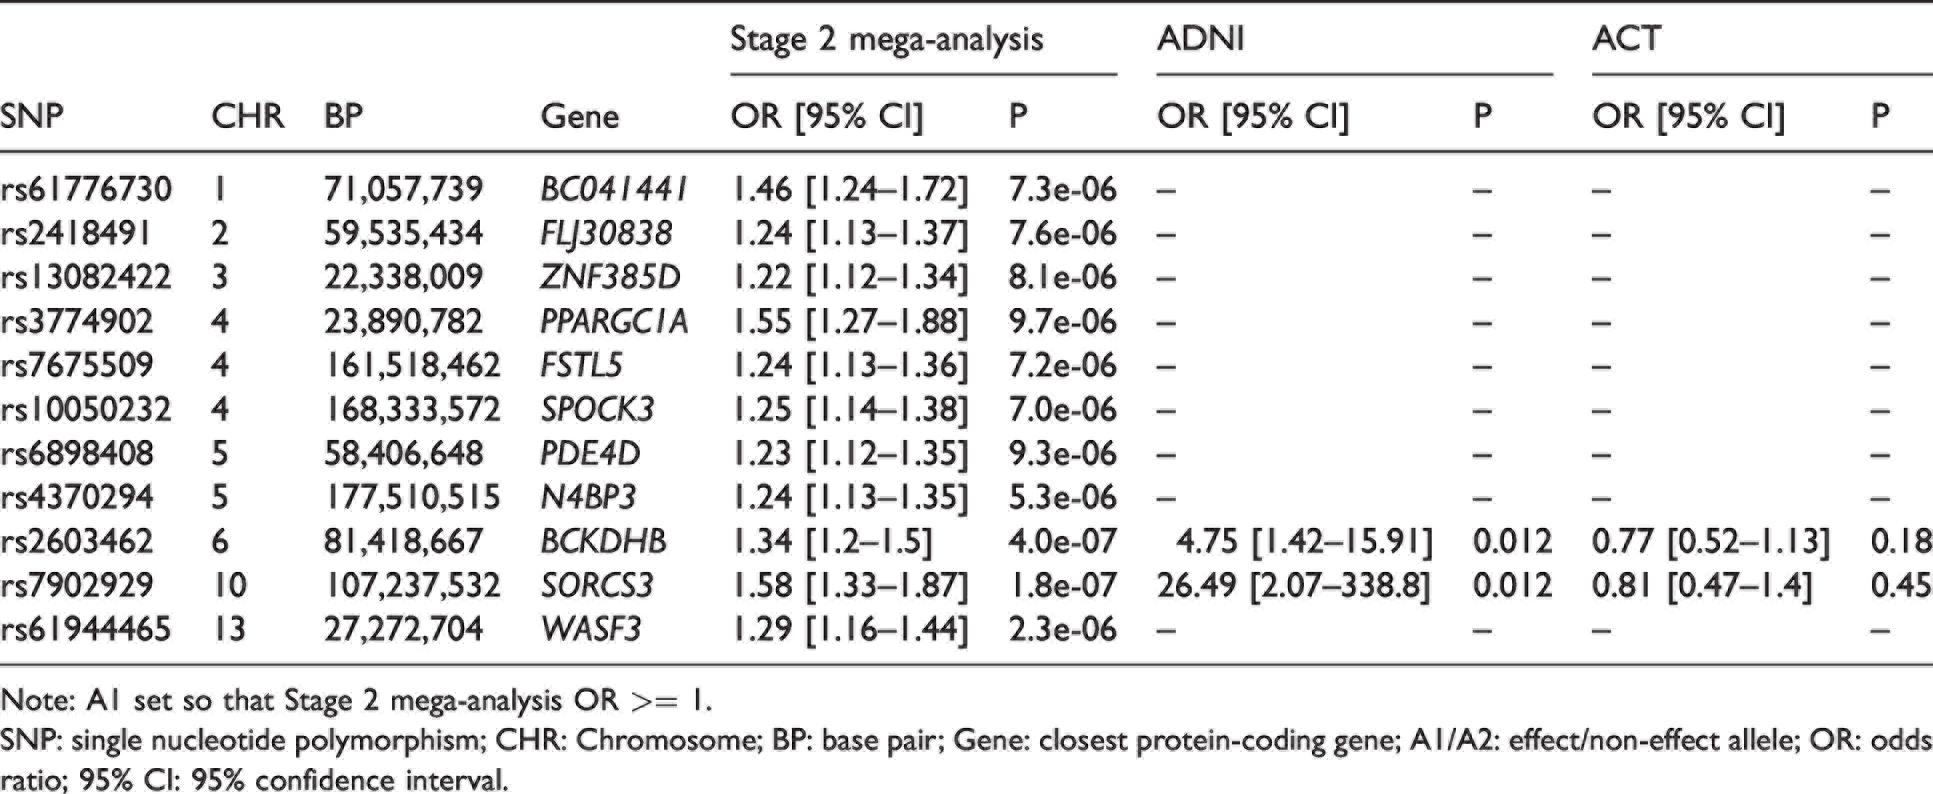
Note: A1 set so that Stage 2 mega-analysis OR >= 1.
SNP: single nucleotide polymorphism; CHR: Chromosome; BP: base pair; Gene: closest protein-coding gene; A1/A2: effect/non-effect allele; OR: odds ratio; 95% CI: 95% confidence interval.
In the Stage 3 mega-analysis combining the NACC, ROSMAP, ADNI, and ACT cohorts, no variants met the genome-wide significance threshold. A total of nine loci met the threshold for suggestive significance (Table 4), of which five were identified in Stage 2, while four were novel loci. Both rs2603462 and rs7902929 met the suggestive threshold.
Stage 3 mega-analysis results.
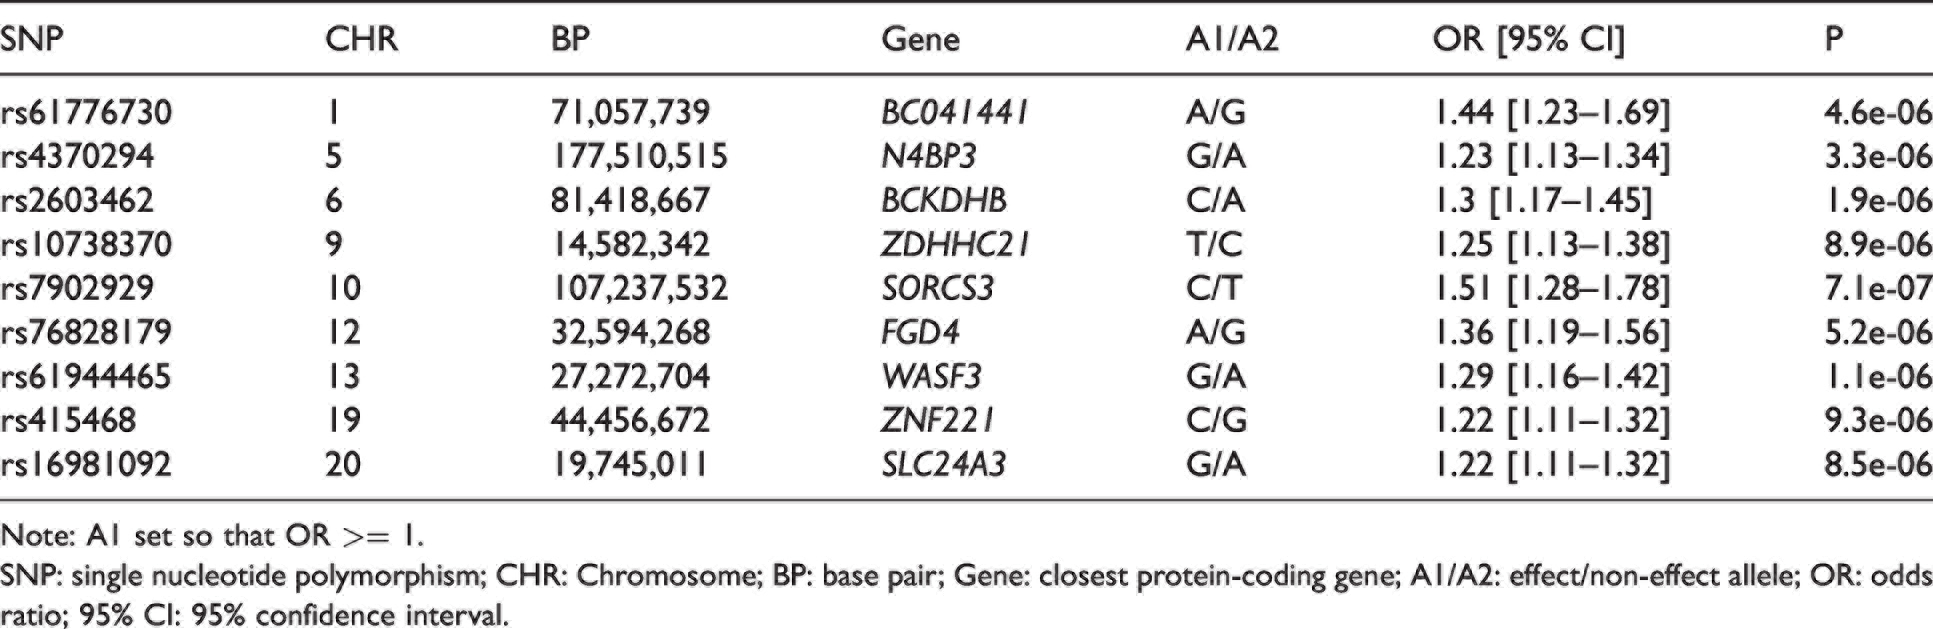
Note: A1 set so that OR >= 1.
SNP: single nucleotide polymorphism; CHR: Chromosome; BP: base pair; Gene: closest protein-coding gene; A1/A2: effect/non-effect allele; OR: odds ratio; 95% CI: 95% confidence interval.
Gene-based analysis
In the gene-based analysis, no genes achieved Bonferroni-adjusted significance (p <
Colocalization analyses
In the Stage 3 mega-analysis, four suggestive variants were significant QTLs for four genes across eight tissues in GTEx, leading us to perform colocalization analyses for a total of 10 phenotype-tissue combinations. Of these, seven met our evidential threshold of PPH4 > 50% for colocalization. The strongest evidence for colocalization was found for WASF3 expression, which colocalized with B-ASC risk across three brain regions, including the basal ganglia (PPH4 = 94.8%). Preferential splicing of WASF3 in fibroblasts colocalized with PPH4 = 85.1% (Table 5). NSD1 colocalized with B-ASC risk in the atrial appendage (PPH4 = 94.5%). ELOVL4 expression in the cerebellar hemisphere colocalized with B-ASC risk with a PPH4 of 90.1%. Finally, RIN2 expression colocalized with B-ASC risk in the Thyroid (PPH4 = 94.5%).
Expression quantitative trait loci (eQTL) Colocalizing with B-ASC risk.
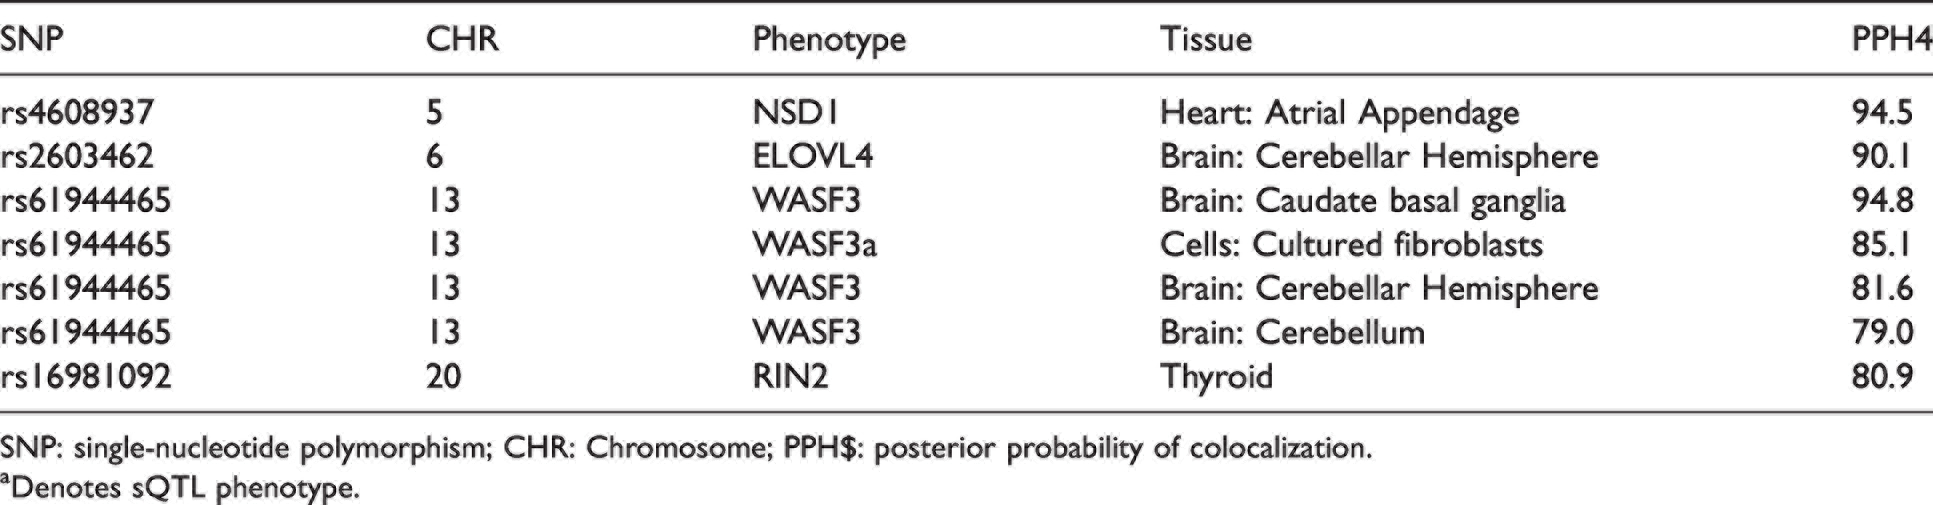
SNP: single-nucleotide polymorphism; CHR: Chromosome; PPH$: posterior probability of colocalization.
aDenotes sQTL phenotype.
Mediation analyses
In the subset of our NACC participants who had clinical data for DM (n = 1725) and HTN (n = 1726) status, none of the suggestive variants were associated with HTN or DM at the p < 0.05 level, and all variant effect sizes in regressions including HTN or DM were within the 95% confidence intervals in the base model excluding them.
Sensitivity analyses
In the analysis using only participants with an age at death of 80 years or older, no variants achieved genome-wide significance. In the NACC analysis, we identified 12 independent loci that met the suggestive threshold. No suggestive variants from the NACC analyses were validated in the ROSMAP analyses at the p < 0.05 significance threshold (Supplementary Table S2). Performing fixed-effects meta-analysis on the NACC ADGC genotyping cohorts produced nearly identical effect sizes and p-values compared to including indicator variables for the non-reference cohorts in our primary analysis. Similarly, including the participants originally excluded due to relatedness did not produce notably different effect sizes or p-values for any of the suggestive variants.
Discussion
The present study constituted the first GWAS of autopsy-proven B-ASC using neuropathology and genotype data from four large autopsy cohorts. A significant association was found between one locus on Chromosome 6 and B-ASC in the Stage 1 NACC GWAS (p =
ELOVL4, SORCS1, and SORCS3 loci
ELOVL4 codes for the elongation of very long chain fatty acids-4 protein, an “elongase” enzyme that catalyzes the synthesis of very long chain fatty acids (VLC-FA,
While the ELOVL4 mutations studied in basic science work have largely been loss-of-function mutations that cause highly penetrant monogenic disease, recent genomics works expands the role of ELOVL4 as a contributor to polygenic traits. In GTEx, ELOVL4 is more highly expressed in the brain (median transcripts per kilobase million [TPM] 5.5-43.9) relative to most other tissues. Two recent studies found genome-wide significant associations between variants mapped to ELOVL4 and multiple body weight-related phenotypes, including waist circumference adjusted for body mass index (BMI) (rs76567515, (p =
Another gene, BCKDHB, is located closer to the lead GWAS variant than ELOVL4. BCKDHB is one of three genes responsible for the monogenic metabolism disease Maple Syrup Urine Disease. 51 Additionally, another suggestive variant in NACC, rs387083, is located between the free fatty acid receptor genes FFAR1 and FFAR3 on Chromosome 19. This locus acts as an eQTL of FFAR3 in the visceral omentum adipose. Collectively, these results suggest that fatty acid metabolism and signaling may play a role in B-ASC risk.
The suggestive NACC GWAS variant subsequently validated in ROSMAP, rs7902929, is located approximately 212 kb from the 3’ end of the gene SORCS3. While the genes on which intergenic variants exert their effects are not necessarily the closest genes, SORCS3 is the only protein-coding gene within a 1 megabase window from rs7902929 (with SORCS1 just outside of this range), increasing the likelihood that the locus is functionally tied to it. SORCS3 codes for the sortilin-related VPS10 domain-containing receptor 3, a vacuolar protein expressed in the brain (see Supplementary Figure S1 for gene interaction network).52,53 Previous studies using candidate gene designs have provided tentative evidence that genetic variation in SORCS3 may be associated with AD.52,53
Additionally, a member of the VPS10 family, SORCS1, achieved the smallest p-value in the gene-based analysis. We performed a post-hoc analysis of this region and identified two independent loci with lead p-values just above the suggestive threshold driving this effect: one locus in LD with rs7902929 and one not (p =
Limitations and sources of bias
Statistical modeling indicated that none of the effects of top loci in the NACC GWAS appeared to be mediated by HTN or DM status in NACC. This finding has some caveats, including the inconsistent evidence of association between these clinical risk factors and B-ASC pathology.1,4 While HTN and DM may be associated with B-ASC in younger individuals, this association seems to be attenuated or non-existent in older individuals (80 years or older at time of death). 1 Indeed, in the present study, neither HTN nor DM were associated with B-ASC in the individuals used for mediation analysis, making the resulting lack of mediation of genetic risk not surprising. Moreover, this analysis was limited by the substantially smaller sample size (n = 1726) than that of the Stage 1 GWAS. Additionally, the diagnostic variables in NACC consisted of a mixture of patient self-reports, physician reporting, and use of HTN or DM medications. Future studies employing causal inference methods such as Mendelian randomization may be able to provide clearer evidence for or against the roles of HTN and DM in B-ASC and the mediation of B-ASC genetic risk by clinical risk factors.
Most genetic loci identified preliminarily as being associated with B-ASC in NACC were not replicated in ROSMAP. This could be potentially explained via the significantly different demographic attributes and study designs between the two cohorts, as ROSMAP participants were older at death and had lower average levels of diagnosed B-ASC pathology (Table 1). Thus, there may be unaccounted-for confounding and differential selection bias between cohorts. For instance, ROS recruits from Catholic sisters and brothers, who are on average more highly educated than the general population. In contrast, the NACC participants are recruited from primarily clinic-based populations across the ADRCs. Differences in study design are also seen in the ADNI cohort, whose recruitment practices resemble those of ADRCs, and in ACT, whose participants are recruited from the aged dementia-free community in the Seattle, WA area.
Heterogeneity in neuropathological grading of B-ASC in each cohort may also contribute to impairing study power and limiting reproducibility between studies. In one study investigating the inter-rater reliability of cerebrovascular neuropathological diagnoses (i.e., how often neuropathologists agree on diagnosing a given slide), B-ASC had the second-lowest reliability (after microinfarcts), with reliability below 0.8 in five of twelve brain regions graded. 60 This relatively low inter-rater diagnostic reliability under near-ideal circumstances (different trained experts reviewing the exact same stained slides) indicates there may be substantial measurement variance in B-ASC between neuropathologists both within and between study centers. Furthermore, B-ASC may be graded in different brain regions in different centers and studies. Of note, in the Stage 3 mega-analysis including all four cohorts, the strongest evidence for colocalization (WASF3, PPH4 = 94.8%) was found in the caudate lobe of the basal ganglia, providing preliminary support for this brain region as a potential biological target for genetic B-ASC risk.
An important limitation of our study is the relatively low sample size for a GWAS. NACC, the largest cohort used, had only 3382 participants available for GWAS, and the total sample size of the Stage 3 mega-analysis with all four cohorts was 5128. In contrast, a recent GWAS meta-analysis of AD exceeded 90,000 participants, 61 and GWAS of other phenotypes have exceeded 1 million participants. 57 Nevertheless, smaller GWAS of other neuropathologic endophenotypes have identified risk loci, 13 demonstrating that smaller sample sizes do not necessarily prevent discovery, especially for large effect-size phenomena. Despite sample size limitations, one suggestive locus on Chromosome 10 near SORCS3 identified in NACC was replicated in ROSMAP, and both this locus and a locus near ELOVL4 were replicated in ADNI. Furthermore, nine of eleven loci suggestively associated with B-ASC in NACC had affect sizes in the same direction in ROSMAP, which suggests that these loci may be associated with B-ASC but suffer from suffer from regression towards the mean in the ROSMAP analysis. Finally, the use of downstream analyses can provide additional functional evidence for risk loci that do not meet the conservative Bonferroni-corrected significance thresholds.
Supplemental Material
sj-pdf-1-jcb-10.1177_0271678X211066299 - Supplemental material for Genome-wide association study of brain arteriolosclerosis
Supplemental material, sj-pdf-1-jcb-10.1177_0271678X211066299 for Genome-wide association study of brain arteriolosclerosis by Lincoln MP Shade, Yuriko Katsumata, Timothy J Hohman, Kwangsik Nho, Andrew J Saykin, Shubhabrata Mukherjee, Kevin L Boehme, John SK Kauwe, Lindsay A Farrer, Gerard D Schellenberg, Jonathan L Haines, Richard P Mayeux, Julie A Schneider, Peter T Nelson and David W Fardo in Journal of Cerebral Blood Flow & Metabolism
Footnotes
Funding
The author(s) disclosed receipt of the following financial support for the research, authorship, and/or publication of this article: R56AG057191; P30AG028383; the University of Kentucky Center for Clinical and Translational Science TL-1 Fellowship [grant number TLITR001997]; the National Center for Advancing Translational Sciences [grant number UL1TR001998]; and the Dean of the College of Medicine, University of Kentucky. The content is solely the responsibility of the authors and does not necessarily represent the official views of the NIH or the University of Kentucky.
Genotyping was supported by the Alzheimer’s Disease Genetics Consortium through the National Institute of Aging [grant numbers U01 AG032984, RC2AG036528]. We thank Margaret A. Pericak-Vance, Ph.D., of the John P. Hussman Institute for Human Genomics, University of Miami Miller School of Medicine for her work with the Alzheimer's Disease Genetics Consortium that provided data for this research.
Samples from the National Cell Repository for Alzheimer’s Disease (NCRAD), which receives government support under a cooperative agreement grant (U24 AG21886) awarded by the National Institute on Aging (NIA), were used in this study.
The Religious Orders Study and the Memory and Aging Project are supported by grants from the National Institutes of Health: [grant number P30AG10161, RF1AG15819, R01AG17917, RF1AG22018, R01AG33678, R01AG34374, R01AG36042, R01AG40039, R01AG042210, U01AG46152, R01AG47976, R01AG43379, RF1AG54057, R01AG56352, R01NS78009, and UH2NS100599], and the Illinois Department of Public Health.
The Adult Changes in Thought Study is funded through the National Institute on Aging [grant number U19AG066567].
Data collection and sharing for this project was funded by the Alzheimer’s Disease Neuroimaging Initiative (ADNI) (National Institutes of Health Grant U01 AG024904) and DOD ADNI (Department of Defense award number W81XWH-12-2-0012). ADNI is funded by the National Institute on Aging, the National Institute of Biomedical Imaging and Bioengineering, and through generous contributions from the following: AbbVie, Alzheimer’s Association; Alzheimer’s Drug Discovery Foundation; Araclon Biotech; BioClinica, Inc.; Biogen; Bristol-Myers Squibb Company; CereSpir, Inc.; Cogstate; Eisai Inc.; Elan Pharmaceuticals, Inc.; Eli Lilly and Company; EuroImmun; F. Hoffmann-La Roche Ltd and its affiliated company Genentech, Inc.; Fujirebio; GE Healthcare; IXICO Ltd.; Janssen Alzheimer Immunotherapy Research & Development, LLC.; Johnson & Johnson Pharmaceutical Research & Development LLC.; Lumosity; Lundbeck; Merck & Co., Inc.; Meso Scale Diagnostics, LLC.; NeuroRx Research; Neurotrack Technologies; Novartis Pharmaceuticals Corporation; Pfizer Inc.; Piramal Imaging; Servier; Takeda Pharmaceutical Company; and Transition Therapeutics. The Canadian Institutes of Health Research is providing funds to support ADNI clinical sites in Canada. Private sector contributions are facilitated by the Foundation for the National Institutes of Health (![]() ).
).
The NACC database is funded by NIA/NIH Grant U01 AG016976. NACC data are contributed by the NIA-funded ADRCs: P30 AG019610 (PI Eric Reiman, MD), P30 AG013846 (PI Neil Kowall, MD), P50 AG008702 (PI Scott Small, MD), P50 AG025688 (PI Allan Levey, MD, PhD), P50 AG047266 (PI Todd Golde, MD, PhD), P30 AG010133 (PI Andrew Saykin, PsyD), P50 AG005146 (PI Marilyn Albert, PhD), P50 AG005134 (PI Bradley Hyman, MD, PhD), P50 AG016574 (PI Ronald Petersen, MD, PhD), P50 AG005138 (PI Mary Sano, PhD), P30 AG008051 (PI Thomas Wisniewski, MD), P30 AG013854 (PI Robert Vassar, PhD), P30 AG008017 (PI Jeffrey Kaye, MD), P30 AG010161 (PI David Bennett, MD), P50 AG047366 (PI Victor Henderson, MD, MS), P30 AG010129 (PI Charles DeCarli, MD), P50 AG016573 (PI Frank LaFerla, PhD), P50 AG005131 (PI James Brewer, MD, PhD), P50 AG023501 (PI Bruce Miller, MD), P30 AG035982 (PI Russell Swerdlow, MD), P30 AG028383 (PI Linda Van Eldik, PhD), P30 AG053760 (PI Henry Paulson, MD, PhD), P30 AG010124 (PI John Trojanowski, MD, PhD), P50 AG005133 (PI Oscar Lopez, MD), P50 AG005142 (PI Helena Chui, MD), P30 AG012300 (PI Roger Rosenberg, MD), P30 AG049638 (PI Suzanne Craft, PhD), P50 AG005136 (PI Thomas Grabowski, MD), P50 AG033514 (PI Sanjay Asthana, MD, FRCP), P50 AG005681 (PI John Morris, MD), P50 AG047270 (PI Stephen Strittmatter, MD, PhD).
Acknowledgements
We thank contributors who collected samples used in this study, as well as patients and their families, whose help and participation made this work possible. Data for this study were prepared, archived, and distributed by the National Institute on Aging Alzheimer’s Disease Data Storage Site (NIAGADS) at the University of Pennsylvania (U24-AG041689-01). We thank the study participants and staff of the Rush Alzheimer’s Disease Center. The grantee organization is the Northern California Institute for Research and Education, and the study is coordinated by the Alzheimer’s Therapeutic Research Institute at the University of Southern California. ADNI data are disseminated by the Laboratory for Neuro Imaging at the University of Southern California.
Declaration of conflicting interests
The author(s) declared the following potential conflicts of interest with respect to the research, authorship, and/or publication of this article:Andrew J. Saykin receives [F18]Flortaucipir (AV-1451) precursor support from Avid Radiopharmaceuticals. Julie A. Schneider reports personal fees from Avid Radiopharmaceuticals (Eli Lilly Inc.), Alnylam Pharmaceuticals, and the National Hockey League. All other authors declare that they have no conflict of interest.
Authors’ contributions
Lincoln M.P. Shade, Yuriko Katsumata, Peter T. Nelson, and David W. Fardo conceived of and carried out the research and drafted the manuscript. Timothy J. Hohman, Julie A. Schneider, Andrew J. Saykin, Shubabrata Mukherjee, Kevin L. Boehme, John S.K. Kauwe, Lindsay A. Farrer, Gerard D. Schellenberg, Jonathan L. Haines, and Richard P. Mayeux provided data. Shubhabrata Mukherjee assisted with and provided consultation for ACT analyses. Kwangsik Nho and Andrew J. Saykin assisted with and provided consultation for ADNI analyses.
Data used in preparation of this article were obtained from the Alzheimer’s Disease Neuroimaging Initiative (ADNI) database (adni.loni.usc.edu). As such, the investigators within the ADNI contributed to the design and implementation of ADNI and/or provided data but did not participate in analysis or writing of this report. A complete listing of ADNI investigators can be found at: ![]()
Supplemental material
Supplemental material for this article is available online.
References
Supplementary Material
Please find the following supplemental material available below.
For Open Access articles published under a Creative Commons License, all supplemental material carries the same license as the article it is associated with.
For non-Open Access articles published, all supplemental material carries a non-exclusive license, and permission requests for re-use of supplemental material or any part of supplemental material shall be sent directly to the copyright owner as specified in the copyright notice associated with the article.