
Abstract
Altered cerebral perfusion has been reported in obstructive sleep apnea (OSA). Using dynamic susceptibility contrast MRI, we compared cerebral perfusion between male OSA patients and male healthy reference subjects and assessed correlations of perfusion abnormalities of OSA patients with sleep parameters and neuropsychological deficits at 3 T MRI, polysomnography and neuropsychological tests in 68 patients with OSA and 21 reference subjects. We found lower global and regional cerebral blood flow and cerebral blood volume, localized mainly in bilateral parietal and prefrontal cortices, as well as multiple focal cortical and deep structures related to the default mode network and attention network. In the correlation analysis between regional hypoperfusion and parameters of polysomnography, different patterns of regional hypoperfusion were distinctively associated with parameters of intermittent hypoxia and sleep fragmentation, which involved mainly parietal and orbitofrontal cortices, respectively. There was no association between brain perfusion and cognition in OSA patients in areas where significant association was observed in reference subjects, largely overlapping with nodes of the default mode network and attention network. Our results suggest that impaired cerebral perfusion in important areas of functional networks could be an important pathomechanism of neurocognitive deficits in OSA.
Keywords
Introduction
Obstructive sleep apnea (OSA) is one of the most common sleep disorders characterized by recurrent upper airway obstruction during sleep, resulting in intermittent oxygen desaturation, repetitive arousals, and sleep fragmentation.1,2 OSA is associated with an increased risk of cardiovascular and cerebrovascular disease, increased excessive daytime sleepiness, increased mortality, and reduced quality of life.3–5 In addition, OSA has been associated with neurocognitive deficits in learning, episodic memory, attention and executive function.6,7 The pathophysiological mechanism of the neurocognitive deficits in OSA remains unclear. It may include altered cerebral perfusion that is induced by frequent hypoxic episodes, blood pressure surges, and consequent alteration of cerebral autoregulation.8,9
Several studies have investigated alteration of regional cerebral perfusion seen on brain imaging data. Earlier studies using transcranial Doppler demonstrated profound decreases in cerebral blood flow (CBF) during sleep in OSA.10,11 Single photon emission computed tomography (SPECT) studies demonstrated that OSA was associated with decreased cerebral perfusion even during wakefulness, with partial remediation with positive airway pressure treatment.12–15 In recent years, perfusion MRI studies applying the arterial-spin labelling (ASL) technique revealed altered CBF in multiple brain areas of individuals with OSA, with some of these changes associated with OSA disease severity.9,16–18 ASL-MRI has the advantage of being a non-invasive procedure, free of radiation, and not requiring a contrast agent, in addition to providing greater sensitivity and specificity than Doppler techniques. 19 However, the findings related to the location and extent of hypoperfusion found in previous SPECT and ASL-MRI studies of OSA have varied across studies. Furthermore, it is unclear whether these impaired cerebral perfusions are associated with neurocognitive impairments. Recent studies also investigated cerebrovascular reactivity, the temporal change in CBF in response to vasoactive stimulus, which demonstrated increased cerebrovascular reactivity in OSA subjects.20,21 However, these studies did not directly compare CBF between OSA patients and healthy controls, and the clinical significance of increased cerebrovascular reactivity is still unclear.
Dynamic susceptibility contrast (DSC)–MRI, another MRI perfusion technique, is one of the most commonly used tools to measure cerebral perfusion in many clinical settings, including cerebrovascular disease, central nervous system neoplasms, and various neuropsychological disorders.22–26 DSC-MRI makes use of single-shot echo-planar imaging techniques and gadolinium-based contrast agents, which allow measurement of the first pass circulation of contrast agents through the brain. 25 Compared to the ASL technique, DSC has the advantage of shorter acquisition time and better signal-to noise ratio, permiting relatively higher spatial resolution. 27 Despite extensive clinical experience with DSC-MRI, it has been rarely used in neuroimaging studies of OSA, likely due to its use of contrast agents. The only study using DSC-MRI in OSA demonstrated increased CBF and cerebral blood volume (CBV) after six weeks of continuous positive airway pressure treatment compared to baseline, but only six patients were investigated. 28
In the current study, we investigate alterations of cerebral perfusion using DSC-MRI in males with OSA. First, we compared global and regional cerebral perfusion between male OSA patients and male healthy subjects. We then assessed whether such perfusion abnormalities were associated with measures of OSA disease severity and neuropsychological deficits.
Methods
Study participants
We studied 72 newly diagnosed, treatment–naïve male OSA patients (apnea-hypopnea index [AHI] ≥ 15) from the Sleep Clinic of Samsung Medical Center, and 23 male good sleepers (reference subjects). All participants were male adults aged 18 years and older. We only recruited male OSAs to avoid the possible pathophysiological differences and clinical characteristics between OSA males and females 29–31 as well as the possible gender difference in CBF among healthy patients and dynamic responses to autonomic challenges in the sleep condition.32,33 For an unbiased group comparison with the exclusively male OSA patients, we also recruited only male reference subjects.
Each study participant had a detailed clinical interview, sleep questionnaire, and overnight polysomnography. Reference subjects were defined as healthy adults without history of OSA and AHI < 5 in polysomnography tests. Exclusion criteria for both OSA patients and reference subjects were as follows: (1) comorbid heart and respiratory diseases, (2) history of malignancy, (3) history of cerebrovascular disease, (4) other neurological (neurodegenerative diseases, epilepsy, head injury) or psychiatric diseases (psychosis, current depression), (5) alcohol or illicit drug abuse or current intake of psychoactive medications, (6) a structural lesion on previous brain MRI, and (7) contraindications to MRI, such as metallic implants and claustrophobia. 4 OSA patients and 2 reference subjects were excluded due to severe motion artifact of the MR images.
The Institutional Review Board of Samsung Medical Center (IRB No. 2017-02-126) approved the study protocol and written informed consent was obtained from all subjects. The methods were carried out in accordance with the Declaration of Helsinki and the Good Clinical Practice guidelines.
Overnight polysomnography
Participants were asked not to consume any alcohol or caffeinated beverages 24 hours prior to the sleep study. Sleep studies were recorded using a Remlogic (Embla Systems, Denver, CO, US). We have previously provided a detailed description of the test procedures. 34 Sleep architecture was scored in 30-s epochs, and sleep staging was interpreted in accordance with the criteria of Rechtschaffen and Kales. 35 The American Academy of Sleep Medicine (AASM) rules (AASM manual version 2.4) were used for scoring apnea and hypopnea. 36 Apnea was defined as a reduction in airflow by 90% and more lasting at least 10 seconds. Hypopnea was defined as a reduction in airflow by 30% and more lasting at least 10 seconds with at least 4% oxygen desaturation or arousal. AHI was the average number of apneas and hypopneas in an hour of sleep.
Neuropsychological assessments
Participants underwent a battery of neuropsychological tests and a standardized intelligence test. Neuropsychological tests assessed four broad domains: attention and executive function (the Digit Span Test from the Wechsler Memory Scale-Revised, the Corsi Block Tapping Tests, forward and backward, Trail Making Tests A and B and the Stroop Test), verbal memory (Korean California Verbal Test), visual memory (Rey Complex Figure Test), and verbal fluency (controlled oral word association test). Information regarding the protocol of the neuropsychological assessments can be found elsewhere. 37
MRI acquisition
DSC perfusion MRI
All MRI images were acquired on a 3.0-T MRI scanner (Intera Achieva 3 T, Philips Medical Systems, Best, the Netherlands) with an eight-channel phased-array coil. DSC perfusion imaging was performed by using an axial T2*-weighted echo planar imaging with the following sequence parameters: repetition time (TR)=1,720 ms, echo time (TE)=35 ms, field of view (FOV)=240 × 240 mm, matrix = 128 × 128, slices = 50, slice thickness = 5.0 mm, gap = 1.5 mm, number of dynamic scans = 50, and temporal resolution = 1.8 s. Baseline images were acquired for 10 dynamic scans, followed by the automatic injection of gadolinium-based contrast agent (0.1 mmoL/kg; Gadovist, Bayer HealthCare Pharmaceuticals, Berlin, Germany) at a rate of 3 mL/s through an 18 G intravenous catheter, followed by a 40-mL normal saline flush with additional data acquisition. High-spatial-resolution sagittal T1-weighted images were acquired using the following scan parameters before injecting the contrast agent: TR = 10 ms, TE = 4.6 ms, FOV = 240 × 240 mm, matrix = 480 × 480, slices= 360, slice thickness = 0.5 mm.
Quantification of DSC MRI and image processing
DSC data was analyzed using inhouse software written in Matlab (The MathWorks Inc, Natick, MA, USA). Perfusion parameters were calculated using standard tracer-kinetic theory.
38
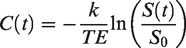
The MRI signal S(t) was first converted into concentration C(t) of Gd-DTPA following the equation:
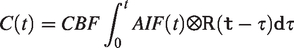
R(t) is the residual function, which descirbes the fraction of Gd-DTPA remaining in the tissue at a given time t. An oscillating index Singular Value Decomposition (oSVD) algorithm was used for deconvolution in DSC analysis,
40
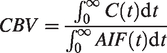
which is a tracer arrival time insensitive method by iteratively repeating the block‐circulant SVD (cSVD). CBV was calculated as the ratio between the voxel and the arterial area under the curve as described in the equation:
Perfusion parameter maps of CBF and CBV were generated from each DSC dataset. An example of the raw DSC image and the related maps of CBF and CBV are shown in Supplementary Figure 1. To mitigate the differences in the injection procedure, the maps were normalized to the whole brain mean intensity. All perfusion parameter maps were co-registered to individual T1-weighted structural images and then were normalized to MNI space. Spatial smoothing with kernel size of 5 mm full width half maximum was applied before group statistical analyses.
Statistical analysis
Analysis was performed using SurfStat (http://www.math.mcgill.ca/keith/surfstat/). 41 To compare demographics, mood questionnaires, PSG parameters, and neuropsychological scores between OSA patients and reference subjects, a one-way analysis of variance was used. The up-to-date version of SurfStat package that was used in this study included a module performing voxel-based analysis on volumetric images41,42 as well as vertex-based analysis on surface meshes. To correct for partial volume effects that can become large and more significant around the boundary between different brain tissues, we extracted the mid-cortical surface using the CIVET pipeline (V2.1). 43 This surface was placed at the medial plane by pair-wise averaging of inner and outer cortical surfaces that were built on T1-weighted MRI. After co-registering each DSC image with the T1-weighted image of the same subject, the CBF and CBV measurements were then projected to their nearest points on the mid-cortical surface. Each individual mid-cortical surface was registered to the MNI-ICBM 152 surface template 44 for the statistical analysis and visualization of the results. For the analysis of deep gray matter structures and cerebellum, we performed voxel-wise analysis and localized the findings on the MNI-ICBM 152 volume template.
Age and body mass index (BMI) were included as covariates in general linear models for all the subsequent vertex- or voxel-wise analyses. In the following tests where the CBV changes were assessed, we included the mean CBV across all the voxels within each individual brain as an additional covariate in order to control for possible confounding effects.
We assessed the CBF and CBV decreases in OSA patients compared to healthy reference subjects using voxel-wise Student’s t-tests. We also split the OSA group into moderate and severe OSA patients and performed regional t-tests between the two OSA groups and an ANOVA among three groups (two OSA groups and healthy group). Associations between sleep fragmentation (arousal index, defined as arousals per hour) or oxygen desaturation (AHI, oxygen desaturation index [ODI]) and CBF or CBV differences (i.e., whether fragmented sleep or intermittent hypoxia caused by OSA is associated with lower brain perfusion) were assessed by computing the Pearson’s correlation coefficient at each vertex or voxel. We also investigated whether other OSA severity measures were associated with brain perfusion by correlating PSG parameters with CBF or CBV at each voxel. To assess the association between the neuropsychological function and brain perfusion, we correlated each domain composite score of the neuropsychological function with CBF or CBV.
In all analyses, significance was thresholded using the false discovery rate procedure, 45 with FDR < 0.05.
Results
Clinical characteristics
Table 1 summarizes clinical characteristics and polysomnography results of OSA patients and reference subjects. All were right-handed males and mostly middle-aged. OSA patients had higher BMI and Epworth sleepiness scale compared to reference subjects. In polysomnography, OSA patients had significantly higher AHI, arousal index and ODI. OSA patients also presented with altered sleep architecture compared to reference subjects, who had increased N1 sleep and decreased N2 sleep. In comparison of neuropsychological tests, OSA patients showed significantly lower composite scores in attention and executive function, verbal memory, and verbal fluency compared to reference subjects (Table 2).
Characteristics of untreated OSA patients and healthy reference subjects.
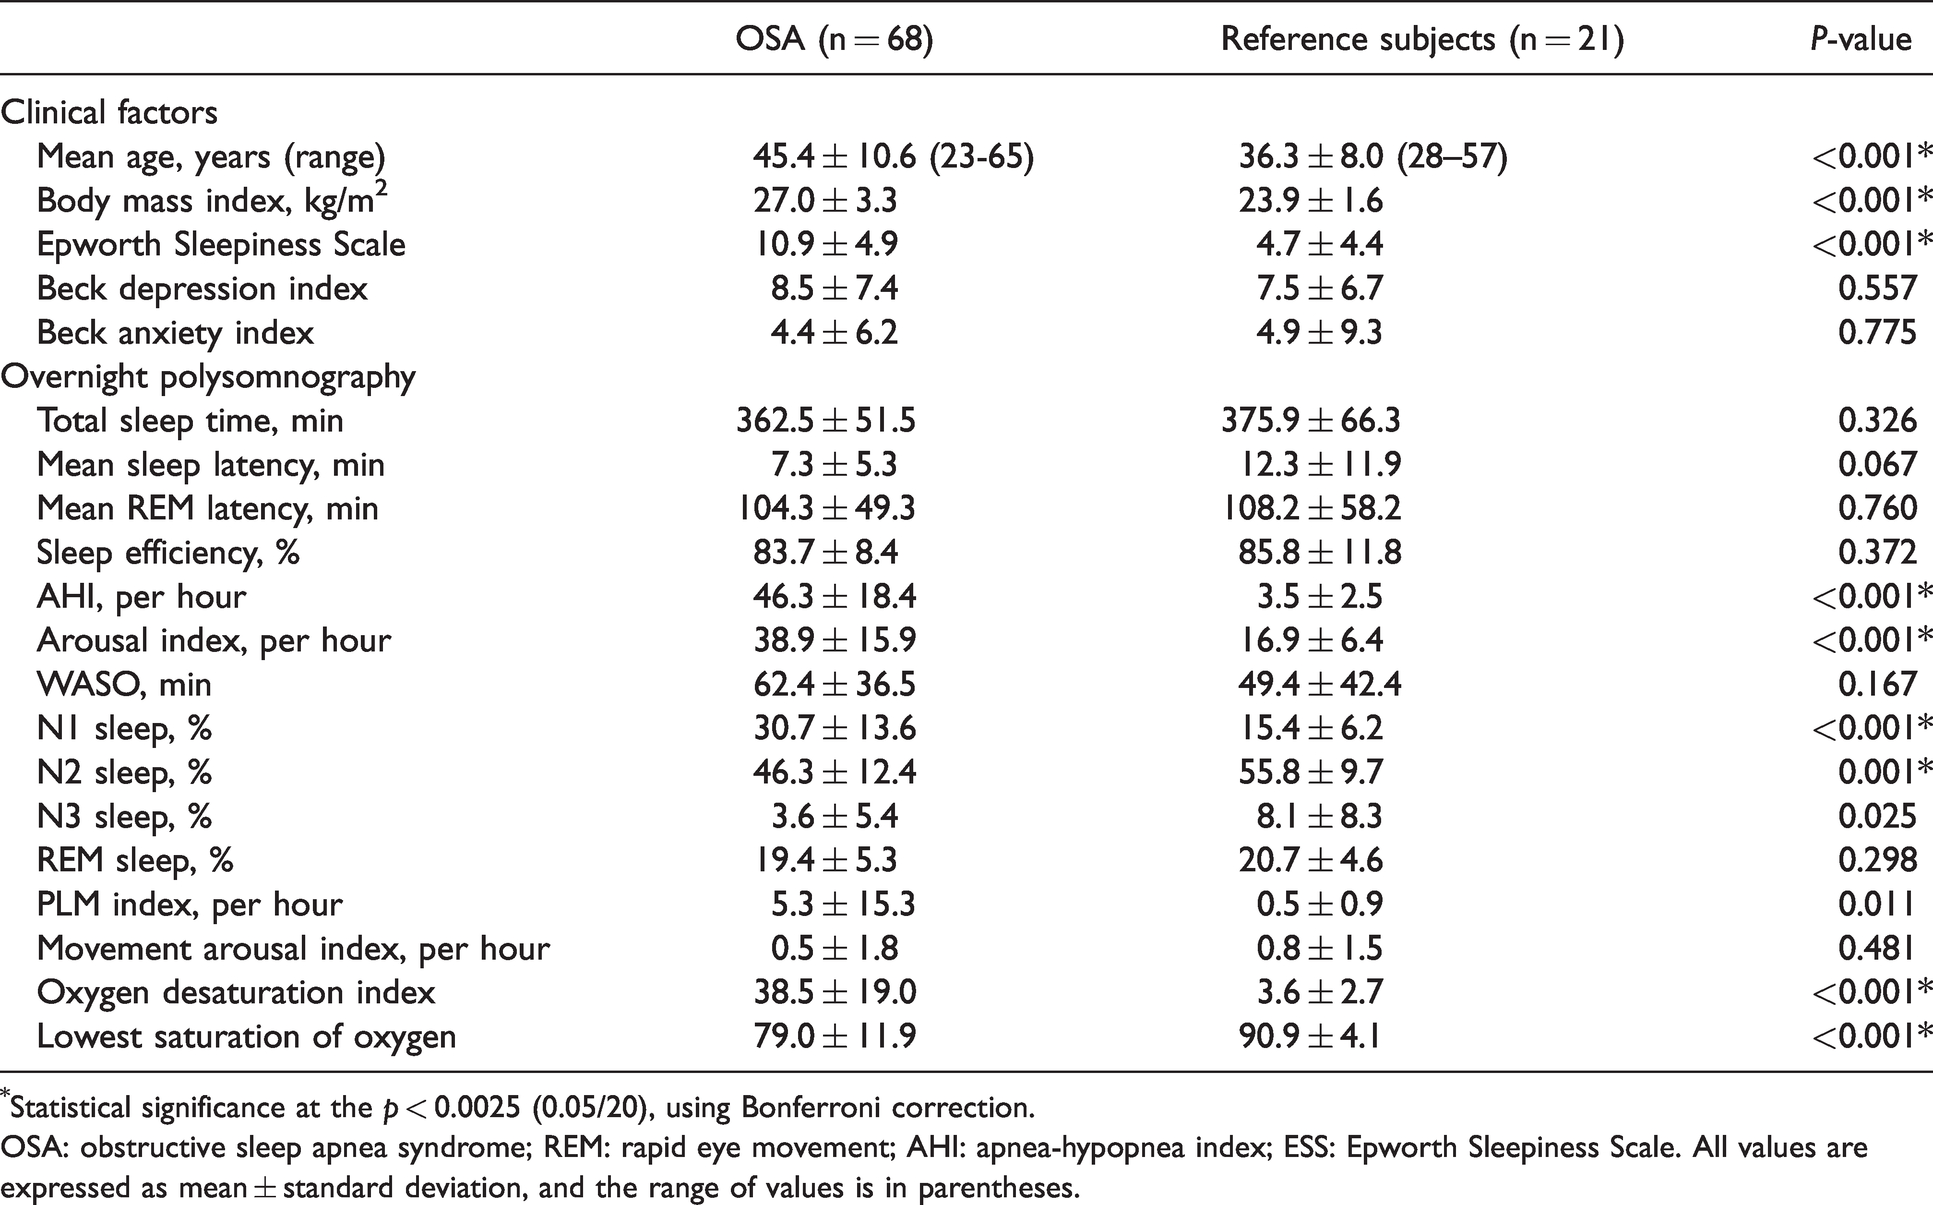
*Statistical significance at the p < 0.0025 (0.05/20), using Bonferroni correction.
OSA: obstructive sleep apnea syndrome; REM: rapid eye movement; AHI: apnea-hypopnea index; ESS: Epworth Sleepiness Scale. All values are expressed as mean ± standard deviation, and the range of values is in parentheses.
Neuropsychological analyses of OSA patients and healthy reference subjects.
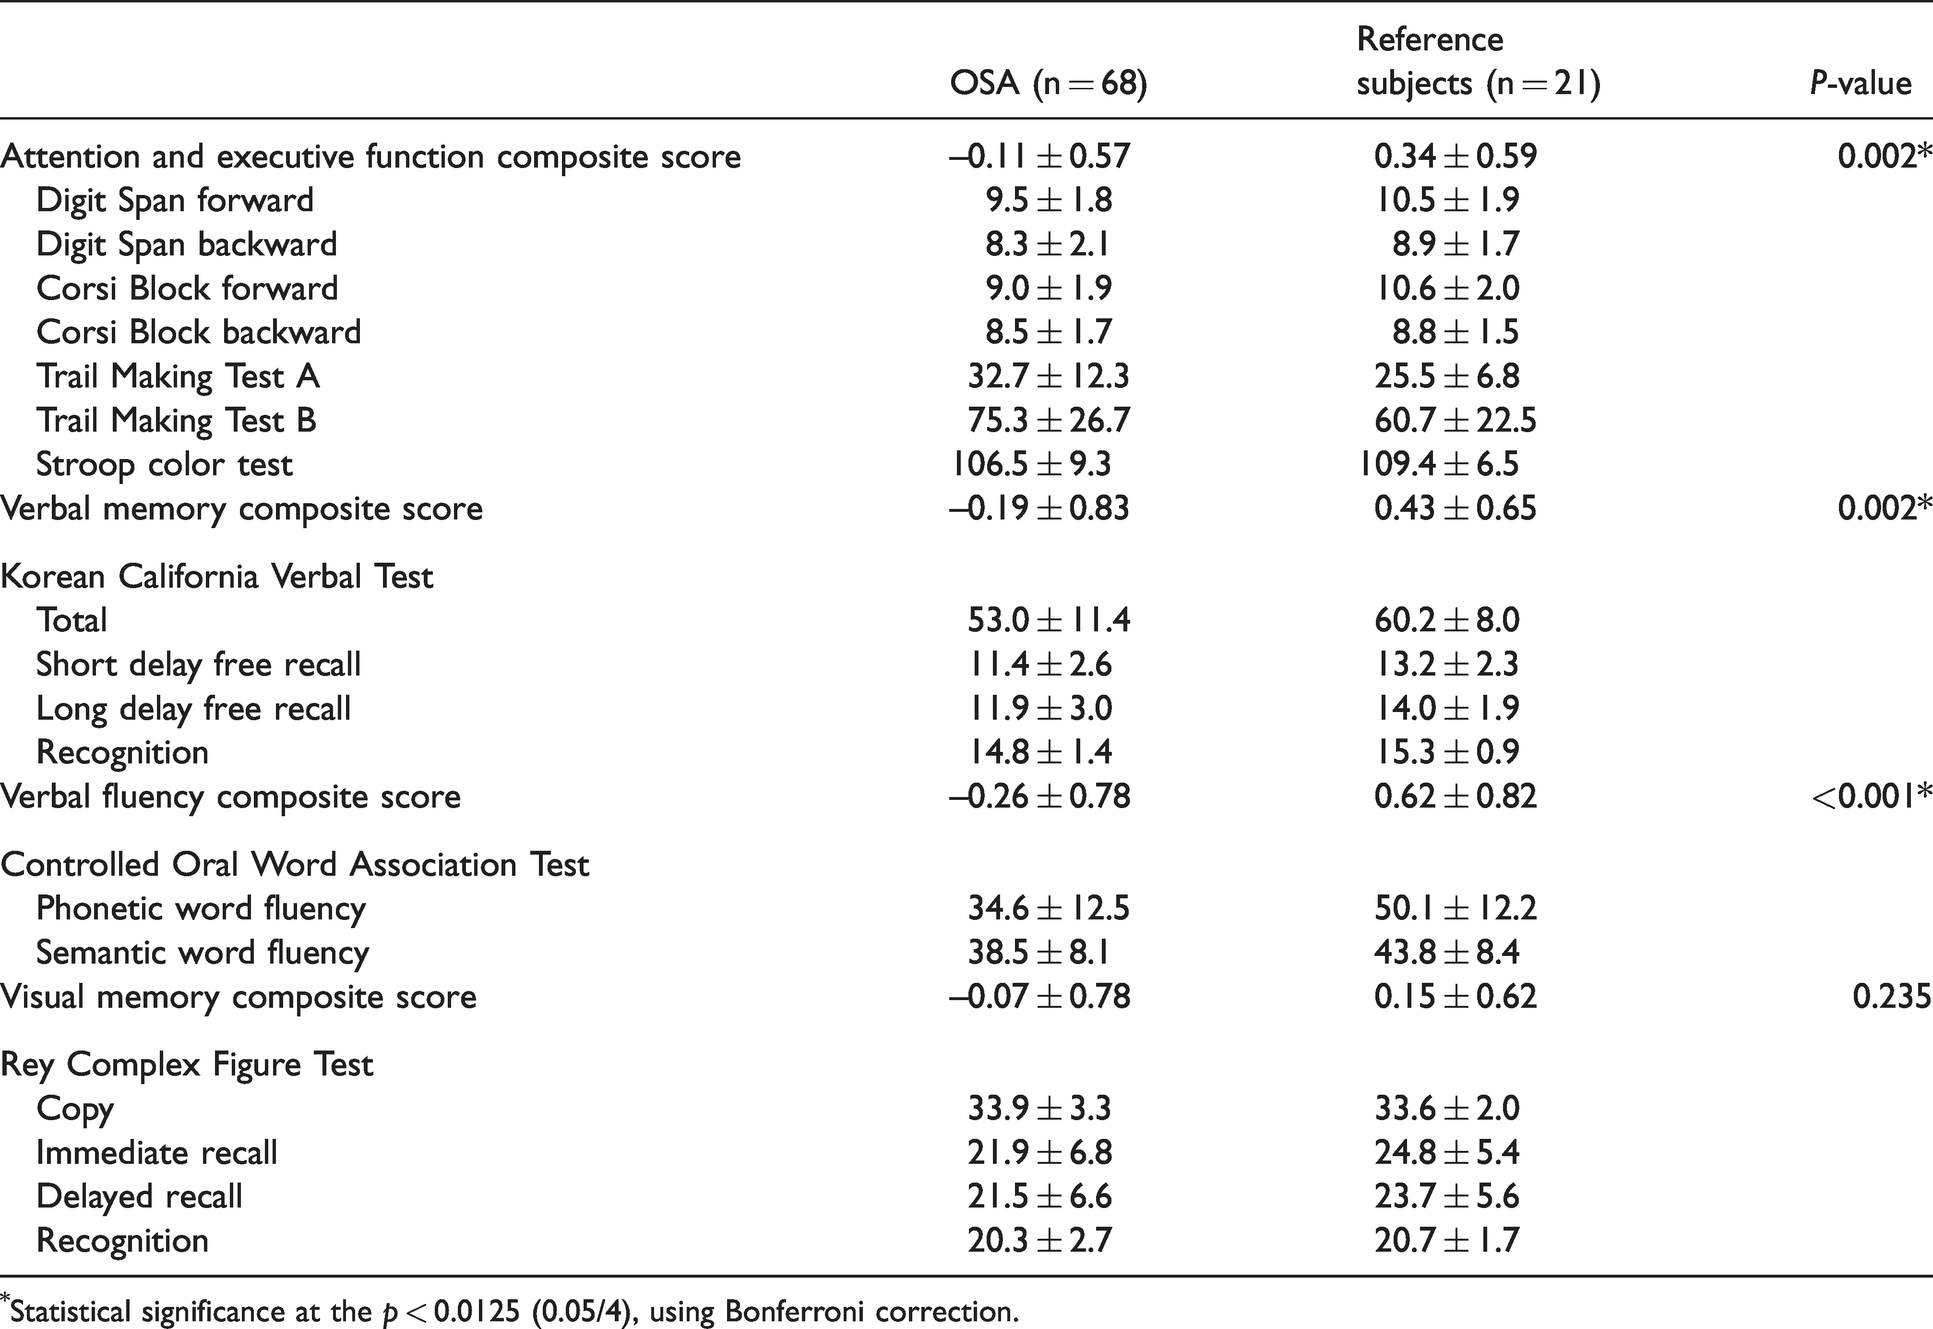
*Statistical significance at the p < 0.0125 (0.05/4), using Bonferroni correction.
CBF and CBV in OSA patients relative to reference subjects (Figure 1)
We found lower global CBF and CBV in OSA patients compared to healthy reference subjects (z-score: −0.8 ± 0.9; t = 2.7; FDR < 0.05). The lower CBF was localized bilaterally in the lateral prefrontal, lateral orbitofrontal, pre/post central, middle temporal, supramarginal, superior parietal, isthmus cingulate, lingual and lateral occipital cortices, and unilaterally in the right medial prefrontal (including anterior/posterior cingulate), right superior/inferior temporal and left insular cortices (t > 2.7; FDR < 0.05, Figure 1, Table 3). Lower CBF was also found in deep gray matter structures including thalamus, hippocampus and caudate nucleus as well as in the brainstem and cerebellum including peduncle, cerebellar white matter, dentate nucleus, and cerebellar cortices (corresponding mainly to Crus I-II and lobule VII). We did not find significant regional hyperperfusion in the OSA group compared to reference subjects (Supplementary Figure 2). Lower CBV in OSA compared to reference subjects was mapped in the regions largely overlapping with those presenting lower CBF (Figure 2). Thus, we reported the subsequent results based on CBF differences between OSA patients and reference subjects. In comparison between moderate (n = 14) and severe OSA patients (n = 54) and among three groups (two OSA groups and healthy group), we did not find any difference in the pattern of CBF or CBV. This finding may be inconclusive because of the lack of statistical power due to the small sample size of the moderate OSA group.
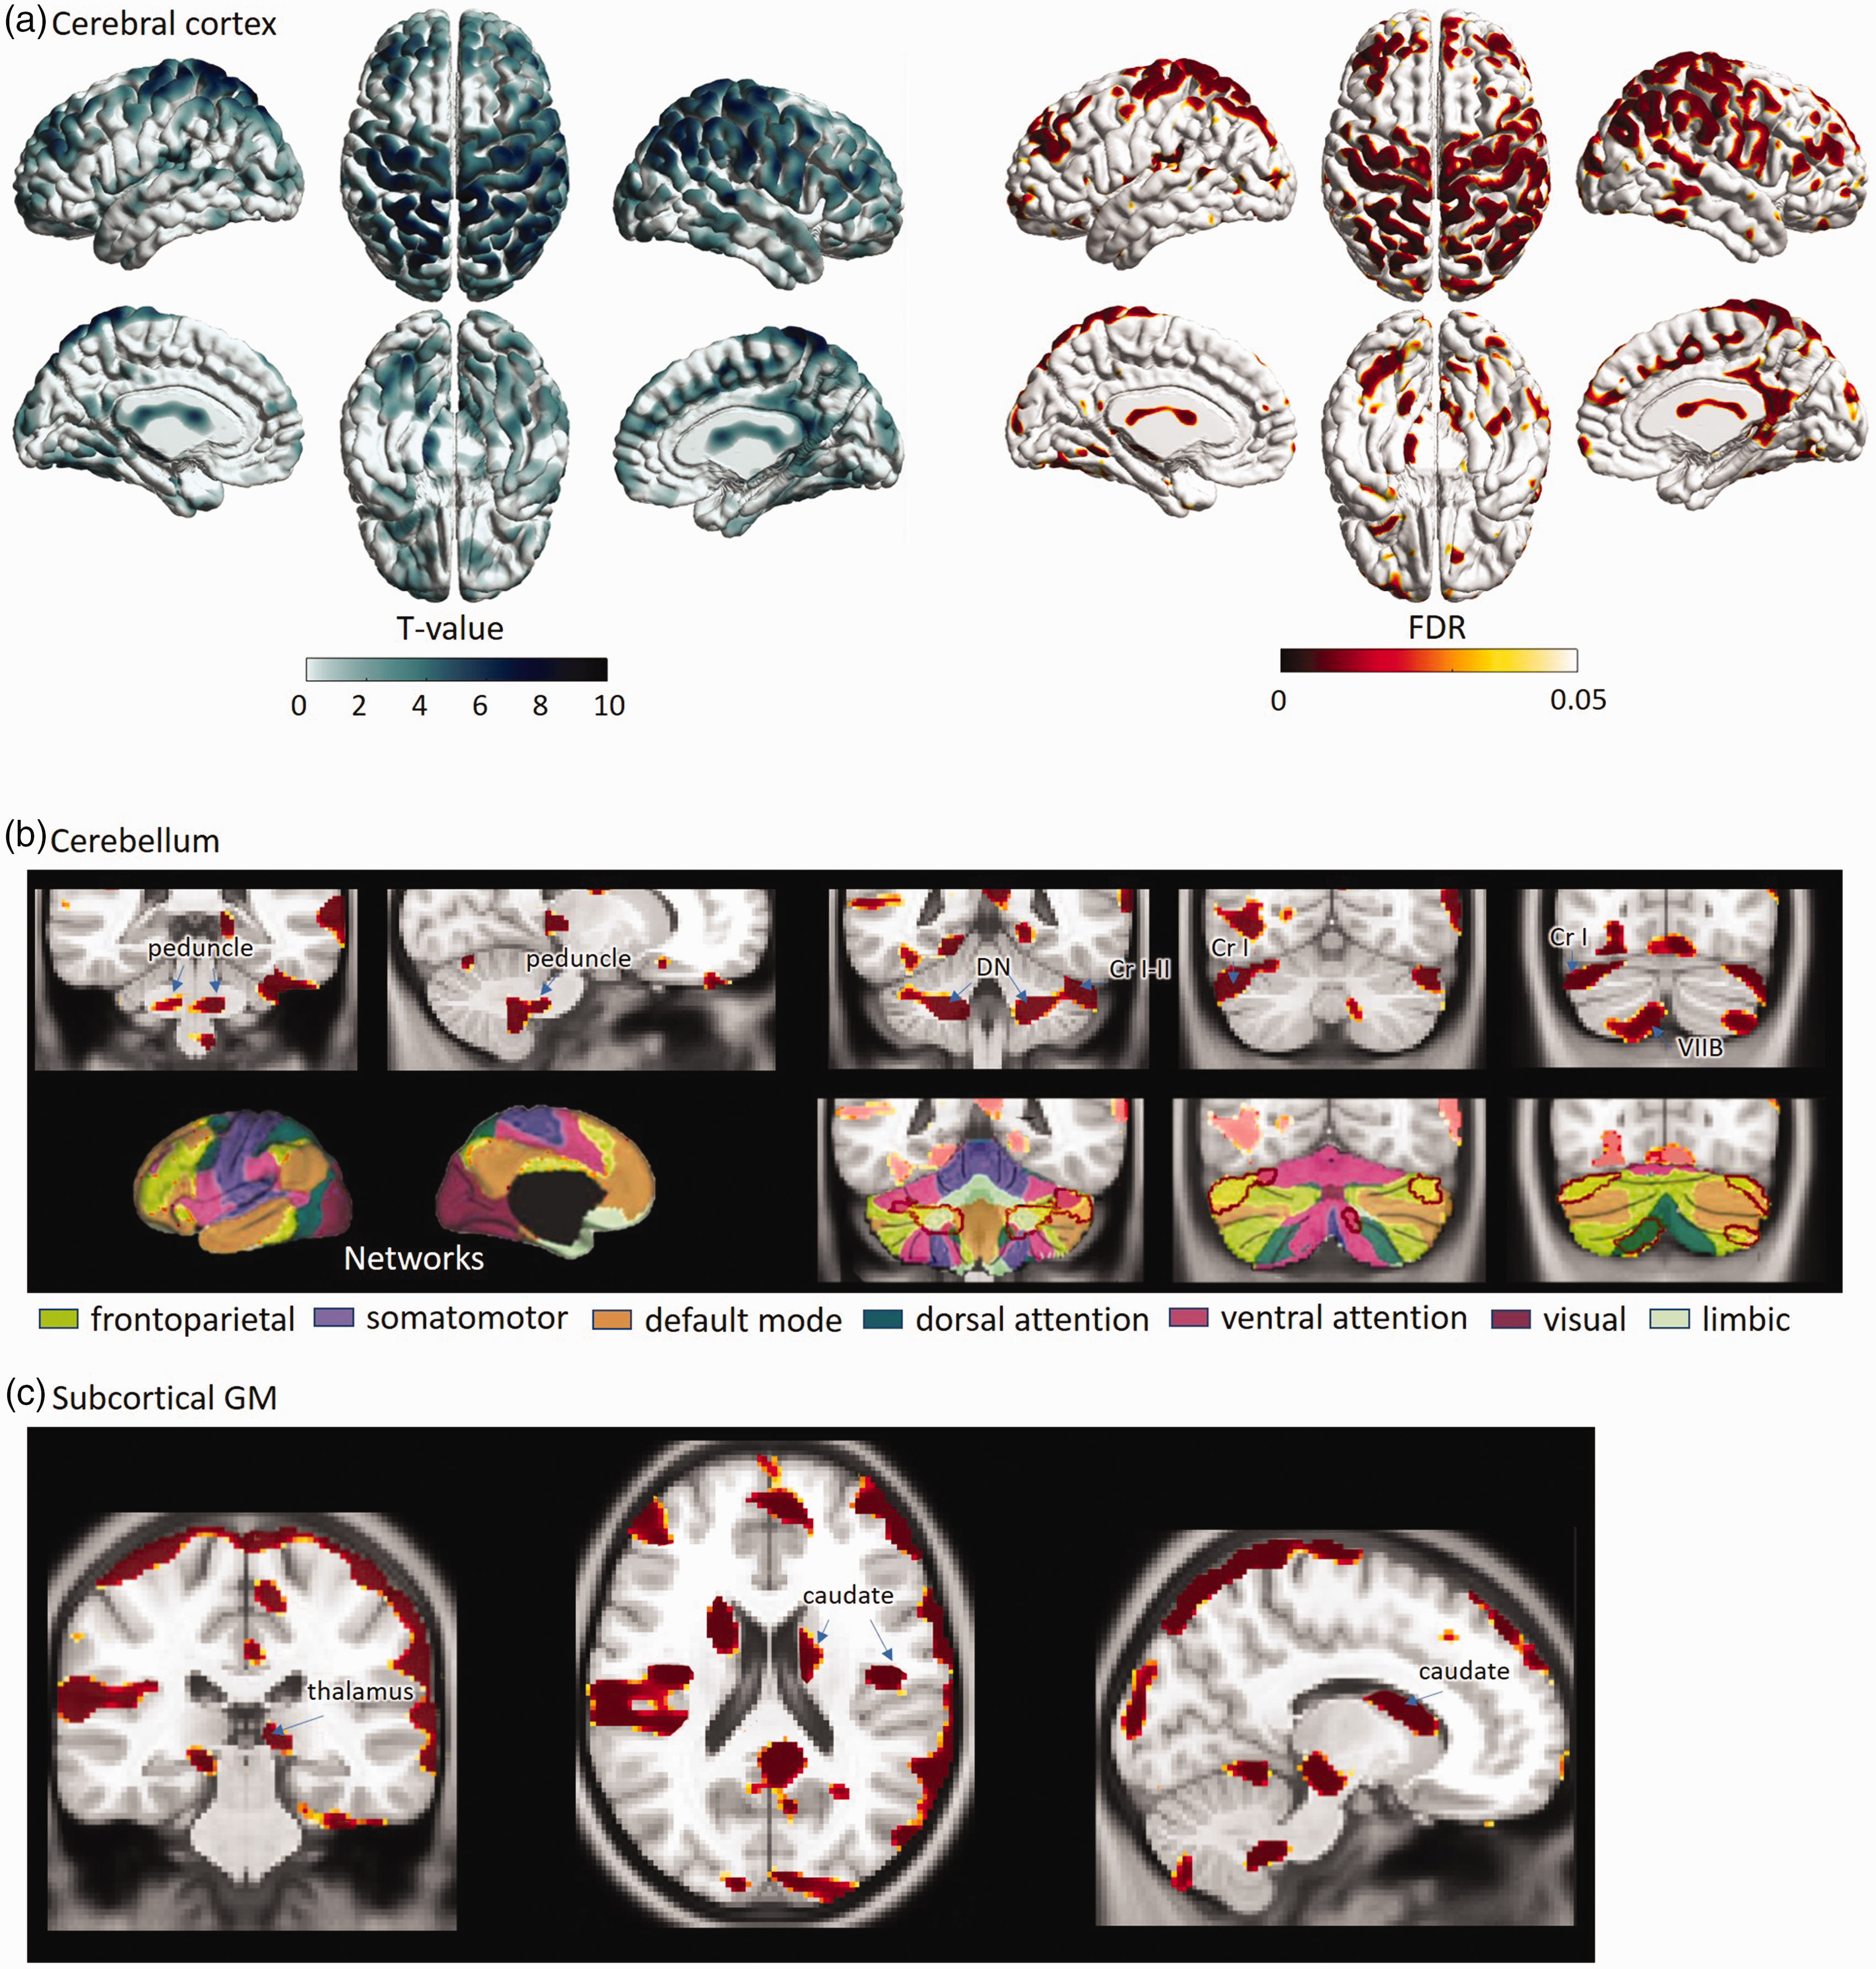
Results of statistical analysis of regional CBF. (a) Average group differences are shown in t-statistic (left) and the corresponding p-value maps (right). Lower in CBF in OSA patients compared to healthy subjects is depicted in yellow-red clusters on the cortical surface. (b) CBF was reduced also in the brain stem and cerebellar cortices which were connected to frontoparietal areas via functional networks. In the lower panel of Figure 1(b), seven colors represents distribution of functional networks in the cerebral and cerebellar cortices. 54 (c) lower CBF was also found in deep GM structures including thalamus, hippocampus and caudate nucleus.
Significant cerebral cortical CBF reductions in untreated OSA compared to healthy reference subjects.
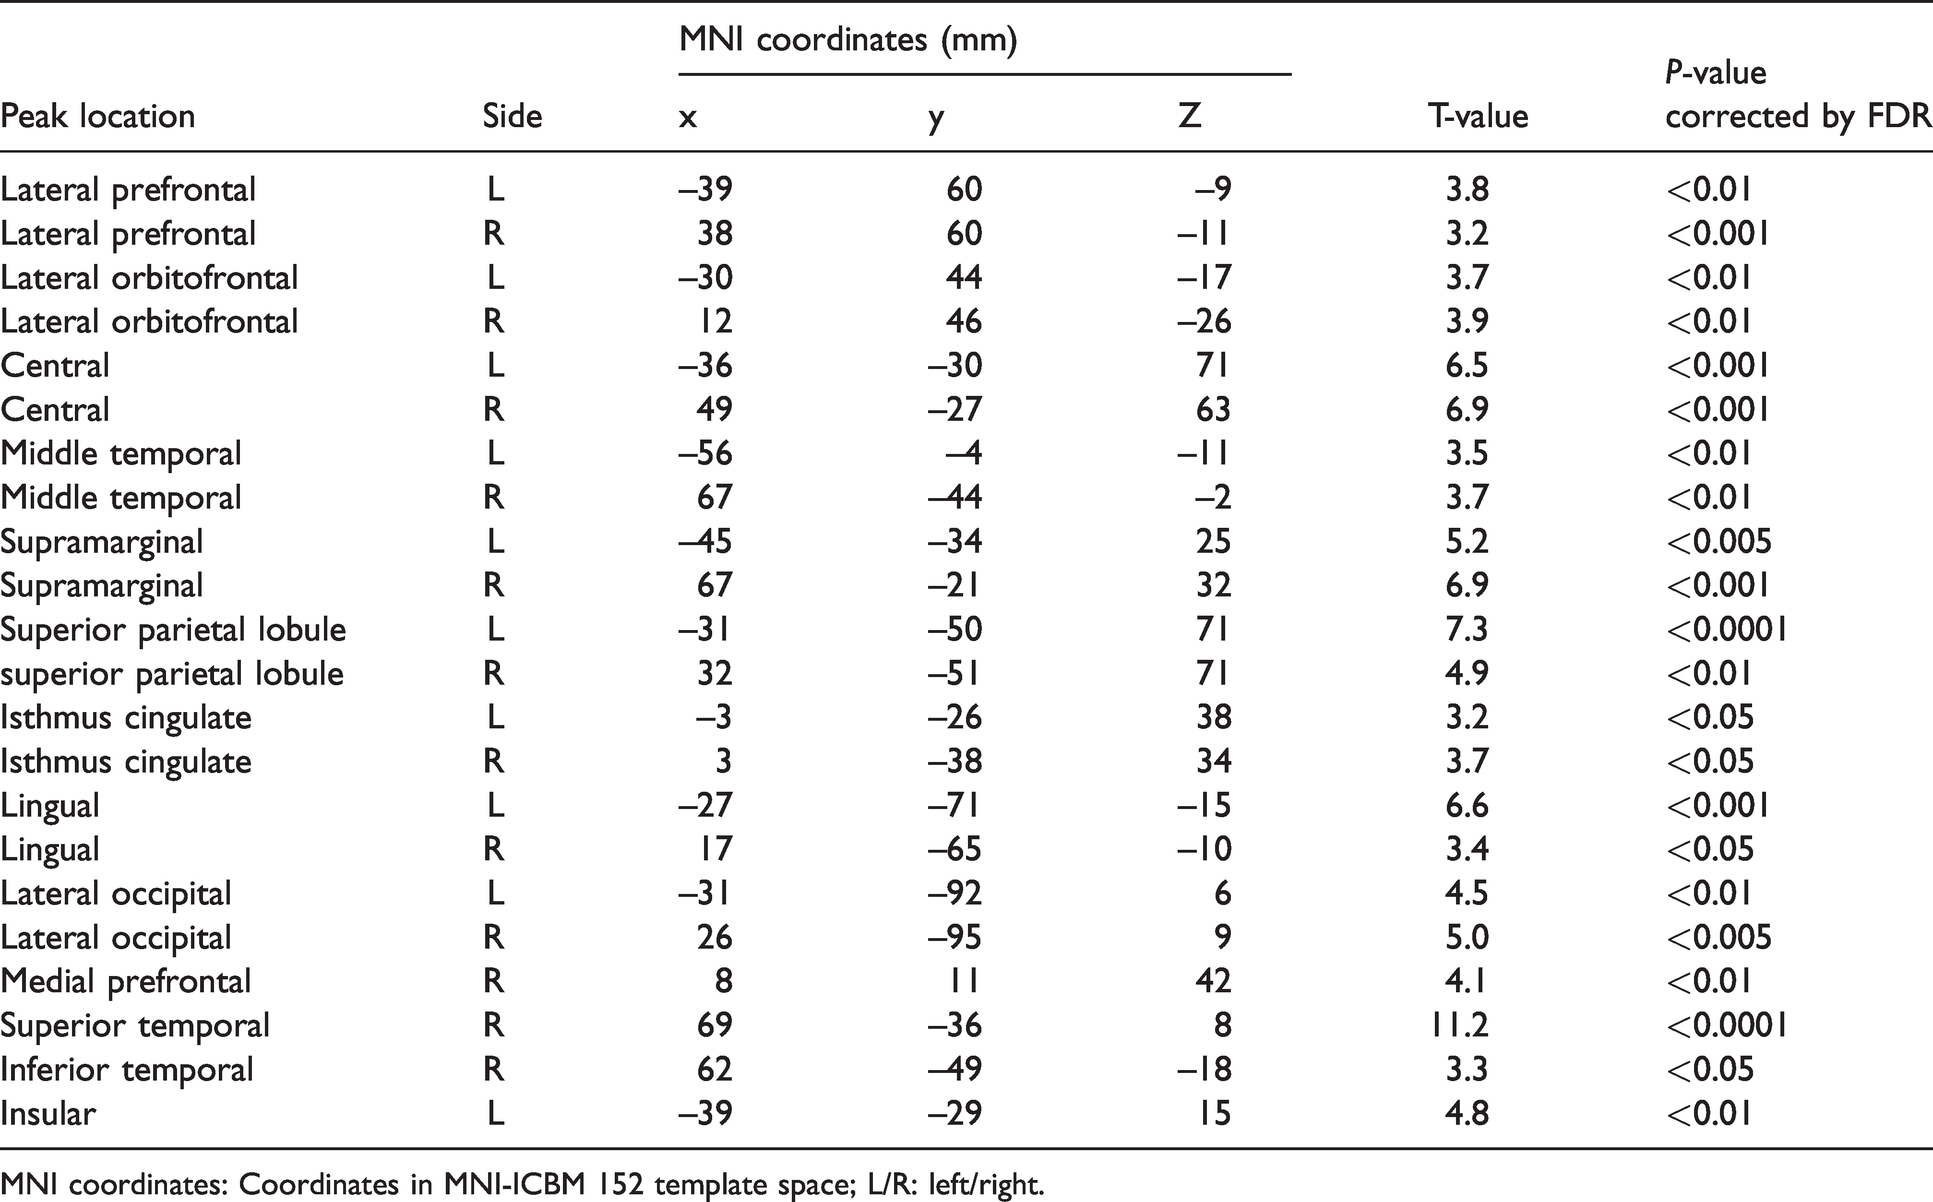
MNI coordinates: Coordinates in MNI-ICBM 152 template space; L/R: left/right.
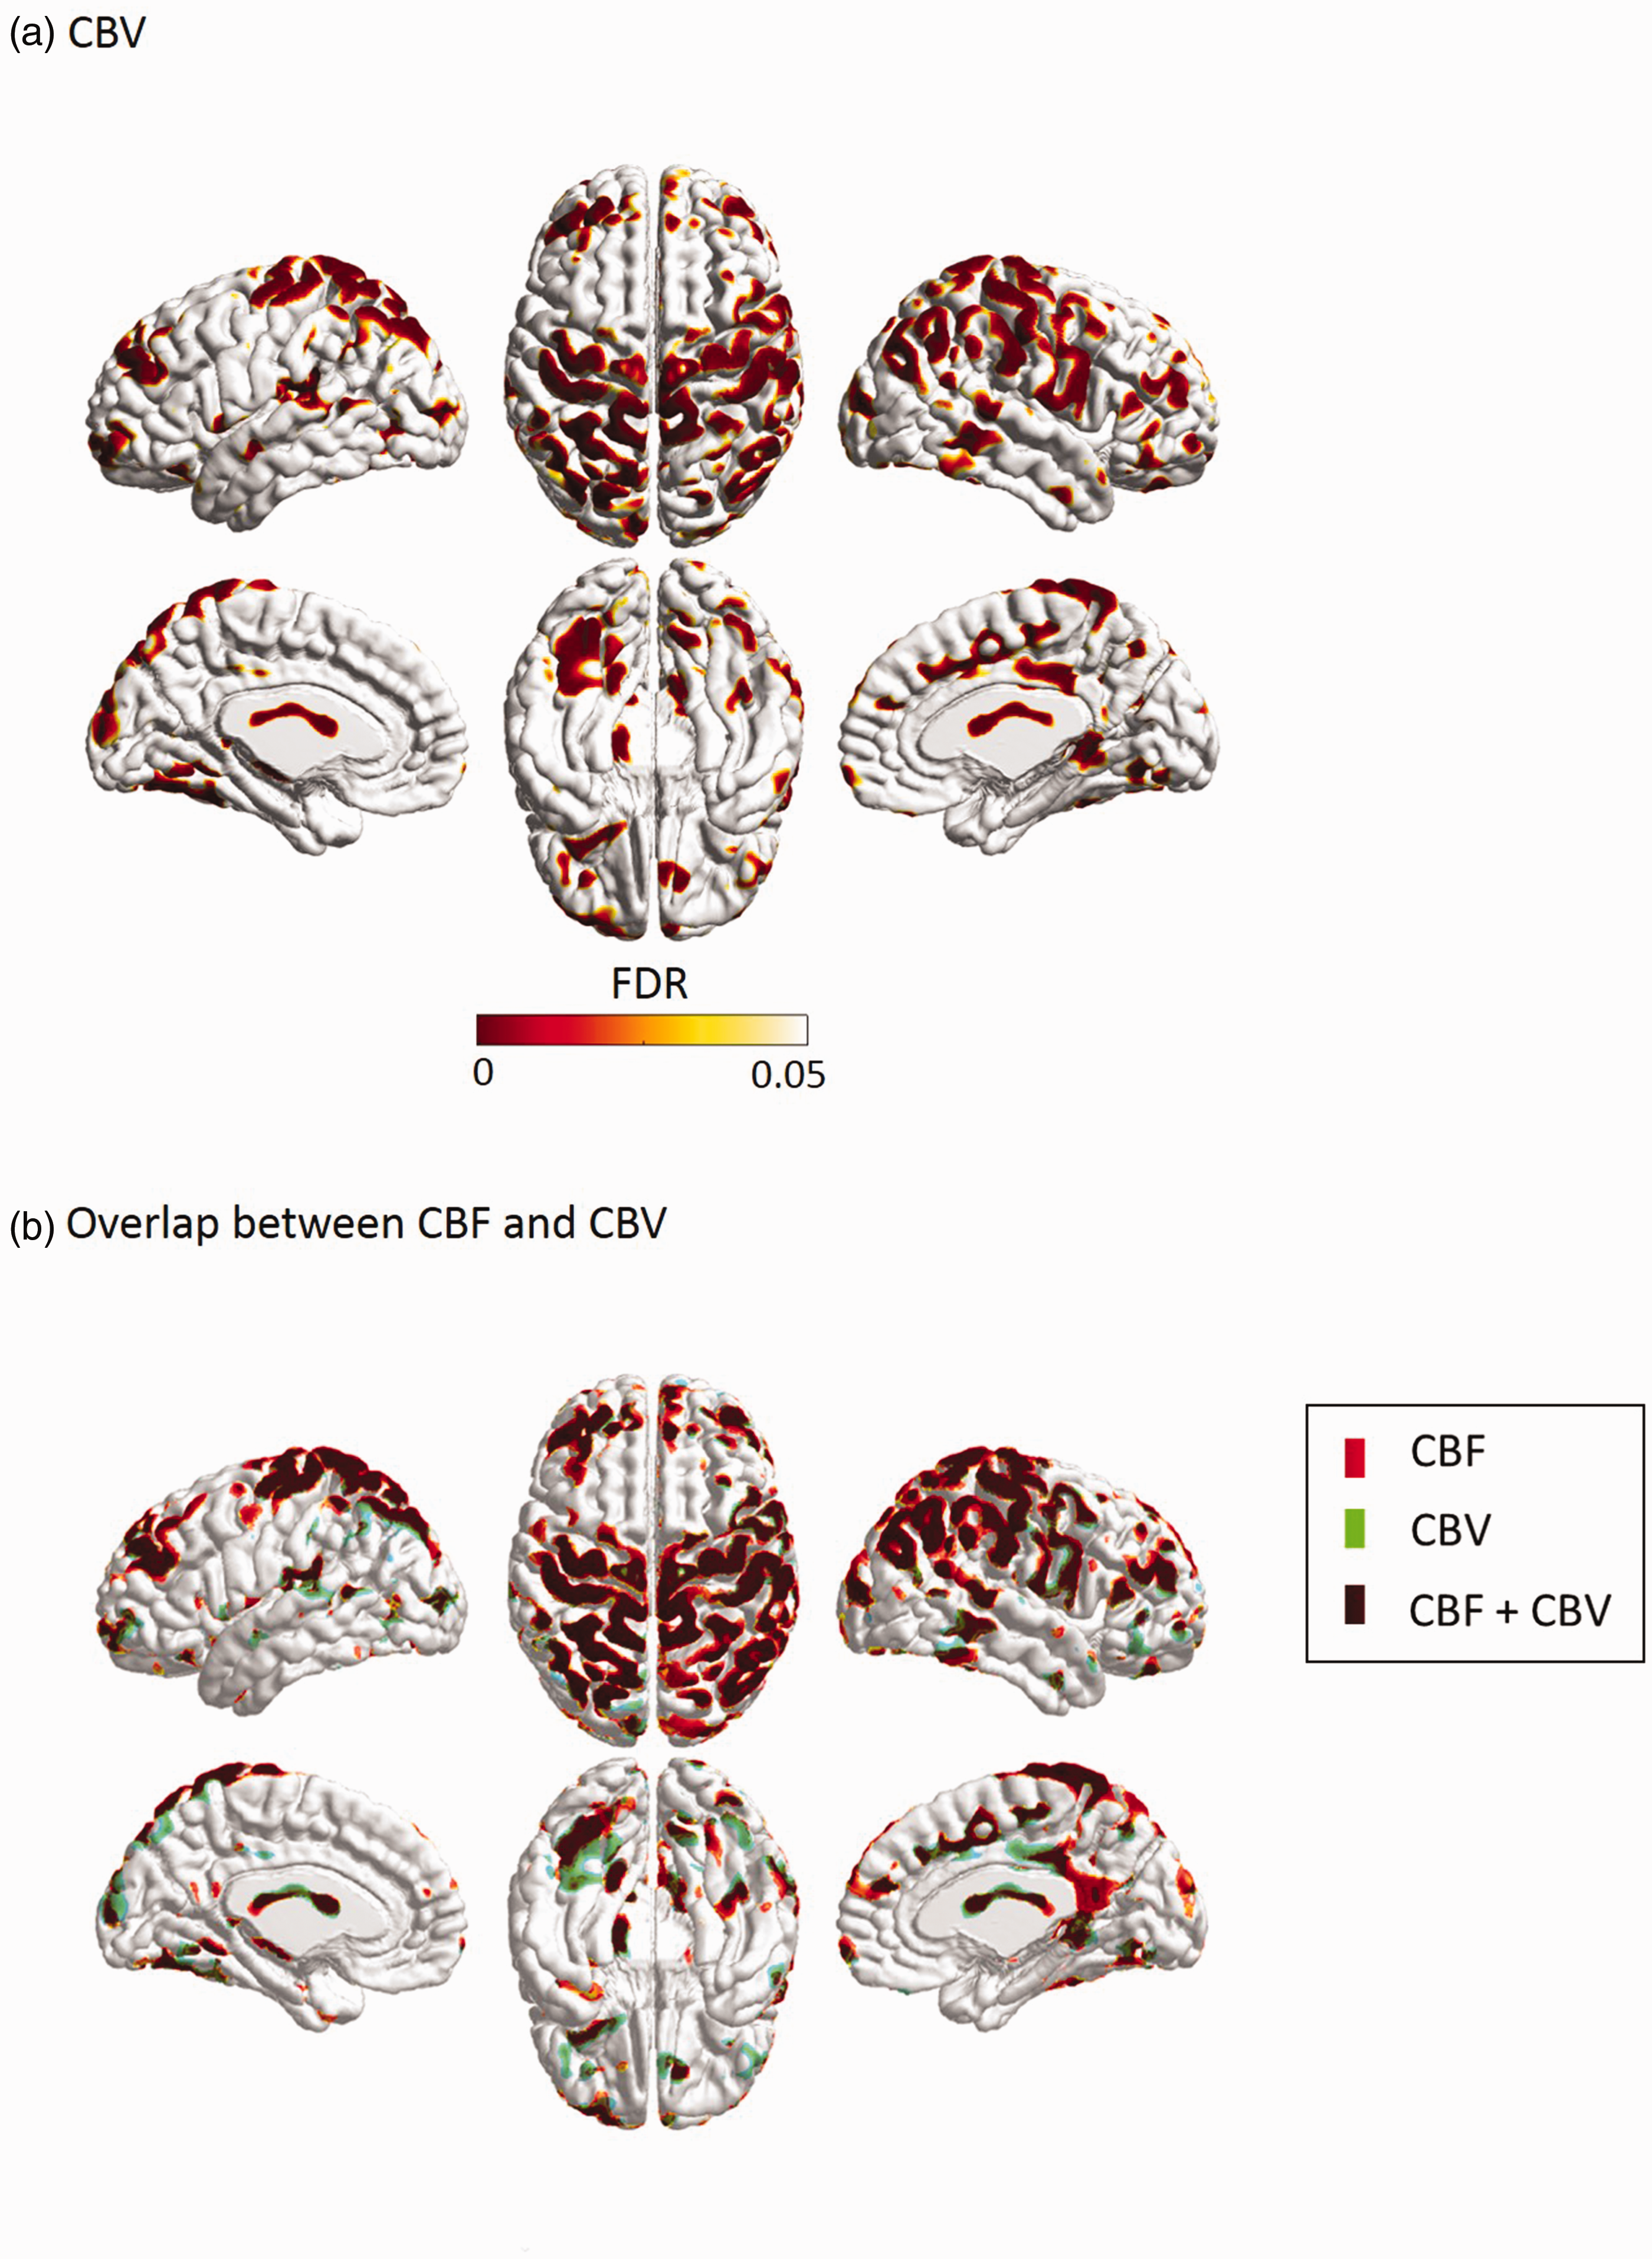
Reduced CBV in OSA patients compared to healthy reference subjects (A) and the map showing the regions with overlap between CBF and CBV (B).
Effects of sleep fragmentation and oxygen desaturation on brain blood perfusion (Figure 3)
We found negative correlations between global CBF and arousal index, AHI or oxygen desaturation index per hour in the pooled data, including reference subjects and those with OSA (r=−0.52; t > 5.6; p < 0.0005). These correlations were not significant in either the reference subjects or OSA patients when separately analyzed (p > 0.1).
In the regional analysis based on the CBF and CBV values sampled at each of the 81,924 vertices on the mid-cortical surface, we found that the negative correlation of CBF with arousal index was mapped in large areas corresponding to bilateral orbitofrontal cortices and in focal regions involved in right inferior frontal gyrus, the junction between right supramarginal and right postcentral cortex, inferior parietal cortex and lateral occipital cortex (t > 3.0; FDR < 0.05; Figure 3(a)). On the other hand, the negative correlation of CBF with AHI was mapped in locations including large clusters in bilaterally pre/post central, and superior/inferior parietal cortices, as well as small clusters in bilateral superior/middle frontal, right supramarginal, right superior/middle temporal and bilateral posterior parahippocampal cortices (Figure 3(b)), which did not overlap with the areas of the CBF changes in relation to arousal index (see Figure 3(a)). We also found a negative correlation between CBF and AHI in the caudate nucleus and the cerebellar dentate nucleus (t > 3.0; FDR < 0.05; Figure 3(c)). The regional pattern of negative correlations between CBF and oxygen desaturation index per hour showed a large overlap with the pattern in relation to AHI (Supplementary Figure 3).
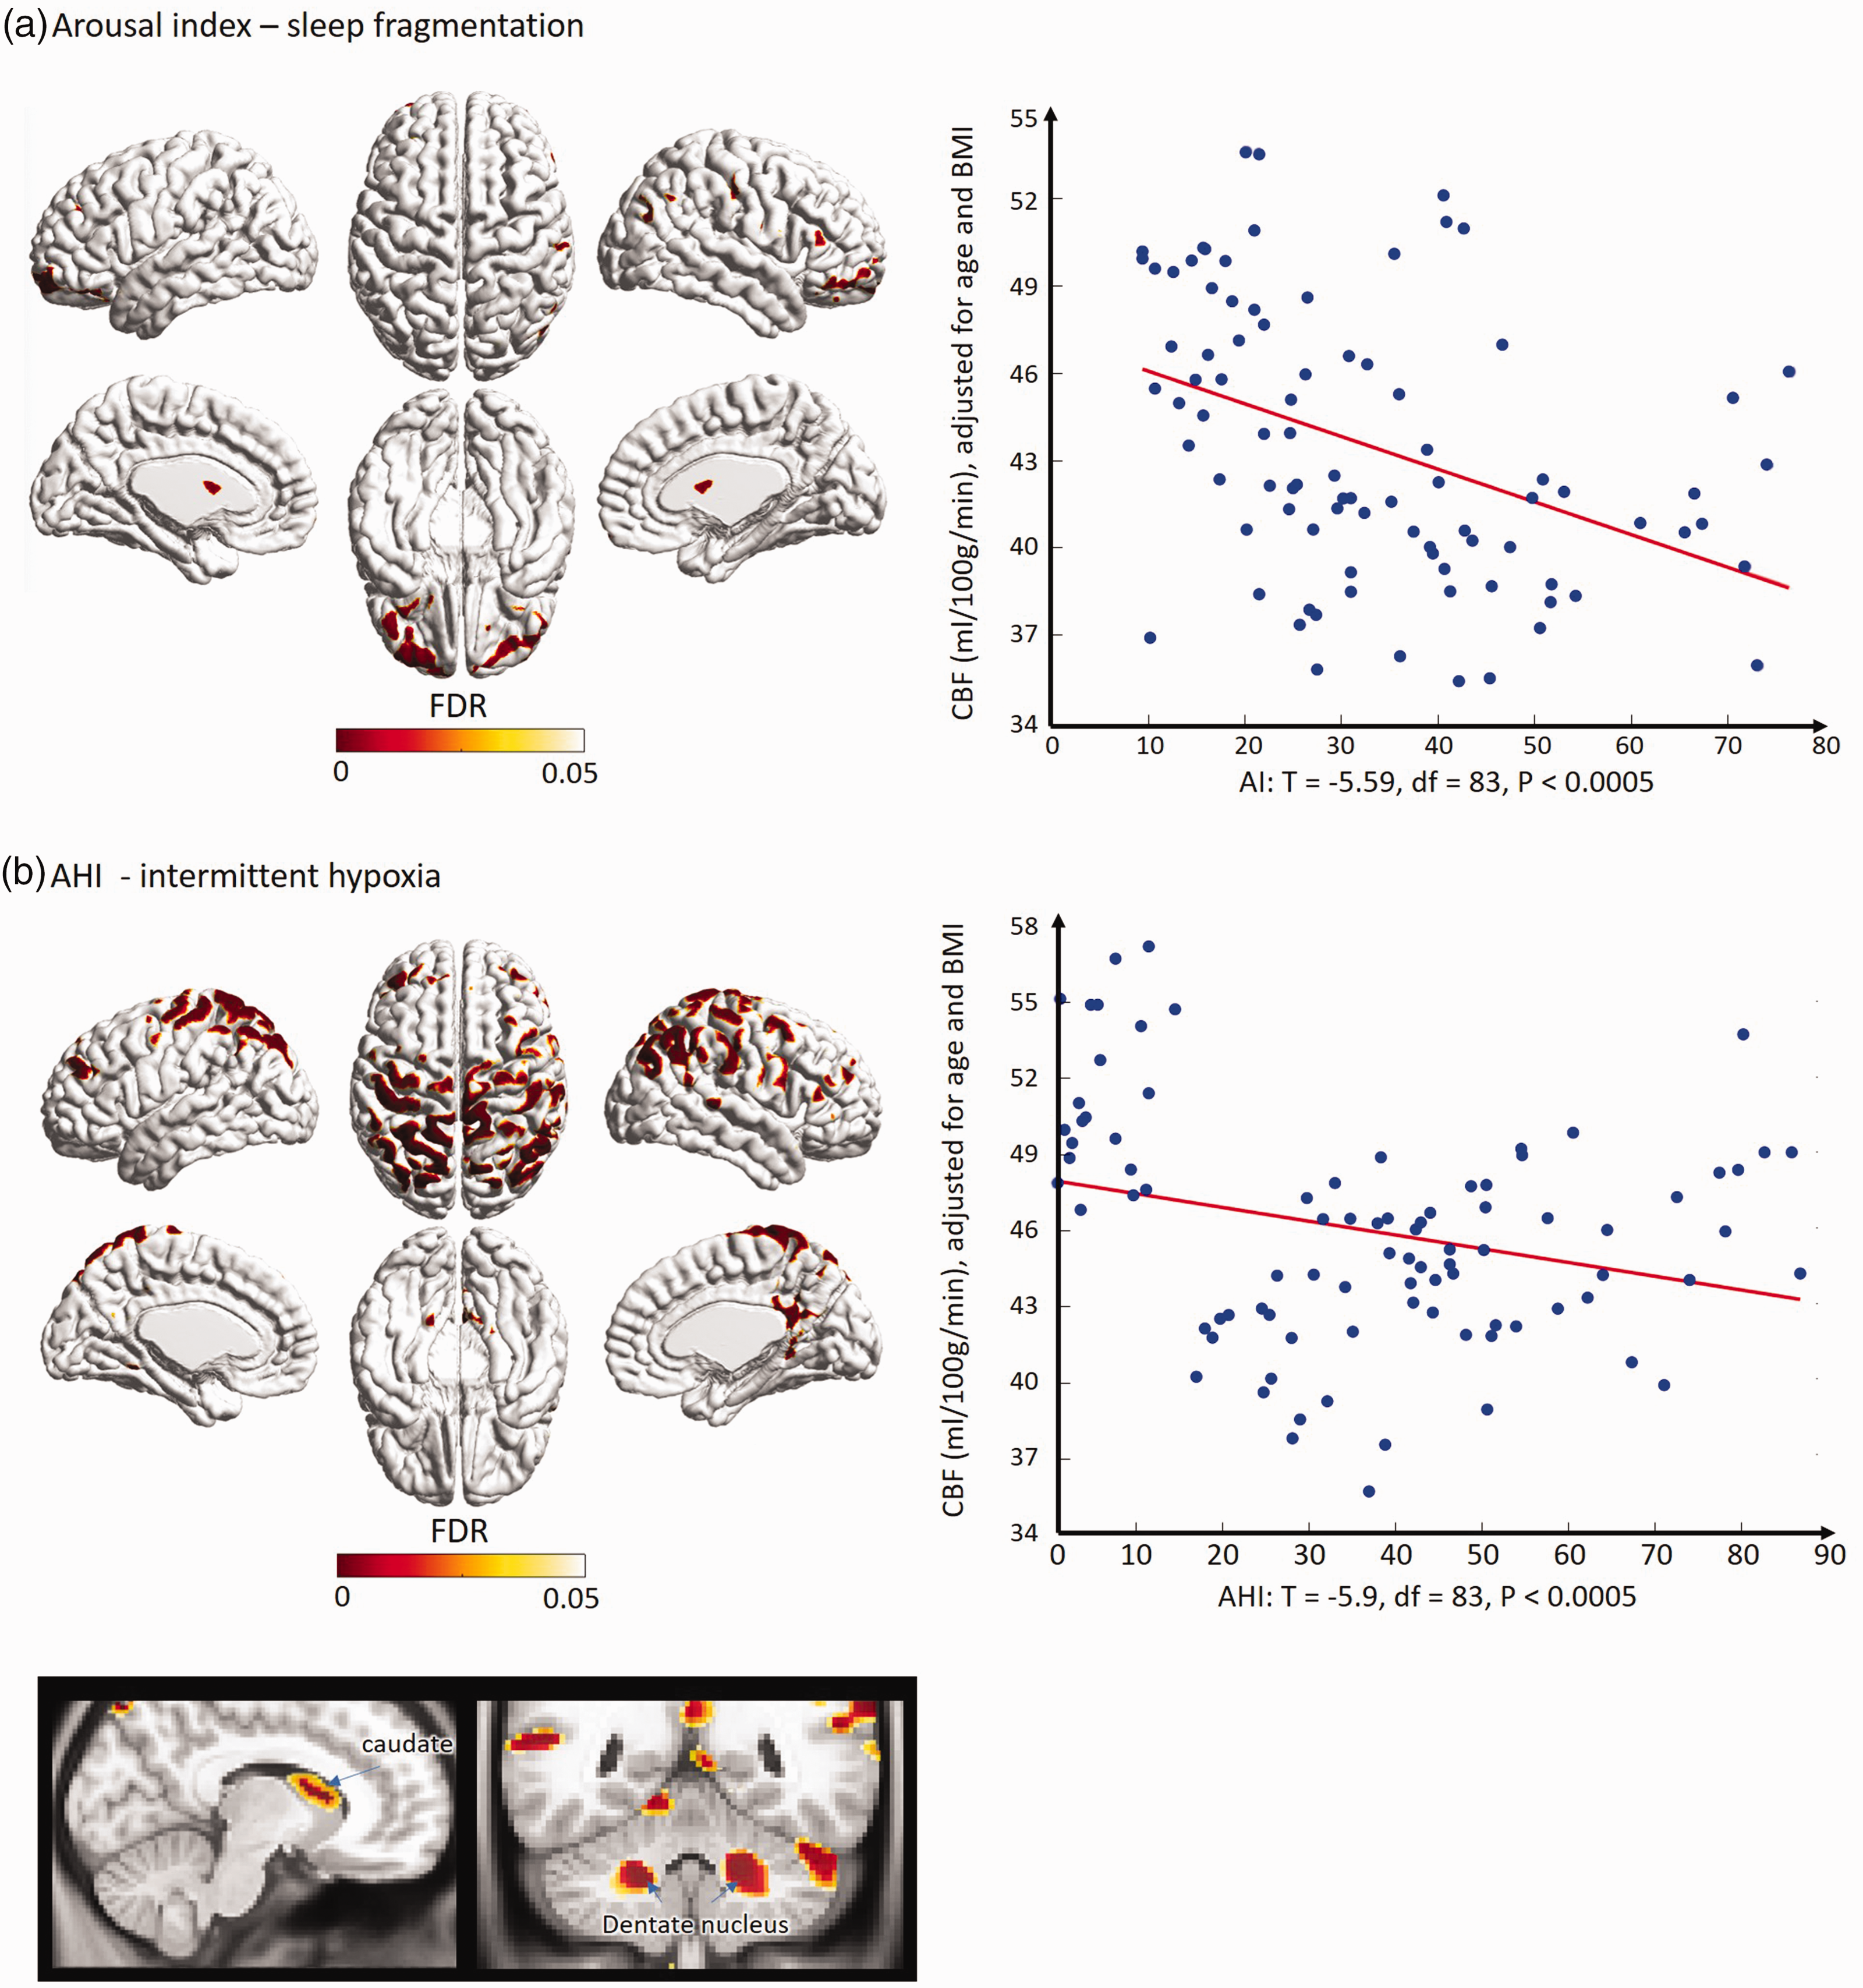
correlation of CBF with sleep parameters in the pooled group of healthy referencesubjects and OSA patients. The regions displaying the low perfusion in relation to sleep fragmentation (A) are quite different from those exhibiting the low perfusion in relation to degree of intermittent hypoxia during sleep (B).
Relationships between cognitive impairment and cerebral perfusion (Figure 4)
A significant interaction between groups (reference subjects vs. OSA) and attention/executive function was found (F = 44.5, df1 = 1, df2 = 81, p < 0.0005), whereas a positive correlation between regional CBF and attention/executive function was observed in the reference subjects (r = 0.47; p = 0.03) but not in OSA patients. The locations with these interactions corresponded to lateral prefrontal, anterior cingulate, precuneus, superior/inferior parietal and lateral occipital cortices, most of which have been involved in the attention network and default mode network seen in functional MRI studies.46–48 The hemispherical pattern of significant clusters was symmetric (Figure 4).
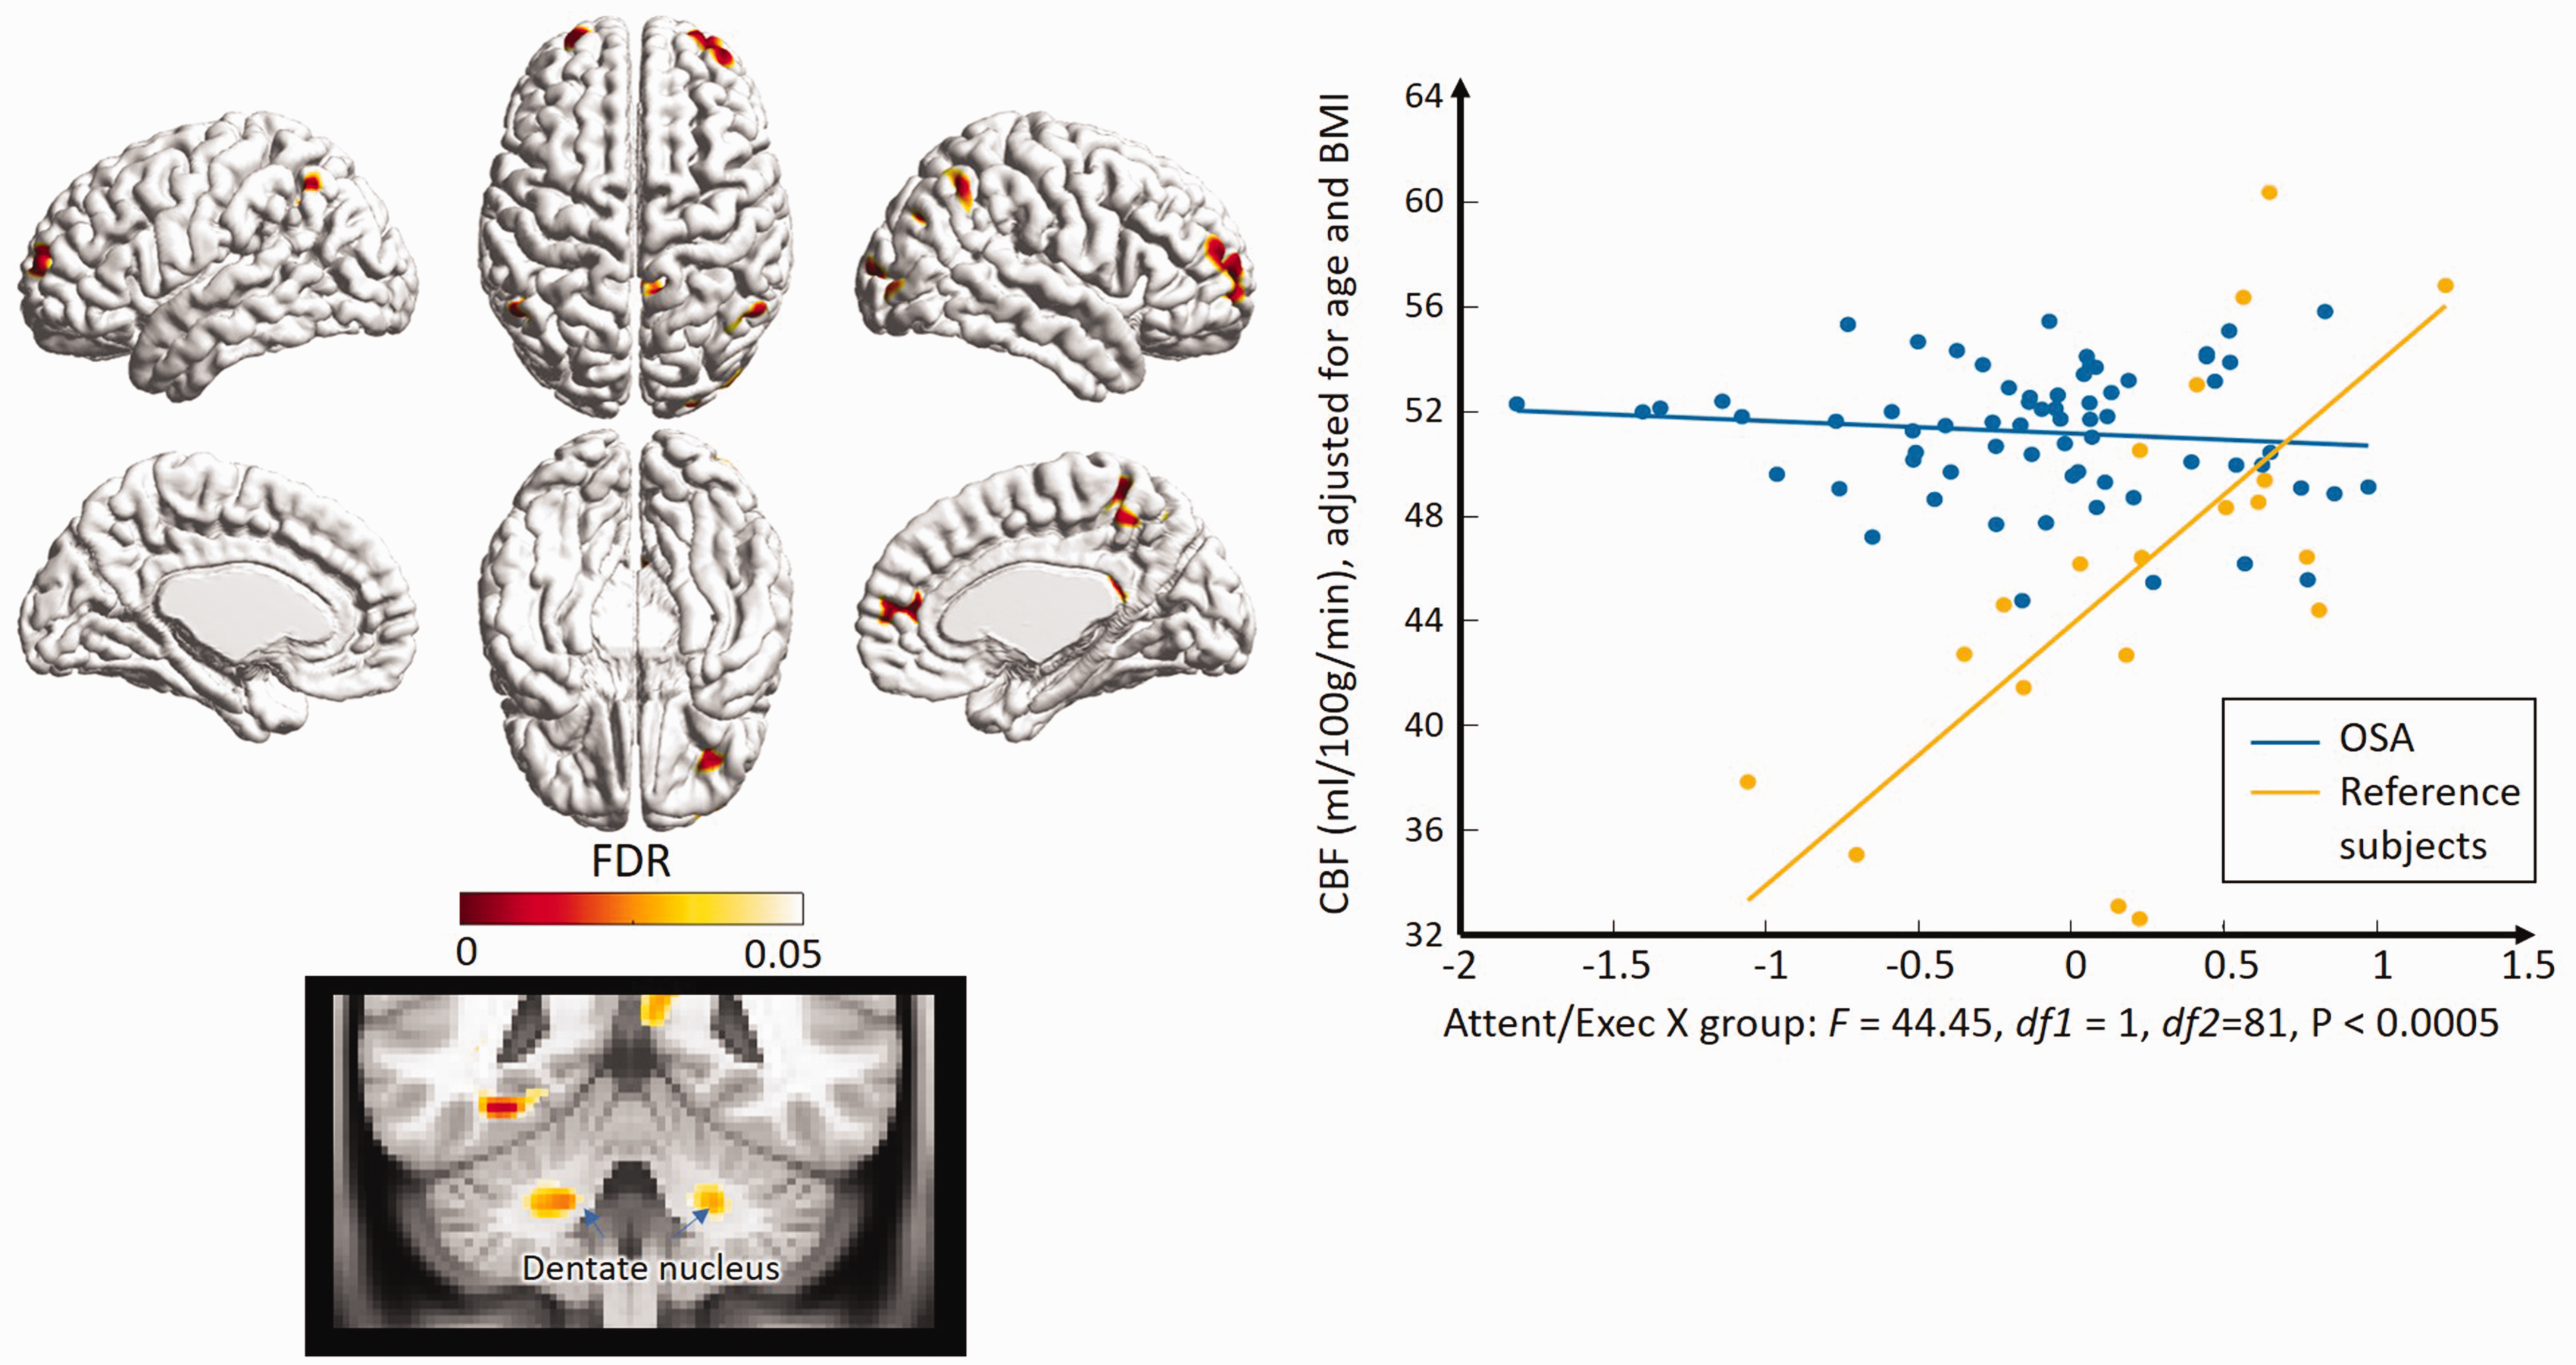
Correlation of CBF with attention and executive function in OSA patients and healthy reference subjects. Yellow-red clusters represents significant interactions between OSA patients and healthy reference subjects (left). Significant positive correlation between CBF and attention/executive function was found in healthy reference subjects whereas no such association was observed in OSA patients (right).
On the other hand, there was no interaction between group and verbal fluency and verbal memory. Lower performance in these functions was associated with lower regional CBF (r<-0.55; t > 6.1; FDR < 0.05;) in the pooled samples of reference subjects and patients with OSA. The patterns of lower perfusion in OSA patients compared to reference subjects in relation to verbal fluency and verbal memory are shown in Supplementary Figure 4.
Discussion
Our analysis of DSC-MRI data revealed novel patterns of altered cerebral perfusion in relation to OSA and OSA-induced oxygen desaturation and sleep fragmentation and impaired cognitive function. The relatively large numbers of OSA patients and healthy reference subjects are another strength of our study.
Widespread lower CBF and CBV in OSA patients
The observed regional decreases in CBF were mainly involved in the dorsolateral parietal cortex and lateral prefrontal cortex. The lateral prefrontal cortex is well known as one of the main loci involved in executive function, 49 and several studies have found hypoperfusion in this region in individuals with OSA, and it was partially improved after positive airway pressure treatment.14,17 On the other hand, hypoperfusion in the parietal lobe has been seen less often in previous SPECT and perfusion MRI studies; only one SPECT study found hypoperfusion in the left superior/inferior parietal lobules, bilateral postcentral gyri, and right cuneus, in elderly patients with severe OSA. 13 Interestingly, the parietal cortical regions exhibiting hypoperfusion seen in the present study are part of the default mode network (DMN) and frontoparietal network (central executive network, CEN). These networks have been shown to be impaired in previous functional MRI studies of OSA.50–53 Therefore, it is plausible that the disrupted network connectivity and decreased neuronal activity in these parietal areas is related to the hypoperfusion revealed in the current study. In addition, cerebellar cortical areas which demonstrated hypoperfusion in this study were seen to connect with cerebral cortical areas of the frontoparietal cognitive network (orange in Figure 1(b)), the default mode network (red) and the association network (green), according to a previous functional MRI study.54,55 Given that other hypoperfused brain areas found in the current study, including the lateral prefrontal cortex, insular cortex, and posterior cingulate cortex, are also parts of the DMN and CEN, it is tempting to speculate a possible link between the hypoperfusion and the connectivity alterations that occur in OSA.
Distinctive effects of sleep fragmentation and oxygen desaturation on cerebral perfusion
This is the first study that showed two separate patterns of lower regional CBF that were distinctively associated with OSA-induced hypoxia and sleep fragmentation. The previously observed association of hypoperfusion with AHI was localized mainly in the pericentral gyrus, parietal cortices and dorsolateral frontal cortex, which supports the present finding.12,13 One ASL-MRI study reported that CBFs in the right parahippocampal gyrus positively correlated with arousal index. 18 In another ASL-MRI study, AHI and ODI correlated with CBF in widespread regions whereas arousal index correlated with CBF specifically in the right putamen/insula, right cerebellum, right superior temporal gyrus, and right fusiform gyrus. 17 Unlike our study, none of these studies have demonstrated the two patterns of hypoperfusion distinctively correlating with oxygen desaturation and sleep fragmentation. This is presumably due to the different clinical and demographic characteristics of each study sample, such as different distribution of age, sex or BMI, as well as the presence of cardiometabolic risks.
The underlying pathomechanisms involved in the different patterns of lower perfusion in relation to hypoxia and sleep fragmentation remain unclear. However, it could be possible that vulnerable areas are different to separated mechanisms of altered cerebral perfusion caused by hypoxia and sleep fragmentation, though they are not fully independent of each other. Intermittent hypoxia during respiratory events can trigger oxidative stress, inflammation, endothelial dysfunction and atherosclerosis, leading to hypoperfusion even during wakefulness.56,57 On the other hand, fragmented sleep is a potent augmenter to high sympathetic tone in OSA during sleep and wakefulness, 58 which creates a vasoconstrictive effect and impaired cerebral perfusion.59,60
Relationship between cognitive impairment and cerebral perfusion in OSA
In the present study, OSA patients showed lower attention and executive function as well as verbal memory and verbal fluency compared to reference subjects. Altered cerebral perfusion is one of the relevant pathophysiologic mechanisms in impaired cognitive function in various brain disorders. In our study, hypoperfusion was observed in multiple cerebral and cerebellar cortices involved in the DMN and CEN, which might further lead to decreased connectivity of these networks and consequent impaired performance in cognitive tasks. Moreover, deep GM structures including the thalamus, hippocampus, and caudate nucleus were also found to be hypoperfusive in the current study. Structural and functional changes in these regions are strongly associated with impaired attention and memory in various neuropsychiatric conditions.61–65
In the analysis of interactions between regional cerebral perfusion and neuropsychiatric parameters, we also found that a positive correlation between regional CBF and attention/executive function was established in healthy reference subjects, but this normal association was not observed in OSA patients. The impairment of the brain perfusion-cognition association in OSA mainly involved the clusters located in the lateral prefrontal, anterior cingulate, precuneus, superior/inferior parietal and lateral occipital cortices, as well as the dentate nucleus, most of which are parts of the attention network and DMN that have been evidenced in a number of fMRI studies.46–48 This finding suggests that blood perfusion abnormalities in some of the nodal regions of such functional networks, which we observed in the OSA group, may play a role in the dysfunction of these networks, eventually resulting in the loss of the brain perfusion-cognition association established in healthy sleepers. Therefore, the hypoperfusion found in such nodal areas of the attention and DMN networks could be a novel neuroimaging marker that addresses one of the mechanisms underlying the cognitive decline in OSA.
In other cognitive functional domains, outside of attention/executive function, we did not find such impairments of the brain perfusion-cognition association established in healthy subjects. More precisely, our analysis revealed that lower performance in verbal fluency and verbal memory was associated with lower regional CBF (Supplementary Figure 3) in the pooled samples of reference subjects and OSA patients, suggesting a different mechanism which may not be specific to the OSA-induced hypoperfusion. The significant clusters in relation to verbal fluency included the left supramarginal cortex, which is considered an important area of word processing. 66 The perfusion changes relating to verbal memory were located in the left lingual gyrus and the right superior parietal cortex. The left lingual gyrus is the main component of the ventral visual system, playing an important role in the recognition of visual language information as well as integration with relevant context and encoding of new memory traces.67–69 The superior parietal cortex is well known for being related to working memory through the association with the functional network in various fMRI studies.
OSA patients in our study were mostly middle aged (mean age 45.4 years, age range 23-65 years), and were younger than13,16 or similar to previous reports.17,18 This suggests that impairment of perfusion and degenerative change in the brain may not be only a ‘long-term’ consequence in OSA. Further study with more specified age group is needed to understand the critical ‘time points’ of when OSA induces perfusion changes and cognitive decline.
Limitations
First, the age and BMI of the healthy subjects and the OSA patients in the current study significantly differ, which might affect cerebral perfusion and cognitive performance. Although the statistical methods adopted here took this into account by adjusting the effects of age and BMI, possible residual effects may need further investigation. Another limitation is that our study included only male OSA patients and reference subjects. Therefore, future studies investigating characteristics of cerebral perfusion in various population groups with OSA will be needed. Furthermore, perfusion imaging may be sensitive to cardiometabolic factors, which are common comorbid conditions with OSA. As in the previous perfusion studies of OSA, we excluded those with cerebrovascular diseases or heart diseases, and we did not consider other cardiometabolic factors as covariates.
Conclusion
OSA patients demonstrate cerebral hypoperfusion in vulnerable regions, and the hypoperfusion found in a number of brain areas is associated with the severity of OSA. Hypoxia and sleep fragmentations were independently associated with the distinctive patterns of brain hypoperfusion. The regions with reduced perfusion largely overlapped with key areas of the DMN and the attention network, and hypoperfusion of these areas was associated with impaired cognitive performance in OSA, especially the attention and executive functions. These findings may provide new insights into the pathophysiology of the neurodegeneration and the cognitive deficits in OSA.
Supplemental Material
sj-jpg-1-jcb-10.1177_0271678X211012109 - Supplemental material for Altered regional cerebral blood flow in obstructive sleep apnea is associated with sleep fragmentation and oxygen desaturation
Supplemental material, sj-jpg-1-jcb-10.1177_0271678X211012109 for Altered regional cerebral blood flow in obstructive sleep apnea is associated with sleep fragmentation and oxygen desaturation by Lirong Yan, Hea Ree Park, Eric J. Kezirian, Soonhyun Yook, Jae-Hun Kim, Eun Yeon Joo Hosung Kim in Journal of Cerebral Blood Flow & Metabolism
Supplemental Material
sj-jpg-2-jcb-10.1177_0271678X211012109 - Supplemental material for Altered regional cerebral blood flow in obstructive sleep apnea is associated with sleep fragmentation and oxygen desaturation
Supplemental material, sj-jpg-2-jcb-10.1177_0271678X211012109 for Altered regional cerebral blood flow in obstructive sleep apnea is associated with sleep fragmentation and oxygen desaturation by Lirong Yan, Hea Ree Park, Eric J. Kezirian, Soonhyun Yook, Jae-Hun Kim, Eun Yeon Joo Hosung Kim in Journal of Cerebral Blood Flow & Metabolism
Supplemental Material
sj-jpg-3-jcb-10.1177_0271678X211012109 - Supplemental material for Altered regional cerebral blood flow in obstructive sleep apnea is associated with sleep fragmentation and oxygen desaturation
Supplemental material, sj-jpg-3-jcb-10.1177_0271678X211012109 for Altered regional cerebral blood flow in obstructive sleep apnea is associated with sleep fragmentation and oxygen desaturation by Lirong Yan, Hea Ree Park, Eric J. Kezirian, Soonhyun Yook, Jae-Hun Kim, Eun Yeon Joo Hosung Kim in Journal of Cerebral Blood Flow & Metabolism
Supplemental Material
sj-jpg-4-jcb-10.1177_0271678X211012109 - Supplemental material for Altered regional cerebral blood flow in obstructive sleep apnea is associated with sleep fragmentation and oxygen desaturation
Supplemental material, sj-jpg-4-jcb-10.1177_0271678X211012109 for Altered regional cerebral blood flow in obstructive sleep apnea is associated with sleep fragmentation and oxygen desaturation by Lirong Yan, Hea Ree Park, Eric J. Kezirian, Soonhyun Yook, Jae-Hun Kim, Eun Yeon Joo Hosung Kim in Journal of Cerebral Blood Flow & Metabolism
Footnotes
Funding
The author(s) disclosed receipt of the following financial support for the research, authorship, and/or publication of this article: All authors report no biomedical financial interests or potential conflicts of interest. This study was supported by the National Institutes of Health grants (P41EB015922; U54EB020406; U19AG024904; U01NS086090), BrightFocus Research Grant award (A2019052S) and Samsung Biomedical Research Institute grant (OTC1190671).
Declaration of conflicting interests
The author(s) declared the following potential conflicts of interest with respect to the research, authorship, and/or publication of this article: Dr. Kezirian reports research funding from Inspire Medical Systems; advisory board memberships for Nyxoah, CryOSA, Cognition Life Science, Berendo Scientific; and intellectual property ownership in Berendo Scientific and Magnap.
Authors’ contributions
EY Joo and H Kim designed the study. EY Joo acquired the data and conducted the study. L Yan, HR Park and S Yook processed, analyzed and interpreted the data. HR Park and H Kim prepared the manuscript. H Kim, L yan, EY Joo, EJ Kezirian and J-H Kim contributed to the revision of the manuscript.
Supplementary material
Supplemental material for this article is available online.
References
Supplementary Material
Please find the following supplemental material available below.
For Open Access articles published under a Creative Commons License, all supplemental material carries the same license as the article it is associated with.
For non-Open Access articles published, all supplemental material carries a non-exclusive license, and permission requests for re-use of supplemental material or any part of supplemental material shall be sent directly to the copyright owner as specified in the copyright notice associated with the article.