
Abstract
Understanding the pathophysiology of white matter hyperintensity (WMH) is necessary to reduce its harmfulness. Dilated perivascular space (PVS) had been found related to WMH. In the present study, we aimed to examine the topological connections between WMH and PVS, and to investigate whether increased interstitial fluid mediates the correlation between PVS and WMH volumes. One hundred and thirty-six healthy elder subjects were retrospectively included from a prospectively collected community cohort. Sub-millimeter T2 weighted and FLAIR images were acquired for assessing the association between PVS and WMH. Diffusion tensor imaging and free-water (FW) analytical methods were used to quantify white matter free water content, and to explore whether it mediates the PVS-WMH association. We found that most (89%) of the deep WMH lesions were spatially connected with PVS, exhibiting several interesting topological types. PVS and WMH volumes were also significantly correlated (r = 0.222, p < 0.001). FW mediated this association in the whole sample (β = 0.069, p = 0.037) and in subjects with relatively high WMH load (β = 0.118, p = 0.006). These findings suggest a tight association between PVS dilation and WMH formation, which might be linked by the impaired glymphatic drainage function and accumulated local interstitial fluid.
Keywords
Introduction
White matter hyperintensity (WMH) on FLAIR images can be frequently found in elderly people. 1 Severe WMH could greatly increase the risk of Alzheimer’s disease2,3 and stroke. 1 It also contributes to progressive cognition decline,1,4 mood 5 and gait disorders. 6 There is an urgent need to understand the pathological mechanism of WMH7,8 and thereby to control its progression. 9
Perivascular space (PVS) is a major component of the brain glymphatic system, 10 and it serves as the conduit for wastes clearance and immune responses. Positive correlation between PVS dilation and WMH severity has been frequently reported,11–15 implicating the role of glymphatic dysfunction in WMH development. However, contradictory results still exist, 16 and it seems that accurate segmentation of PVS could yield more robust results. 17 Further investigation on this topic, as well as the topological connections between WMH and PVS, using high-resolution and quantitative imaging methods would be particularly helpful for understanding their associations.
Moreover, how the two imaging signs were related on the pathophysiological level remains unclear. Recent theories suggest that PVS dilation may reflect impaired drainage of interstitial fluid (ISF) from the white matter, which may cause metabolic waste aggregation and inflammation, finally resulting in WMH. 18 Interestingly, some studies utilizing quantitative parametric mapping and new microstructural modeling methods suggest that increased ISF might be a dominating factor of WMH existence.19–21 Taken together, we hypothesize that increased ISF might be the key link between PVS dilation and WMH.
In the present study, we aimed to: (1) confirm the topological and volumetric association between deep white matter PVS and WMH, using sub-millimeter isotropic T2 and FLAIR images. (2) testify whether increased ISF, reflected by diffusion tensor imaging based free-water measurement, mediates the association between PVS and WMH.
Methods
Ethics statement
All subjects had given written informed consent prior to the study, and the protocols had been approved by the medical ethics committee of the Second Affiliated Hospital, Zhejiang University School of Medicine. All clinical investigation has been conducted according to the principles expressed in the Declaration of Helsinki.
Subjects and clinical assessments
We prospectively collected data from 136 healthy elder subjects (age >50), recruited through advertisement in communities. The subjects must have no history of stroke, brain trauma, neurological or psychiatric diseases, nor systematic diseases that could severely affect the brain. As WMH and PVS are all related to vascular factors, we did not rule out subjects with hypertension, diabetes, and hypercholesterolemia. All subjects went through a complete assessment of neuropsychiatric conditions, and multi-sequence MRI scans.
MR imaging protocols
All the MR images were acquired using a United Imaging MR790 3.0 T scanner (Shanghai, China). T1 weighted images were acquired with a 3D fast spoiled gradient-echo sequence, the parameters were: TR = 6.9 ms, TE = 2.9 ms, flip angle = 9degree, Inversion time = 1000 ms, field of view = 256 × 240 mm, voxel size = 1 × 1×1mm, 208 sagittal slices. T2 weight images were acquired with a MATRIX (modulated flip angle technique in refocused imaging with extended echo train) sequence, the parameters were: TR = 3000ms, TE = 405.46ms, echo train length = 180, field of view = 256 × 240 mm, voxel size = 0.8 × 0.8 × 0.8 mm, 208 sagittal slices. T2 FLAIR images were acquired with an inversion recovery MATRIX sequence, the parameters were: TR = 6500 ms, TE = 432.48 ms, echo train length = 220, echo spacing = 4.24ms, bandwidth = 600 Hz/pixel, field of view = 256 × 220 mm, voxel size = 1 × 1×1mm, 170 sagittal slices. Diffusion tensor images were acquired with an echo planar imaging sequence, the parameters were: TR = 8682 ms, TE = 75.8 ms, field of view = 224 × 224 mm, voxel size = 2 × 2×2 mm, 70 axial slices, diffusion direction = 30, b = 0/1000/2000, phase encoding direction=posterior-anterior. Another b0 image with opposite phase encoding direction was acquired to correct EPI distortions. Several other sequences were acquired, and the total scan time was about 1 hour.
Visual assessments
To identify the topological association between deep white matter PVS (dwPVS) and deep WMH (dWMH), two neuroradiologists (R.Z. and W.Y.) were invited to assess the spatial relationship between PVS and WMH. Although, due to the large amount of dWMH clusters (>6000), assessing all of them was almost impossible. To make objective evaluations, we randomly selected 600 clusters (by generating random numbers using MATLAB scripts) from all the dWMH clusters derived through semi-automatic segmentation (see later). To ensure the correspondence between WMH and PVS, FLAIR and T2 images were co-registered first. Then the observers inputted the spatial coordinates of the selected dWMH clusters, viewed the FLAIR and T2 images side-by-side using ITK-SNAP (http://www.itksnap.org), and used a crosshair synchronized between the two images to ensure accuracy.
Each WMH lesion was classified into one of the following types: (1) WMH was directly connected with a single PVS tube; (2) WMH was connected with several PVS tubes; (3) No PVS was connected and the WMH was observed as an isolate sign. WMH lying on the extending path of a PVS but without direct contact was deemed as unconnected. R.Z. and W.Y. assessed the topological associations blind to each other, and the Kappa correlation coefficient was used to assess the inter-observer stability. Finally, P.H., R.Z and W.Y. discussed on the cases with dispute and decided the final results. As we noticed that the connection types were distinct in subjects with different WMH load, we divided the whole sample into quartiles (Q1, Q2, Q3, Q4) according to WMH volumes and counted the numbers of WMH for each type and each quartile.
Lacunes and microbleeds were visually assessed according to the STandards for ReportIng Vascular changes on nEuroimaging 22 by an experienced neuroradiologist (RZ). Lacunes were defined as a round or ovoid, subcortical, fluid-filled cavity (signal similar to CSF) with diameters ranging from 3 to 15 mm, consistent with a previous acute small subcortical infarct or hemorrhage in the territory of one perforating arteriole. Microbleeds were defined as small areas of signal void with associated blooming seen on susceptibility-weighted MRI.
PVS segmentation
Benefiting from the sub-millimeter, isotropic T2 acquisition, we could see much more PVS compared to that using routine clinical images. However, the hand-delineation of PVS and quantifying its volume in the whole brain can cause a tremendous time, with each subject costing at least 6–10 hours. Therefore, we used an advanced deep-learning method to segment PVS. The method was originally developed to segment PVS on isotropic T2 images acquired with 7 T scanners, using a novel multi-channel multi-scale fully convolutional network. 23 To implement this method on our data, 24 additional T2 images acquired using the same protocol were introduced and PVS was hand-depicted by 2 radiologists who discussed and decided the standard together. These 24 T2 images and the corresponding PVS masks were fed into the neural network to fine-tune the network parameters. Quality assessments were performed to ensure that the neural network had adapted to our data, and PVS could be well segmented with good accuracy. Specifically, 10 subjects were used to validate the segmentation and the average DICE coefficient was 0.71. To compare with human performance, we also invited another observer and calculated inter-observer agreement in 5 subjects, which showed a mean DICE of 0.60. Although humans can recognize very small and vague PVS, errors may arise not only from mis-judgement and neglecting, but also hand-eye coordination (Supplementary File 1, Figure S1). On the other hand, the machine learning method has relatively consistent rules and can greatly help us dealing with large dataset. After fine-tuning the algorithm, all the subjects’ PVS were segmented using this method. Finally, one experienced neuroradiologist reviewed all the segmentation results (Figure 1) and manually corrected the masks (Supplementary File 1, Figure S2). For each subject, the PVS mask was checked on axial, coronal and sagittal planes to ensure that PVS lines were correctly labelled. PVS running at oblique directions and appearing as white dots on orthogonal planes were not added back, because correctly labelling all the small white dots in a slice-by-slice way in over a hundred subjects was almost impossible. Wrongly segmented structures, such as sulcus and WMH, were also corrected. In this way, it would usually take about half an hour to correct one PVS mask.
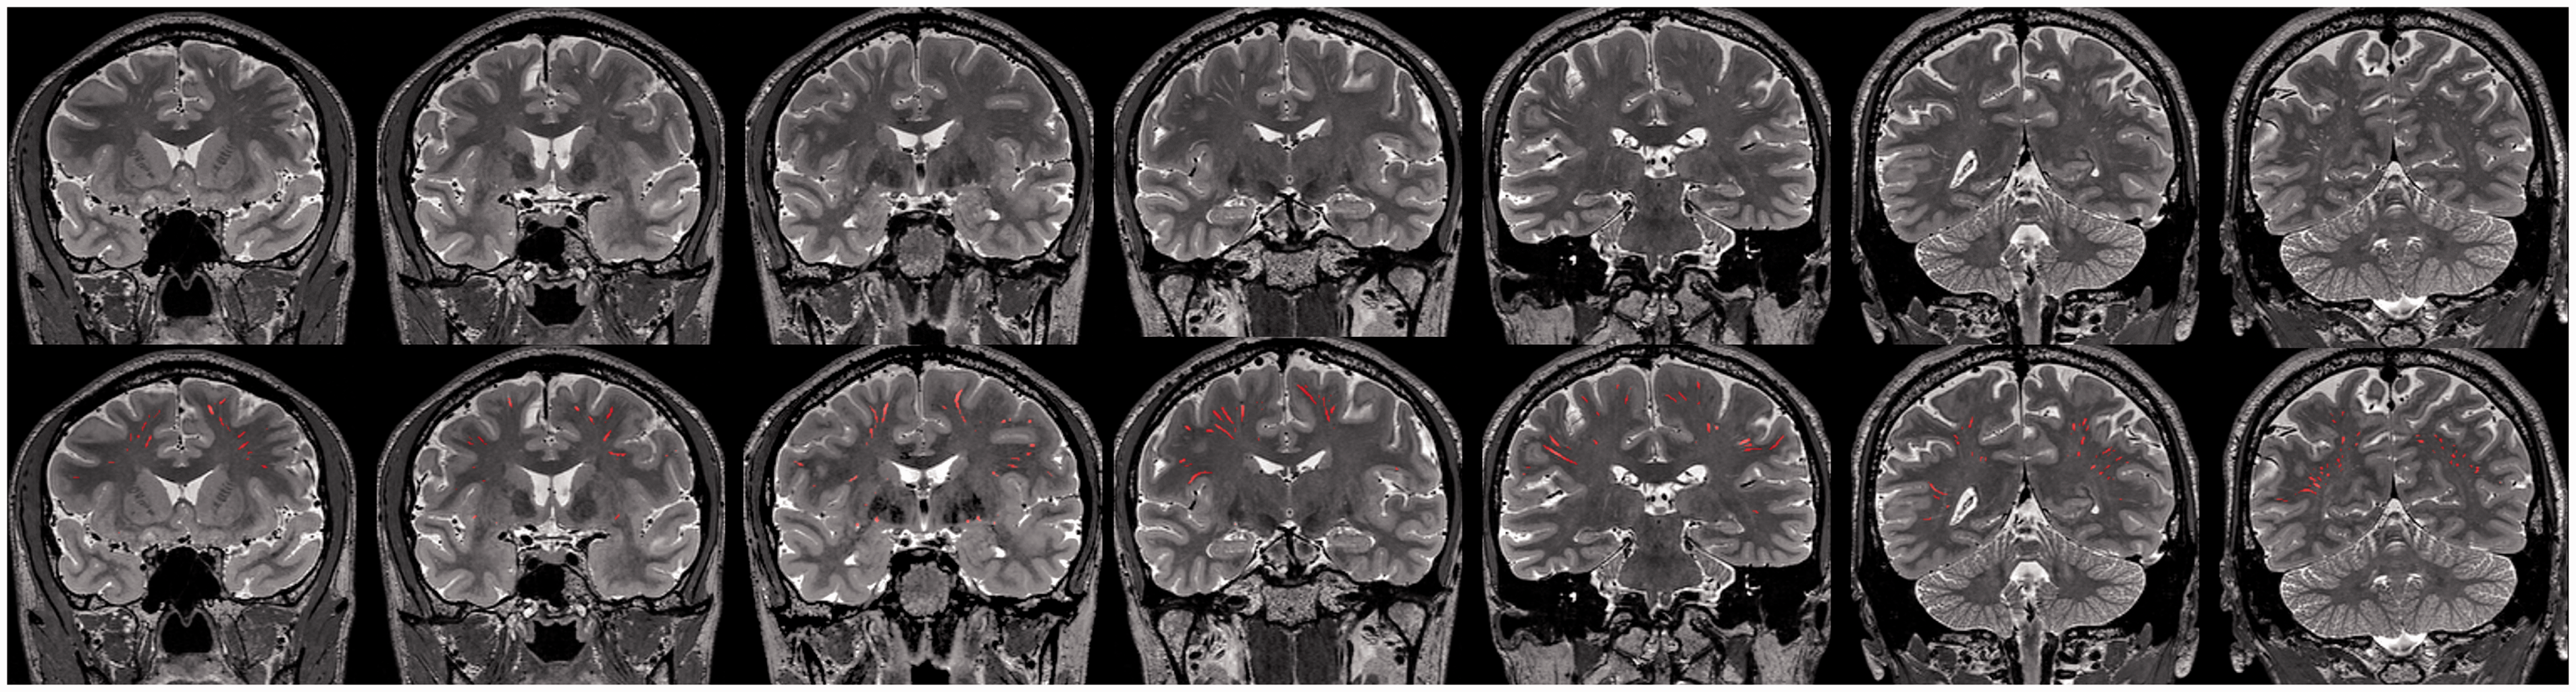
Demonstration of the automated PVS segmentation. Due to the thin slice-thickness, many PVS appeared as short segments or dots on cross-sectional images. Some neglected PVS were added back by hand.
Due to the thin slice-thickness, many PVS appeared as short segments or dots on cross-sectional images (Figure 1). For the readers to evaluate our method, we listed example images from 20 subjects in the Supplementary File 1 (Figure S3), and also created some GIF motion pictures to demonstrate the continuous linear PVS structures as we scrolled across slices (Supplementary File 2, Figure S4). While the method was robust and could differentiate large WMH lesions from PVS, sometimes it was quite difficult to distinguish overlapped small WMH and PVS. To fully eliminate possible influences of PVS\WMH misclassification, we calculated the overlapping areas between the segmented PVS mask and WMH mask (from FLAIR images) in each subject, and subtracted the volume of the overlapping areas from the subject’s total PVS volume. The final “pure” PVS volumes were used for statistical analyses.
A ventricle mask was created by dilating the standard brain’s lateral ventricles (10 mm out), which was then transformed to each subject’s brain space (Figure 2) through linear and non-linear transformations. We segmented the brain tissues and deep-nucleus using the fsl_anat command, which is an automated segmentation pipeline (https://fsl.fmrib.ox.ac.uk/fsl/fslwiki/fsl_anat). The basal ganglia mask was created by dilating each subject’s deep-nucleus segmentation results. The dwPVS volumes were calculated after masking out the peri-ventricular area and the basal ganglia area.
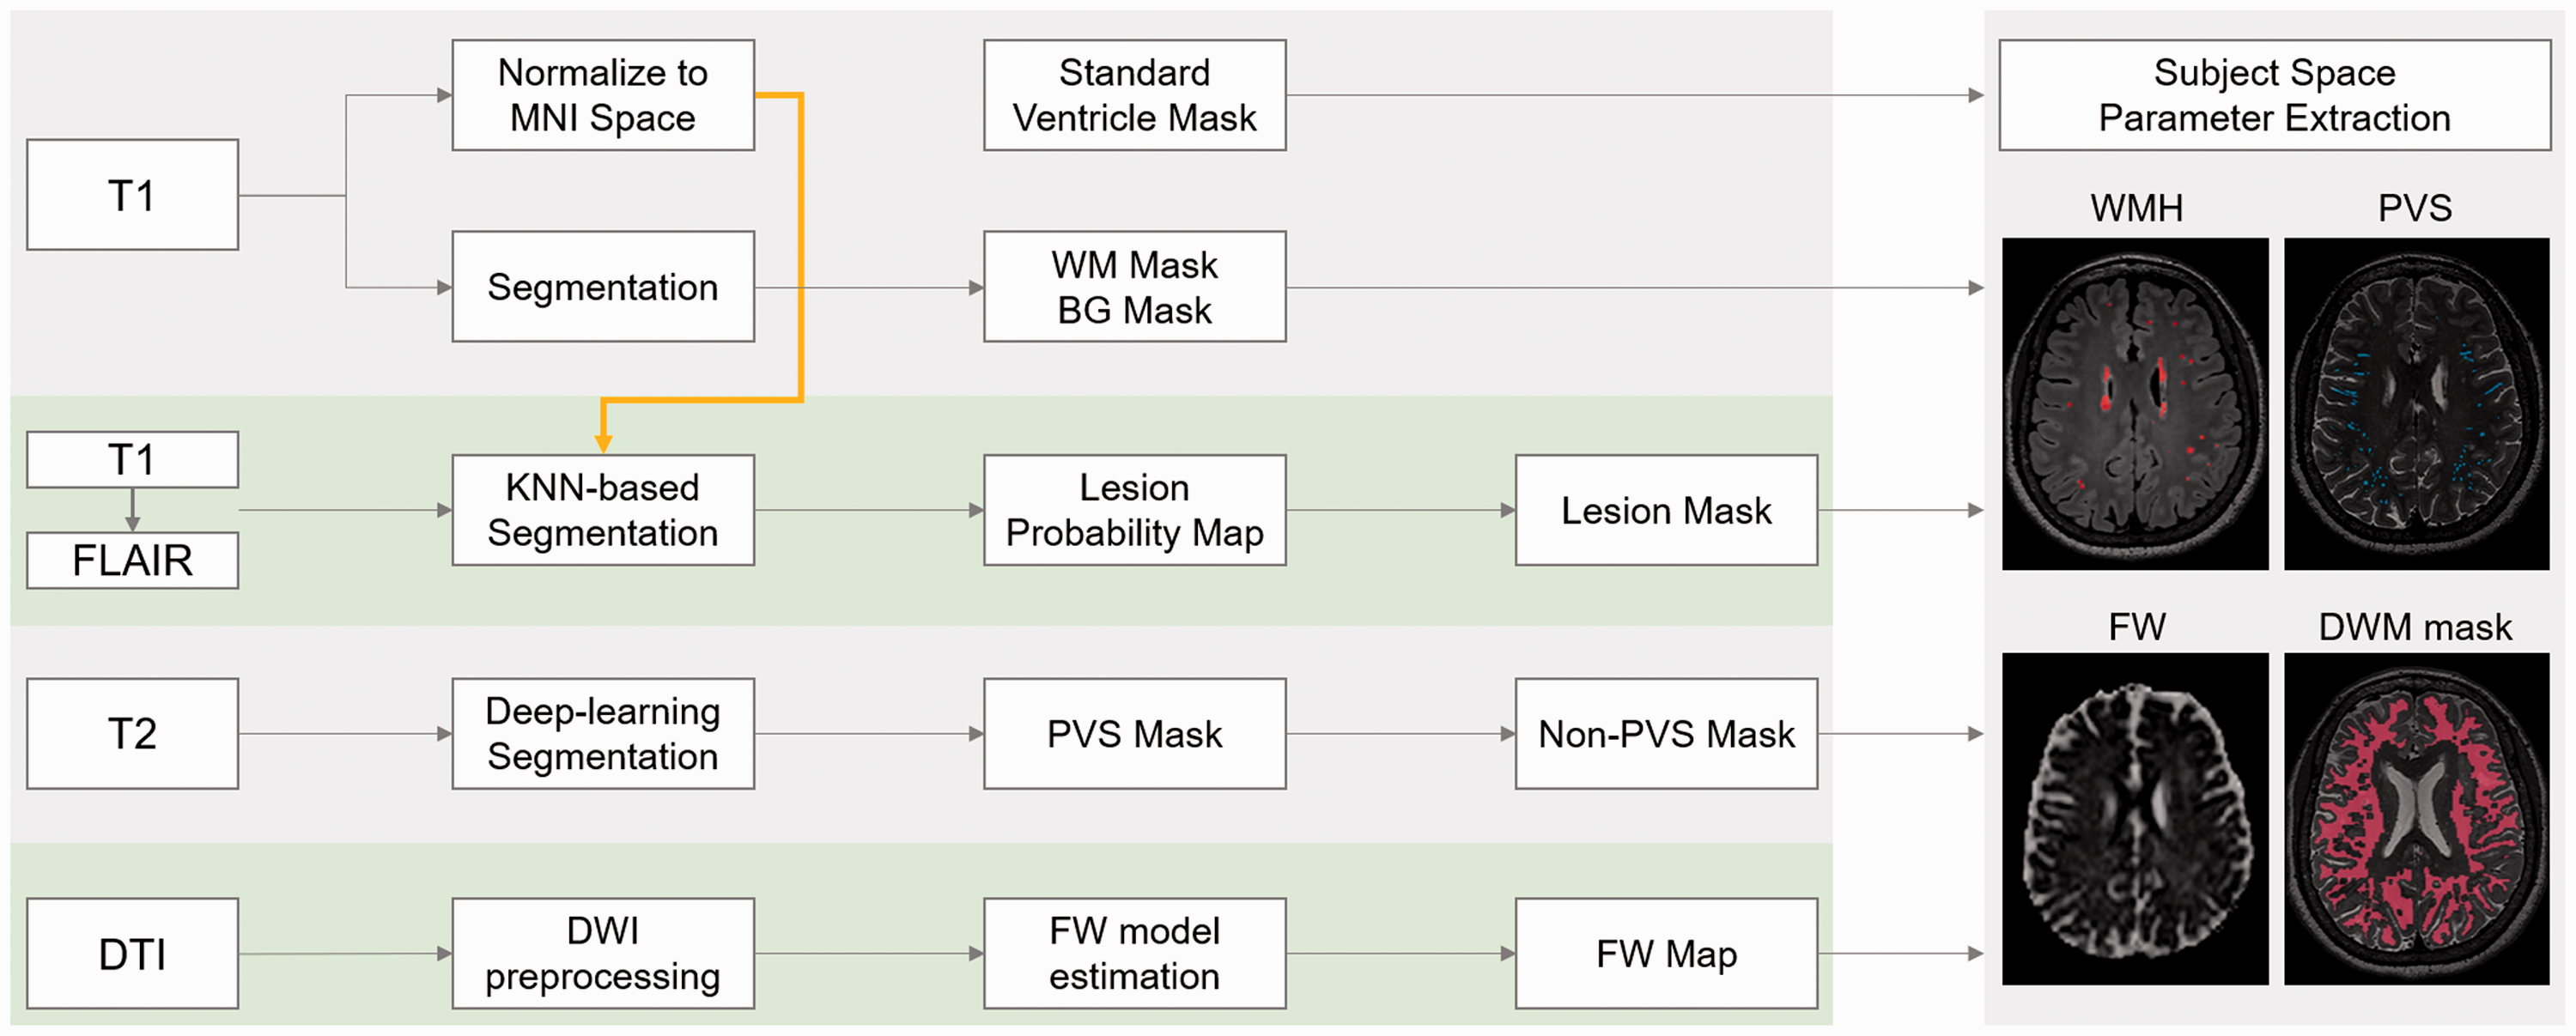
The processing workflow of multi-modality imaging data. Yellow arrow indicates that the spatial transformation information during normalization was used in KNN-based segmentation. All the final images were co-registered to each subject’s T2 image and all parameters were extracted in the subject space. BG: basal ganglia, WM: white matter.
WMH segmentation
WMH segmentation was performed using BIANCA (Brain Intensity AbNormality Classification Algorithm, 24 https://fsl.fmrib.ox.ac.uk/fsl/fslwiki/BIANCA), which is a fully automated, supervised method for WMH detection, based on the k-nearest neighbor (k-NN) algorithm. As BIANCA can be further trained to adapt to different populations, it has higher flexibility and may achieve higher accuracy compared to traditional segmentation methods. We also trained BIANCA with 24 subjects’ T2FLAIR images and hand-depicted WMH masks. To achieve high accuracy, training parameters were also fine-tuned. The final model included intensity information from both T1 images and T2FLAIR images, as well as the MNI spatial transformation information (Figure 2). We selected 2000 training points within the WMH area, and 10,000 training points from the normal appearing white matter (NAWM) area. After generating the WMH probability map, we created a mask by dilating the cerebrospinal fluid (CSF) masks inward until reaching the white matter. The mask was applied to the probability map and the results were thresholded by 0.5 to derive the final WMH mask. In general, the segmentation produced robust segmentation results (validated on 10 subjects, DICE coefficient = 0.83 ± 0.09). Though, visual assessment and manual corrections were still performed to ensure accuracy by an experienced neuroradiologist. The dWMH volumes were calculated after masking out the peri-ventricular area and the basal ganglia area.
Free-water DTI analysis
The preprocessing of diffusion weighted images was performed using MRtrix (https://www.mrtrix.org/). The preprocessing steps included denoising, removing Gibbs artifact, EPI distortion correction and eddy current correction. The raw distorted diffusion weighted images were well recovered after going through this process. Next, the FW DTI analysis was performed in DIPY (http://nipy.org/dipy/index.html), which is a software project focused on DTI analysis. Briefly, in each voxel, the signal was fitted to a two compartment model, including a FW compartment (isotropic tensor) and a tissue compartment (FW-corrected tensor). 25 The estimated parameters were the fractional volume of the FW compartment (i.e. the FW measure) and the tensor of the tissue compartment. The FW measure expresses the relative contribution of FW in each voxel, ranging from 0 to 1. The tensor of the tissue compartment reflects the tissue microstructure after removing the signal contributed by FW.
The generated FW maps were co-registered to T2 images through b0 images. To remove the effect of apparently dilated PVS, the PVS masks were first dilated by 2 voxels to avoid partial volume effect. Then, voxels within the PVS masks were removed from the FW map, and mean deep white matter FW were extracted for further analysis. We also performed an additional FW analysis on peri-WMH areas. Peri-WMH areas were defined by dilating WMH lesion masks out for 10 voxels (5 steps, 2 voxels each). Mean FW was also extracted from the 5 ring areas (peri1: 0–2 voxels; peri2: 3–4 voxels; peri3: 5–6 voxels; peri4: 7–8 voxels; peri5: 9–10 voxels).
Statistical analysis
Chi-square test was used to find out whether the connection types were different among the four quartiles. As the WMH volume and PVS volume did not follow the nominal distribution, the association between them was assessed using Spearman's rank correlation with R package (version 3.4.3), adjusted for age and sex.
To test our hypothesis, we performed a path analysis using Lavaan (version 0.6–1.1185) based on R language. We hypothesized that PVS dilation may increase FW (path a) and lead to the growth of WMH (path b), or directly cause increased WMH volume (Path c). Therefore, FW was introduced as a mediator between PVS and WMH volume. We assessed the model with three model fit measures: Root Mean Square Error of Approximation, Standardized Root Mean Square Residual and Comparative Fit Index.
One-way analysis of variance and post-hoc pair analysis was performed to investigate peri-WMH FW alterations. To explore the possible effect of WMH load, we also divided the whole sample into the low-load (LL) group and high-load (HL) group using the median dWMH volume. The dwPVS volume and FW were compared between the groups using independent two-sample t-tests. Partial correlation analysis and path analysis were performed again in each sub-group.
Data availability
The data supporting the findings of this study are available from the corresponding author upon reasonable request. They are not publicly available because of ethical restrictions.
Results
Demographic results
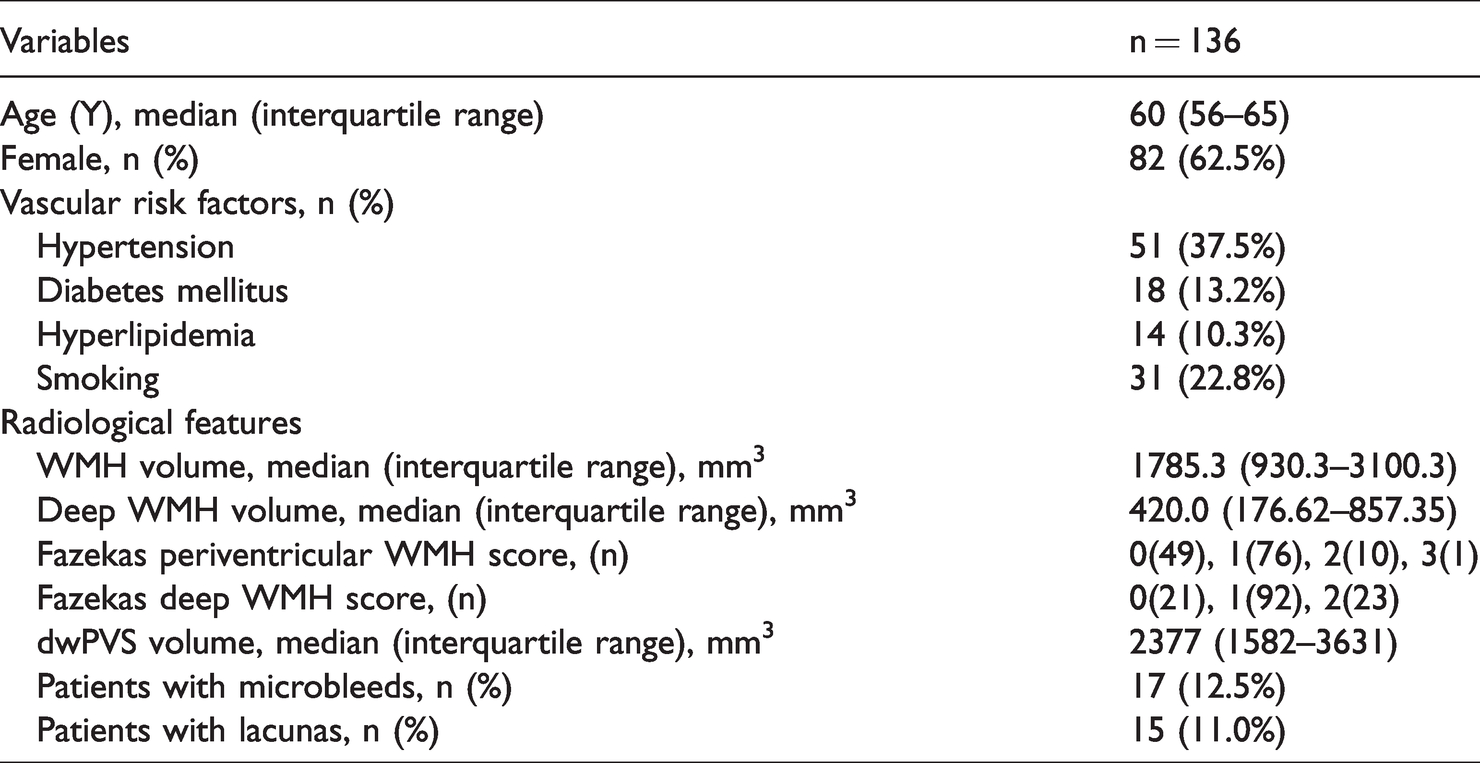
Totally, 136 subjects were enrolled in this study (82 females; median age 60 years; range 56∼65 years). The characteristics of the study samples were presented in Table 1. Briefly, the subjects’ median total WMH volume was 1.79 mL (interquartile range, IQR: 0.93 mL–3.10 mL), and the median dWMH volume was 0.42 mL (IQR: 0.18 mL ∼ 0.86 mL). The median dwPVS volume was 2.38 mL (IQR: 1.58 mL ∼3.63 mL). Seventeen (12.5%) subjects had microbleeds, and 15 (11.0%) subjects had lacunas.
Subject characteristics.
Visual assessments
Figure 3 showed some examples of the connection topologies between WMH and PVS. There were several interesting variations among each type. In type 1 (Figure 3(a) to (d)), usually one PVS tube was connected to the center of the WMH lesions, penetrating the WMH lesion or not. In some cases, the whole PVS segment became bright on the FLAIR image. In type 2 (Figure 3(e) to (g)), several PVS tubes were connected to a relatively large WMH lesion, and a WMH may also be mainly composed of PVS tubes (F). These different types could exist simultaneously in one subject, as shown in Figure 3(i).
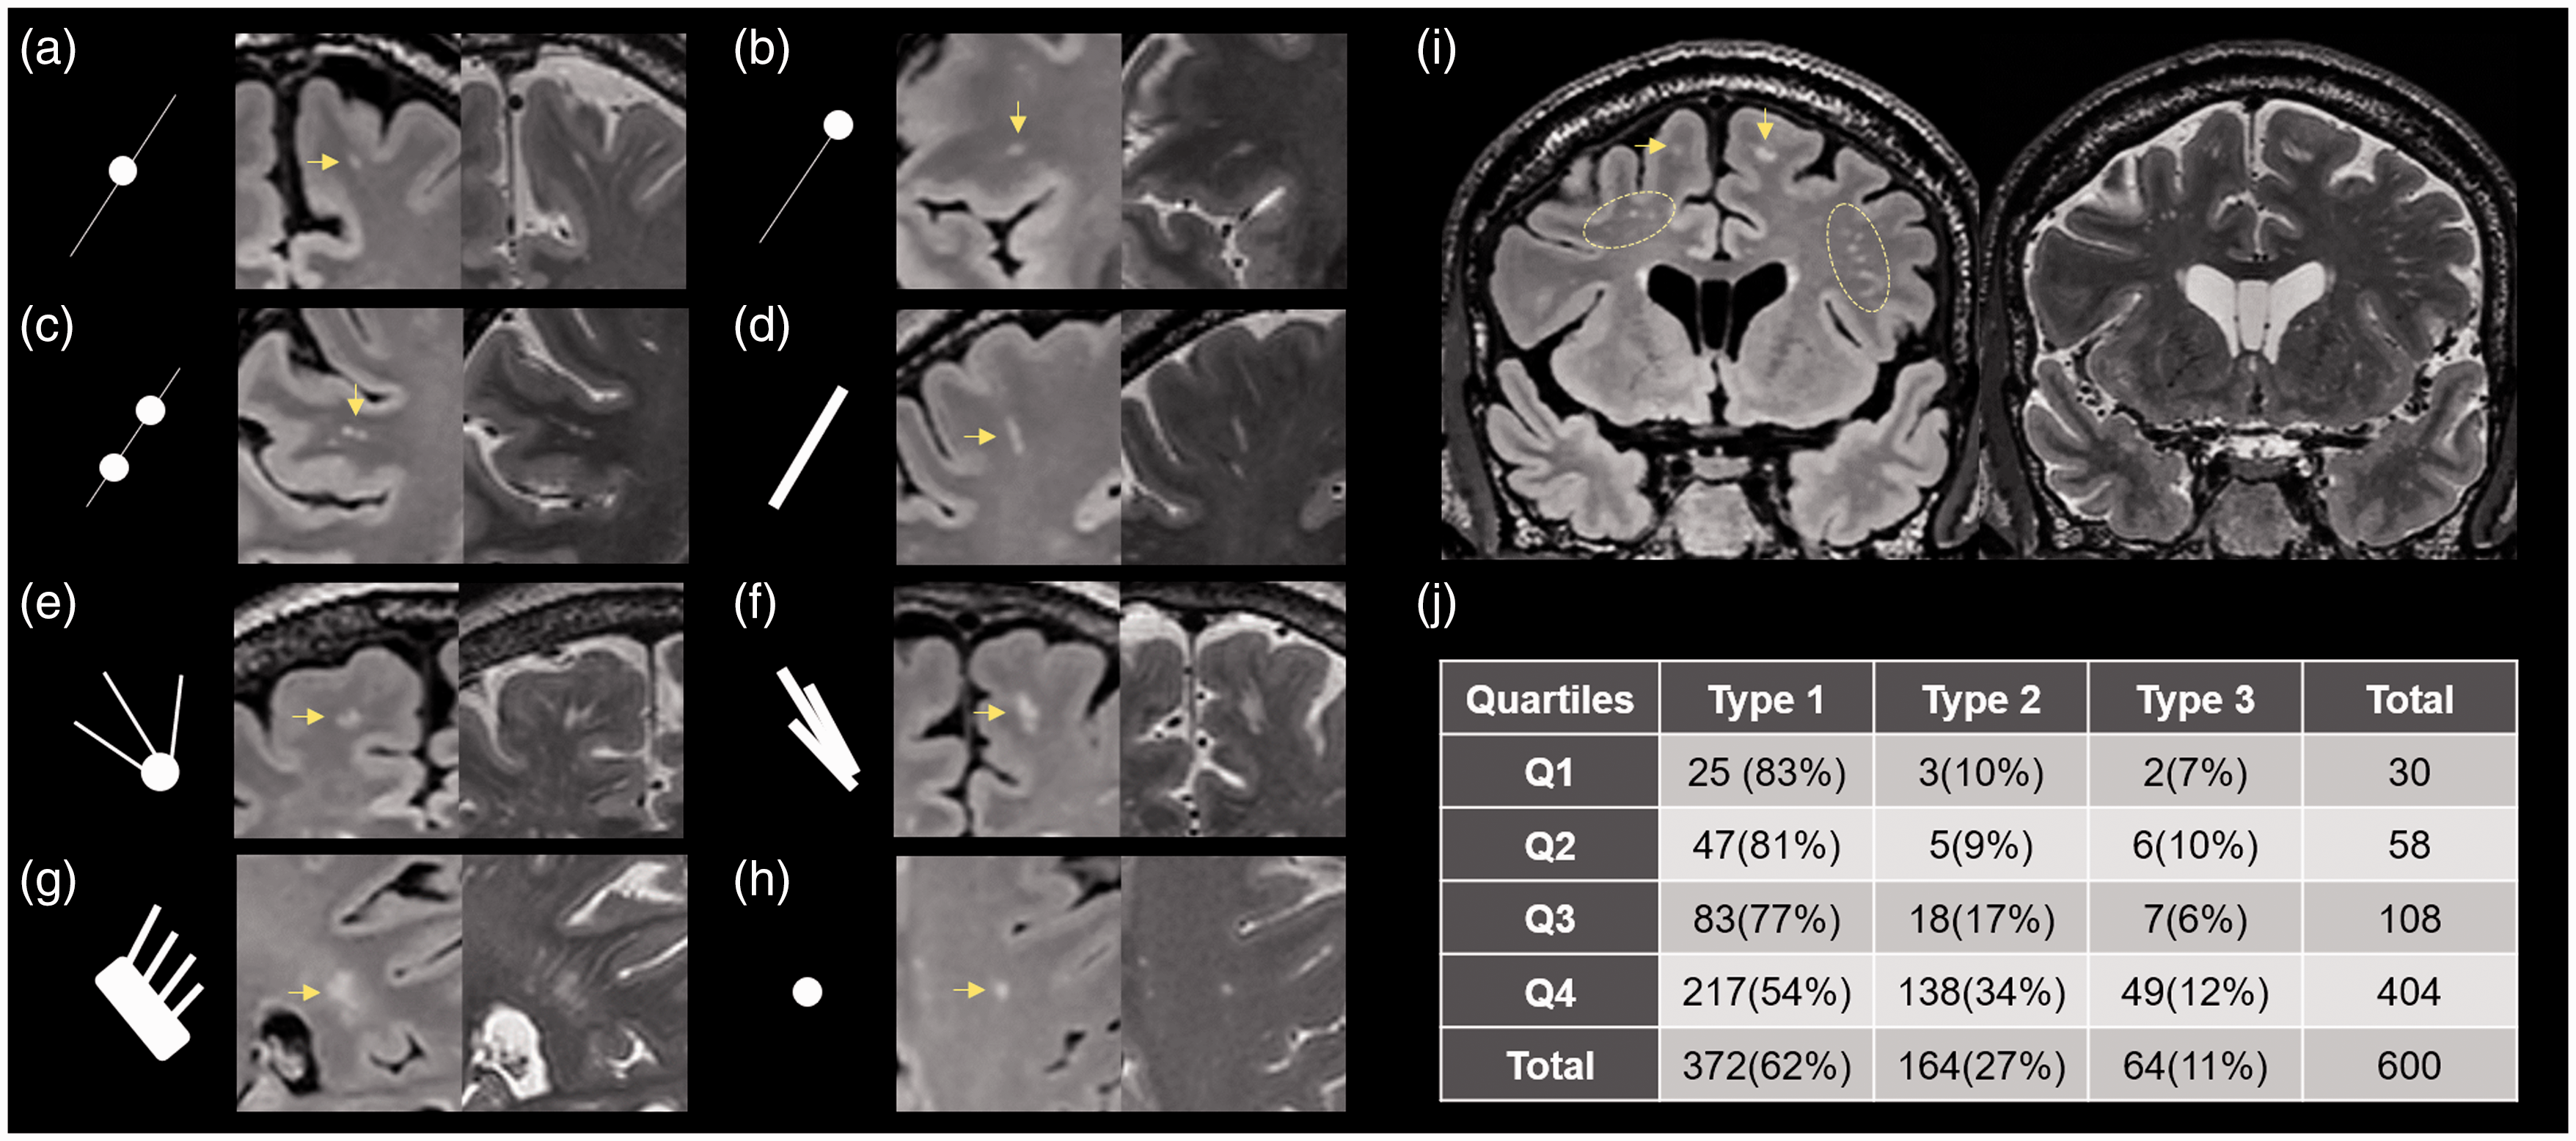
Illustration of the PVS-WMH topological connections. (a–d) Type 1, small punctate WMH (yellow arrow) was connected to a PVS tube; sometimes two WMH were seen on one PVS. (e–g) Type 2, WMH flakes were connected to several PVS tubes. In fact, it looks like that some WMH flakes were mostly composed of dilated PVS (f, g). (h) Type 3, isolated WMH with no PVS connection. (i) several types of connections existed simultaneously in one subject. (j) Distribution of different types of connection in the whole sample. Numbers in the bracket indicate the percentage to the total WMH number within each quartile.
The two observers showed good consistency (Kappa = 0.688, CI = 0.632–0.744). Among the 600 randomly selected WMH clusters, most of them were from the Q4 group (Figure 3(j)). This was expected as these subjects had more WMH lesions. Eighty-nine percent of the WMH clusters were connected with one or more PVS tubes. Type 1 was the most frequent connection type (62%), followed by type 2(27%), and 11% of the clusters were unrelated to PVS. Connection types were significantly different among the four quartiles (p < 0.001). The Q4 group had significantly less type 1 cases, but more type 2 & 3 cases.
Quantitative analysis
Age was significantly correlated with dWMH (r = 0.320, p < 0.001), deep PVS volume (r = 0.260, p = 0.002), and brain FW (r = 0.490, p < 0.001). Correlation analysis controlling for age and sex showed that dWMH had significant association with dwPVS volume (r = 0.222, p < 0.001). Mediation analysis (Table 2) demonstrated that FW’s mediation effect was significant (β = 0.069, p = 0.037).
Results of mediation analyses.
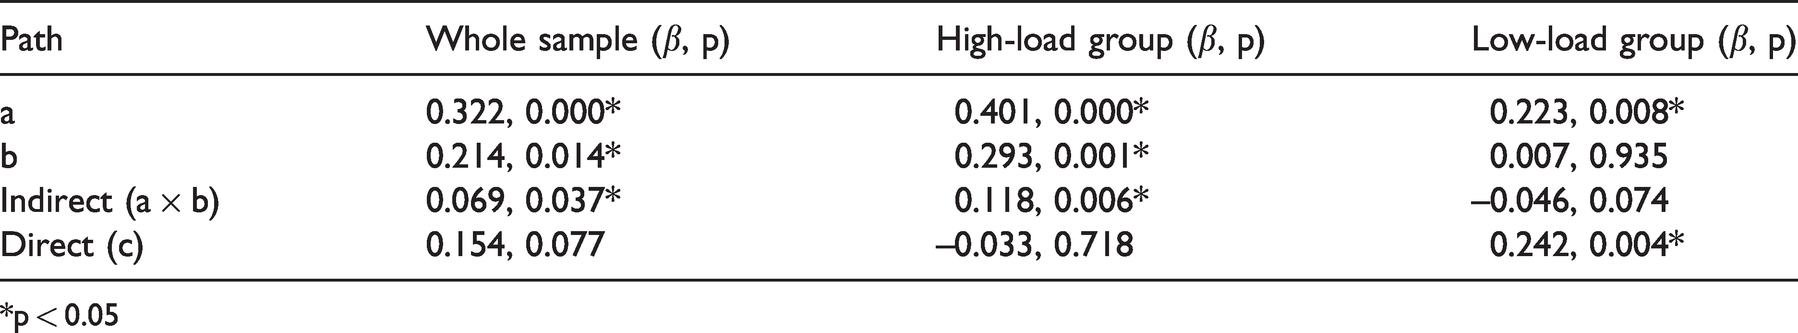
*p < 0.05
The HL and LL groups showed significant differences in dwPVS volume (HL median = 2714 mm3, LL median = 2286.1 mm3, p = 0.021) and brain FW (HL mean = 0.242, LL mean = 0.231, p = 0.003). In the HL group, mediation analysis showed that dwPVS had no direct association with dWMH volumes (β=−0.033, p = 0.718), and FW fully mediated their associations (β = 0.118, p = 0.006). In the LL group, dPVS had direct association with dWMH volumes (β = 0.242 p = 0.004), and FW’s mediation effect was marginally significant (β = 0.046, p = 0.074).
Peri-WMH FW analysis showed that WMH areas had significantly higher FW (mean = 0.375) than that in NAWM (mean = 0.249, p < 0.001). Five peri-WMH rings also showed higher FW (peri1: mean = 0.300, p < 0.001; peri2: mean = 0.264, p < 0.001; peri3: mean = 0.256, p < 0.001; peri4: mean = 0.255, p = 0.873; peri5: mean = 0.253, p = 1.000), but only the first three of them were significantly different.
Discussion
In the present study, we observed interesting topological connections between dwPVS and dWMH. Most punctate (<3mm) dWMH were connected with one PVS tube, and large (>5mm) dWMH lesions could have several thick PVS connections. We also found that dwPVS volume was significantly correlated with dWMH burden. Moreover, brain FW fully mediated the dwPVS-dWMH association the whole sample and in the HL group. These findings strongly support a pathological link between dwPVS and dWMH, which might be the impaired ISF drainage.
Topological associations
Because WMH and PVS dilation are both regional brain alterations, whether they are topologically linked are important for inferring their pathological associations. However, the relevant evidence is scarce. Several early studies 26,27 argued that the pathology of “punctate WMH” were mainly dilated PVS, but these “punctate WMH” were actually PVS according to current definitions. 22 In 2008, an abstract 28 showed that high-intensity dots on T2 images might appear along vascular structures, but their main interest was in veins and they did not go further analyzing PVS-WMH associations. One study on patients with cerebral autosomal dominant arteriopathy with subcortical infarcts and leukoencephalopathy (CADASIL) demonstrated that WMH in the temporal pole could be explained by significantly enlarged PVS in the same area. 29 The phenomenon that WMH may preferentially grow along PVS had been mentioned in two review papers,30,31 and possible theories regarding their pathological links were proposed.
Due to the lack of 3 D high resolution imaging method, it used to be quite difficult to observe the precise spatial relationships between WMH and PVS. Here we acquired sub-millimeter T2 and FLAIR images, which enabled us to identify subtle PVS dilation. One example is that in most subjects, there were hundreds of PVS tubes, far more than the numbers (0∼40) used for grading in traditional visual evaluation.11,32 Notably, the linear structures of PVS running in different directions were best visualized on different orthogonal positions. Therefore, we could view from different angles and differentiate WMH from PVS, which might be difficult on thick-slice, axial images. The deep neural network for PVS segmentation could also learn the linear features of PVS and avoid misclassifying WMH.
We demonstrated that most WMH were connected to PVS, and some of them were even mainly composed of PVS, suggesting tight pathological associations between them. To confirm that WMH may preferentially grow from PVS, we are still performing longitudinal observations on these subjects. Interestingly, in one subject, two abnormally dilated spots on PVS grew into punctate WMH in only 6 months (Figure 4). The concerns that this phenomenon might be caused by partial volume effect could be addressed by the high-resolution isotropic image and that WMH lesions covered at least 2 slices on follow-up FLAIR images. From the imaging principles, we may infer that a transition from free water into bound water occurred during this process, due to the accumulation of large molecules in these areas.
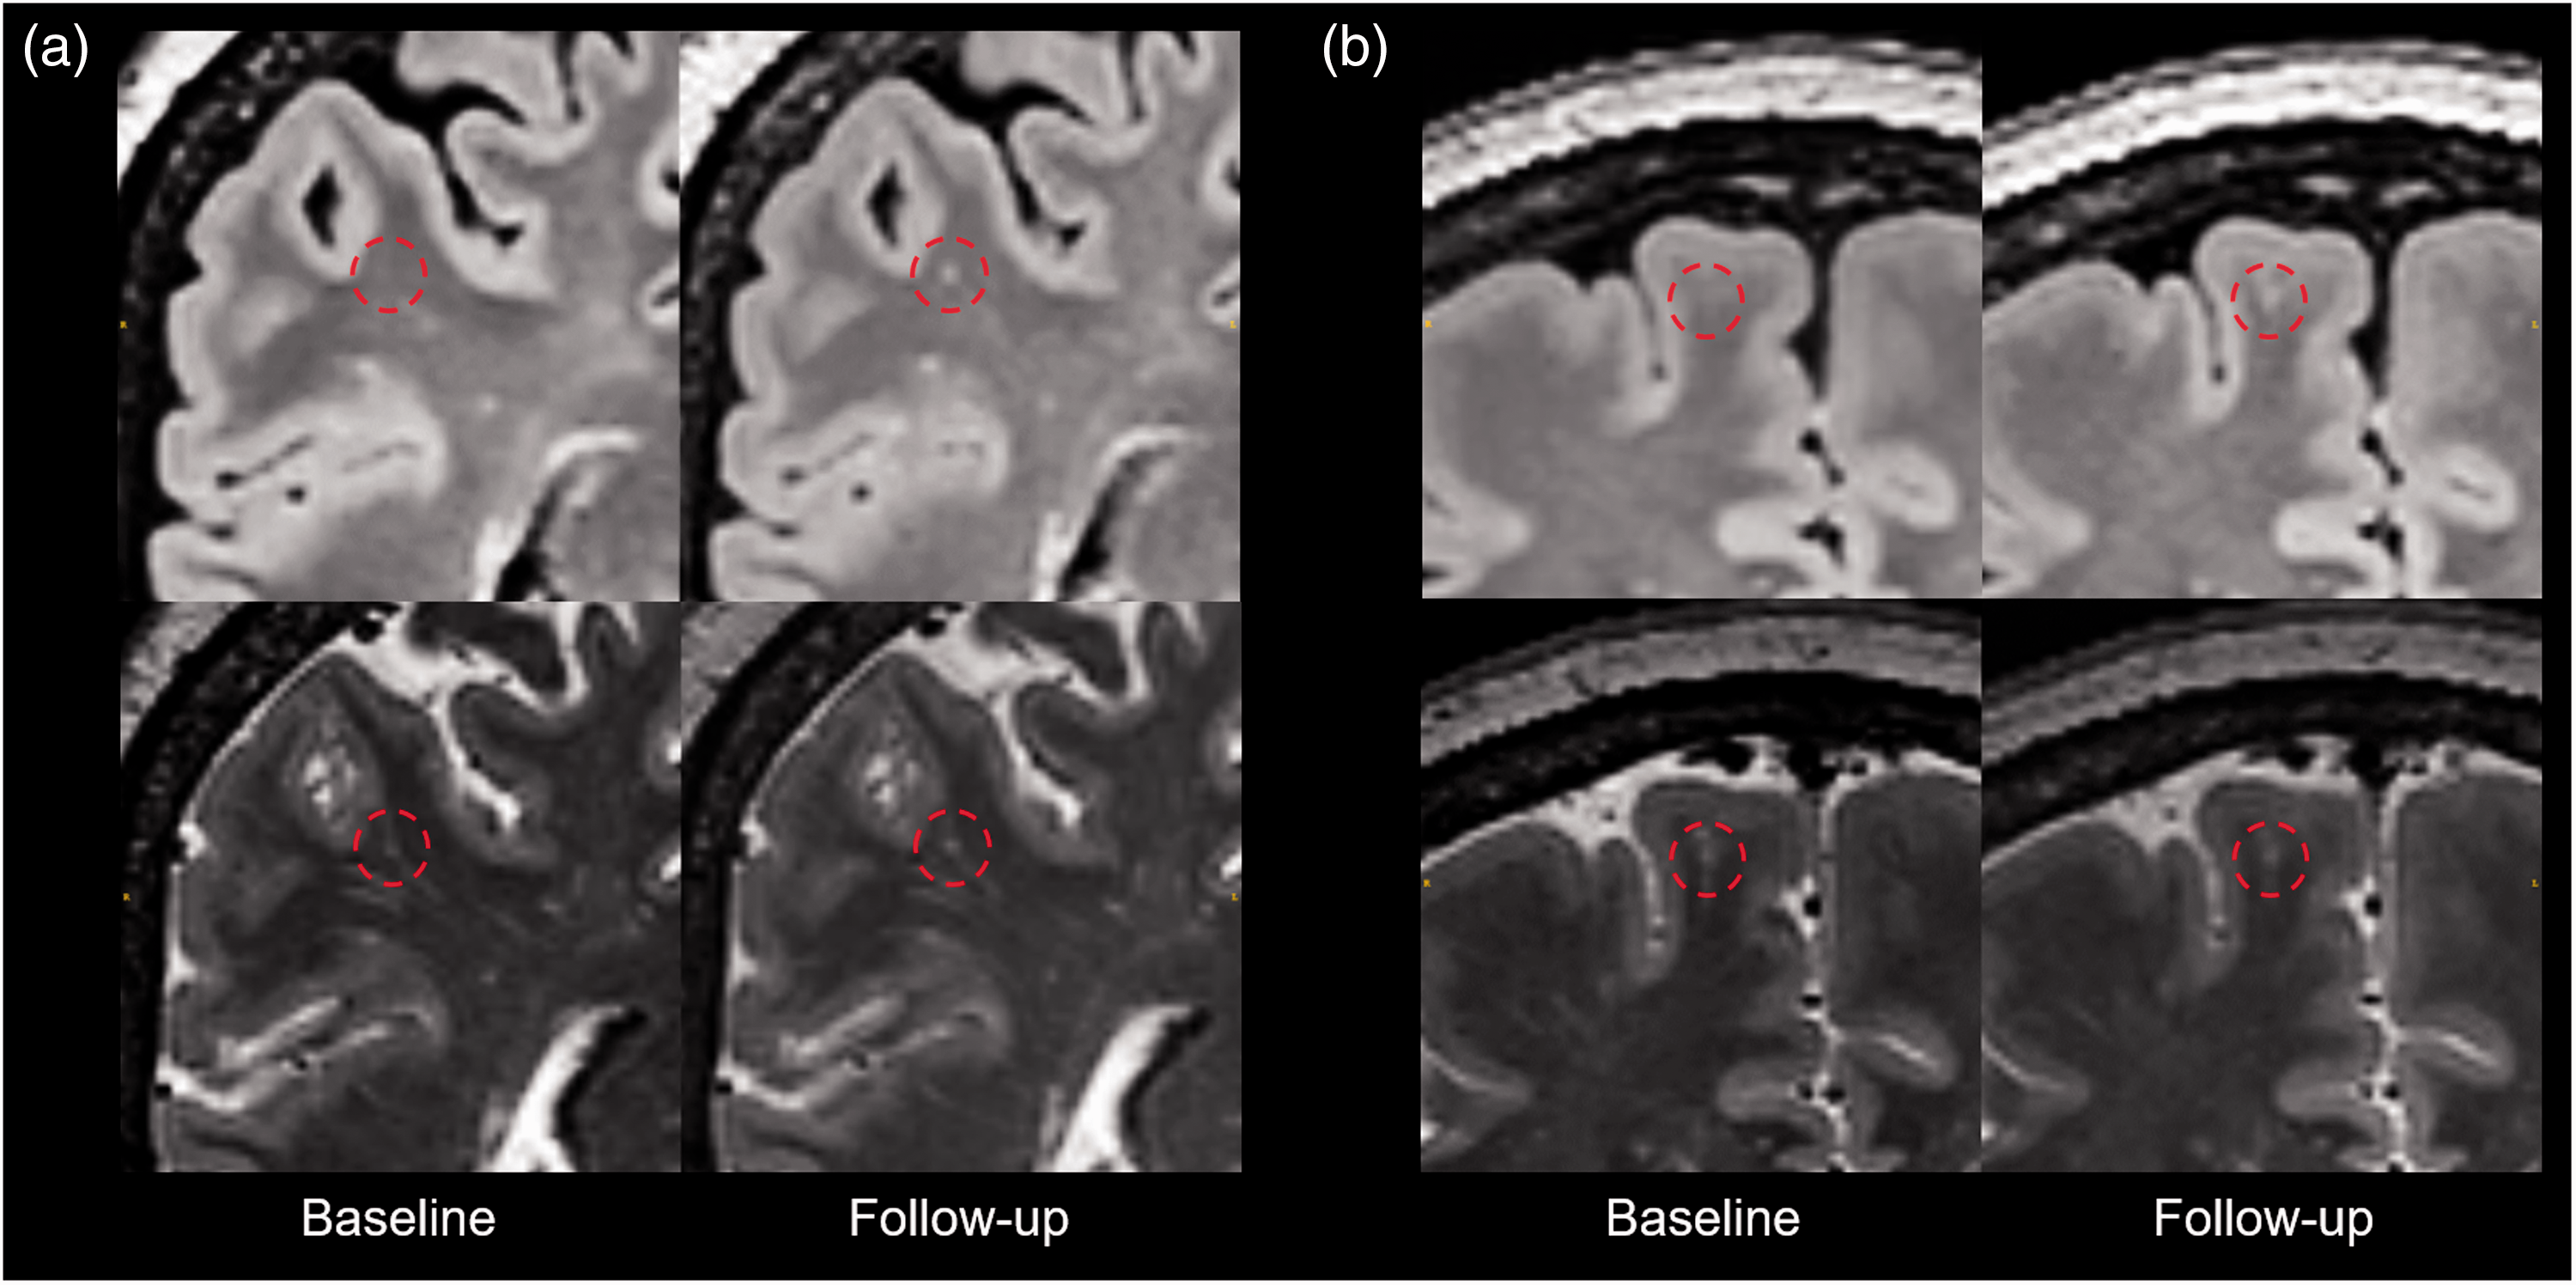
Longitudinal investigation of a subject. In the 6 months follow-up of a subject, two new WMHs (in the red circle of a and b) appeared on the follow-up FLAIR image. Although no WMH can be found in the same location on the baseline FLAIR image, a bright spot could be seen located on a PVS in the same area. On the follow-up T2 image, both spots grew larger.
Volumetric associations
The association between PVS dilation and WMH severity had been extensively studied, and almost all papers reported significant correlations between PVS dilation and WMH volume.11,33,34 However, a recent meta-analysis failed to find significant associations, 16 and they suggest relatively consistent results in BG area. Nevertheless, the correlation between bgPVS and WMH is highly possible a coexistence linked by other cerebral small vessel disease (CSVD) related factors, rather than causal relationships, because the dilated bgPVS has no topological association with either periventricular or deep WMH.
Here we focused on the deep white matter area, where WMH and PVS could have direct contact. Our results demonstrated that dWMH volume was significantly correlated with dwPVS volume. Previously, largely contradictory results had been reported regarding their relationships, 12 , 34 possibly due to inconsistencies in the evaluation methods and heterogeneous populations. Notably, a recent study also enrolled community subjects and used automated PVS segmentation methods. Like our results, they found a positive association between WMH severity and PVS volume. 17
When divided into LL and HL groups, the association only exists in the LL group. This can be explained by the topological connections. As subjects in the mild group had mostly punctate dWMH which were usually on dwPVS tubes, the volume of dwPVS and dWMH were significantly correlated. On the other hand, subjects in the severe group had large areas of WMH which covered some parts of dwPVS, making the growth of WMH and PVS not proportional. Another possible explanation is that some dwPVS were heavily obstructed and reached the ceiling of dilation.
FW’s mediation effect
The FW’s mediation effect was significant in the whole sample and in the HL group, which generally confirmed our hypothesis. Firstly, we re-examined the supporting evidence about the PVS-FW and FW-WMH associations. Here PVS volume was consistently associated with FW (path a), either in the whole sample, or in the sub-groups. This result supports the above mentioned PVS drainage theory. 18 Secondly, the peri-WMH analysis showed that FW is significantly elevated in WMH areas compared to normal appearing white matter, and there was a “FW penumbra area” around WMH. These results verified the role of FW in WMH formation. Taken together, we suggest that that dilated PVS reflected impaired ISF drainage, which led to increased FW and the emerge of WMH.
Glymphatic dysfunction and WMH development
Previously, decreased cerebral blood flow 35 and fiber tract demyelination 36 had been considered as the main pathology of aging-related WMH. In recent years, studies implicated the contribution of other pathological changes, such as blood-brain barrier (BBB) disruption 37 and venous collagenosis. 38 The role of glymphatic dysfunction in CSVD also went into the sight of researchers. It has been proposed that PVS dilation may indicate39,40 the deposition of cell debris and other waste products, which can impair clearance of metabolic waste from the interstitial fluid space. The impaired glymphatic flow may further lead to accumulation of toxins and invoke various pathological processes, resulting in WMH. Nevertheless, there is a lack of strong supporting evidence regarding this theory, especially in sporadic CSVD.
Based on our results, we would like to propose a specific theory for understanding the association between dwPVS and dWMH (Figure 5). In healthy brains (A), penetrating arteries drive CSF flow into PVS, maintaining a clean extra-cellular space through CSF-ISF exchange. Aging related brain degeneration may produce excessive metabolic waste and activate inflammatory responses, 41 with varying degrees across the whole brain. Accumulation of waste in PVS and reduced water transport induced by aging may hinder CSF-ISF exchange and cause compensatory dilation 42 (B). Due to the impaired ISF drainage, FW around certain PVS segments increases, and behaves as punctate dWMH on FLAIR images (C). As degeneration further progresses, multiple PVS tubes near the degenerated area may significantly dilate, and confluent dWMH lesions appear. Apparently, not all dWMH could fit into this framework due to its heterogeneity. 21 But we can expect a large portion of aging related dWMH to develop in this way, as most of them were located on PVS. Under this framework, a series of brain alterations (dwPVS dilation, increased FW, dWMH) occur during brain degeneration. If PVS dilation and increased FW were indeed pre-WMH alterations, then they may serve as early markers or treatment targets for controlling WMH progression.
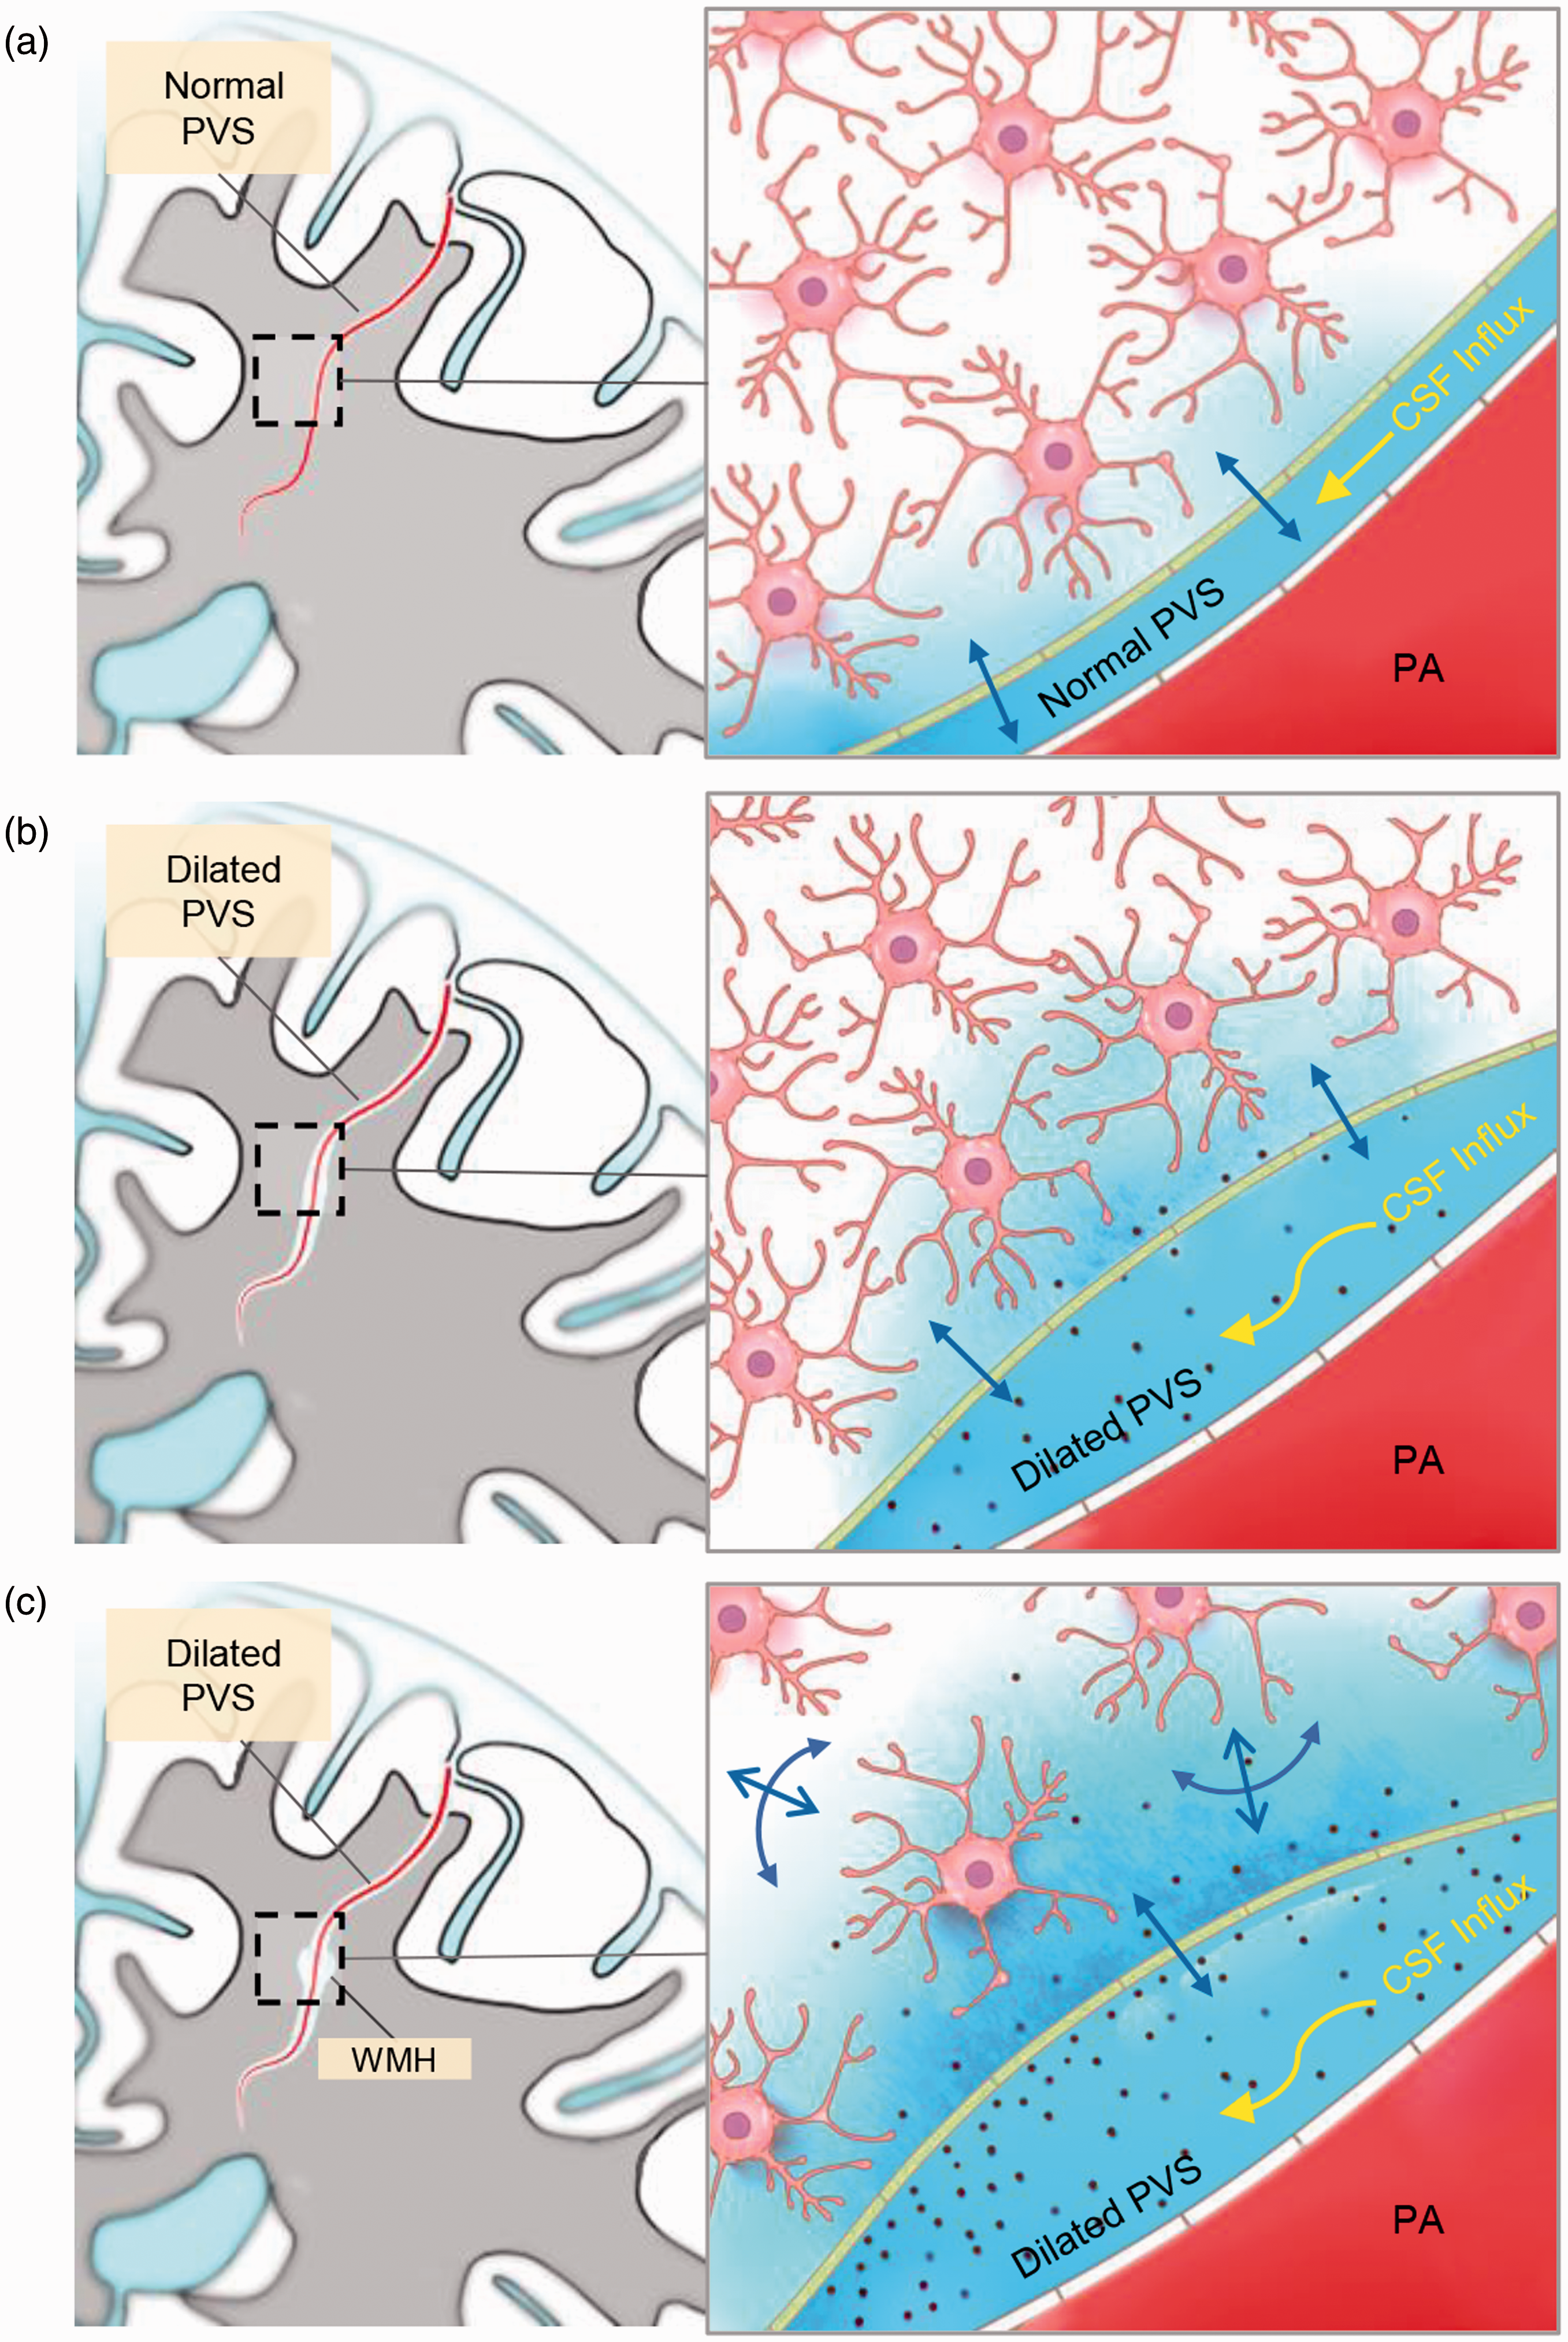
Possible mechanism underlying the PVS-WMH topological association. In healthy brains (a), penetrating arteries drive CSF flow into PVS, maintaining a clean extra-cellular environment through CSF-ISF exchange. Aging related brain degeneration may produce excessive metabolic waste and activate inflammatory responses. Waste products and cell debris accumulates in PVS and hinders CSF-ISF exchange, leading to compensatory PVS dilation (b). Due to the impaired ISF drainage, FW around certain PVS segments increases (blue color) and appears as punctate dWMH on FLAIR images (c).
Several alternative hypotheses should also be considered. Here we had not examined BBB integrity in these subjects, due to the difficulty of performing contrast-enhanced MRI in healthy subjects. Subtle BBB changes may cause the leakage of pathological molecules and increased water content, 37 producing similar imaging signs. Myelin vacuolation may also increase ISF, and cause elevated FLAIR intensity in deep white matter. 43 However, these theories could not well explain the observed diverse topological connection types. Further longitudinal, multi-modal imaging studies are expected to confirm this hypothesis.
Limitations
The present study is subject to several limitations. Firstly, our subjects had a narrow range of age (56∼65) and were relatively healthy. Although we had observed similar patterns in young people and those with severe CSVD, the incident rate of different connection types may be quite different and remains to be demonstrated in future studies. Secondly, due to the large amount of WMH lesions, we randomly selected 1/10 of them and performed visual assessments. Sampling errors might be introduced during this process. Thirdly, due to the limited field strength and hardware performance on clinical scanners, the visualization of PVS is not as good as those studies using 7.0 T scanners, and the diffusion MR images had a lower resolution compared to T2 images. The partial volume effect might have caused some mis-segmentation and bias.
Conclusion
We demonstrated that most dWMH lesions were connected to dilated dwPVS, and their volumes were correlated. FW mediated the association between dwPVS and dWMH, indicating mechanistic links. A new framework regarding age-related WMH growth was proposed, which may widen our understanding of the pathophysiology underlying WMH development, and potentially help us to control its harmfulness.
Supplemental Material
sj-zip-1-jcb-10.1177_0271678X211002279 - Supplemental material for Deep white matter hyperintensity is associated with the dilation of perivascular space
Supplemental material, sj-zip-1-jcb-10.1177_0271678X211002279 for Deep white matter hyperintensity is associated with the dilation of perivascular space by Peiyu Huang, Ruiting Zhang, Yeerfan Jiaerken, Shuyue Wang, Wenke Yu, Hui Hong, Chunfeng Lian, Kaicheng Li, Qingze Zeng, Xiao Luo, Xinfeng Yu, Xiaopei Xu, Xiao Wu and Minming Zhang in Journal of Cerebral Blood Flow & Metabolism
Footnotes
Funding
The author(s) disclosed receipt of the following financial support for the research, authorship, and/or publication of this article: This study was supported by the 13th Five-year Plan for National Key Research and Development Program of China (Grant No. 2016YFC1306600), the National Natural Science Foundation of China (Grant Nos. 81771820, 81571654 and 81701647), the Natural Science Foundation of Zhejiang Province (Grant No. LSZ19H180001 and LQ20H180015), the China Postdoctoral Science Foundation (Grant No. 2019M662083) and the Zhejiang province Postdoctoral Science Foundation.
Declaration of conflicting interests
The author(s) declared no potential conflicts of interest with respect to the research, authorship, and/or publication of this article.
Authors’ contributions
PH and MZ were responsible for the study concept and design. YJ, SW, WY, HH, KL, QZ, XL, XX, XW and XY contributed to the acquisition of imaging data. PH, RZ, YJ and CL performed data analysis and interpreted the findings. PH and RZ drafted the manuscript. MZ provided critical revision of the manuscript for important intellectual content. All authors critically reviewed the content and approved the final version for publication.
Supplemental material
Supplemental material for this article is available online.
References
Supplementary Material
Please find the following supplemental material available below.
For Open Access articles published under a Creative Commons License, all supplemental material carries the same license as the article it is associated with.
For non-Open Access articles published, all supplemental material carries a non-exclusive license, and permission requests for re-use of supplemental material or any part of supplemental material shall be sent directly to the copyright owner as specified in the copyright notice associated with the article.