
Abstract
White matter hyperintensities (WMH), perivascular spaces (PVS) and lacunes are common MRI features of small vessel disease (SVD). However, no shared underlying pathological mechanism has been identified. We investigated whether SVD burden, in terms of WMH, PVS and lacune status, was related to changes in the cerebral arterial wall by applying global cerebral pulse wave velocity (gcPWV) measurements, a newly described marker of cerebral vascular stiffness. In a population-based cohort of 190 individuals, 66–85 years old, SVD features were estimated from T1-weighted and FLAIR images while gcPWV was estimated from 4D flow MRI data. Additionally, the gcPWV’s stability to variations in field-of-view was analyzed. The gcPWV was 10.82 (3.94) m/s and displayed a significant correlation to WMH and white matter PVS volume (r = 0.29, p < 0.001; r = 0.21, p = 0.004 respectively from nonparametric tests) that persisted after adjusting for age, blood pressure variables, body mass index, ApoB/A1 ratio, smoking as well as cerebral pulsatility index, a previously suggested early marker of SVD. The gcPWV displayed satisfactory stability to field-of-view variations. Our results suggest that SVD is accompanied by changes in the cerebral arterial wall that can be captured by considering the velocity of the pulse wave transmission through the cerebral arterial network.
Keywords
Introduction
Cerebral small vessel disease (SVD) is believed to be a major contributor to dementia, cognitive decline and stroke among older people.1,2 Important MRI manifestations of SVD are white matter hyperintensities (WMH), microbleeds, perivascular spaces (PVS) and lacunes.3,4 These markers are not exclusive to SVD but can be seen in the population with an increasing occurrence with advancing age and vascular risk burden, particularly hypertension.1,5 The pathophysiology behind SVD is poorly understood but structural changes and stiffening of the cerebral vascular wall, that potentially stem from underlying cerebral vascular endothelial dysfunction, is considered to be a central part of the disease course. 6
The most frequently applied measure to study intracranial vascular stiffness is pulsatility index (PI), but this measure is unspecific and also depends on other factors such as downstream vascular resistance, potentially explaining why SVD markers appear to predate increases in PI. 7 In contrast, pulse wave velocity (PWV), the rate at which the systolic pressure wave propagates through the vasculature, is directly related to arterial stiffness/distensibility. 8 This measure is sensitive to structural changes in the vessel wall, that could be due to alterations in elastin content, collagen content, or/and an underlying endothelial dysfunction. 9 We have recently described a method to measure a global cerebral arterial PWV (gcPWV) based on 4D flow MRI 10 that could be suitable to characterize widespread stiffening that affects the medium to small cerebral arteries. The method utilizes the time-resolved blood flow velocity data from the cerebral vascular tree to find a PWV that best explains the depth-dependent delay in the velocity waveform.
Here, in a large population-based sample of older individuals we investigate whether cerebral arterial stiffness, assessed by gcPWV, is linked to WMH volume, PVS volume as well as lacune status. Furthermore, we examine the stability of gcPWV to variations in the spatial coverage of the 4D flow MRI sequence.
Materials and method
The study population
Subjects were originally recruited as a control group in a prospective epidemiological study investigating gait disturbances in older people of the population. 11 Subjects in the age range 66–85 were randomly selected from the Swedish population registry, and invited to participate if they did not have any subjective gait impairment. Two-hundred twenty-four were enrolled for MRI examinations. Eleven were unable to complete the MRI protocols, resulting in a control group of 213 older individuals (mean age: 75 years and range: 66–85, 79 women).
Prior to analysis, participants with a recorded heart rate indicative of bradycardia (less than 50 beats per minute) or tachycardia (higher than 100 beats per minute) during the 4D flow MRI data collection were excluded (N = 15). In addition, participants with poor cardiac gating during the 4D flow MRI measurements (N = 1), without blood pressure measurements (N = 2) or with failed FreeSurfer 6.1 volume segmentations (N = 5, see paragraph “Characterization of SVD features” below) were excluded. This created a final study population of 190 participants. Clinical features can be seen in Table 1.
Clinical features of the final study population.
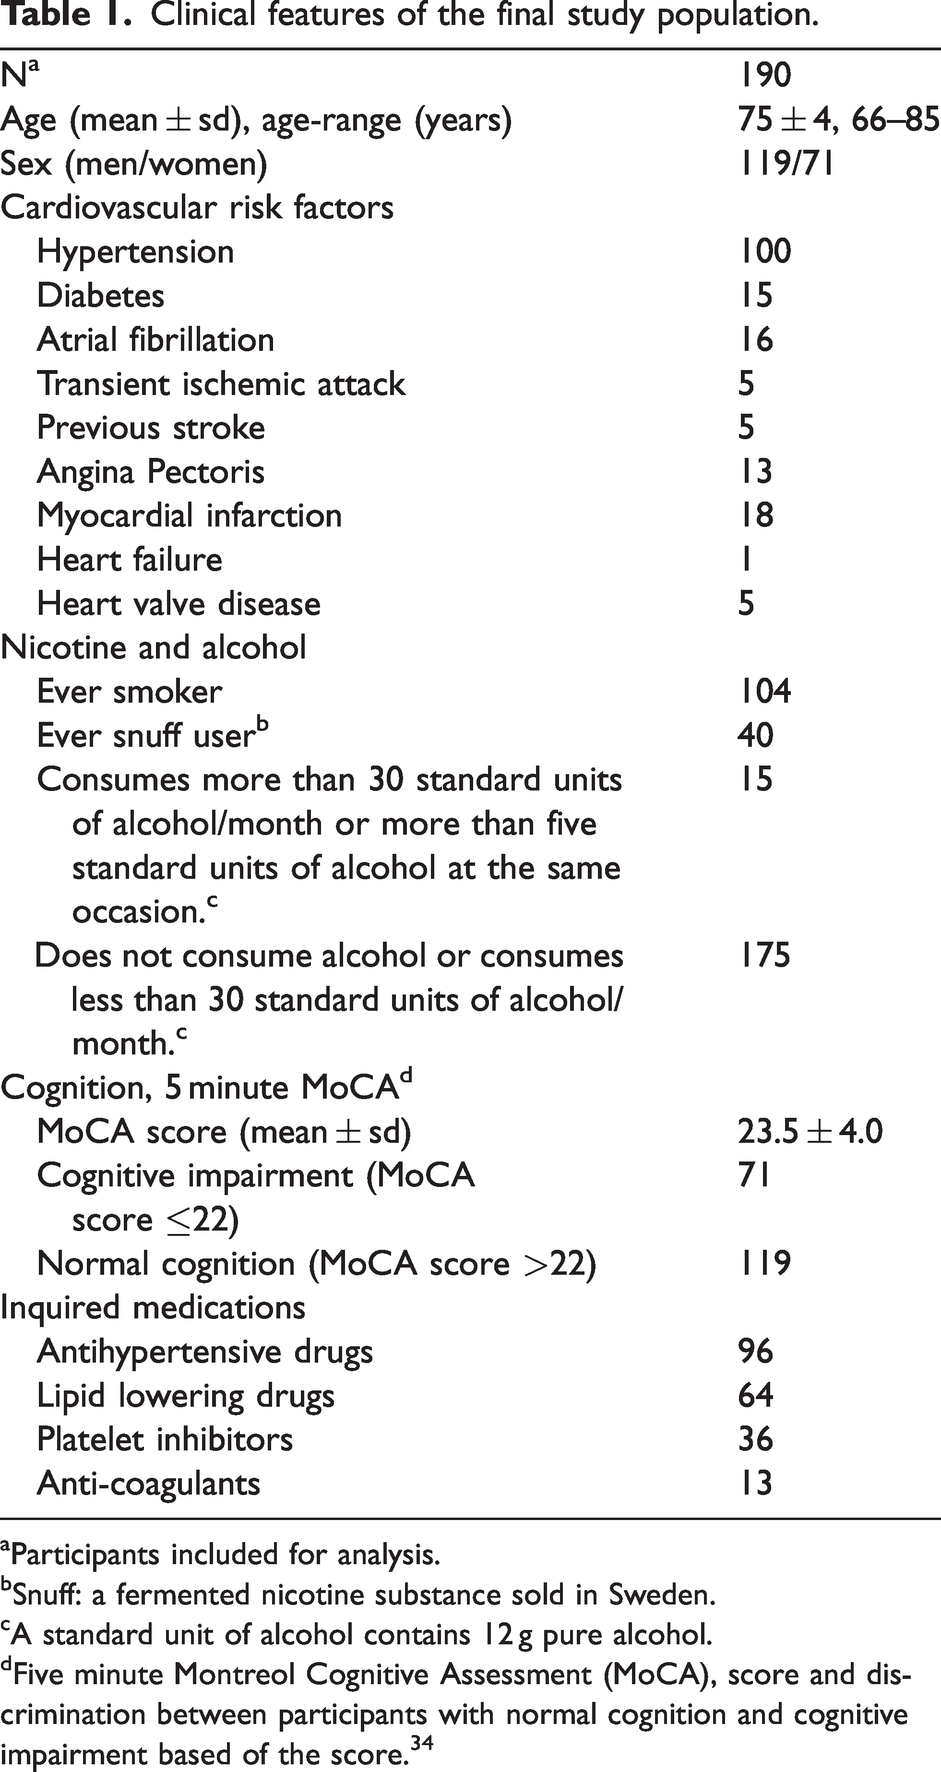
Participants included for analysis.
Snuff: a fermented nicotine substance sold in Sweden.
A standard unit of alcohol contains 12 g pure alcohol.
Five minute Montreol Cognitive Assessment (MoCA), score and discrimination between participants with normal cognition and cognitive impairment based of the score. 34
Ethics
The study was registered at clinicaltrials.gov (Dnr. NCT05204745) and conducted according to the 1964 declaration of Helsinki and its later amendments with approval from the regional ethical review board (Dnr. 2017/335-31 & 2017-528-32 M). Written and oral informed consent was obtained from all participants.
Blood pressure
Blood pressure was measured in the left arm. Measurements were taken at two separate occasions during the same day and averaged. The measurements were performed after rest (15 min) in a sitting position with unfolded legs and the feet on the ground.
4D Flow MRI
4D flow acquisitions with full brain coverage were performed without contrast injection on a 3T scanner (Discovery MR 750; GE Healthcare, Milwaukee, Wisconsin) with a 32-channel head coil utilizing the PC-VIPR sequence (a highly undersampled radial projection sequence acquiring time-resolved flow rates in three spatial directions, retrospectively gated to the cardiac cycle).
12
Data collection took approximately 9 minutes per participant and was performed with the following scan parameters: radial projections: 16,000; temporal resolution: 20 frames per cardiac cycle; five-point velocity encoding, velocity encoding sensitivity (
Anatomical MRI
T1-weighted (T1w) volumes were collected using a 3D fast-spoiled gradient-echo sequence (BRAVO). The scan parameters were: TR/TE/TI: 8.2/3.2/600 ms; flip angle: 10°; slice thickness: 1 mm; in-plane resolution: 1 mm; field of view: 25.6 × 25.6 cm, and phase acceleration: 2. 180 slices were acquired. T2 FLAIR volumes were collected using a 2D fast spin-echo sequence (PROPELLER). The scan parameters were: TR/TEeff/TI: 10000/112/2562 ms; Echo train length: 38; flip angle: 142°; slice thickness: 3 mm; in-plane resolution: 0.9 mm; field of view: 24.0 × 24.0 cm.
Data processing
The 4D flow MRI data was reconstructed to obtain velocity volumes in three spatial directions, a magnitude volume and a complex difference (CD) volume. To highlight small cerebral arteries the CD was refined through a vessel enhancing filter 13 (tau = 1). It then underwent a binarization (based on an intensity threshold at 2.5% of the global maximum) from which a branch representation of the vasculature was obtained by skeletonization and centerline processing. 14 The desired vasculature in the anterior cerebral circulation was obtained by manually removing other vasculature (such as bridging veins and venous sinuses as well as the posterior cerebral circulation). This was done using a region-of-interest (ROI) tool that allowed the operator (CB) to circle and remove included branches in sagittal, axial and coronal projections of the centerline representation of the vasculature. In addition, an algorithm was used to remove spurs not directly or indirectly connected to an internal carotid artery (ICA). The final centerline representation was then used to obtain the distance from the first proximal voxels in the ICAs to all subsequent voxels. The algorithm to assign a distance (i.e. depth in the vasculature) to each centerline voxel utilized the Euclidean pathlength between centerline voxels and operated in a step-wise manner. Since the root of each ICA functioned as a seed, each voxel was assigned two path length values. The shorter was kept as it was assumed to be the most representative path of the pulse wave. The negative impact on the gcPWV estimate from potentially assigning a voxel a distance from an ICA that was not the main blood supplier was assumed to be negligible due to the left-right symmetry of the circle of Willis.
An algorithm devised for 4D flow MRI
15
allowed us to obtain velocity data perpendicular to the vessel direction in cross-sections assigned to all voxels in the centerline representation. The direction was estimated by utilizing three consecutive voxels centered around the analyzed one. Each cross-section was interpolated by a factor two (to increase resolution) after which a ROI was obtained from a local intensity threshold in the enhanced CD cross-section. The threshold was set to 50% of the maximum vessel intensity to avoid partial volume effects. This was not expected to change the relative shape of the final velocity waveform (velocity over time) as all velocity voxels were expected to follow the same blood flow pattern based on a parabolic velocity profile. In each ROI, a velocity vector was obtained from the average velocities in x-, y- and z-direction for each temporal position of the cardiac cycle. Then, velocity waveforms were calculated by a dot product between the time-varying velocity vector and the vessel direction. Additionally, the area,
Characterization of SVD features
WMH and PVS volumes were derived from T1w images (WMH, here seen as hypointensities) while Fazekas score and lacunes were assessed in T2 FLAIR images. WMH and brain region segmentations were performed using FreeSurfer 6.1. The segmentations were visually inspected (JL) and participants with clear label failures due to anatomical brain abnormalities caused by previously known strokes lesions were excluded (N = 5). Additionally, five participants were exempt from specific analyses with either lacune status or Fazekas score due to the lack of T2 FLAIR data.
WMH volume was automatically extracted by FreeSurfer and evaluated as a whole as well as in the frontal, parietal, temporal and occipital lobes. Additionally, a visual rating of WMH burden (JB) was performed using the Fazekas scale, 16 subdivided in its periventricular and deep white matter components.
PVS volume was extracted in white matter (wmPVS) as well as in the basal ganglia (bgPVS) using an automatic post processing scheme. First, a filter designed to enhance tubular structures 13 was applied to the T1w-volume, returning a probability map of local tubularity (ranging between 0 to 100%). Then, PVS was evaluated within the combined FreeSurfer white matter and basal ganglia (consisting of the right and left caudate, putamen and pallidum) ROIs, eroded by a 2 mm spherical kernel to remove artefacts due to surrounding anatomical structures in the filtered T1w volume. The final PVS segmentation was then performed by using a global threshold within each anatomical region. The thresholds were determined by looking at the maximum correlation between segmented PVS volumes and manually extracted PVS counts, comparing different thresholds (ranging from 0 to 100% in steps of 1%). Visual rating was performed (JB) in accordance with Paradise et al. 17 on 24 subjects, that had both 4D flow MRI and T1w volumes available. T2 FLAIR images were used to differentiate PVS from lacunes. The final thresholds were 18% for bgPVS and 5% for wmPVS, achieving a correlation with manual ratings of r = 0.49 and r = 0.74 respectively.
Lacunes, as defined by STRIVE-2, 4 were manually counted (JB).
To calculate total SVD burden, a principal component analysis was performed on normalized WMH volume, white matter PVS volume, basal ganglia PVS volume and lacune status. The score in the first component, explaining 45% of the variance in the SVD features, was used as the global SVD score.
Pulse wave velocity estimation
Prior to performing the gcPWV estimation each velocity wave form was subtracted by its temporal mean velocity and scaled by the reciprocal of its standard deviation (
The 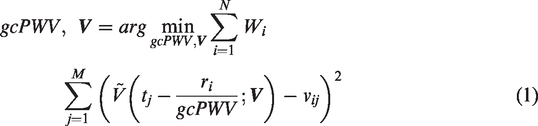
To evaluate the stability of the gcPWV to variations in the FOV, we altered the coverage in the inferior-superior direction in a step-wise fashion. The branching point between the ICA, the middle cerebral artery and the A1 segment was used as the center (mean value between the left and right side), from which the field-of-view was gradually increased by 7 voxels (corresponding to ∼5 mm) in each direction while all other parameters were kept constant. For each field-of-view the gcPWV was re-estimated using the vasculature continuous with the ICAs.
Pulsatility index estimation
Estimations of PI were performed on the original velocity waveforms obtained from the vascular cross-sections and calculated according to
Statistical analysis
gcPWV, WMH volumes and PVS volumes are reported as: median (interquartile range). Lilliefors tests were used to test for normality. Due to the results from the Lilliefors tests Spearman’s rank correlation and partial Spearman’s rank correlation were used to assess associations between two variables. In adjusted models, age, systolic blood pressure, diastolic blood pressure, body mass index, ApoB/A1 ratio, smoking and PI were entered as covariates. All tests were two-sided, p < 0.05 was considered statistically significant.
Results
The observed gcPWV was 10.82 (3.94) m/s (see Figure 1(a) for distribution). There was a modest association between gcPWV and diastolic blood pressure (r = 0.18, p = 0.01), but no association to systolic blood pressure (r = 0.05, p = 0.52), mean arterial pressure (r = −0.04, p = 0.11), pulse pressure (r = −0.04, p = 0.63), PI (r = 0.09, p = 0.24) or age (r = 0.06, p = 0.38). Median cerebral WMH volume was 2.46 (3.65) ml whereas the median PVS volumes were 1.00 (1.02) ml for wmPVS and 0.08 (0.12) ml for bgPVS (see Figure 1(b) to (d)). Twenty subjects had one or more lacunes.
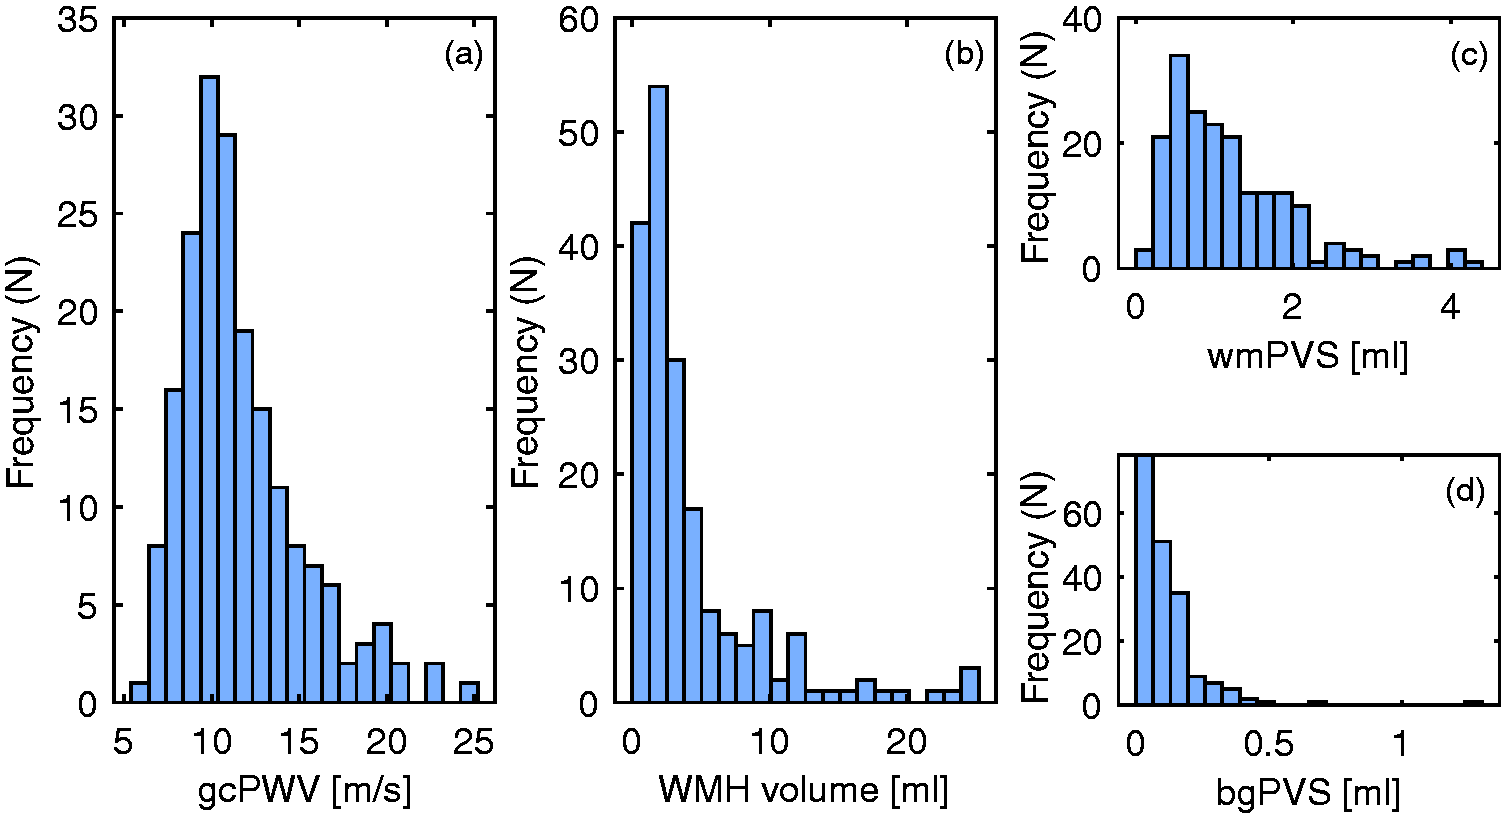
Histogram of the participants gcPWV (a), WMH volume (b), wmPVS volume (c) and bgPVS volume (d).
Examining the relationships between 4D flow measures and SVD parameters revealed that gcPWV was associated to global SVD score, WMH and wmPVS volumes (r = 0.24, p < 0.001, r = 0.29, p < 0.001 and r = 0.21, p = 0.004 respectively). PI was also associated to global SVD score, WMH and wmPVS volumes (r = 0.20, p = 0.005, r = 0.16, p = 0.02 and r = 0.24, p < 0.001 respectively). Importantly, the gcPWV associations to global SVD score, WMH and wmPVS volumes remained after adjusting for PI as well as age, blood pressure (systolic and diastolic), body mass index, ApoB/A1 ratio and smoking (r = 0.21, p = 0.004, r = 0.24, p = 0.001 and r = 0.16, p = 0.03, respectively). No such relationships were found between gcPWV and bgPVS (r = 0.09, p = 0.21) or gcPWV and lacunes (r = 0.08, p = 0.25). Further, considering associations between gcPWV and region specific WMH volume revealed significant correlations in the frontal (r = 0.28, p < 0.001), parietal (r = 0.25, p < 0.001) and temporal (r = 0.16, p = 0.02) lobes but not in the occipital lobe (r = 0.08, p = 0.26). In adjusted analyses, the detected associations in the frontal (r = 0.23, p = 0.002) and parietal (r = 0.21, p = 0.004) lobes remained, whereas the temporal lobe no longer displayed a significant association (r = 0.12, p = 0.10).
Manually assessed Fazekas scores displayed an expected correlation to WMH volume (r = 0.81, p < 0.001 for periventricular white matter and r = 0.61, p < 0.001 for deep white matter). Fazekas scores were also associated to gcPWV (r = 0.22, p = 0.003 and r = 0.15, p = 0.04 in periventricular- and deep white matter, respectively). Adjusting for age, blood pressure (systolic and diastolic), body mass index, ApoB/A1 ratio, smoking and PI, revealed slightly weaker associations where the association between gcPWV and Fazekas score in deep white matter was no longer significant (r = 0.18, p = 0.02 and 0.12, p = 0.10 for periventricular and deep white matter, respectively).
To evaluate whether the gcPWV-SVD association was differentially expressed depending on SVD severity, we considered participants in the high and low tertiles of the global SVD score. In both these groups, the association between gcPWV and global SVD score was observed at a similar magnitude (lower tertile group: adjusted r = 0.29, p = 0.033; higher tertile group: adjusted r = 0.27, p = 0.045). Furthermore, to examine the potential role of vasoactive substances on gcPWV, a subgroup of individuals reporting little/no alcohol and nicotine consumption (N = 81) was created. The gcPWV in this subgroup (median 11.0 m/s) was nearly identical to that of the original sample.
The field-of-view stability analyses (Figure 2) indicated that prescribing field-of-views covering less than ∼40 mm in the superior-inferior direction causes instabilities to the gcPWV estimations.
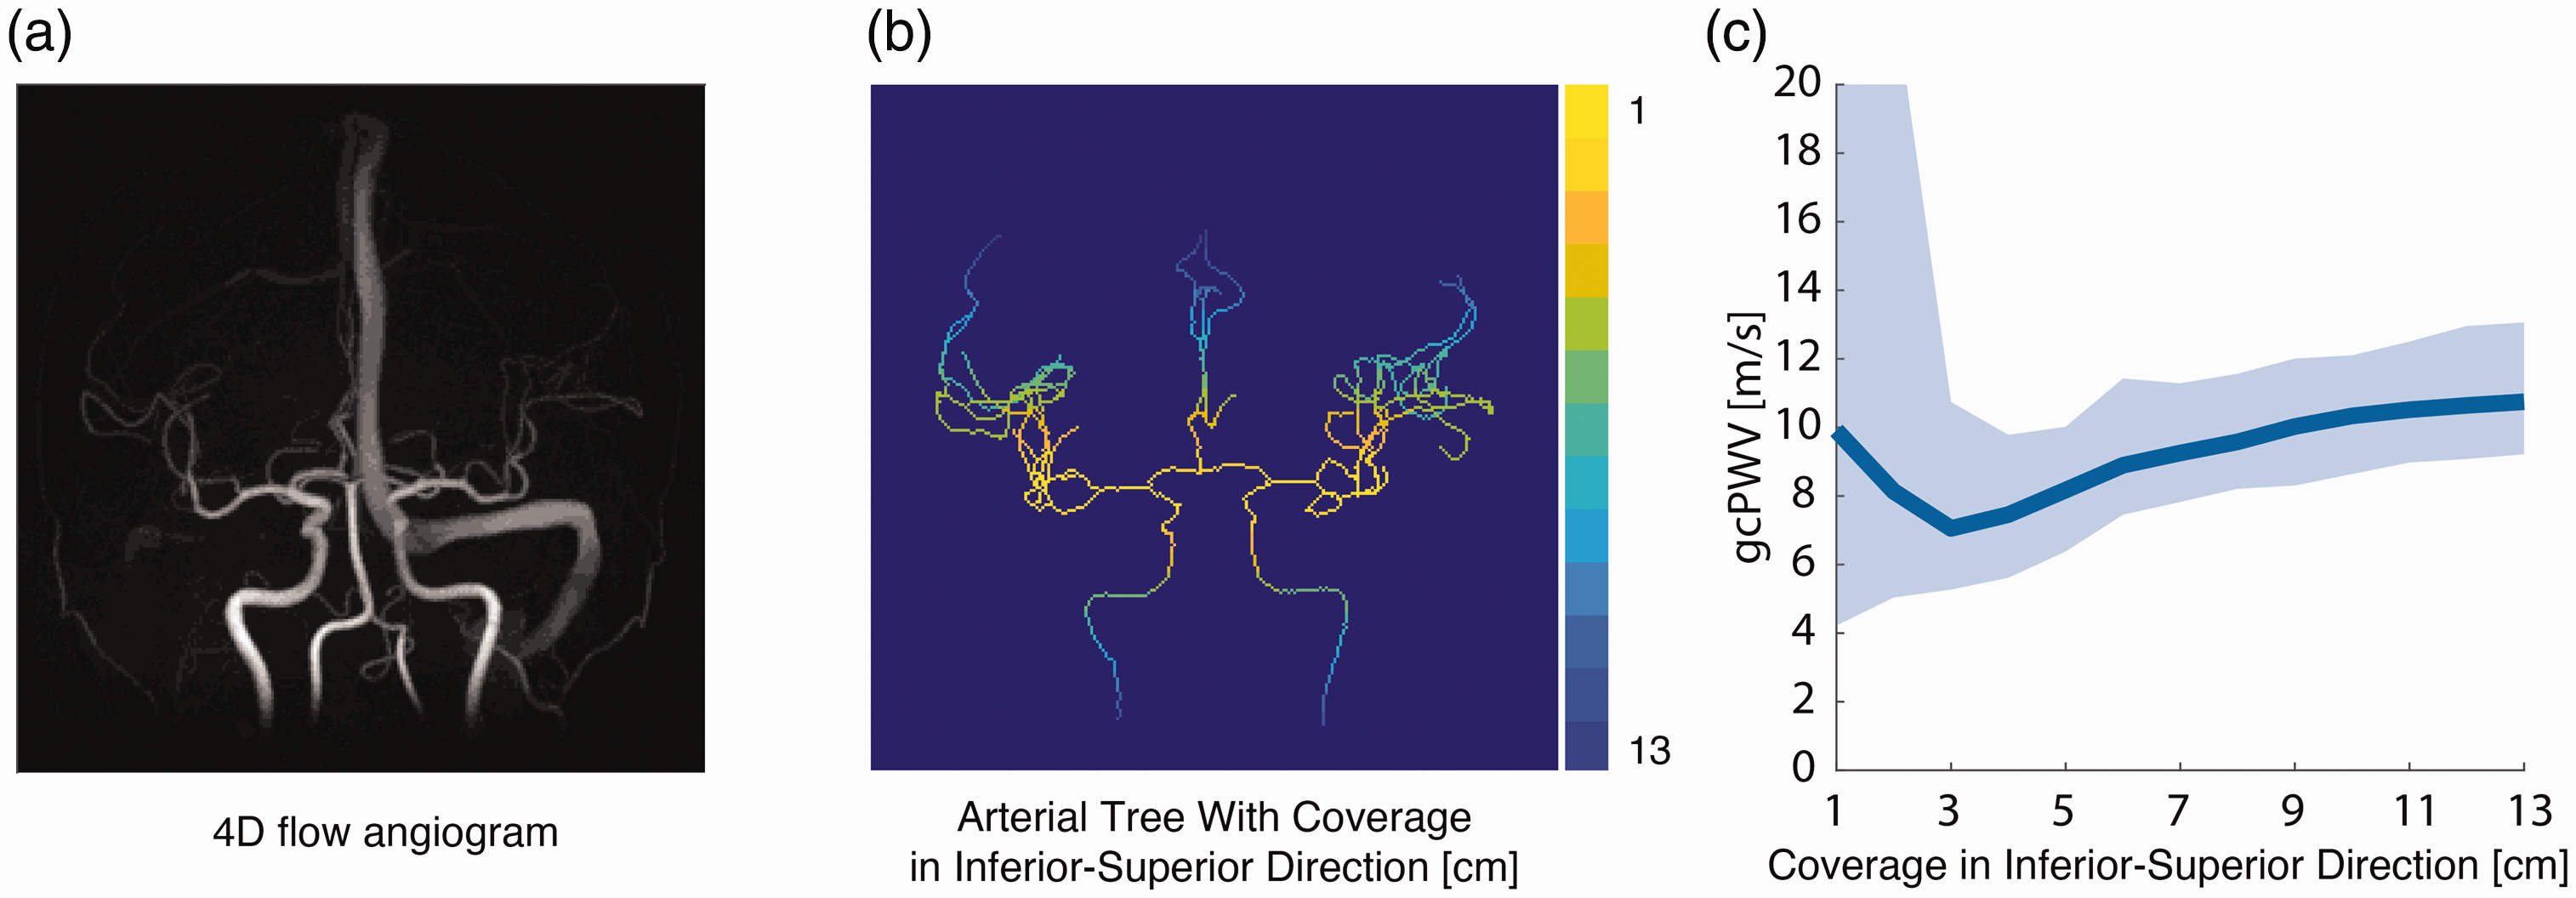
4D flow MRI angiogram (a). Image of the sections used in the gcPWV estimations. Yellow correspond to the smallest field-of-view in the inferior-superior direction, while dark blue represents the largest (b). The gcPWV obtaind for different coverage in the inferior-superior direction. The line represents the median and the shaded area corresponds to the interquartile range (c).
Discussion
In line with our hypothesis, individuals with larger WMH and PVS volumes displayed higher gcPWV, indicating that a common underlying mechanism is at play in the cerebral vasculature. This potentially warrants a discussion of whether SVD should be categorized as specifically affecting small vessels (arterioles, capillaries and venules) or be broadened to recognize involvement of additional vascular levels. Based on the observations of the current study, an important question to address will be whether increased cerebral arterial stiffness is an early event preceding the development of SVD, potentially enabling early detection and prevention.
The absence of gcPWV association to WMH in the occipital lobe makes CAA an unlikely contributor to our observations. 18 The fronto-parietal pattern instead favors a heterogenous mechanism involving atherosclerosis and Alzheimer's disease-related pathology.19,20 In such conditions, endothelial dysfunction, characterized by the impaired ability of the endothelium to regulate vascular tone, inflammation and barrier functions 2 could lead to lesion progression. PVS and WMH have also been suggested to depend on alterations in brain fluid clearance, 21 a mechanism that is believed to depend on vascular wall pumping of cerebrospinal fluid. 22 In that scenario, our results would point towards a breakdown of the pumping mechanism with vascular stiffening.
Surprisingly, gcPWV was not related to PI measured in the same arteries, systolic blood pressure or pulse pressure, but was positively related to diastolic blood pressure. The gcPWV thus contrasts with aortic PWV which is negatively related to diastolic pressure and positively related to systolic and pulse pressure. 23 Possibly this reflects that distal cerebral arterial stiffness does not directly influence blood pressure to the same extent as large artery stiffness. Instead, it is conceivable that the positive association between cerebral arterial stiffness and diastolic blood pressure reflects a blood pressure dependent remodeling or increased vascular tone of the distal arteries. Interestingly, indications of PI being a late manifestation rather than an early event in the progression of WMH and PVS, 7 together with the fact that gcPWV showed no association to PI but to WMH and wmPVS volumes, indicates that cerebral arterial stiffness could be an early event in the SVD pathophysiology. This suggests that gcPWV has the potential to be used as a biomarker for preventive measures. Furthermore, the observed gcPWV value was in line with previous results using this method in a similar age group (mean age: 79, age-range: 70–91, gcPWV: 10.7 (4.4) m/s). 10 Compared to other PWV approaches we believe that the obtained median gcPWV of 10.82 m/s is reasonable considering what has been reported by others in nearby vasculature utilizing different measurement approaches (7.9 ± 2.4 m/s for an elderly cohort, 62 ± 10 years, using 2D PC MRI 24 and 17.2 ± 7.4 m/s and for an elderly group, 73 ± 7 years, using 4D flow MRI 25 ).
A prerequisite for our analyses was that the gcPWV estimation did not critically depend on the extent of the vasculature available to the estimation. Such behavior would have introduced unwanted variability in the estimations depending on factors such as field-of-view placement and vascular velocities of individual subjects. Our analysis evaluating stability to field-of-view changes indicated robustness in gcPWV to drastic variations in the included vasculature. Still, small gradual changes in the median gcPWV could be observed as the field-of-view was changed. This could potentially be an effect of different elastin content at various levels of the vasculature, 26 suggesting that an improvement to the gcPWV calculation could be to standardize the extent of included vasculature. Specifically, we observed that below a field-of-view of roughly 4 cm in the inferior-superior direction, the variability in gcPWV values increased drastically suggesting instability of the estimations. With a field-of-view larger than 4 cm, the interquartile range was stable but the median gcPWV increased with increasing coverage. The sensitivity to the field-of-view was however lower for larger field-of-views, whereby our recommendation for future studies would be to attempt to include as much vasculature as possible in the estimation (ideally above ∼10 cm).
A limitation in the current design was that we could not consider the full spectrum of pathological changes typically seen in SVD. For example, cerebral microbleeds were not investigated as the required imaging was not available in this project. A second limitation concerned the quantitative value of the estimated volumes. FreeSurfers T1-based quantification of WMH volume has been shown to consistently underestimate cerebral WMH volume. However, it still displays an excellent correlation to gold-standard manual segmentation utilizing T2 and/or T2-FLAIR imaging (R∼0.9) 27 and should therefore be able to faithfully represent the association to gcPWV. Further, the current WMH volume is similar to that obtained in a similarly aged cohort from a study by Hotz et al.. 27 Regarding PVS, previous automatic extraction methods have shown a wide range of results (an average of 0.3 ml for a mean age of 85 years 28 as well as an average of 5 ml for a mean age 29 years 29 ) pointing towards rather substantial method biases. Crucially, the PVS extraction approach was consistent throughout the cohort, which should keep the effect on the association to gcPWV minimal. Further, the approach of using a hessian-based filter 13 has been validated before.7,30
An additional limitation was the cross-sectional design of the study. This prevented us from determining whether increased cerebral arterial stiffness truly precedes or develops at a more delayed time in the course of SVD pathophysiology progression. We also could not determine the effect on gcPWV from physiological mechanisms affecting vascular tone, such as autoregulation. However, regarding potential influences from vasoactive substances, we considered a subsample of individuals with little/no alcohol and nicotine consumption and found a similar gcPWV to that of the original sample. It is also perceivable that caffeine could bias gcPWV measurements, however, it has been shown that WMH volumes lacks associations to caffeine consumption. 31 Therefore potential caffeine induced gcPWV biases should not cause false associations.
No consideration was taken to medications. It has for example been suggested that successful treatment of hypertension reduces the risk for severe WMHs 32 and that statin therapy could improve arterial elasticity. 33 It should furthermore be noted that the participants did not suffer from high levels of SVD burden and that these results do not necessarily speak for associations in cases with severe SVD. However, the association to gcPWV was found for both the participants in the lower and higher tertile groups. This observation suggests that gcPWV is sensitive to a pathological mechanism that influences both early and more advanced pathological SVD changes.
In conclusion, our observations identify gcPWV as independently related to SVD features in a population-based cohort of older individuals, indicating its potential as an early imaging biomarker in SVD. Stability of the gcPWV estimation to variations in post-processing indicates robustness of the method and supports that a single measure is able to capture meaningful interindividual variability in general cerebral arterial stiffness.
Footnotes
Funding
The author(s) disclosed receipt of the following financial support for the research, authorship, and/or publication of this article: This work was supported by the Swedish Foundation for Strategic Research [grant number RMX18-0152]; the Swedish Heart-Lung Foundation (Hjärt-Lungfonden)[grant numbers 20180513, 20210653]; the Swedish Brain Foundation (Hjärnfonden)[grant number F2022-0216]; the Swedish Research Council [grant number 2017-04949_VR; 2022-04263_VR]; and a regional agreement between Umeå University and Västerbotten County Council (ALF)[grant number 7004343]. The FreeSurfer analysis was enabled by resources provided by the Swedish National Infrastructure for Computing (SNIC) at High Performance Computing Center North (HPC2N), partially funded by the Swedish Research Council [grant number 2016-07213].
Data availability
Data is available from the corresponding authors upon reasonable request.
Acknowledgements
The authors wish to acknowledge Kristin Nyman, Hanna Ackelind and Rebeca Axelsson for their contributions to the data collection.
Declaration of conflicting interests
The author(s) declared no potential conflicts of interest with respect to the research, authorship, and/or publication of this article.
Authors’ contributions
JM, AE and AW acquired funding for the project. CB and AW proposed and developed the method with crucial input from all co-authors. CB and AW performed the image post-processing and statistical analysis. CB, AE, JL, WH, JB, AG, SQ, LOK, JM, and AW made a substantial contribution to the concept and design of the study, interpretation of data, revised the manuscript for important intellectual content and approved the final version to be published.