
Abstract
We examined the relationship between white matter hyperintensities (WMH) and cortical neurodegeneration in cerebral small vessel disease (CSVD) by investigating whether cortical thickness is a remote effect of WMH through structural fiber tract connectivity in a population at increased risk of CSVD. We measured cortical thickness on T1-weighted images and segmented WMH on FLAIR images in 930 participants of a population-based cohort study at baseline. DWI-derived whole-brain probabilistic tractography was used to define WMH connectivity to cortical regions. Linear mixed-effects models were applied to analyze the relationship between cortical thickness and connectivity to WMH. Factors associated with cortical thickness (age, sex, hemisphere, region, individual differences in cortical thickness) were added as covariates. Median age was 64 [IQR 46–76] years. Visual inspection of surface maps revealed distinct connectivity patterns of cortical regions to WMH. WMH connectivity to the cortex was associated with reduced cortical thickness (p = 0.009) after controlling for covariates. This association was found for periventricular WMH (p = 0.001) only. Our results indicate an association between WMH and cortical thickness via connecting fiber tracts. The results imply a mechanism of secondary neurodegeneration in cortical regions distant, yet connected to subcortical vascular lesions, which appears to be driven by periventricular WMH.
Keywords
Introduction
White matter hyperintensities of presumed vascular origin (WMH) are the most common radiological marker of cerebral small vessel disease (CSVD). 1 WMH are associated with various clinical sequelae like dementia, cognitive impairment, mood disorders, mortality, an increased risk of stroke, and worsened recovery from stroke.2–4 Supporting the hypothesis of damage to small perforating arteries in CSVD, major contributors for the development of WMH are atherosclerosis and cardiovascular risk factors like age, hypertension and smoking. 3 , 5 , 6
Global cortical atrophy is another recurring pathology in CSVD and found to be associated with the extent of WMH in whole-brain and region-specific analyses.7–9 This association appears to contain a location-dependent component, since spatial patterns of cortical thinning were identified for WMH located either in periventricular (pWMH) or deep white matter (dWMH). 8 , 10
The hypothesis of secondary cortical degeneration through damaged white matter tracts indicates a direct pathophysiological link between WMH and cortical thickness.11–13 In subcortical stroke and CADASIL patients, cortical thinning occurred in brain regions distant, yet connected to subcortical lesions through degenerated white matter tracts.14–16 Based on these observations, we investigate the impact of WMH on cortical thickness through white matter connectivity in a population at increased risk for cardiovascular diseases. We hypothesize that a higher connectivity between WMH and cortical regions is associated with reduced grey matter thickness in these areas after adjusting for the overall connectivity and lesion load. We further distinguished between pWMH and dWMH connectivity on the cortex to underpin possible location dependent effects of WMH on cortical thickness.
Material and methods
Study design and participants
Data from participants of the Hamburg City Health Study (HCHS) was selected for this analysis. HCHS is a single center, prospective, epidemiologic cohort study with emphasis on imaging to improve the identification of individuals at increased risk for major chronic diseases and to improve early diagnosis and survival. A detailed description of the overall study design was published separately. 17 In brief, 45,000 citizens of the city of Hamburg, Germany, between 45 and 74 years are invited to an extensive baseline evaluation. A subgroup of participants with increased risk for cardiovascular diseases undergoes a standardized MRI brain imaging protocol. Specifically, this subgroup is selected based on the presence of cardiovascular risk factors using the Framingham Risk Score. 18 For this study, we analyzed the first 1,000 brain MRI datasets from participants of the HCHS at the time of baseline visit. Imaging data of insufficient quality for white matter segmentation and reconstruction of white matter fibers were excluded.
The local ethics committee of the Landesärztekammer Hamburg (State of Hamburg Chamber of Medical Practitioners, PV5131) approved the HCHS, and written informed consent was obtained from all participants. The study has been registered at ClinicalTrial.gov (NCT03934957). The HCHS design ensures that all involved individuals abide by the ethical principles described in the current revision of the Declaration of Helsinki, by Good Clinical Practice (GCP) and by Good Epidemiological Practice (GEP).
Magnetic resonance imaging
Images were acquired using a 3 T Siemens Skyra MRI scanner (Siemens, Erlangen, Germany). For single-shell diffusion weighted imaging (DWI), 75 axial slices were obtained covering the whole brain with gradients (b = 1,000 s/mm2) applied along 64 noncollinear directions with the following sequence parameters: repetition time (TR) = 8500 ms, echo time (TE) = 75 ms, slice thickness (ST) = 2 mm, in-plane resolution (IPR) = 2 × 2 mm2, anterior-posterior phase-encoding direction. For 3 D T1-weighted anatomical images, rapid acquisition gradient-echo sequence (MPRAGE) was used with the following sequence parameters: TR = 2500 ms, TE = 2.12 ms, 256 axial slices, ST =0.94 mm, and IPR = 0.83 × 0.83 mm2. 3 D T2-weighted fluid attenuated inversion recovery (FLAIR) images were acquired with the following sequence parameters: TR = 4700 ms, TE = 392 ms, 192 axial slices, ST = 0.9 mm and IPR = 0.75 × 0.75 mm.
WMH segmentation
For segmentation of WMH, we used FSL’s Brain Intensity AbNormality Classification Algorithm (BIANCA), a fully automated, supervised k-nearest neighbor (k-NN) algorithm. 19 The training dataset comprised WMH masks for the first 100 participants generated by selecting only voxels that had been marked by two experienced investigators (CM and MP) independently with manual segmentation. Mean Dice Similarity Index for manual WMH segmentations of the training data was 0.63. Derived masks of WMH were divided into periventricular (pWMH) and deep (dWMH) by defining a 10 mm distance threshold to the ventricles. 20 , 21 WMH load was calculated as the fraction of whole brain tissue volume (excluding ventricle volume). The algorithm was trained on multiple modalities by including both T1-weighted and FLAIR images to the algorithm. Additionally, spatial information of each voxel was implemented in the algorithm after linear registration to MNI space.
Probabilistic tractography
Whole-brain streamlines were reconstructed using anatomically constrained probabilistic streamlines tractography (ACT) by second order integration over fiber orientation distributions (iFOD2) using the publicly available MRtrix 3 toolbox.22–24 Dynamic seeding was applied. 25 This approach addresses the uncertainty in the calculation of the fiber orientations in each voxel and is constrained to anatomical priors to improve the biological plausibility of the tractography. Specifically, white matter fibers were reconstructed by starting probabilistic streamlines strategically in the white matter, producing streamline bundles that match the distribution of modelled fiber directions in every voxel. In addition, the reconstructed streamline densities were matched and adjusted with fiber density estimated from the diffusion model for each voxel.
Analysis of cortical thickness and connectivity to WMH
Figure 1 illustrates the methodological approach of our study. Cortical surface areas were defined, and cortical thickness was measured on T1-weighted imaging data using the standardized Freesurfer processing pipeline (Version 5.3). 26 Three steps were applied to calculate connectivity of WMH with the cortical surface: (1) an individual tractogram containing all streamlines was reconstructed based on the whole-brain tractography as described above. At their cortical terminations, all streamlines were counted at each cortical vertex; the number of terminating streamlines was taken as a measure of connectivity at corresponding cortical areas (Figure 1(a)); (2) WMH segmentations generated previously were used to filter only the streamlines passing through at least one voxel with WMH. Analogous to step 1, the number of filtered streamlines was used as a measure of connectivity to WMH, calculated at each cortical vertex and normalized with respect to whole-brain connectivity to account for physiological disparities in regional connectivity of the cerebral cortex (Figure 1(b)). For simplicity, this connectivity to hyperintensities proportional to the overall connectivity is simply referred to as WMH connectivity; (3) the second step was repeated for previously generated masks of deep and periventricular WMH separately. The extracted connectivity from these masks is further referred to as dWMH and pWMH connectivity (Figure 1(c)). Of note, “dWMH and pWMH connectivity” in our study is not applied as a surrogate marker of structural white matter integrity since these measures do not relate to specific, predefined white matter tracts. They rather characterize the connectivity profile of cortical brain areas, specifically in relation to the probability of connectivity to WMH. To facilitate subsequent statistical analysis and anatomical mapping, vertex-vise connectivity was summarized with regard to 210 distinct brain regions of the connectivity-based Brainnetome atlas. 27 To assess regional patterns of connectivity to the different types of WMH, the regions were sorted in descending order according to their median connectivity to WMH, pWMH and dWMH.
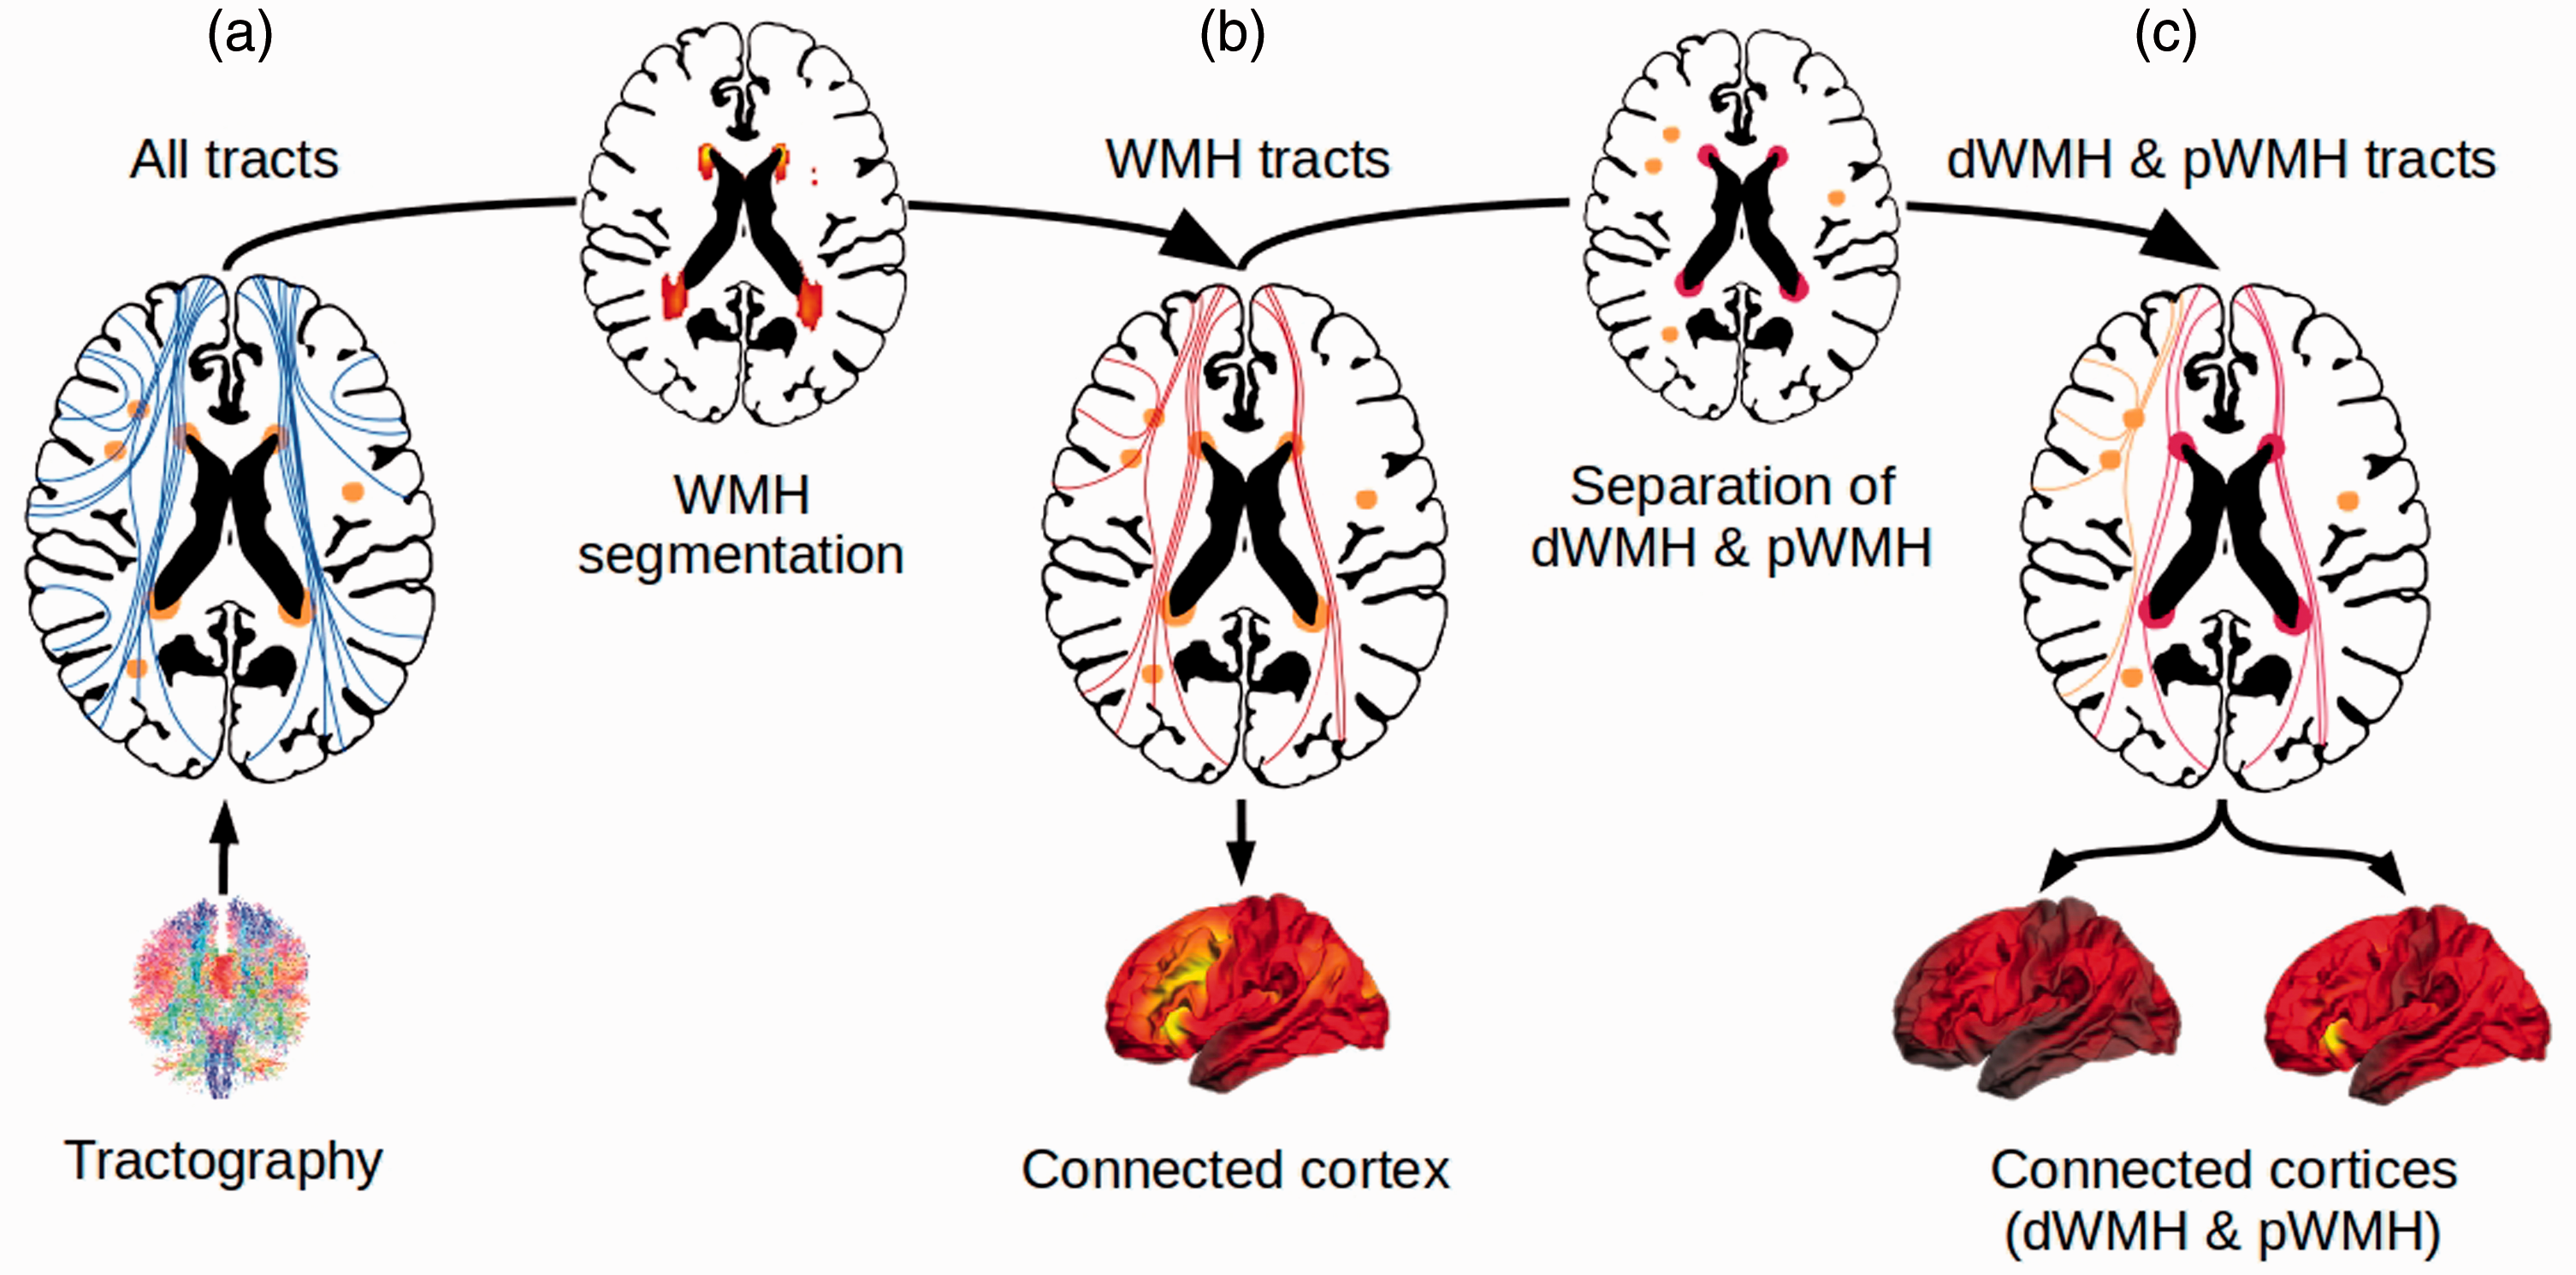
Methodological approach of the generation of a WMH connectivity pattern to the cortical surface. Whole-brain tractograms were calculated for all individuals using anatomically constrained probabilistic tractography (a). All WMH were automatically segmented with a k-nearest neighbor algorithm and the segmentation was used to select only the streamlines passing through at least one voxel with WMH, visualized in (b). Derived masks of WMH were divided into pWMH and dWMH by a 10mm distance threshold to the ventricles. These masks were used to further select streamlines crossing dWMH and streamlines crossing pWMH, shown in (c). Abbreviations: dWMH = deep white matter hyperintensities, mm = millimeter, pWMH = periventricular white matter hyperintensities, WMH = white matter hyperintensities.
Statistical analysis
Demographic data of all participants was recorded, and the median of demographic and imaging data was calculated together with the interquartile range.
For the primary analysis, two linear mixed-effects models were fitted both including cortical thickness as the dependent variable and fixed effects age, sex (female, male) and hemisphere (right or left) to control for their known association with cortical thickness. In addition, random effects for participants and cortical region were introduced to control for inter-individual and regional variability in cortical thickness.28–30 For the first model (“Model 1”) analyzing the impact of WMH connectivity on cortical thickness, values of WMH connectivity was included as an independent variable together with modelling of random slopes for a hypothesized region-specific effect size of the WMH connectivity and lesion load. The second model (“Model 2”) analyzed the impact of deep and periventricular WMH connectivity on cortical thickness and therefore included dWMH and pWMH connectivity as independent variables with modelling of random slopes for an assumed region-specific effect of dWMH and pWMH connectivity and lesion load. All statistical analysis was carried out using R (Version 3.5.1). 31
Results
Study sample characteristics
We considered MRI data from the first 1000 participants of HCHS for inclusion in this study. Of those, 21 participants were excluded due to missing imaging data (9 no imaging data at all, 3 FLAIR, 9 DWI), 40 participants were excluded due to poor quality or incompleteness of imaging data (39 DWI, 1 FLAIR) and in 9 participants, image processing was unsuccessful for technical reasons. The final sample for this study comprised 930 participants (424 females; 45.6%) with a median age of 64 (IQR = 14, range 46–76) years. Median brain volume was 1,484 ml (203), median WMH 0.6 ml (1.4), median pWMH 0.5 ml (1.1) and median dWMH 0.1 ml (0.2). Demographic and imaging data are summarized in Table 1.
Sample characteristics and image analysis results.
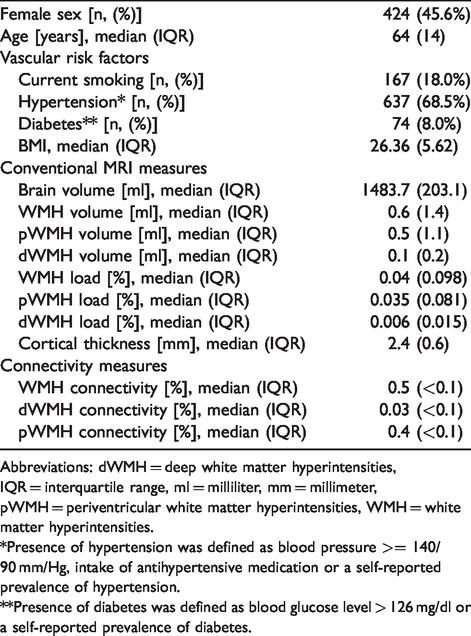
Abbreviations: dWMH = deep white matter hyperintensities, IQR = interquartile range, ml = milliliter, mm = millimeter, pWMH = periventricular white matter hyperintensities, WMH = white matter hyperintensities.
*Presence of hypertension was defined as blood pressure >= 140/90 mm/Hg, intake of antihypertensive medication or a self-reported prevalence of hypertension.
**Presence of diabetes was defined as blood glucose level > 126 mg/dl or a self-reported prevalence of diabetes.
Distribution of cortical connectivity to WMH
Connectivity to WMH was averaged over all participants and visualized as a projection on the cortical surface in Freesurfer average space for all WMH as well as pWMH and dWMH, separately. As illustrated in Figure 2, distinct patterns with regional differences in connectivity to WMH can be observed. In general, WMH demonstrated high connectivity with cortical regions of the frontal and occipital lobes with lesser and more sparse connectivity to parietal and temporal lobes (Figure 2(a)). In reference to the Brainnetome anatomical atlas, cortical regions with the highest connectivity were almost exclusively located in the frontal, occipital, limbic and insular cortex with less connectivity to cortical areas at the parietal and temporal lobes. Cortical areas with the highest connectivity to WMH were located at the cingulate gyrus (Brainnetome atlas region A32p and A32sg), orbital gyrus (A12/47l, A12/47o), inferior frontal gyrus (A44op), medio-ventral occipital cortex (vmPOS, rCunG, cCunG) and superior frontal gyrus (A9m, A10m). WMH connectivity to periventricular WMH demonstrated a similar pattern with highest connectivity observed in the frontal and occipital lobes and lesser connectivity located at the parietal and temporal cortices (Figure 2(b)). In contrast, deep WMH connectivity analysis resulted in a different cortical pattern. As illustrated in Figure 2(c), connectivity of dWMH was generally lower compared to pWMH and demonstrated a more homogeneous distribution over the cortical surface. In respect to the Brainnetome atlas, cortical regions with the highest dWMH connectivity were distributed without a preference for a specific lobe.
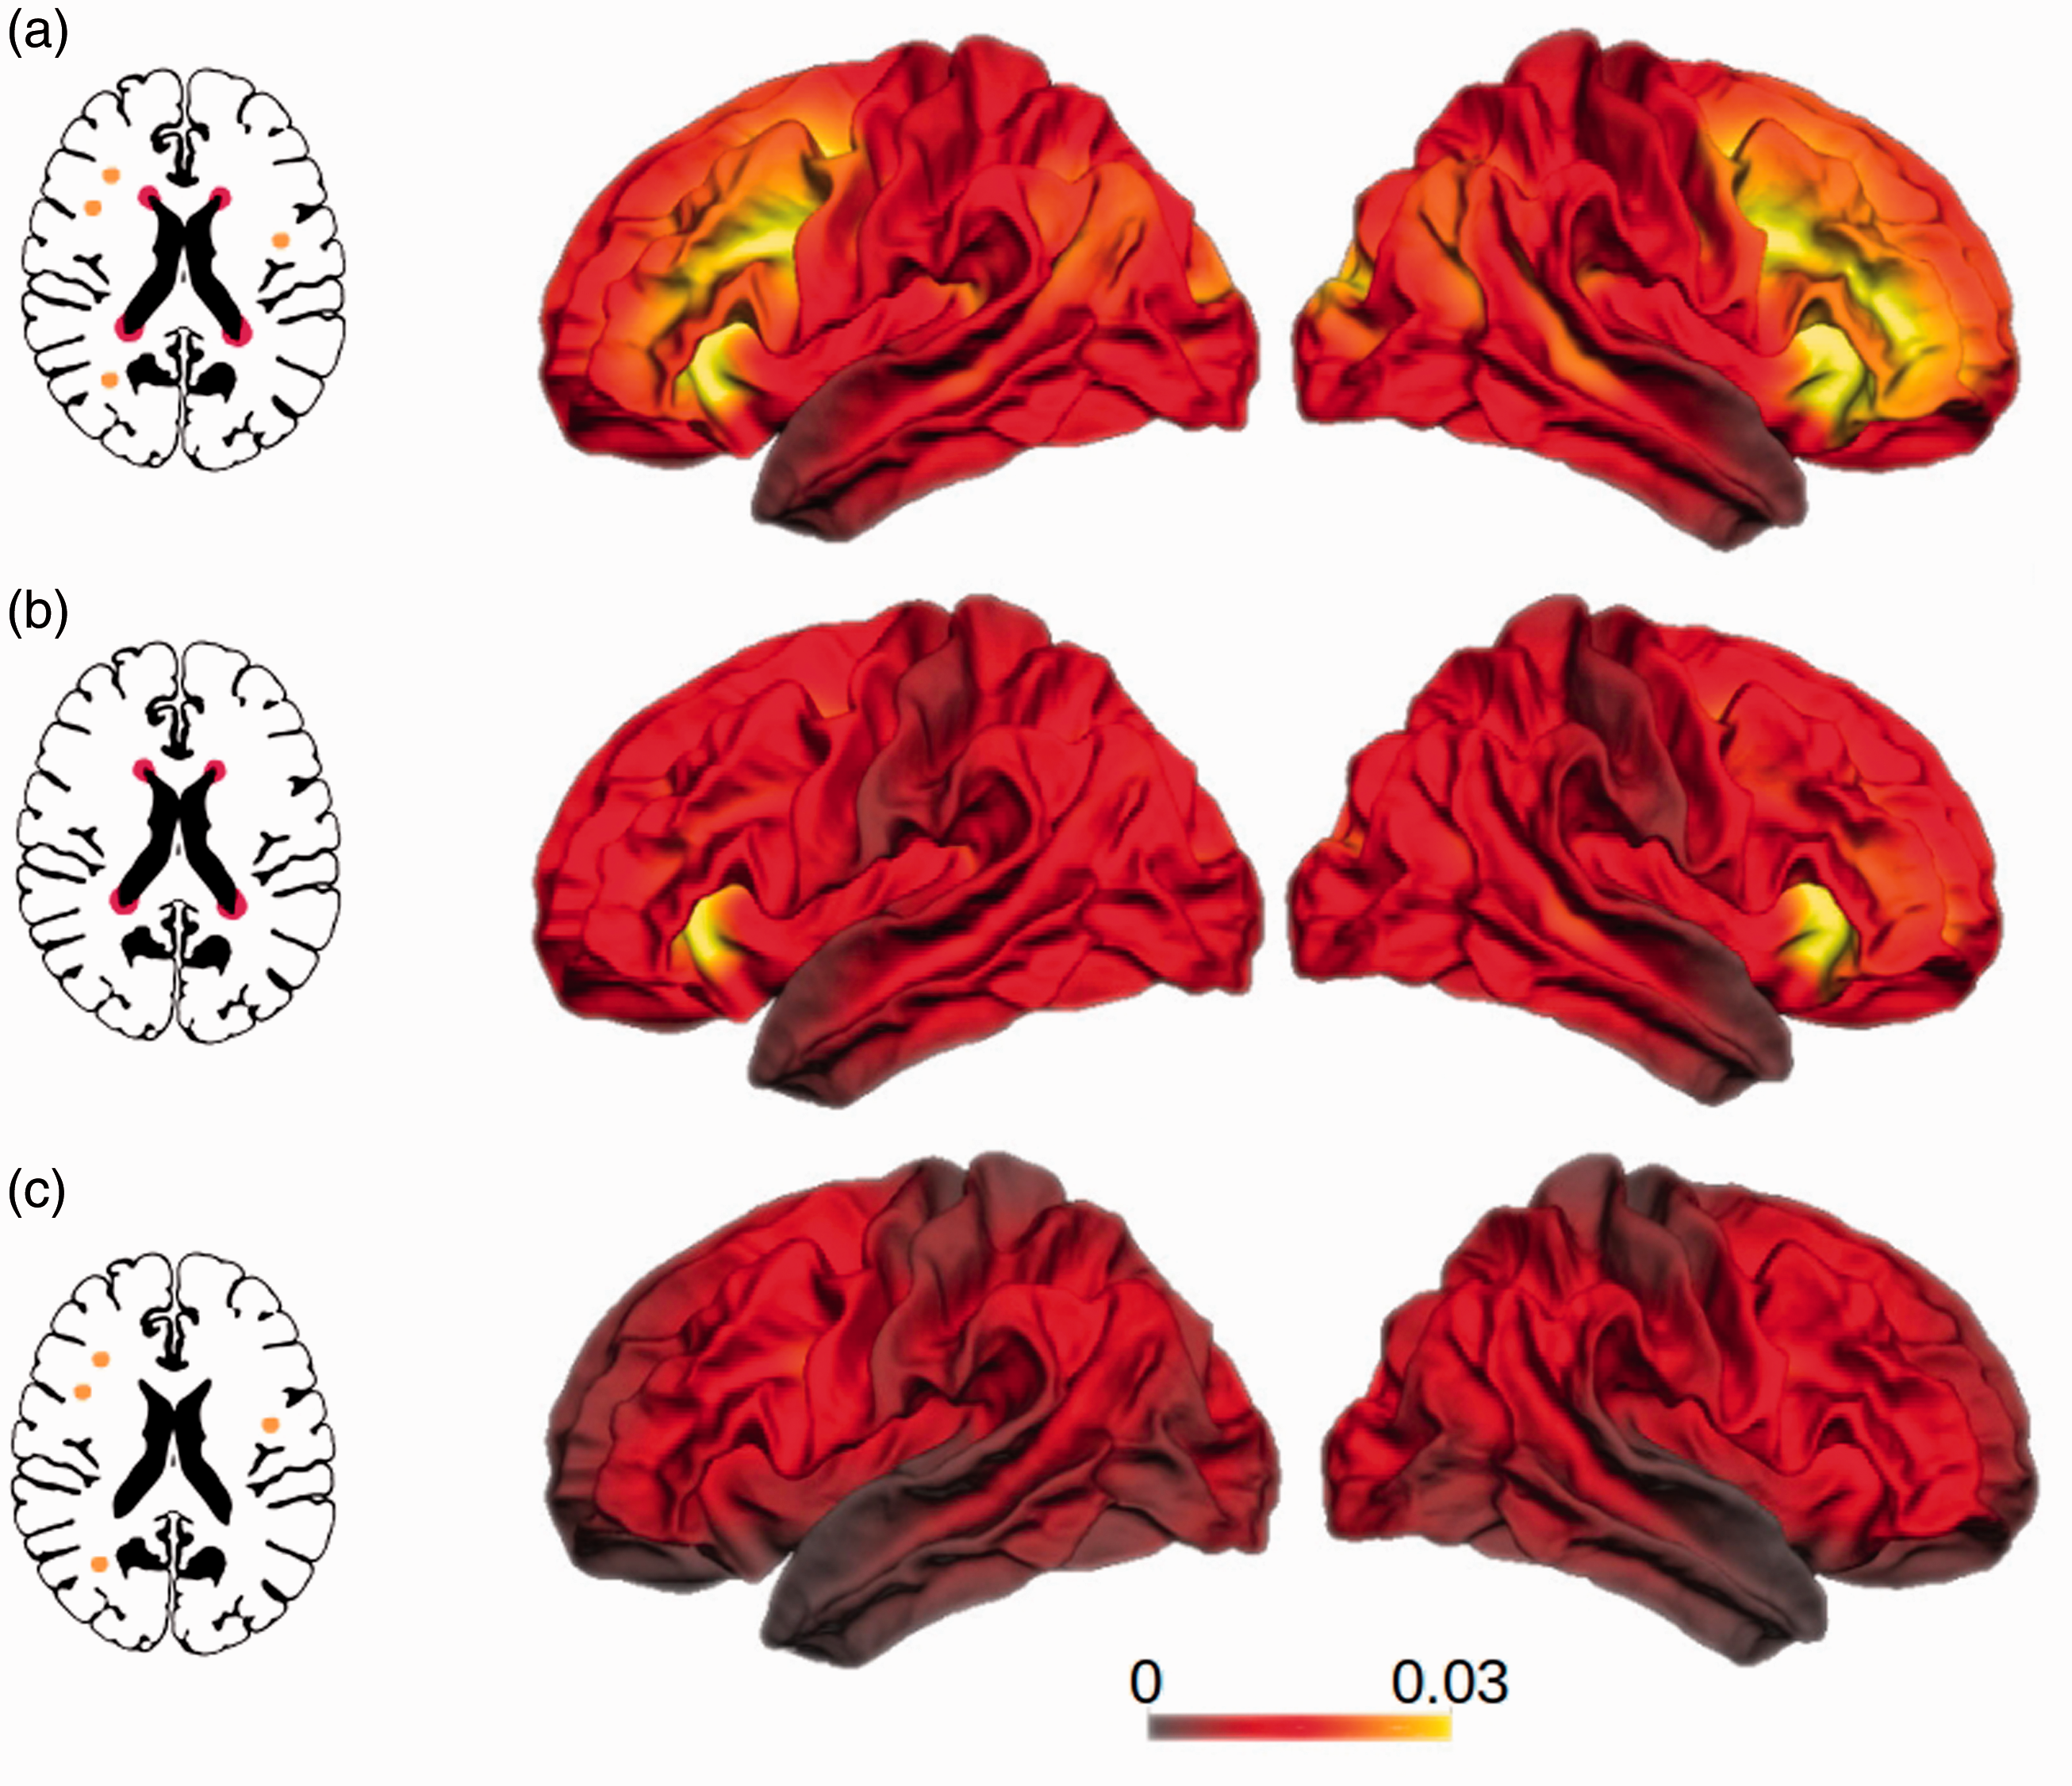
WMH cortical connectivity pattern grouped by WMH location. Frequency of cortical terminations of white matter tracts reconstructed by probabilistic tractography passing through white matter hyperintensities relative to all streamlines terminating in the respective vertex. Shown are connectivity patterns for white matter tracts passing through (a) all WMH as well as (b) periventricular white matter hyperintensities and (c) deep white matter hyperintensities. Color bars indicate the proportion of streamlines passing through a WMH on vertex level. This vertex-wise connectivity was only used for visualization, the statistical model includes the WMH connectivity summarized in 210 cortical regions. Please see Figure 1 for the methodological approach.
Connectivity to WMH and cortical thickness
Results from mixed-effect linear models including connectivity of all WMH (Model 1) or pWMH and dWMH separately (Model 2) are shown in Table 2. In detail, Model 1 revealed a negative association between WMH connectivity and cortical thickness controlled for age, sex, hemisphere, region and participant (t(49.12) = −2.71, p = 0.009). Further factors associated with decreased cortical thickness were male sex (t(92.62) = 4.64, p < 0.001), left hemisphere (t(19.24) =7.89, p < 0.001), higher age (t(92.65) = −12.27, p < 0.001), and higher lesion load (t(93.33) = −2.82, p = 0.005).
Results of linear mixed-effect models controlled for random effects.
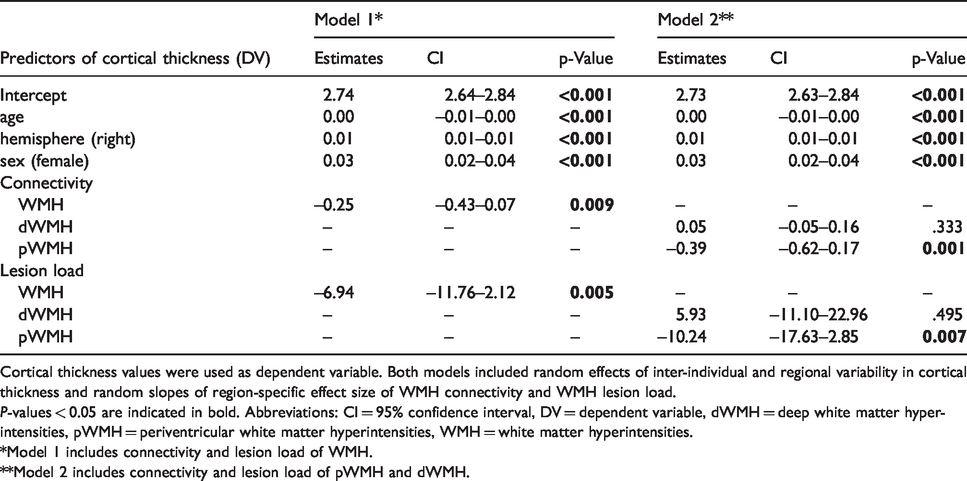
Cortical thickness values were used as dependent variable. Both models included random effects of inter-individual and regional variability in cortical thickness and random slopes of region-specific effect size of WMH connectivity and WMH lesion load.
P-values < 0.05 are indicated in bold. Abbreviations: CI = 95% confidence interval, DV = dependent variable, dWMH = deep white matter hyperintensities, pWMH = periventricular white matter hyperintensities, WMH = white matter hyperintensities.
*Model 1 includes connectivity and lesion load of WMH.
**Model 2 includes connectivity and lesion load of pWMH and dWMH.
For Model 2, the linear mixed-effects model including the connectivity to the deep and periventricular WMH as independent variables, the pWMH revealed to have a negative association with cortical thickness (t(62.33) = −3.38, p = 0.001). Both the connectivity of dWMH (p = 0.333) and lesion load of dWMH (p = 0.495) were not significant associated with cortical thickness. All other effects were associated with a decreased cortical thickness in male participants, in the left hemisphere, with higher age and with higher periventricular lesion load (sex: t(92.53) = 4.4, p < 0.001; hemisphere: t(19) = 7.78, p < 0.001; age: t(92.57) = −11.9, p < 0.001; periventricular lesion load: t(94.45) = −2.72, p = 0.007).
Discussion
Our study of topographical associations between white matter hyperintensity connectivity and cortical thickness provides two major results. First, WMH demonstrated a distinct pattern of connectivity to cortical regions with stronger connections to occipital and frontal brain areas with specific connectivity patterns for deep and periventricular WMH. Second, higher probability of connectivity between WMH and the cerebral cortex was associated with lower cortical thickness suggesting a direct relationship between the white matter lesions and cortical atrophy. This association was specifically found for periventricular lesions after adjusting for global connectivity, WMH lesion volume, and demographic factors.
In our study, we found thinner cortical regions associated with higher connectivity to WMH. These findings are in line with a previous report of cortical thinning and white matter connectivity to subcortical white matter lesions in CADASIL, a genetic disorder with autosomal dominant hereditary transmission characterized by cerebral arteriopathy with subcortical infarcts and leukoencephalopathy. 15 In this work, cortical atrophy was shown to be specifically prominent in regions with a higher probability of connectivity to subcortical infarcts compared to unconnected cortical areas. Similar remote effects of isolated stroke lesions on distant, yet connected cortical areas were found in stroke patients, where cortical thinning occurred as a result of secondary degeneration of inter- and intrahemispheric white matter tracts. 16 However, studies on the longitudinal association of WMH burden and cortical thickness are contradictory. Several studies demonstrated a pronounced longitudinal decline in cortical thickness related to higher burden of WMH volume, whilst a cohort study found no longitudinal effect of WMH on cortical atrophy in a large group of elder community-dwelling subjects.32–34
We further studied distinct connectivity profiles of periventricular and deep WMH and observed differences in the association with cortical thickness according to the topological classification of WMH. Cortical thickness was significantly lower with stronger connectivity to pWMH while the connectivity to dWMH had no impact on cortical thickness. In line with this, the lesion load of pWMH had a significant impact on cortical thickness, while the lesion load of dWMH did not. The distinction between periventricular and deep white matter hyperintensities is of great importance when analyzing the effect of WMH on cortical thickness since pWMH and dWMH are known to differ both in the effect on cortical thickness and in their clinical manifestation. While pWMH are known to mainly affect cognitive functioning including general cognitive decline and mental processing speed, dWMH had no effect on cognition but increases the risk of developing depressive symptoms, late-onset depression and vascular dementia.35–38 Additionally, previous literature found that a higher pWMH volume was related to cortical thinning in a clinical sample with cognitively impaired patients, showing that pWMH was related to frontal lobe thinning while dWMH had no effect. 8 Moreover, our results are in line with reports of a longitudinal relationship between pWMH volume and decline in cortical thickness in a patient population with symptomatic atherosclerotic disease, while dWMH again showed no significance. 34
Visualization of WMH cortical connectivity patterns in our study revealed distinct characteristics in topology and cortical connectivity profiles. All types of WMH (overall, deep and periventricular) were found to primarily connect to brain regions in the frontal and occipital lobes with less connectivity to areas in anterior temporal lobe and pre- and postcentral gyri. This visual impression was confirmed by applying a standardized anatomical atlas demonstrating the rank order of brain regions with highest connectivity to subcortical WMH.
Furthermore, there was a striking disparity in prevalence and connectivity to cortical surfaces for periventricular and deep WMH. First, pWMH were found to be much more prevalent than dWMH. This distribution of WMH is comparable to normal aging participants from other studies with more hyperintensities in the periventricular white matter and few lesions in the deep white matter. 20 , 39 Moreover, pWMH showed a connectivity pattern similar to overall WMH with strongly connected regions located in the frontal, occipital, limbic and insular lobe. In contrast, dWMH connectivity was overall lower and followed a different pattern that was more evenly distributed across all cortical brain regions. These distinctive connectivity profiles are most likely explained by the characteristic anatomical locations of dWMH and pWMH in relation to specific types of white matter fiber tracts. In detail, dWMH and pWMH could be associated with disruption of short and long association fibers, respectively. Short association fibers consist of arcuate U-shaped fibers directly underlying the cortex, mainly located in the parietal and temporal lobe. 40 , 41 They connect adjacent gyri and are primarily prone to disruption by dWMH. On the other hand, long association fibers connect distant brain regions with each other, run in close proximity to the periventricular white matter and are therefore often affected by periventricular WMH. 40 , 42 Moreover, previous studies suggested that white matter tracts terminating at the frontal and occipital cortex have a long tract length on average while the postcentral and superior temporal gyri are primarily connected to white matter tracts with a rather short tract length. 43
This study was aimed at unraveling the relationship between WMH resulting from CSVD and cortical thickness in a large cohort of 930 participants at elevated risk for cardiovascular diseases. Compared with previous studies on CSVD, our sample was rather mildly affected as suggested by a lower median WMH volume.44–46 Nonetheless, we were able to detect a relevant association between higher probability of connectivity between WMH and the cerebral cortex and cortical thickness in our participants. This indicates that distant grey matter degeneration is linked to WMH and observable already in the early stages of CSVD.
While the large number of participants and advanced methodological approaches are strengths of our study, we focused on associations of imaging findings and potential pathophysiological mechanisms in CSVD and did not analyze cognitive functioning in this paper. This can therefore be considered a limitation of our study. Since the assumed effects of WMH connectivity (especially the differentiation between pWMH and dWMH connectivity) on cognitive dysfunctions were not extensively investigated previously, further research is necessary to address this topic. Moreover, although the Hamburg City Health Study is a longitudinal cohort study, only cross-sectional data are currently available.
In conclusion, we reveal a direct relationship between WMH and cortical atrophy through profiles and degree of underlying white matter connectivity. Our results indicate that reduced cortical thickness in participants with cardiovascular risk factors is associated with a higher connection probability to underlying to WMH. Further studies are needed to analyze the effect of the connectivity and secondary cortical neurodegeneration on cognitive performance.
Footnotes
Funding
The author(s) disclosed receipt of the following financial support for the research, authorship, and/or publication of this article: The participating institutes and departments from the University Medical Center Hamburg-Eppendorf contribute all with individual and scaled budgets to the overall funding. The Hamburg City Health Study is also supported by Amgen, Astra Zeneca, Bayer, BASF, Deutsche Gesetzliche Unfallversicherung (DGUV), DIFE, the Innovative medicine initiative (IMI) under grant number No. 116074 and the Fondation Leducq under grant number 16 CVD 03., Novartis, Pfizer, Schiller, Siemens, Unilever and “Förderverein zur Förderung der HCHS e.V.”.
Acknowledgements
This work was supported by the German Research Foundation (Deutsche Forschungsgemeinschaft (DFG)), and the Sonderforschungsbereich (SFB) 936, Project C1 (CG), Project C2 (JF, GT, BC). The authors wish to acknowledge all participants of the Hamburg City Health Study and cooperation partners, patrons and the Deanery from the University Medical Centre Hamburg - Eppendorf for supporting the Hamburg City Health Study. Special thanks applies to the staff at the Epidemiological Study Centre for conducting the study. The publication has been approved by the Steering Board of the Hamburg City Health Study.
Founding board:
Adam, Gerhard
Blankenberg, Stefan
Koch-Gromus, Uwe
Gerloff, Christian
Jagodzinski, Annika
List of investigators:
Adam, Gerhard
Aarabi, Ghazal
Augustin, Matthias
Behrendt, Christian
Beikler, Thomas
Betz, Christian
Blankenberg, Stefan
Bokemeyer, Carsten
Brassen, Stefanie
Brekenfeld, Caspar
Briken, Peer
Busch, Chia-Jung
Büchel, Christian
Debus, Eike Sebastian
Fiehler, Jens
Gallinat, Jürgen
Gellißen, Simone
Gerloff, Christian
Girdauskas, Evaldas
Gosau, Martin
Härter, Martin
Harth, Volker
Heydecke, Guido
Huber, Tobias
Jagodzinski, Annika
Johansen, Christoffer
Koch-Gromus, Uwe
Konnopka, Alexander
König, Hans-Helmut
Kromer, Robert
Kubisch, Christian
Kühn, Simone
Löwe, Bernd
Lund, Gunnar
Meyer, Christian
Nienhaus, Albert
Pantel, Klaus
Püschel, Klaus
Reichenspurner, Hermann,
Sauter, Guido
Scherer, Martin
Schnabel, Renate
Schulz, Holger
Smeets, Ralf
Spitzer, Martin S.
Terschüren, Claudia
Thomalla, Götz
von dem Knesebeck, Olaf
Waschki, Benjamin
Wegscheider, Karl
Zeller, Tanja
Zyriax, Birgit-Christiane
Steering board:
Augustin, Matthias
Blankenberg, Stefan
Gallinat, Jürgen
Gerloff, Christian
Härter, Martin
Jagodzinski, Annika
Johansen, Christoffer
Koch-Gromus, Uwe
Sauter, Guido
Zeller, Tanja
Wegscheider, Karl
Betz, Christian/Heydecke, Guido/Gosau, Martin
Research consortium:
Aarabi, Ghazal
Andrees, Valerie
Behrendt, Christian Brassen, Stefanie
Brekenfeld, Caspar
Brünahl, Christian
Busch, Chia-Jung
Freitag, Janina
Gallinat, Jürgen
Gellißen, Susanne
Girdauskas, Evaldas
Heidemann, Christoph
Hussein, Yassin
Klein, Verena
Kofahl, Christopher
Kohlmann, Sebastian
Konnopka, Alexander
Kühn, Simone
Lühmann, Dagmar
Lund, Gunnar
Magnussen, Christina
Meyer, Christian
Nagel, Lina
Petersen, Elina
Scherschel, Katharina
Schiffner, Ulrich
Schnabel, Renate
Schulz, Holger
Seedorf, Udo
Smeets, Ralf
Terschüren, Claudia
Thomalla, Götz
Waschki, Benjamin
Zeller, Tanja
Zyriax, Birgit-Christiane
Declaration of conflicting interests
The author(s) declared the following potential conflicts of interest with respect to the research, authorship, and/or publication of this article: JF received research support from the German Ministry of Science and Education (BMBF), German Ministry of Economy and Innovation (BMWi), German Research Foundation (DFG), European Union (EU), Hamburgische Investitions- und Förderbank (IFB), Medtronic, Microvention, Philips, Stryker and was consultant for Acandis, Cerenovus, Medtronic, Microvention, Stryker. CG received grants from European Union (EU), personal fees from AMGEN, Bayer Vital, BMS, Boehringer Ingelheim, Sanofi Aventis, Abbott, and Prediction Biosciences. GT reports consulting fees from Acandis, grant support and lecture fees from Bayer, lecture fees from Boehringer Ingelheim, Bristol-Myers Squibb/Pfizer, and Daiichi Sankyo, consulting fees and lecture fees from Stryker, grants from the German Ministry of Science and Education (BMWi), German Research Foundation (DFG), European Union (EU), German Innovation Fund, Corona Foundation. All other authors declare that they have no conflict of interest.
Authors’ contributions
CM and BMF designed and conceptualized the study, analyzed and interpreted the data, and made major contribution in revising the manuscript. ES analyzed and interpreted the data and made contribution in revising the manuscript. MP analyzed and interpreted the data. KE, UH, AJ, KB and JF participated in the data acquisition. CG drafted and revised the manuscript. GT and BC made major contributions in supervising and coordinating the study and in drafting and revising the manuscript.