
Abstract
White matter hyperintensities are frequent on neuroimaging of older people and are a key feature of cerebral small vessel disease. They are commonly attributed to chronic hypoperfusion, although whether low cerebral blood flow is cause or effect is unclear. We systematically reviewed studies that assessed cerebral blood flow in small vessel disease patients, performed meta-analysis and sensitivity analysis of potential confounders. Thirty-eight studies (n = 4006) met the inclusion criteria, including four longitudinal and 34 cross-sectional studies. Most cerebral blood flow data were from grey matter. Twenty-four cross-sectional studies (n = 1161) were meta-analysed, showing that cerebral blood flow was lower in subjects with more white matter hyperintensity, globally and in most grey and white matter regions (e.g. mean global cerebral blood flow: standardised mean difference−0.71, 95% CI −1.12, −0.30). These cerebral blood flow differences were attenuated by excluding studies in dementia or that lacked age-matching. Four longitudinal studies (n = 1079) gave differing results, e.g., more baseline white matter hyperintensity predated falling cerebral blood flow (3.9 years, n = 575); cerebral blood flow was low in regions that developed white matter hyperintensity (1.5 years, n = 40). Cerebral blood flow is lower in subjects with more white matter hyperintensity cross-sectionally, but evidence for falling cerebral blood flow predating increasing white matter hyperintensity is conflicting. Future studies should be longitudinal, obtain more white matter data, use better age-correction and stratify by clinical diagnosis.
Keywords
Introduction
White matter hyperintensities (WMHs) are commonly seen on brain magnetic resonance imaging (MRI) in older people and are considered as one of the core neuroimaging findings of cerebral small vessel disease (SVD). They are defined as patchy or confluent hyperintensities on T2-weighted or FLAIR images, without cavitation, in subcortical white or deep grey matter regions. 1 WMHs are associated with increasing age and vascular risk factors such as hypertension and diabetes. 2 Although the aetiology is not completely understood, chronic hypoperfusion is thought to be a key mechanism, 3 perhaps resulting from narrowing of the arteriolar lumena secondary to lipohyalinosis and arteriolosclerosis. Based on this theory, mechanically induced hypoperfusion models, for example, partial or complete carotid artery occlusion, are used to create pathology that appears to mimic human SVD. However, no direct association between carotid artery stenosis and lacunar stroke or WMH has been found in human studies. 4
Additionally, the relationship between cerebral blood flow (CBF) and WMH is not consistent across human studies. In some cross-sectional studies, low CBF was significantly related to more WMHs, whereas in other studies, no such relationship was found.5,6 These studies had different study designs, sample sizes and locations where low CBF was detected and most studies were cross-sectional. There are few longitudinal studies. Thus it is unclear whether there is causal relationship between low CBF and WMHs in humans, or whether there is region specificity.
We sought to establish if WMH was related to changes in CBF levels, or whether differences in CBF might be related to potential confounders such as age and tissue loss. We systematically reviewed the available longitudinal and cross-sectional studies in humans, performed a meta-analysis of cross-sectional studies to assess the overall effect size of CBF differences by WMH burden in different brain regions, assessed study quality and performed sensitivity analyses on important confounders.
Methods
We performed this review according to guidelines 7 and a pre-specified protocol. We conducted a literature search of MEDLINE and EMBASE from 1946 up to December 2015, using the Ovid Web Gateway. We used exploded headings related to Small Vessel Disease and Cerebral Blood Flow with the Boolean operator AND [Supplementary methods]. English and non-English literature were sought. Additional records were identified by hand searching from January 1990 to December 2015 of Stroke and Journal of Cerebral Blood Flow & Metabolism. We also checked references cited in reviews and primary papers.
Eligibility criteria
We sought longitudinal and cross-sectional primary research studies assessing CBF in subjects with cerebral SVD. 8 Studies measuring cerebral blood flow velocity (CBFv) using Doppler ultrasound techniques were also considered eligible. We excluded studies targeting unilateral or bilateral severe carotid stenosis or occlusion, studies in children, animal studies, duplicate publications, conference abstracts and cross-sectional studies from which we could not extract either absolute values of CBF or correlation/regression coefficients.
Data extraction and analysis
We screened all potentially relevant full papers and extracted data using a standardised form. All data were cross-checked by a second reviewer (JMW). From those that met the inclusion criteria, we extracted data on study population characteristics, study design, SVD and CBF measurement techniques and units. We assessed the study quality using a checklist devised on the basis of the Strengthening the Reporting of Observational Studies in Epidemiology statement (www.equator-network.org) and checklist in a previous paper, 9 including factors such as study population and bias controlling (Supplementary Table S1).
For cross-sectional studies which reported means and standard deviations (S.D.s) of CBF, we extracted data on CBF in disease and control groups or according to SVD burden. Means and S.D.s were extracted from text or tables where available, or from graphs where necessary. For cross-sectional studies where only qualitative data for association between CBF and WMH were available, we included the studies in the review but not in the meta-analysis: we noted the statistical methods, coefficients, P values and other covariates included in regression.
For longitudinal studies, we also listed follow-up durations and primary results extracted from the papers, and contacted the authors to request unpublished data on baseline and follow-up CBF and WMH volume.
Data transformation and analysis
All studies reporting means and S.D.s were included for meta-analysis. For studies that divided patients into more than two grades of WMH severity, we combined the means and S.D.s of groups to create a single pair-wise comparison [Supplementary methods]. As most studies measured CBF in several regions of interest (ROIs), such as different grey matter and white matter regions, we conducted subgroup analysis by brain region. Due to various units of CBF being used in different papers, we calculated the standardised mean differences (SMDs) and 95% confidence intervals (CI) for comparisons using a random-effects model. Sensitivity analyses were carried out for subjects with/without dementia and by age matching between study groups, as both strongly influence CBF. Meta-analyses were conducted using the Cochrane Collaboration’s Review Manager (Revman Version 5.3). We assessed for heterogeneity by calculating the I2 statistic and publication bias using a funnel plot.
Results
A total of 2843 publications were initially identified, of which 75 were potentially eligible and were selected for further review. We ultimately included 38 articles and excluded (Figure 1): conference abstracts (6), those where we were unable to access the full text (6) or that had no analysable data (18), duplicate publications including the same participant population (3) and studies of severe carotid stenosis or occlusion (4). Note that although presence of arterial diseases was an inclusion criterion of Second Manifestations of ARTerial disease-magnetic resonance (SMART-MR) study, carotid arterial stenosis or occlusion was not one of the criteria: here patients with carotid artery stenosis were included, but they only represented a small proportion of participants, thus we included the study
10
in our review. The 38 studies included a total of 4006 participants: 4/38 were longitudinal and 34/38 were cross-sectional.
PRISMA flow diagram of literature search.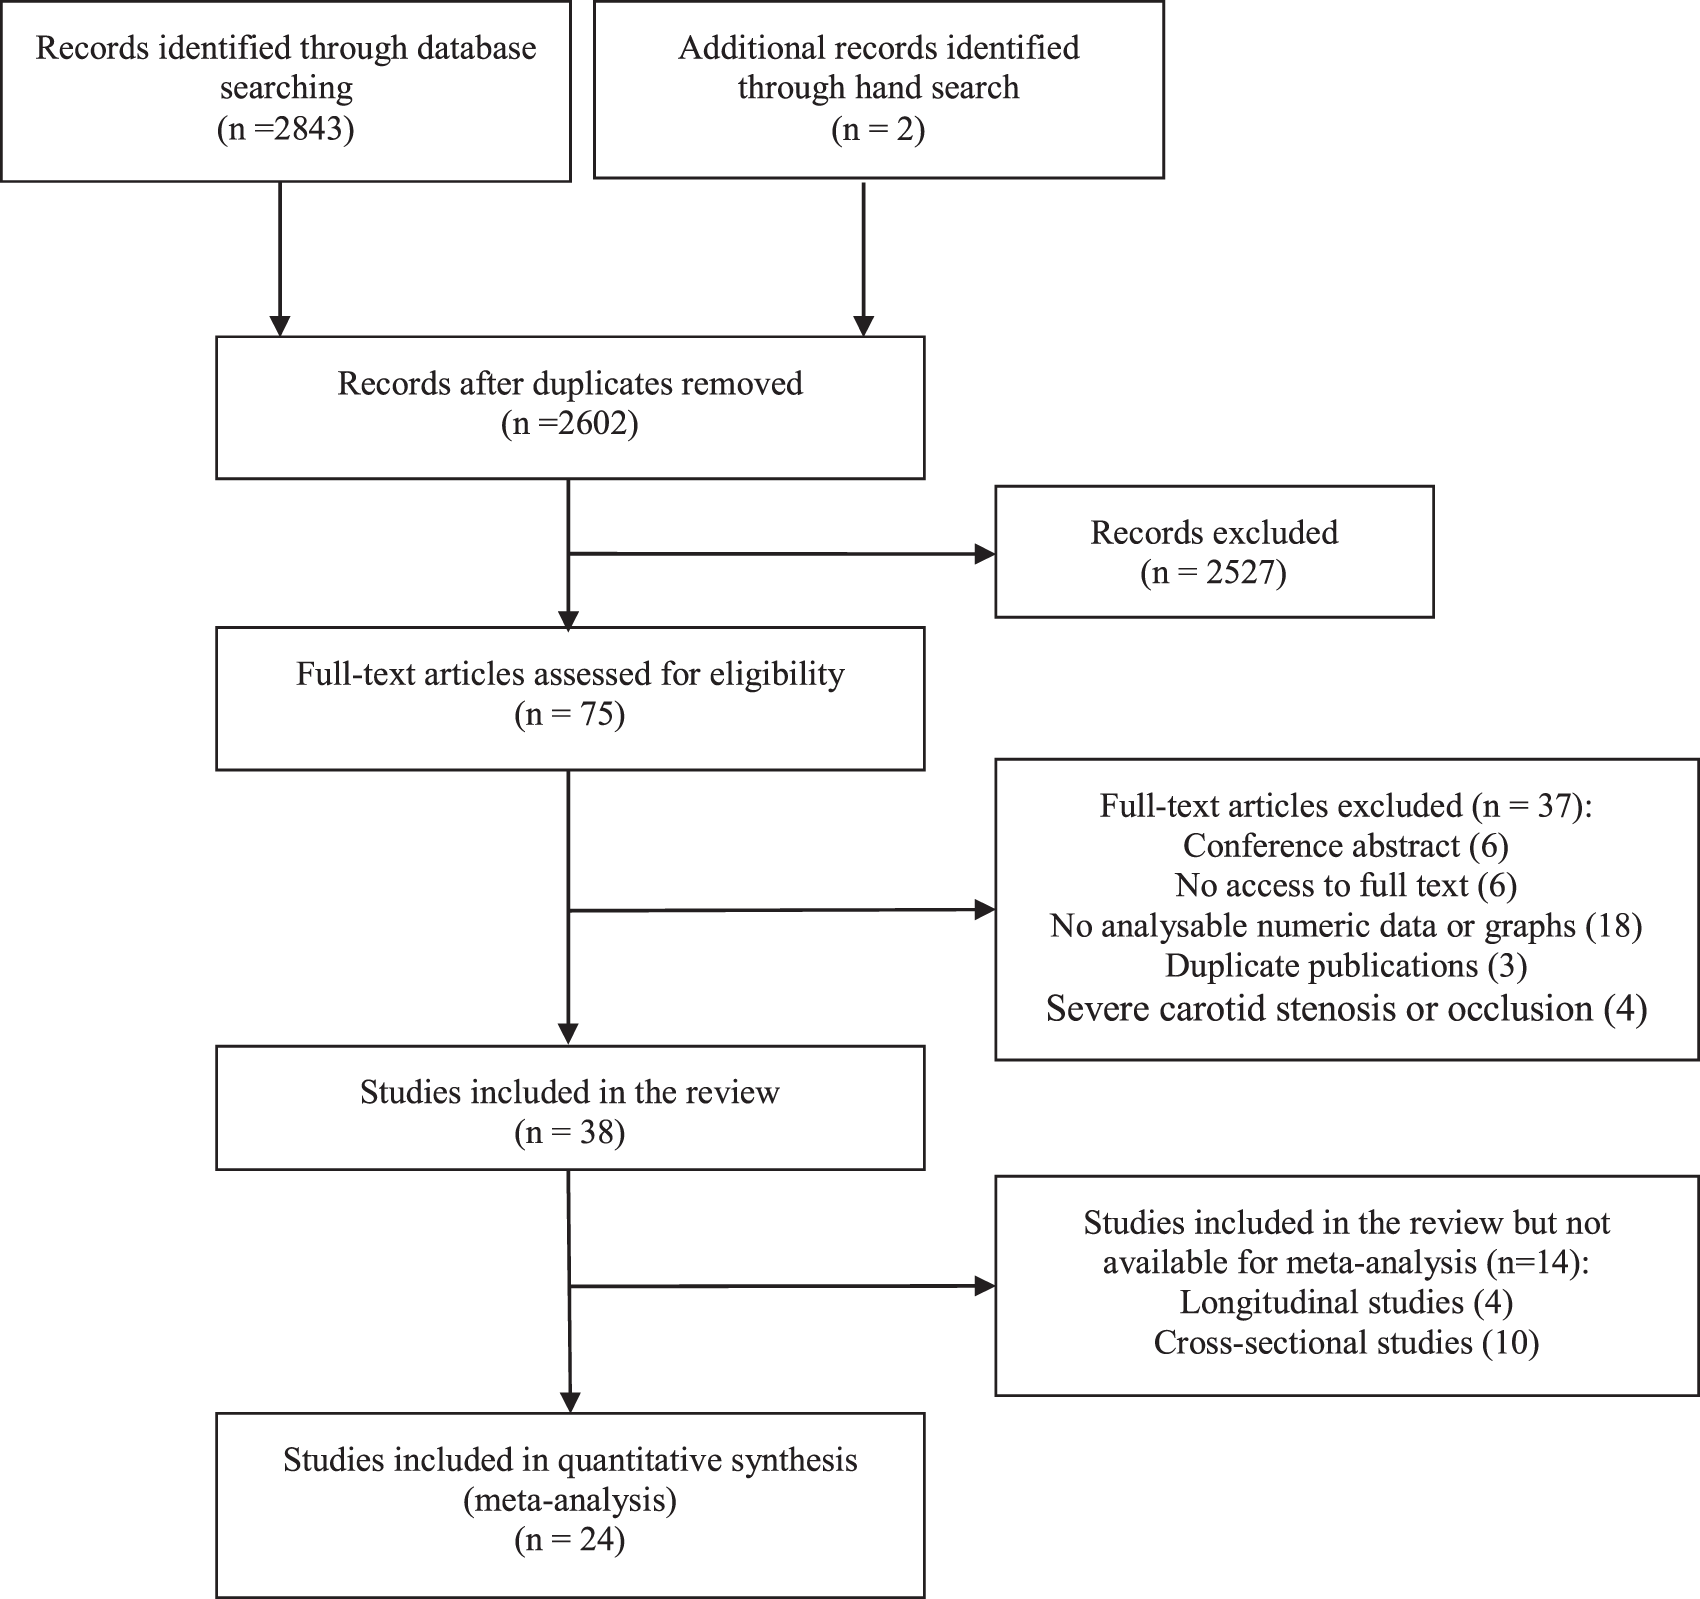
Some papers are from the same studies: van der Veen et al. 10 and Bisschops et al. 11 from the SMART-MR study; ten Dam et al. 12 and van Es et al. 13 from the Prospective Study of the Elderly at Risk (PROSPER) trial; Vernooij et al. 14 and Claus et al. 15 from the Rotterdam Scan Study. We were careful to count each participant only once in any analysis.
Characteristics of included studies
Cross-sectional studies
Characteristics of all included studies.

S.D.: standard deviation; CBF: cerebral blood flow; TIA: transient ischemic attack; DCS-PWI: dynamic susceptibility contrast perfusion-weighted imaging; MRI: magnetic resonance imaging; AD: Alzheimer’s disease; MID: multi-infarct dementia; BD: Binswanger’s disease; WMH: white matter hyperintensity; SPECT: single-photon emission computed tomography; ASL: arterial spin labelling MRI; PET: positron emission tomography; TCD: transcranial Doppler; CT: computed tomography; PVWMH: periventricular white matter hyperintensity; rCBF: regional cerebral blood flow.
Includes manifest coronary artery disease, cerebrovascular disease, peripheral arterial disease or an abdominal aortic aneurysm.
Fazekas WMH score.
Self-designed scoring system for WMH.
Age range.
In the other 10/34 studies which only reported association analysis, two were population-based studies,14,37 the other nine hospital-based studies included patients with cerebrovascular risk factors,13,38,39 heart failure, 40 dementia 41 and manifest arterial diseases. 42
Longitudinal studies
Four longitudinal prospective studies, including 1079 participants, were included (Table 1). Three were hospital-based10,12,43 and one from a population-based aging study. 44 Among these four studies, Bernbaum et al. recruited participants who presented acute minor stroke symptoms or transient ischemic attack (TIA) and had baseline MRI within 48 h after the onset. 43 The other three studies did not include acute patients. The follow-up durations ranged from 1.5 to 7.7 years. Kraut et al. compared the patterns of long-term CBF change in patients with progressive WMHs to those with stable WMHs, 44 whereas the other three studies performed regression analyses between CBF and WMH data without subdividing patient groups.10,12,43
Quality assessment
The average study quality score was 6/9. Scores were mainly lost for not reporting the drop-outs (25/38), no adjustment or matching for risk factors (including age) (17/38), not reporting expertise of image observers (20/38) and not using blinding (25/38) (Supplementary Figure S1).
Assessment of CBF measurement methods
Three studies used phase-contrast MRI,10,12–14,42 seven used positron emission tomography (PET),5,6,17,21,25,29,44 six used single-photon emission computerised tomography,15,16,22,24,32,41 two used MRI contrast,27,43 two used arterial spin labelling (ASL)-MRI,18,45 nine used Xenon-CT19,20,26,28,30,31,33,35,39 and two used CT perfusion23,36 to assess CBF. Four studies measured CBFv in the middle cerebral arteries using transcranial Doppler ultrasound.24,37,38,40
Meta-analysis of differences in CBF by WMH burden
Meta-analysis using SMD in CBF was only possible for 24 cross-sectional studies. Twenty-two brain regions were extracted, but sufficient data were available from only 11 regions which were used by at least three studies and were selected for the primary meta-analysis. These included: global brain mean CBF, basal ganglia, cortical grey matter (total, frontal, temporal, parietal and occipital grey matter) and white matter (total, frontal and occipital white matter, centrum semiovale). Most data were available for grey matter; few studies provided white matter data.
Patients with more severe WMH had lower CBF than patients with mild WMH, globally and in most grey and white matter regions (e.g. mean global CBF: SMD −0.71, 95% CI −1.12, −0.30; total grey matter: SMD −0.50, 95% CI −0.97, −0.03; total white matter: SMD −1.16, 95% CI −1.08, −0.53; see Figure 2a and b), except in basal ganglia (SMD −1.25, 95% CI −2.53, 0.30) and occipital white matter (SMD −0.45, 95% CI −0.96, 0.05) where the difference in CBF did not reach significance. No studies in the meta-analysis separated normal appearing white matter (NAWM) and WMH. However, there was heterogeneity between studies for most of these comparisons (Figure 2a and b) that was not due to publication bias (funnel plot, Supplementary Figure S2). One study found that CBF in patients with lacunar lesions was lower than in those without, however, the result was not adjusted for WMH volume and could not be meta-analysed.
30
(a) Forest plot showing standard mean differences in global and grey matter CBF in patients with WMH in dementia and non-dementia studies. CBF in different brain regions was analysed in subgroups. (b) Forest plot showing standard mean differences in white matter CBF in patients with WMH in dementia and non-dementia studies. CBF in different brain regions was analysed in subgroups.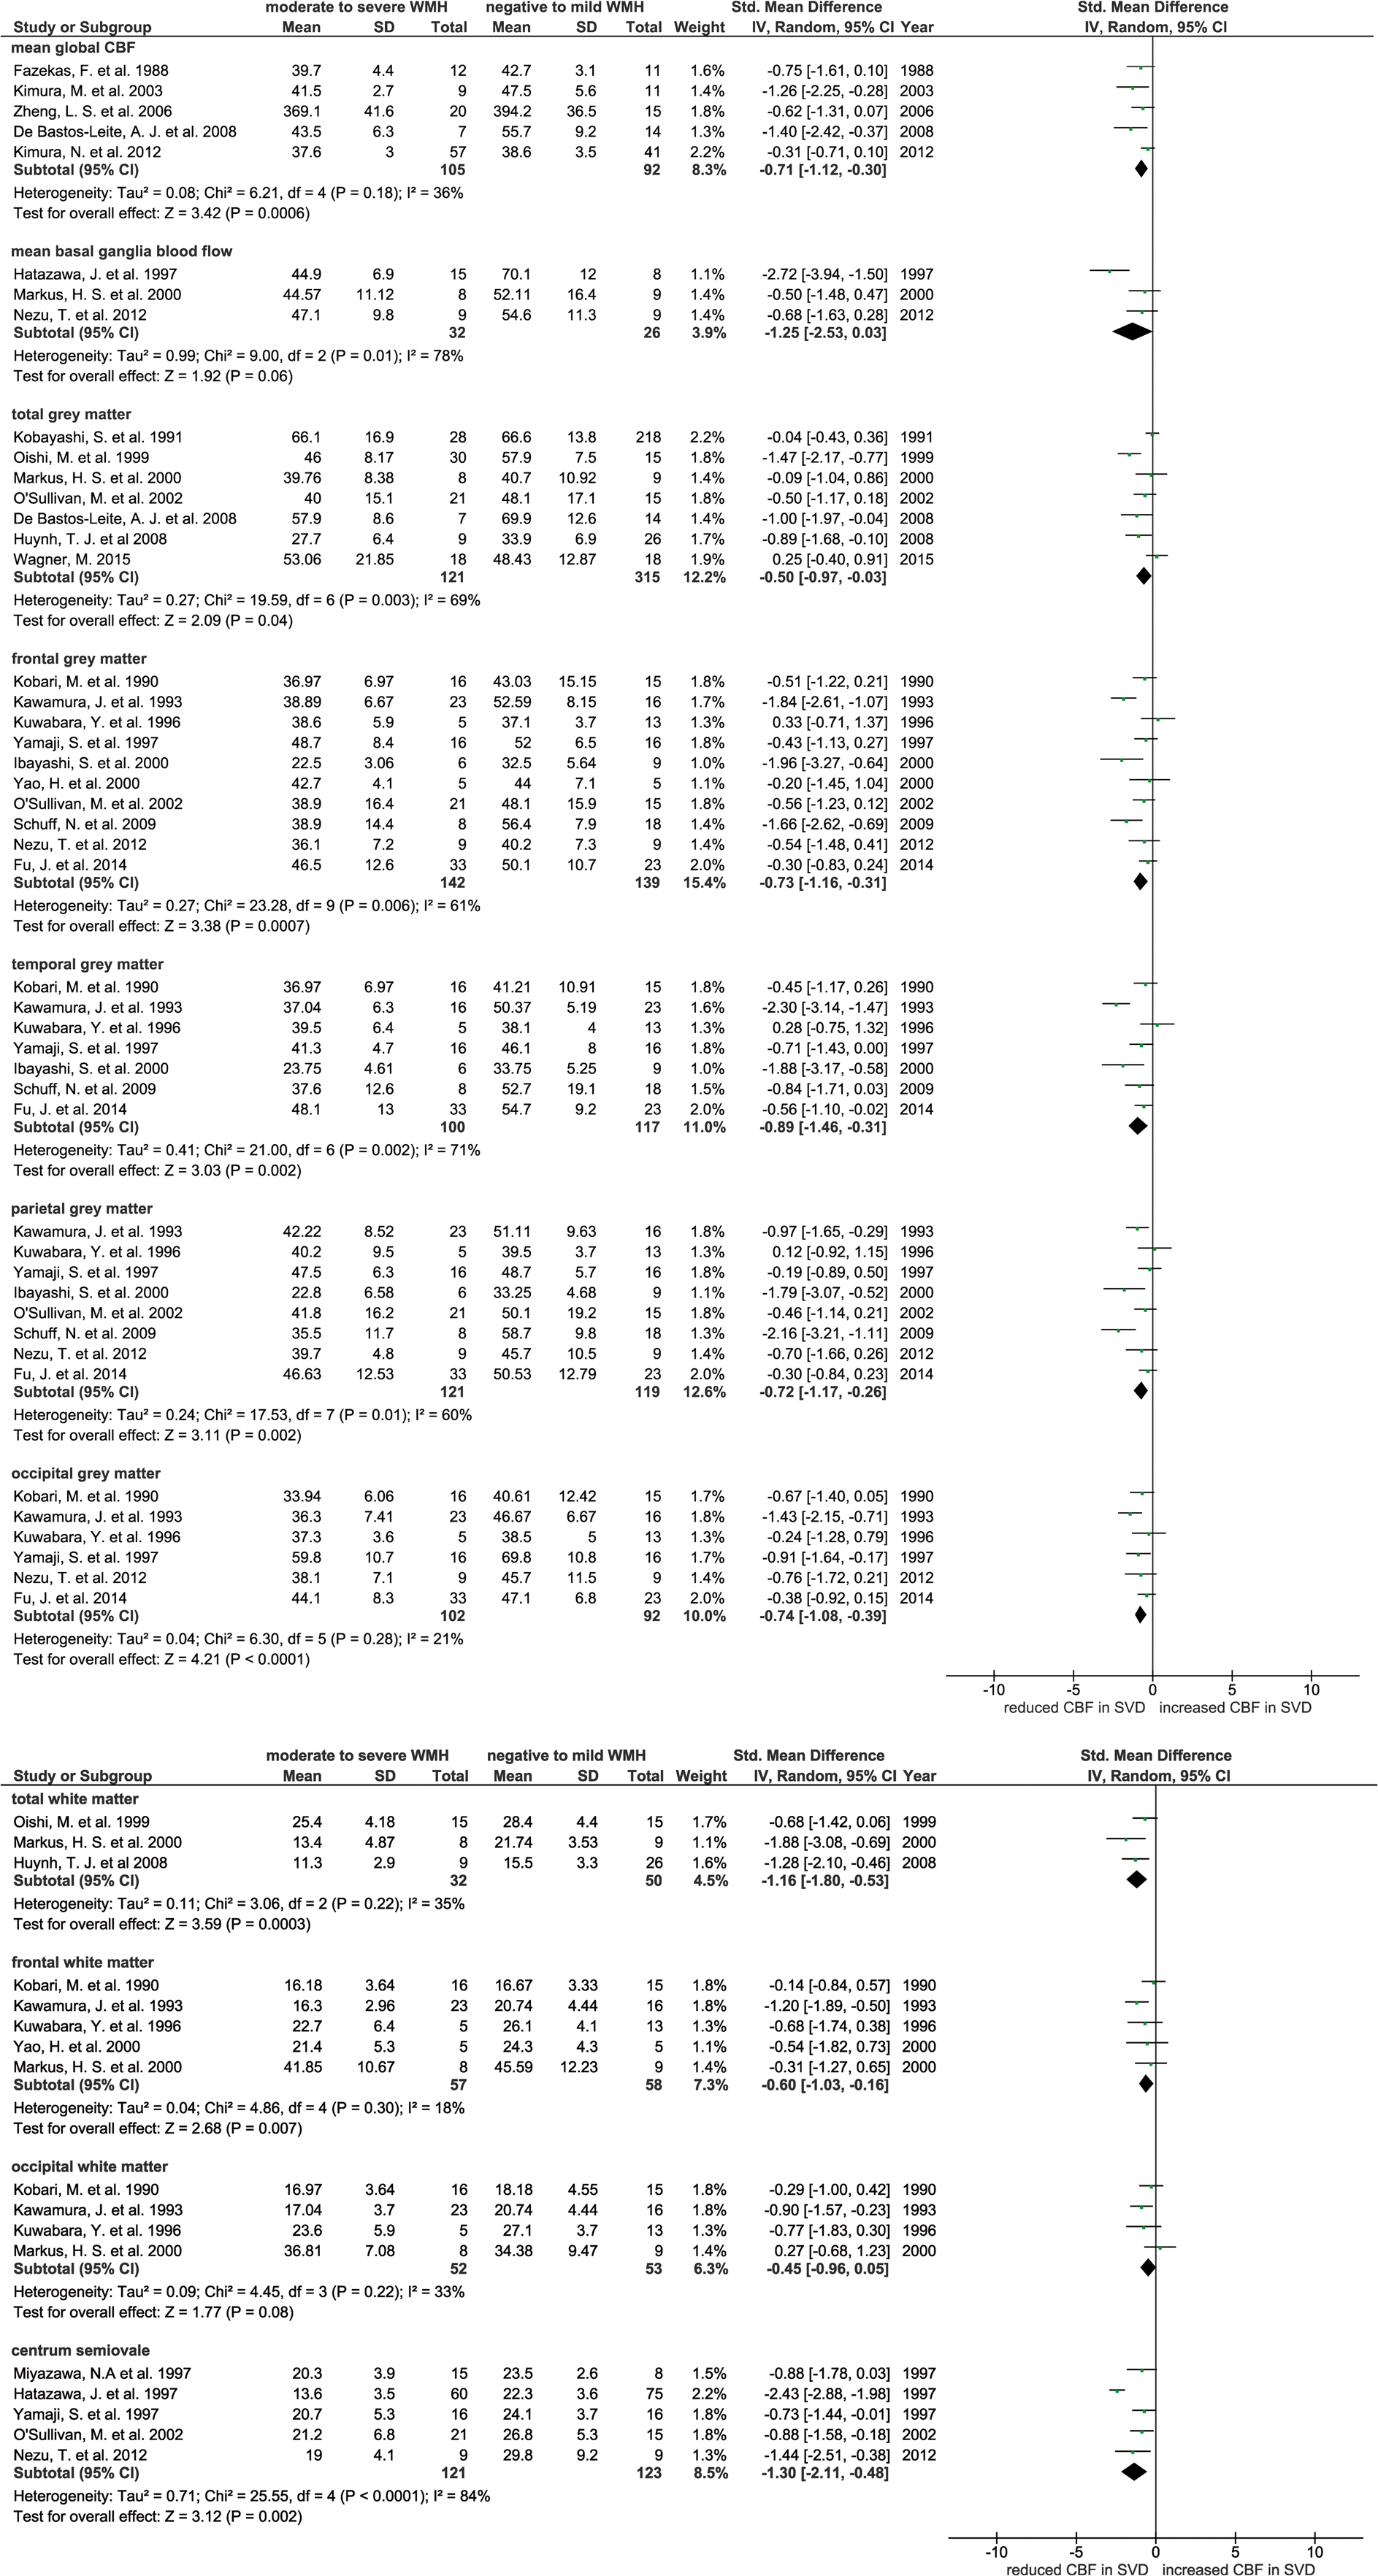
Sensitivity analysis of dementia and age
We repeated the meta-analyses after excluding studies that included patients with dementia and then further excluded studies without age-matching. In most grey and white matter regions, the differences in CBF between subjects with high and low WMH burdens attenuated and were no longer significant, except for mean global brain CBF and centrum semiovale. Most of the trends in the comparisons were still the same, apart from temporal grey matter (Figure 3).
Sensitivity analysis: SMDs of CBF in different brain areas in patients with moderate to severe WMH against those with negative to mild WMH. In each brain area, we showed the SMD of CBF in all studies, after excluding dementia studies and furthermore excluding studies without age-matching [number of studies] (number of participants).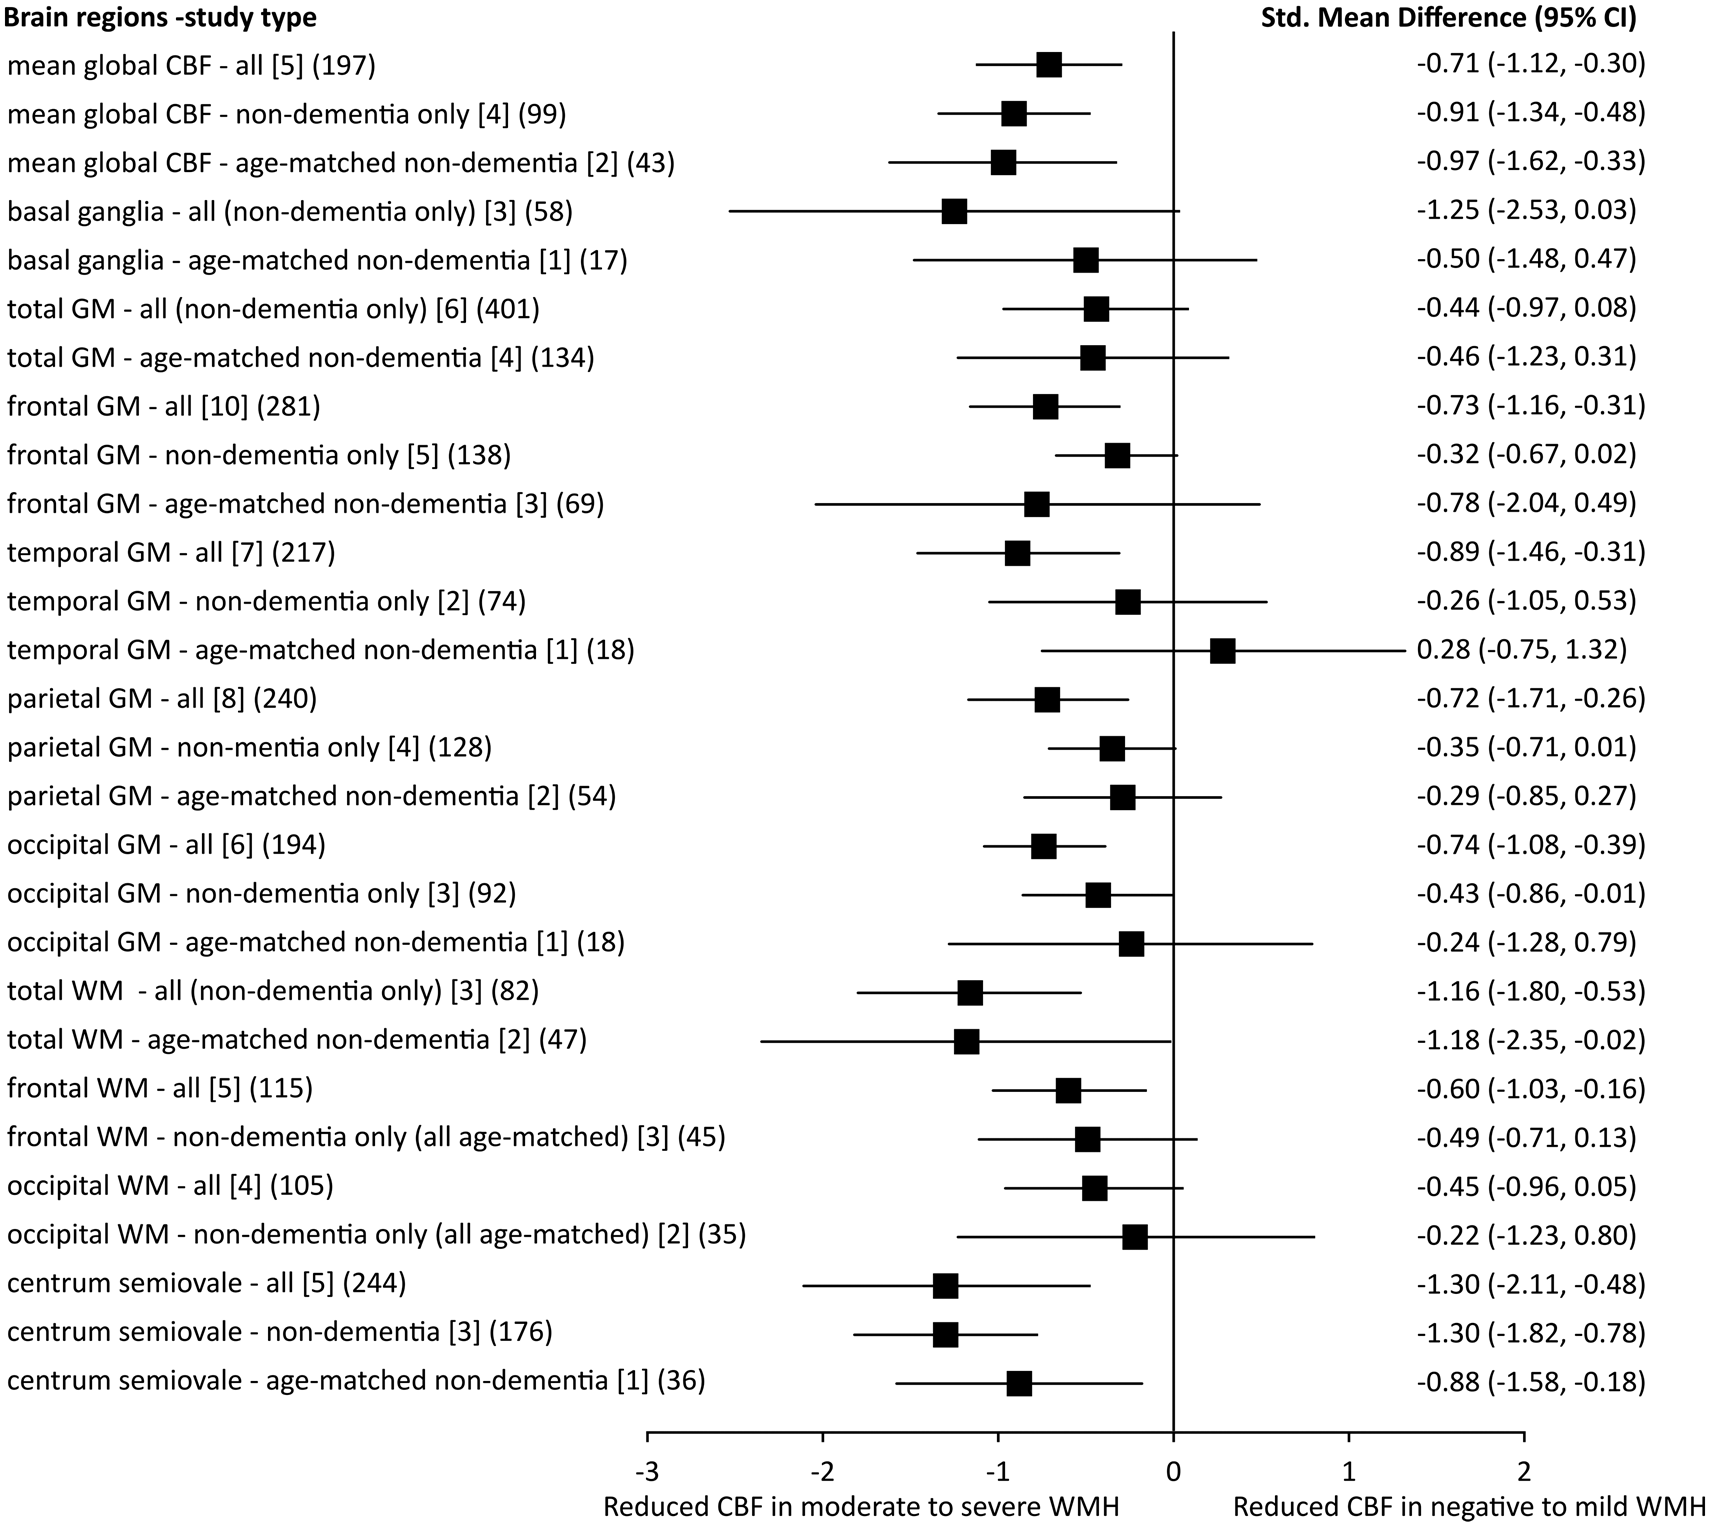
Only one study, Ibayashi et al., used hypertensive but neurologically normal patients as the control group, and found lower CBF in patients with Binswanger’s dementia compared to the control group; 5 none of the other studies matched or adjusted for vascular risk factors. Therefore, we were not able to do a sensitivity analysis for vascular risk factors. Hypertension is significantly more prevalent in patients with more severe WMH.
Cross-sectional studies that provided data on associations between CBF and SVD features
Results of association-only cross-sectional studies.
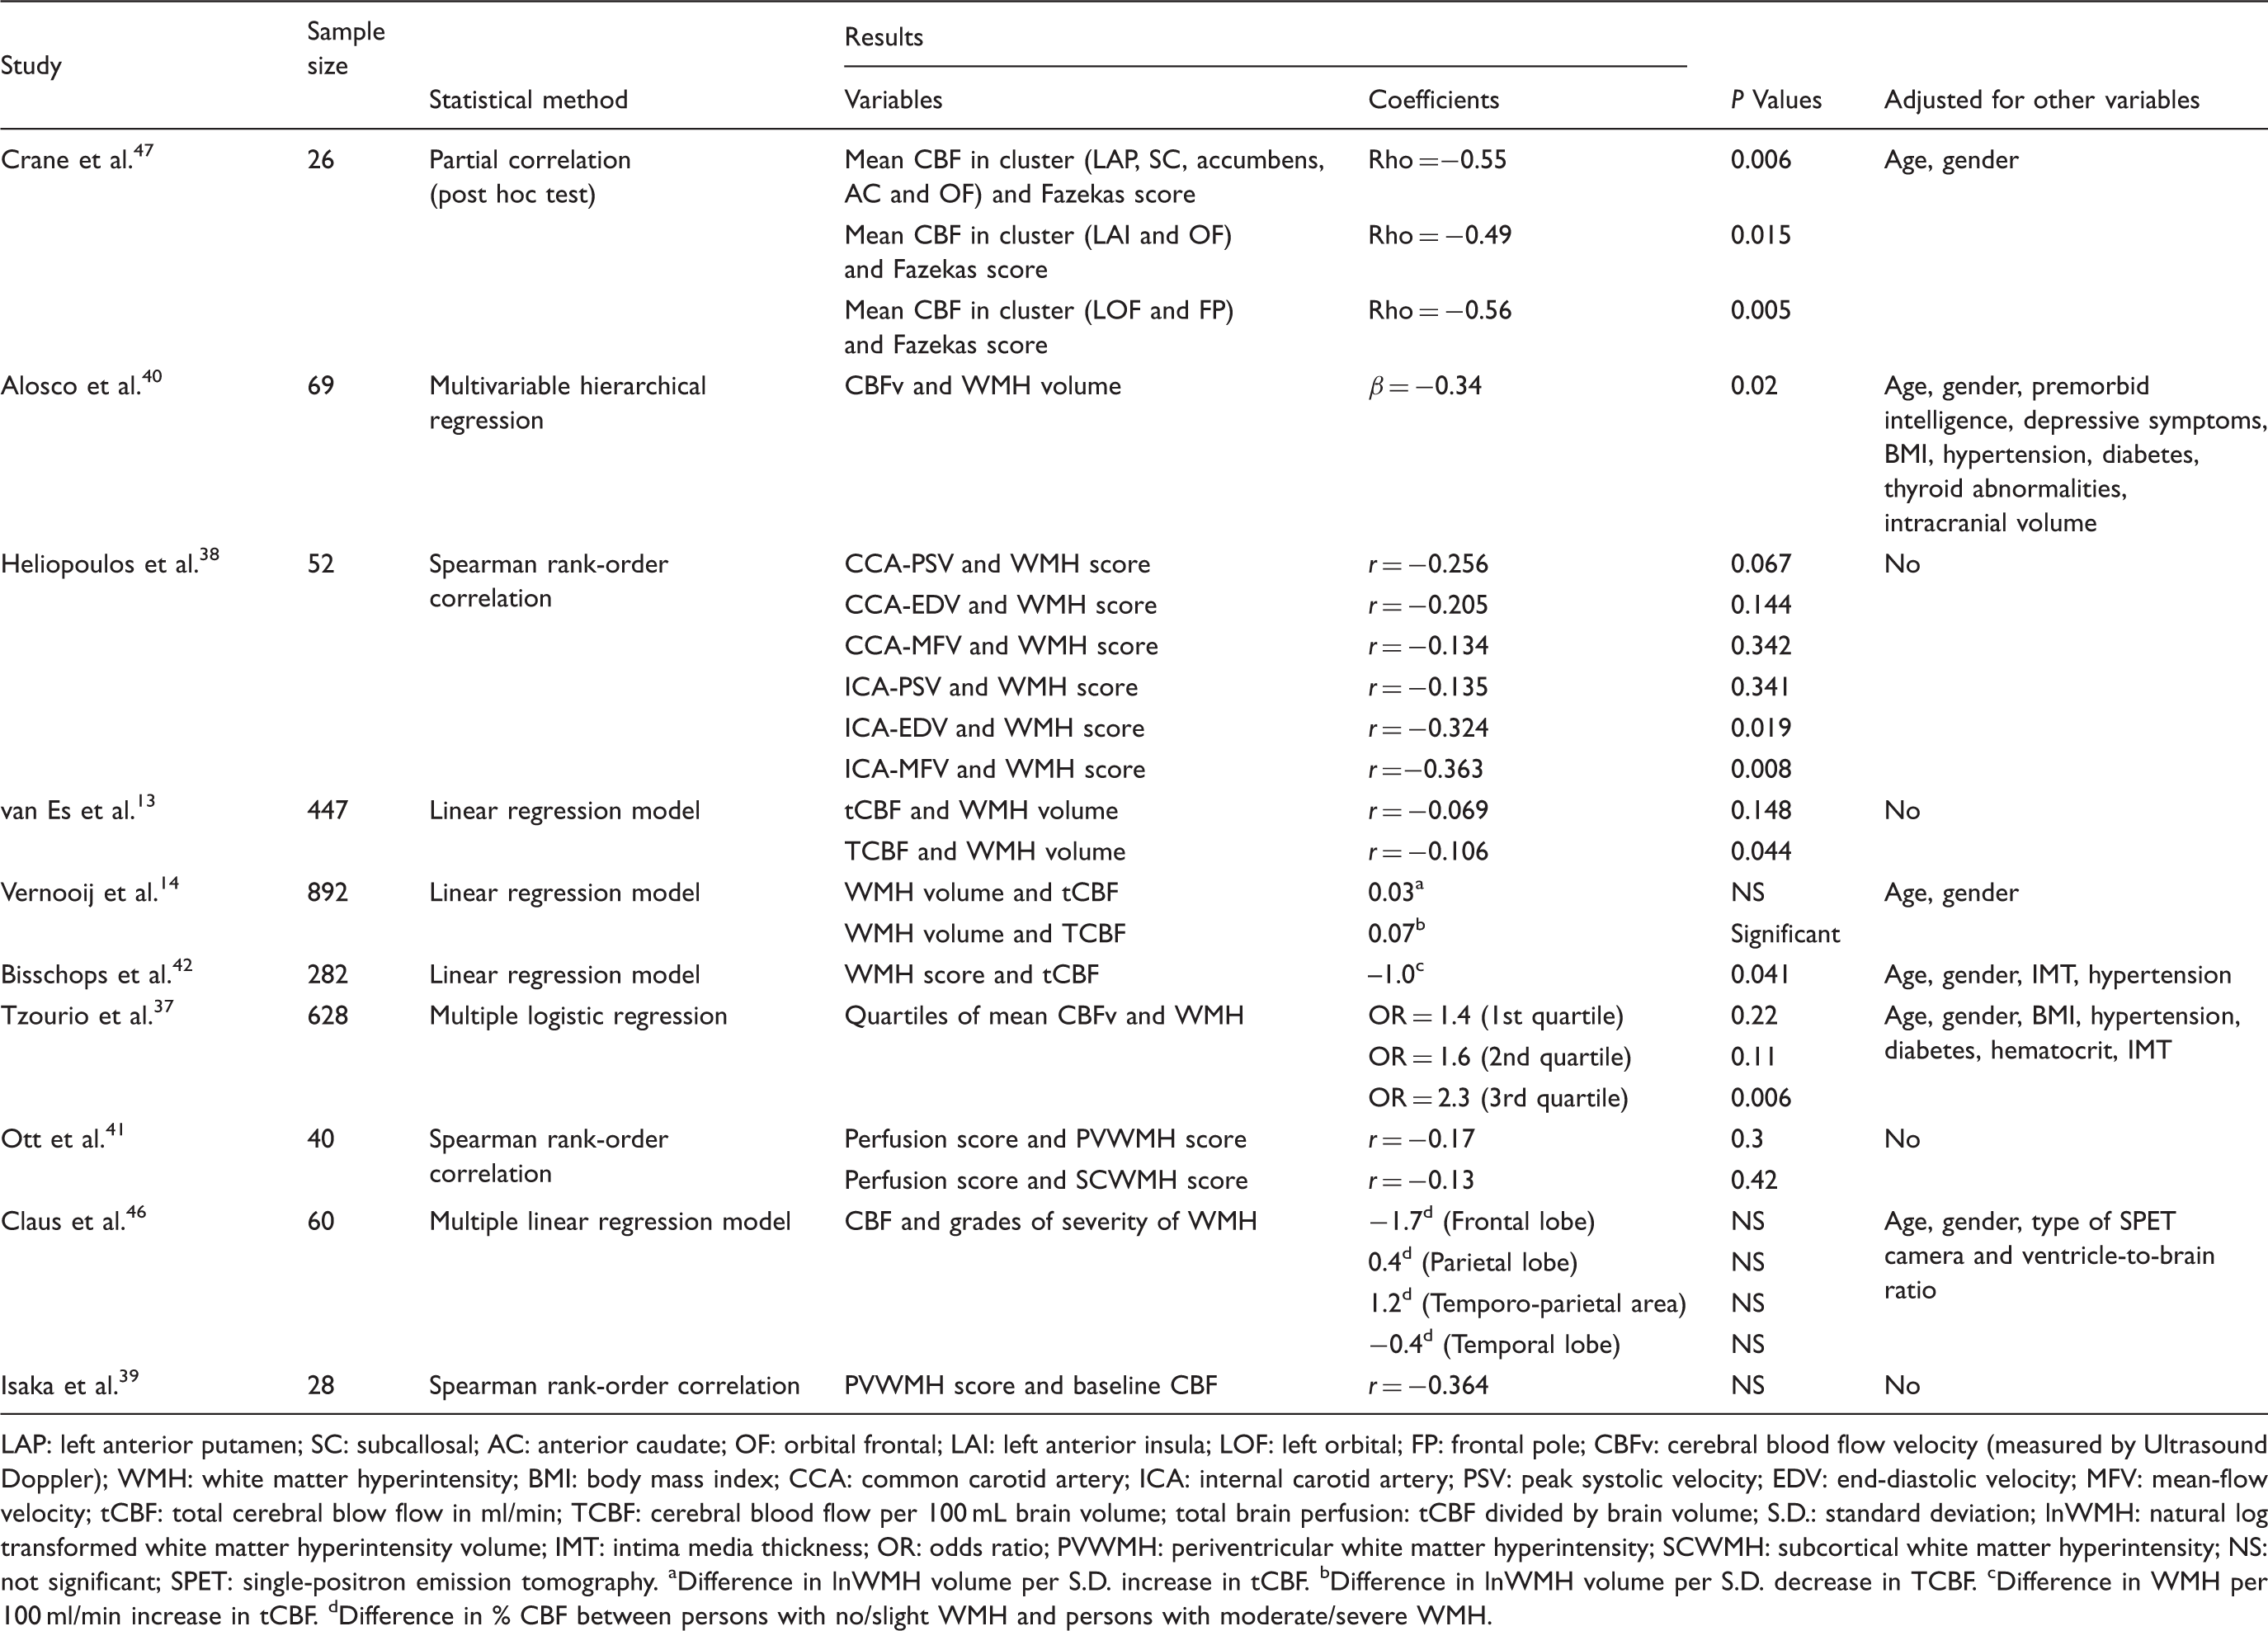
LAP: left anterior putamen; SC: subcallosal; AC: anterior caudate; OF: orbital frontal; LAI: left anterior insula; LOF: left orbital; FP: frontal pole; CBFv: cerebral blood flow velocity (measured by Ultrasound Doppler); WMH: white matter hyperintensity; BMI: body mass index; CCA: common carotid artery; ICA: internal carotid artery; PSV: peak systolic velocity; EDV: end-diastolic velocity; MFV: mean-flow velocity; tCBF: total cerebral blow flow in ml/min; TCBF: cerebral blood flow per 100 mL brain volume; total brain perfusion: tCBF divided by brain volume; S.D.: standard deviation; lnWMH: natural log transformed white matter hyperintensity volume; IMT: intima media thickness; OR: odds ratio; PVWMH: periventricular white matter hyperintensity; SCWMH: subcortical white matter hyperintensity; NS: not significant; SPET: single-positron emission tomography.
Difference in lnWMH volume per S.D. increase in tCBF.
Difference in lnWMH volume per S.D. decrease in TCBF.
Difference in WMH per 100 ml/min increase in tCBF.
Difference in % CBF between persons with no/slight WMH and persons with moderate/severe WMH.
Longitudinal studies
Results of longitudinal studies.
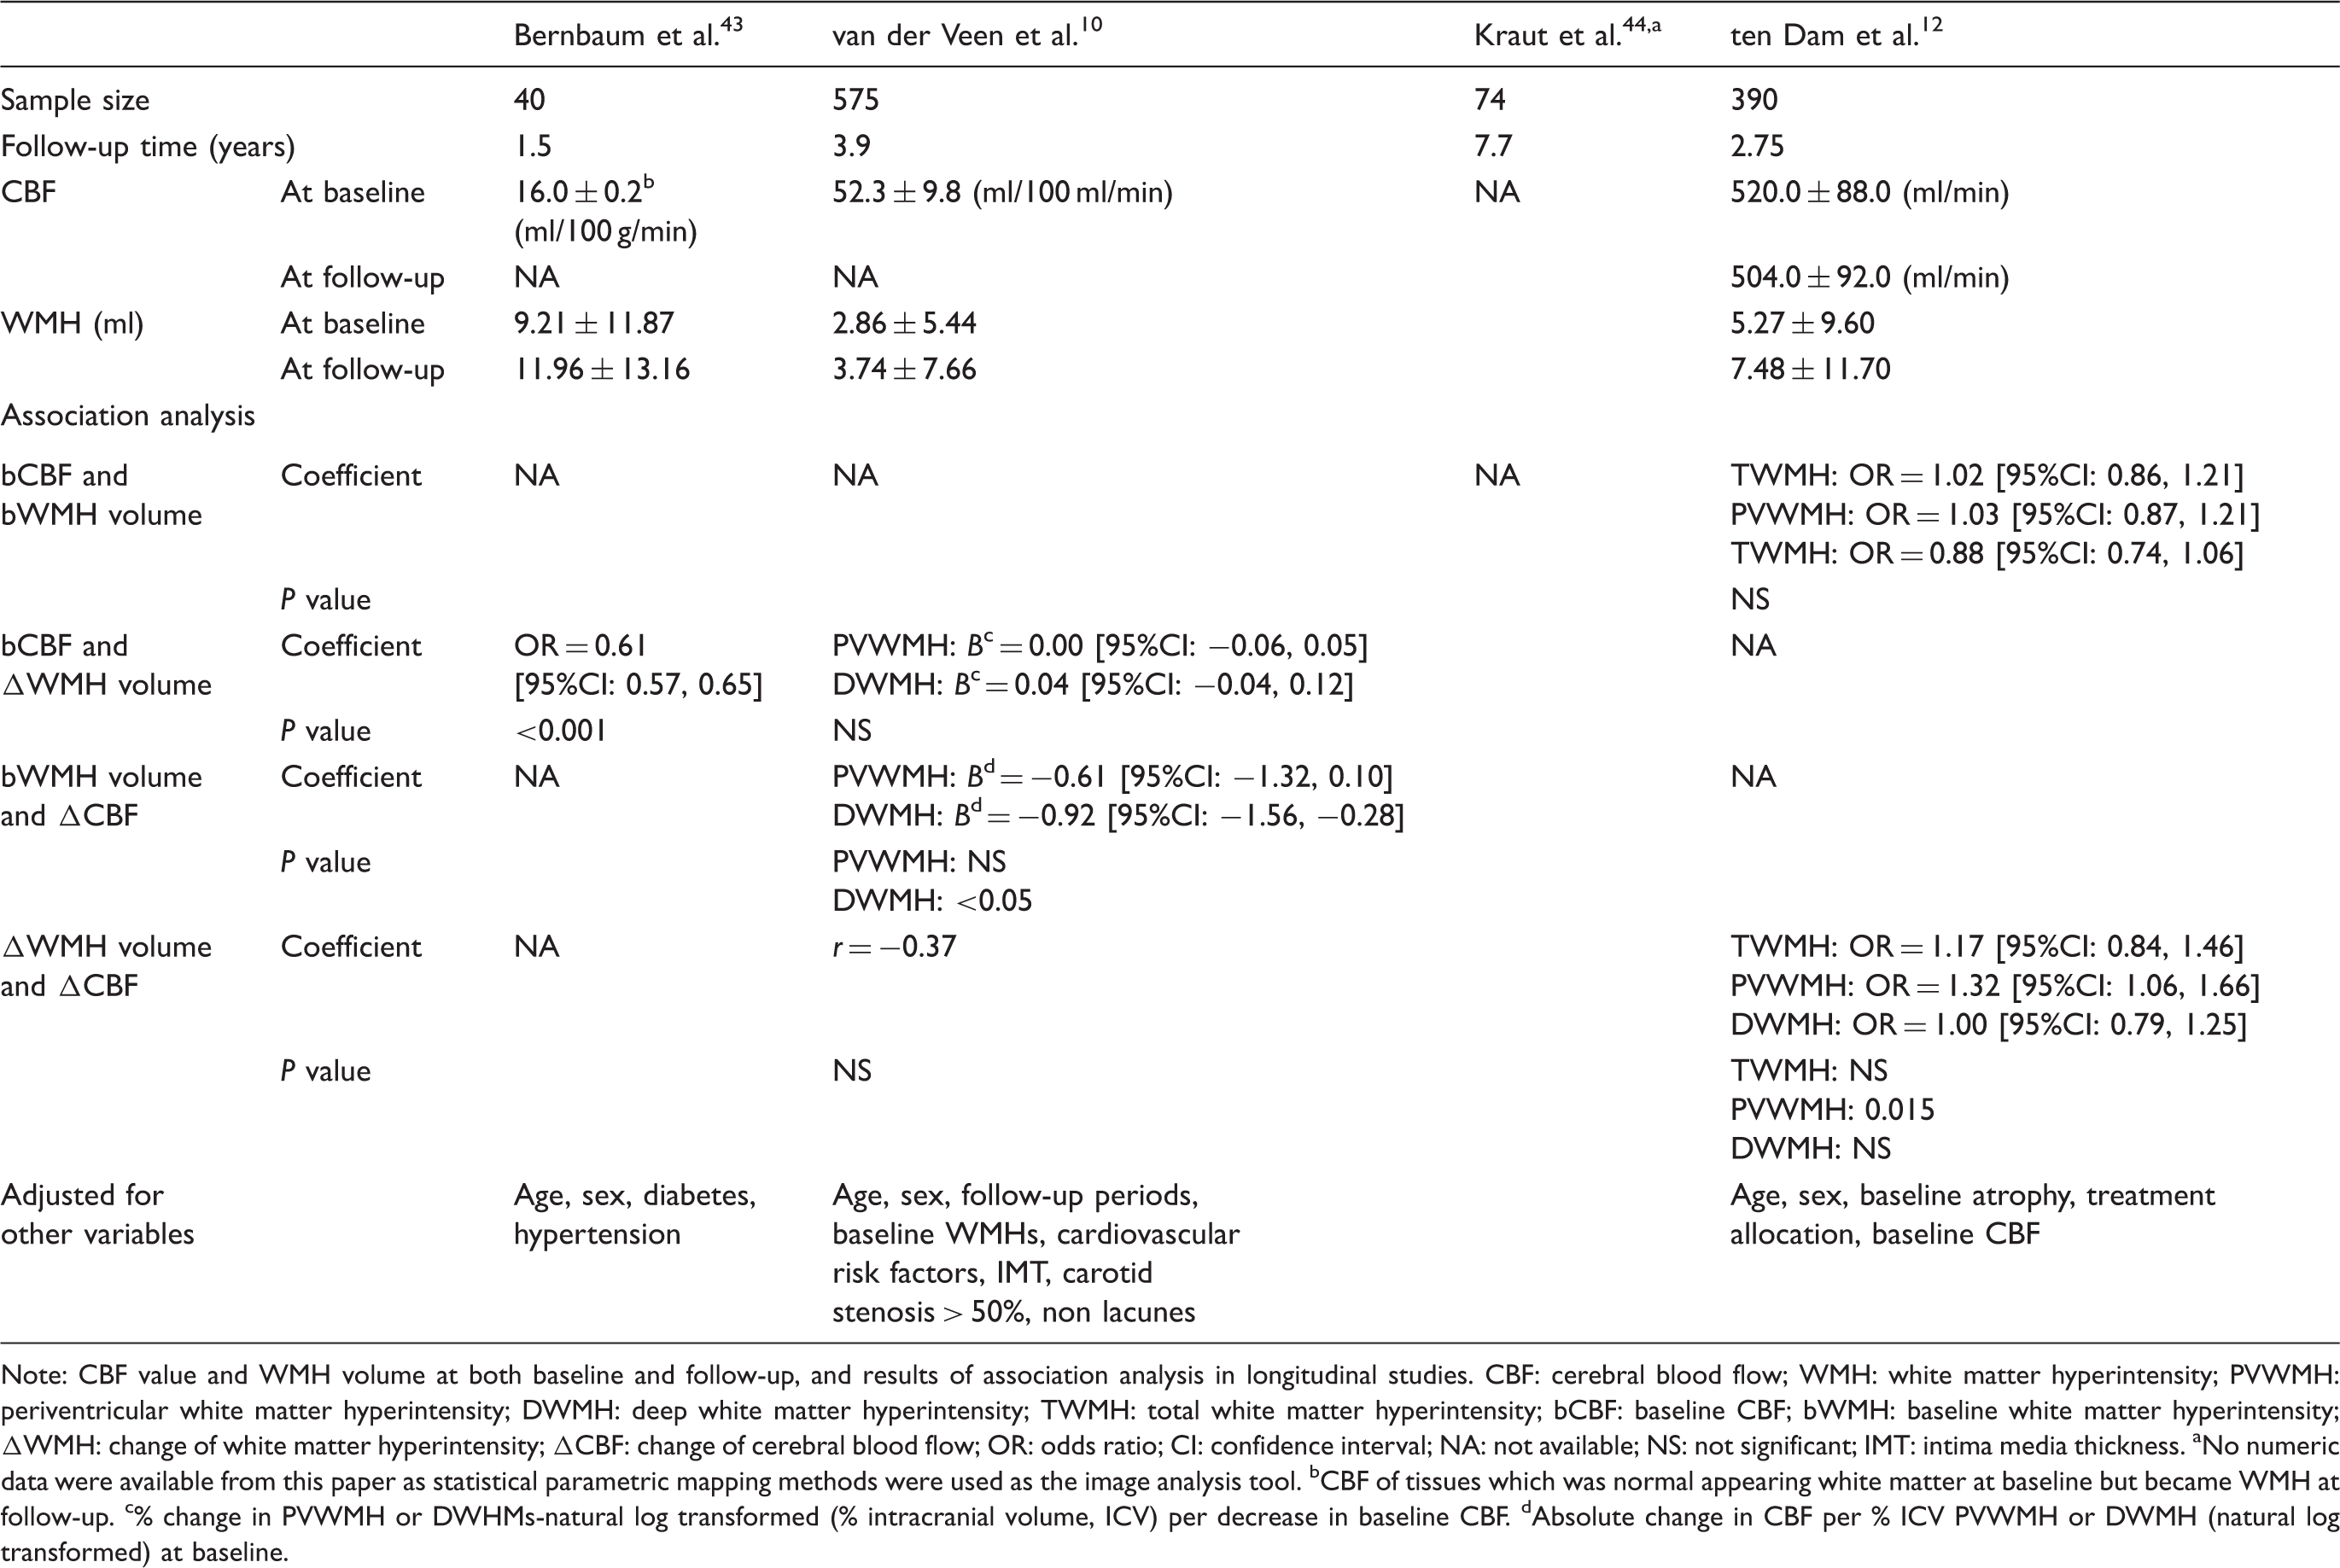
Note: CBF value and WMH volume at both baseline and follow-up, and results of association analysis in longitudinal studies.
CBF: cerebral blood flow; WMH: white matter hyperintensity; PVWMH: periventricular white matter hyperintensity; DWMH: deep white matter hyperintensity; TWMH: total white matter hyperintensity; bCBF: baseline CBF; bWMH: baseline white matter hyperintensity; ΔWMH: change of white matter hyperintensity; ΔCBF: change of cerebral blood flow; OR: odds ratio; CI: confidence interval; NA: not available; NS: not significant; IMT: intima media thickness.
No numeric data were available from this paper as statistical parametric mapping methods were used as the image analysis tool.
CBF of tissues which was normal appearing white matter at baseline but became WMH at follow-up.
% change in PVWMH or DWHMs-natural log transformed (% intracranial volume, ICV) per decrease in baseline CBF.
Absolute change in CBF per % ICV PVWMH or DWMH (natural log transformed) at baseline.
Discussion
WMHs are often considered to be a consequence of chronic hypoperfusion. However, while our review of all available published and some unpublished data show that high WMH load is associated with lower CBF, they do not strongly support causation. In cross-sectional studies, low CBF was observed in most of the patients with more WMHs. However the association was damped after removing non-age matched subjects and those with dementia, which suggests that the underlying association is between reduced CBF and age or dementia rather than just WMH. One longitudinal study (n = 575) also showed a correlation between high baseline WMH volume and decrease in CBF over time, questioning whether a CBF decline causes the tissue loss or vice versa. 10
The strengths of this systematic review include the use of well-established guidelines for meta-analysis, cautious exclusion of duplicate data, thorough analysis of different study types and sensitivity analysis of clinically important subgroups. Some studies provided more than one comparison but we avoided double-counting the total number of participants. We used every piece of data we could obtain. Studies that recruited subjects with AD, heart failure and depression but compared CBF between patients with and without SVD were also included. Moreover, we included papers in non-English languages, including three papers in Chinese. As most studies measured regional CBF in different brain areas, we carefully chose regions that were mentioned by at least three studies to obtain robust SMDs in meta-analyses.
There are some limitations of the review which in most part reflect the limitation of the literature. First, there are differences between studies in terms of study design and imaging methods which we tried to harmonise to enable comparisons. Longitudinal studies were rare. Data for white matter regions such as centrum semiovale or immediate periventricular white matter were limited or lacking. CBF was obtained by different techniques and varied by technique. However, it is important to note that meta-analysis compares the magnitude of association within one study with that within the others, rather than making direct comparisons of CBF between studies. There are also differences in patient populations: most studies chose patients without neurological symptoms or from community-based populations, whereas three studies recruited patients with acute onset of TIA or minor stroke. Two studies used acute brain MRI as baseline imaging.36,43 Image analysis methods differed and few if any studies differentiated normal tissue from WMH in the ROIs, thus including more tissue affected by lesions in subjects with high WMH burdens than with few WMH – an obvious confound if measuring CBF. Second, as some studies divided subjects into different severity groups, we converted them into pair-wise comparisons in the form of low WMHs versus high WMHs. Therefore, it is possible that disease groups in the original pair-wise studies might include some patients with mild lesions. Third, the sample sizes of the studies included in meta-analyses were small – the whole analysis of 24 studies included 1161 patients (mean 48/study or 24/group). Only a few studies used age-matched controls. Patients with more severe WMHs were in general significantly older than those who had mild or no WMH, introducing an obvious confound; we addressed this in sensitivity analyses but these were underpowered for meta-regression. In addition, only one study matched for important confounders like vascular risk factors so that sensitivity analysis for risk factors was not possible, and of course hypertension was generally more prevalent in severe WMH groups. Moreover, data for other imaging changes like lacunes or lacunar lesions are lacking. 30
The meta-analysis demonstrated that CBF measured concurrently was significantly lower in patients with more severe WMH. Cross-sectional studies which only did regression/correlation analyses also showed an association between high WMH burden and low CBF. However, the differences between groups in most brain regions were largely attenuated by excluding dementia and non-age-matched studies, except global mean CBF and CBF in centrum semiovale which remained significant and the point estimate did not move. These results suggest that disease severity and age confound the relationship between WMH and CBF, which was again supported by results from longitudinal studies showing that high burden of WMH predated falling CBF. 10 Additionally, in regression/correlation-only cross-sectional studies where a negative association between WMH and CBF was found, the correlation tends to be significant in more severe patients. 37
These results indicate that the reduced CBF in patients with WMH might reflect a reduction in the blood supply required by the tissue, due to reduced neuronal activity, or atrophy with fewer cells. As most included studies recorded CBF in cortical grey matter, these associations between reduced CBF and cortical atrophy should not be overlooked. Cortical atrophy is known to occur with the aging process. Results from a large cohort study demonstrated that baseline brain atrophy predicted decline in total CBF over time. 49 There are many imaging studies reporting an association between cortical atrophy and WMH severity. 50 However, there is little information about cortical volume from included studies. Although data for white matter are limited, CBF in frontal and occipital white matter regions changed in the similar way as in grey matter. Results in DWMH and in PVWM differed: a longitudinal study showed that decreasing CBF over time was related to progression of PVWMH rather than to that of DWMH, 12 which is in agreement with a cross-sectional study showing depressed CBF only in NAWM in periventricular regions. 25 The contradictory results from white matter indicate that there might be differential vulnerability for DWMH and PVWMH as these two brain areas are on different sections of the arteriolar tree. 25 However, such a suggestion is not supported by available data – studies indicate that PVWMH and DWMH are on a continuum in terms of location. 51
The limitation of resting CBF is that it only provides information of a cut-off time point at which CBF might still to be relatively preserved or compensated especially in the early stage of disease. 52 One of the included studies showed a reduced CBF response to hypercapnia in non-demented hypertensive patients with leukoaraiosis while resting CBF was shown to be unaffected. 6 Reduced cerebral vascular reactivity (CVR) represents the dilatory ability of brain vessels, has been suggested as an alternative mechanism of SVD. Risk factors such as hypertension alter the structure of penetrating arterioles by promoting lipohyalinosis and vessel wall thickening, which has led to the suggestion that cerebral arterioles might become stiffer and thus cause a decrease in vasodilatory capacity. Evidences from other studies also suggest that the reduction in CVR might play a critical role in the disease process of SVD. 53 Further studies are required to investigate how blood flow responsiveness (not just resting CBF) varies across different tissues (NAWM, WMHs and grey matter), and how it changes across the course of the disease.
In conclusion, despite large heterogeneities across included studies and the cross-sectional nature of most studies, this systematic review showed that CBF was negatively related to WMH severity. Our results suggest that hypoperfusion in the whole brain and low cortical blood flow is more likely a consequence of WMH than the cause. However, whether WMH is due to focal ischemia in particular white matter tissues and whether development of PVWMHs and DWMHs differs in mechanisms still remain unanswered. This systematic review emphasises that more data are needed for white matter, especially separate data for NAWM and WMH. Future studies should obtain longitudinal data from white matter as well as grey matter, have larger sample sizes, include appropriate control groups, stratify by and adjust for important cofounders such as age, important risk factors like hypertension, clinical diagnosis (including the type of dementia if relevant), by different features and severities of SVD and by cognitive status. In addition, if studying patients with acute stroke, it would be better to avoid the acute phase after stroke for imaging assessments to avoid effects of the acute stroke interfering with the study of WMH. Moreover, investigation of alternative mechanisms such as impaired CVR and effects of blood–brain barrier changes should be pursued in parallel with CBF measurement to provide new perspectives on treatment for SVD.
Footnotes
Dedication
This paper is dedicated to the memory of Dr Anton J M de Craen who is sorely missed.
Funding
The author(s) disclosed receipt of the following financial support for the research, authorship, and/or publication of this article: Y.S. is funded by China Scholarships Council. M.J.T. is funded by NHS Lothian Research and Development Office. A.J.M.D.C. was and M.A.VB. is an investigator of PROSPER study which was sponsored by an investigator-initiated grant from Bristol Myers-Squibb (Princeton, NJ). J.M.W. was supported by the Scottish Funding Council and Chief Scientist Office through the Scottish Imaging Network A Platform for Scientific Excellence (SINAPSE), the Wellcome Trust funding for SJM and the Medical Research Council through the Centre for Cognitive Ageing and Cognitive Epidemiology (CCACE). The authors hold the data independently of funders.
Acknowledgements
We thank Dr Francesca Chappell and Dr Emily Sena for providing advice on statistical analysis.
Declaration of conflicting interests
The author(s) declared no potential conflicts of interest with respect to the research, authorship, and/or publication of this article.
Authors’ contributions
S.D.M. and J.M.W. conceived the idea of the study. Y.S. and J.M.W. designed the study. Y.S. did the data search and extracted data and statistical analyses. A.J.M.D.C. (now deceased), M.A.VB. and M.I.G. provided unpublished data for two longitudinal studies. J.M.W. cross-checked the data. Y.S. drafted the report and designed the tables and figures. J.M.W., M.J.T., S.M., I.M., A.J.M.D.C., M.A.VB. and M.I.G. revised the report. All authors approved the manuscript. We regret to report the sudden death of A.J.M.D.C. who is sorely missed and to whom this paper is dedicated.
References
Supplementary Material
Please find the following supplemental material available below.
For Open Access articles published under a Creative Commons License, all supplemental material carries the same license as the article it is associated with.
For non-Open Access articles published, all supplemental material carries a non-exclusive license, and permission requests for re-use of supplemental material or any part of supplemental material shall be sent directly to the copyright owner as specified in the copyright notice associated with the article.