
Abstract
The analysis of cerebral perivascular spaces (PVS) using magnetic resonance imaging (MRI) allows to explore in vivo their contributions to neurological disorders. To date the normal amount and distribution of PVS in healthy human brains are not known, thus hampering our ability to define with confidence pathogenic alterations. Furthermore, it is unclear which biological factors can influence the presence and size of PVS on MRI. We performed exploratory data analysis of PVS volume and distribution in a large population of healthy individuals (n = 897, age = 28.8 ± 3.7). Here we describe the global and regional amount of PVS in the white matter, which can be used as a reference for clinicians and researchers investigating PVS and may help the interpretation of the structural changes affecting PVS in pathological states. We found a relatively high inter-subject variability in the PVS amount in this population of healthy adults (range: 1.31–14.49 cm3). The PVS volume was higher in older and male individuals. Moreover, we identified body mass index, time of day, and genetics as new elements significantly affecting PVS in vivo under physiological conditions, offering a valuable foundation to future studies aimed at understanding the physiology of perivascular flow.
Introduction
Perivascular spaces (PVS), also known as Virchow-Robin spaces, are tube-shaped structures that surround perforating arteries and small blood vessels in the brain parenchyma, including arterioles, venules, and capillaries. 1 PVS is a major component of the brain clearance system and accommodates the influx of CSF to the cerebral parenchyma through the peri-arterial space and the efflux of interstitial fluid to the lymphatic system through the peri-venous space. 2 , 3 Detecting pathological PVS changes is of high clinical significance because it provides mechanistic insight into disease pathology, aids in diagnosis, and can be used for disease monitoring, as PVS alterations may precede and be more reversible than demyelination and axonal loss in neurodegenerative disorders. 4 , 5 However, the physiological profile of the PVS is not fully understood, limiting the ability to identify and recognize PVS abnormalities in neurological disorders, especially in subclinical phases of the disease.
In the past two decades, improvements in imaging and post-processing techniques as well as the more widespread use of ultra-high field MRI systems supported significantly enhanced evaluation of PVS, and increasing attention has been dedicated to PVS, their pathophysiological variations, and their potential role as a diagnostic biomarker.6–9 In fact, to date increased PVS visibility on human MRI studies has been found associated with aging 10 and a number of pathologic conditions, such as neuropsychiatric and sleep disorders,11–15 multiple sclerosis, 16 , 17 mild traumatic brain injury, 18 , 19 Parkinson’s disease, 20 post-traumatic epilepsy, 19 myotonic dystrophy, 21 systemic lupus erythematosus, 22 cerebral small vessel disease,23–27 and cerebral amyloid-β pathologies, including Alzheimer’s disease and cerebral amyloid angiopathy.28–31 These findings suggest that a higher number of MRI-visible PVS might be an indicator of impaired brain health, although not specific for any single disease.
Despite the increased interest in the role of PVS within the scientific community, there are several unsolved controversies regarding in vivo PVS analysis using MRI. Resolving these issues is critical for the interpretation of the results derived from PVS studies. 5 , 32 Some of the main problems include: 1) the definition of the enlarged PVS: traditionally, the increased number of detected PVS on MRI has been interpreted as an enlargement of PVS, but there is no agreement regarding the radiological definition of enlarged PVS, as there is no quantitative measure of PVS in healthy people; 2) the visual scoring used in most studies focus on basal ganglia and centrum semiovale, but the distribution of PVS in other regions of the white matter is unknown; 3) the role and effect of clinical and genetic factors on the physiological amount of PVS have not been thoroughly investigated.
In this study, we provide the first quantitative analysis of PVS performed using submilliter MRI in a large population of 897 healthy adults from the human connectome project (HCP). 33 We describe the regional distribution and extent of PVS in the white matter of the human brain, which can be used by researchers and clinicians as a resource for the quantitative analysis of physiological PVS. The age range of participants was 22–37 years old and was chosen to represent healthy adults beyond the age of major neurodevelopmental changes and before the onset of neurodegenerative alterations. 33 We also investigated the relationship between PVS and multiple demographic, clinical, and genetic parameters in order to understand which factors may significantly influence the amount of PVS in healthy adults.
Material and methods
Study population
A total of 897 participants were identified from the HCP study (S900 release). 33 According to how the HCP study has been designed and performed, recruiting efforts were aimed at ensuring that participants broadly reflect the ethnic and racial composition of the U.S. population as represented in the 2000 decennial census. 34 The goal was to recruit a pool of individuals that is generally representative of the population at large, in order to capture a wide range of variability in healthy individuals with respect to behavioral, ethnic, and socioeconomic diversity. 34 The study protocol was approved by the Institutional Review Board at the University of Southern California (IRB# HS-19-00448) conforming with the World Medical Association Declaration of Helsinki. Written consent was obtained from all participants at the beginning of the first day of involvement in the project. 34 Only healthy individuals were included in the study (inclusion and exclusion criteria listed in Supplementary Table 1).
Clinical and behavioral data
Collected demographic and clinical data included: age, sex, height and weight with the corresponding body mass index (BMI), blood pressure, years of education, hematocrit, glycated hemoglobin, and thyroid-stimulating hormone in blood. Information about alcohol consumption and tobacco smoking was collected through the Semi-Structured Assessment for the Genetics of Alcoholism interview (SSAGA). 35 The NIH Toolbox (http://www.nihtoolbox.org) was used to assess the domains of cognition, emotion, motor function, and sensation. 33 Additionally, each participant underwent the Mini-Mental State Examination (MMSE). 36 The Pittsburgh Sleep Quality Index was used to evaluate sleep quality and quantity 37 (Supplementary Material).
MRI methods and analysis
The preprocessed T1-weighted (TR 2400 ms, TE 2.14 ms, TI 1000 ms, FOV 224x224 mm) and T2-weighted (TR 3200 ms, TE 5.65 ms, FOV 224x224 mm) images of the HCP, 38 acquired at 0.7 mm3 resolution on a Siemens 3T Skyra scanner (Siemens Medical Solutions, Erlangen, Germany), were used for the PVS analysis. Multiple quality control steps have been applied before, during, and after each scan session, in order to acquire high quality MRI data with minimal occurrence of motion artifacts. 39 The preprocessing steps included: correction for gradient nonlinearity, readout, and bias field; alignment to anterior commissure-posterior commissure subject space; registration to MNI 152 space using the FNIRT function in FSL; 40 generation of individual cortical, white matter, and pial surfaces and volumes using the FreeSurfer software 41 and the HCP pipelines. 38
PVS analysis
For PVS quantification and mapping, we first enhanced the visibility of PVS and then automatically segmented PVS across the white matter. We combined T1- and T2-weighted images that were adaptively filtered to remove non-structured high-frequency spatial noise by using a filtering patch which removes the noise at a single-voxel level and preserves signal intensities that are spatially repeated, thus preserving PVS voxels.
42
,
43
Non-local mean was used for removing high frequency noise, which measures the image intensity similarities by considering the neighboring voxels in a blockwise fashion, where filtered image is
We then used n-tissue parcellation technique of the Advanced Normalization Tools (ANTs) package.
44
,
45
Parcellated white matter was used as a mask for PVS analysis. For PVS segmentation, we first applied Frangi filter,
46
using Quantitative Imaging Toolkit,
47
which extracts the likelihood of a voxel belonging to a PVS. The Frangi filter has been shown to be an adequate tool for PVS segmentation.
42
,48–52 Frangi filter estimates a vesselness measure for each voxel from eigenvectors of the Hessian matrix of the image. Default parameters of
The periventricular voxels were excluded via a dilated mask of the lateral ventricles in order to remove the incorrectly segmented PVS at the lateral ventricles-white matter boundary. 42 This PVS segmentation technique has been previously validated on the same MRI dataset. 42 Two expert PVS readers independently counted the PVS in the centrum semiovale of 100 MRI scans according to a validated visual rating scale. 53 The number of PVS obtained with our segmentation algorithm was compared with the numbers obtained by the experts: Lin’s concordance coefficient between the automated and the experts’ PVS counts was 0.81, the bias correction value was 0.88, and the Pearson correlation coefficient was 0.61. 42
Furthermore, the expert PVS readers reviewed 30 additional PVS masks and manually edited them removing the false positives PVS and segmenting the false negatives PVS in order to estimate the sensitivity and specificity of our segmentation technique to PVS voxels. The sensitivity and specificity were 97.7 ± 1.6% and 97.8 ± 1.8% (mean ± standard deviation), respectively. Among the 130/897 MRI scans and PVS masks visually analyzed by the expert readers, none of the images presented motion artifacts affecting the PVS segmentation. Finally, PVS ratio was extracted across the white matter regions, parcellated based on Desikan-Killiany atlas using FreeSurfer software. 54 The total PVS-white matter ratio was also estimated.
Genome-wide association analysis
The genome-wide association analysis is described in the Supplementary Material.
Statistical analysis
The statistical analysis was done using the R package version 1.2.5.55
The Shapiro-Wilk test for normality was used to assess data distribution. All data analyzed exhibited a distribution that was significantly different from normal distribution. Therefore, the following non-parametric tests were applied: the Wilcoxon matched-pairs signed rank test to compare differences across paired groups; the Wilcoxon rank sum (Mann-Whitney) test to compare two unmatched groups; the Kruskal-Wallis test to compare three or more unmatched group; correlations were measured using the Spearman’s coefficient.
In order to assess which demographic and clinical parameters influenced the amount of PVS measured in the brain, general linear models were applied, using one clinical factor at a time as independent variable, and the PVS ratio as dependent variable. The following factors were investigated: age, BMI, gender, systolic blood pressure, diastolic blood pressure, thyroid-stimulating hormone level, hematocrit, and glycated hemoglobin. After the identification of potentially significant factors, we performed a new general linear model analysis including all of them together as independent variables and the PVS ratio as the dependent variable. The two-way ANCOVA model was used to test the effect of gender and BMI on the PVS ratio controlling for age. On a separate analysis, we also investigated whether cigarette smoking and alcohol affect PVS.
When analyzing the relationship between PVS ratio and the results of the behavioral tests, a principal component analysis was initially applied to convert and reduce this set of variables into a set of linearly uncorrelated variables, since many of the behavioral scores were expected to have multi-collinearity. The first principal component, explaining most of the variance in behavioral measures, was then used to identify the most influential neurocognitive scores, which were employed in a series of linear models as dependent variables to investigate whether the PVS ratio is a predictor of cognitive performance. Regression models were fitted using the ordinary least square technique. The Benjamini-Hochberg method was adopted to correct for multiple comparisons with a false discovery rate of 0.05. All p-values were 2-sided and considered significant at <0.05.
Results
Analysis of PVS volume, ratio, and distribution across white matter regions
We were able to compute PVS volume in 897 participants (demographic and clinical data are reported in Table 1).
Demographic and clinical characteristics of participants from the Human Connectome Project (S900 Release) included in this study.
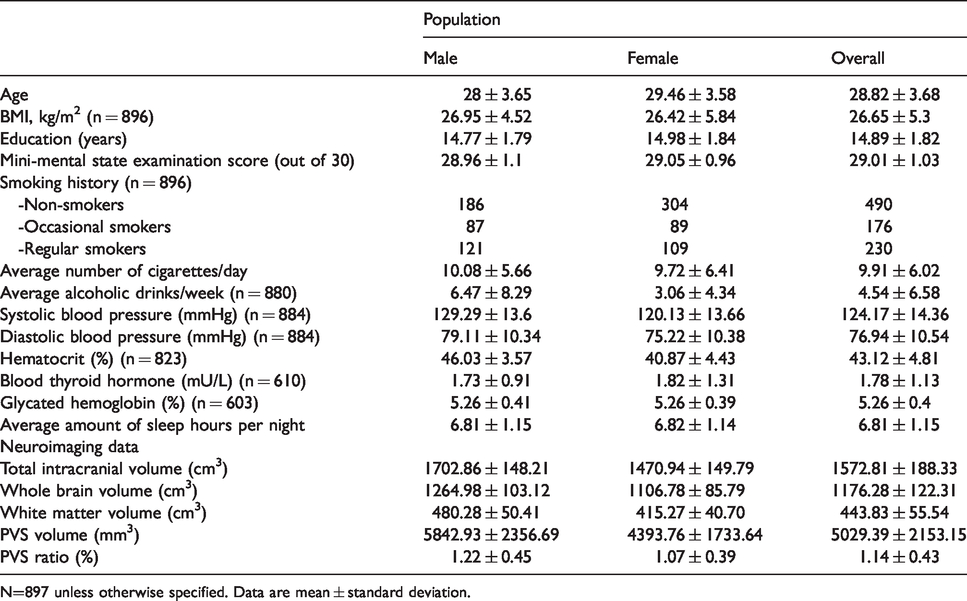
N=897 unless otherwise specified. Data are mean ± standard deviation.
The mean PVS volume in the white matter was 5.03 ± 2.15 cm3, with a high inter-subject variability (median: 4.68 cm3; 1st quartile (
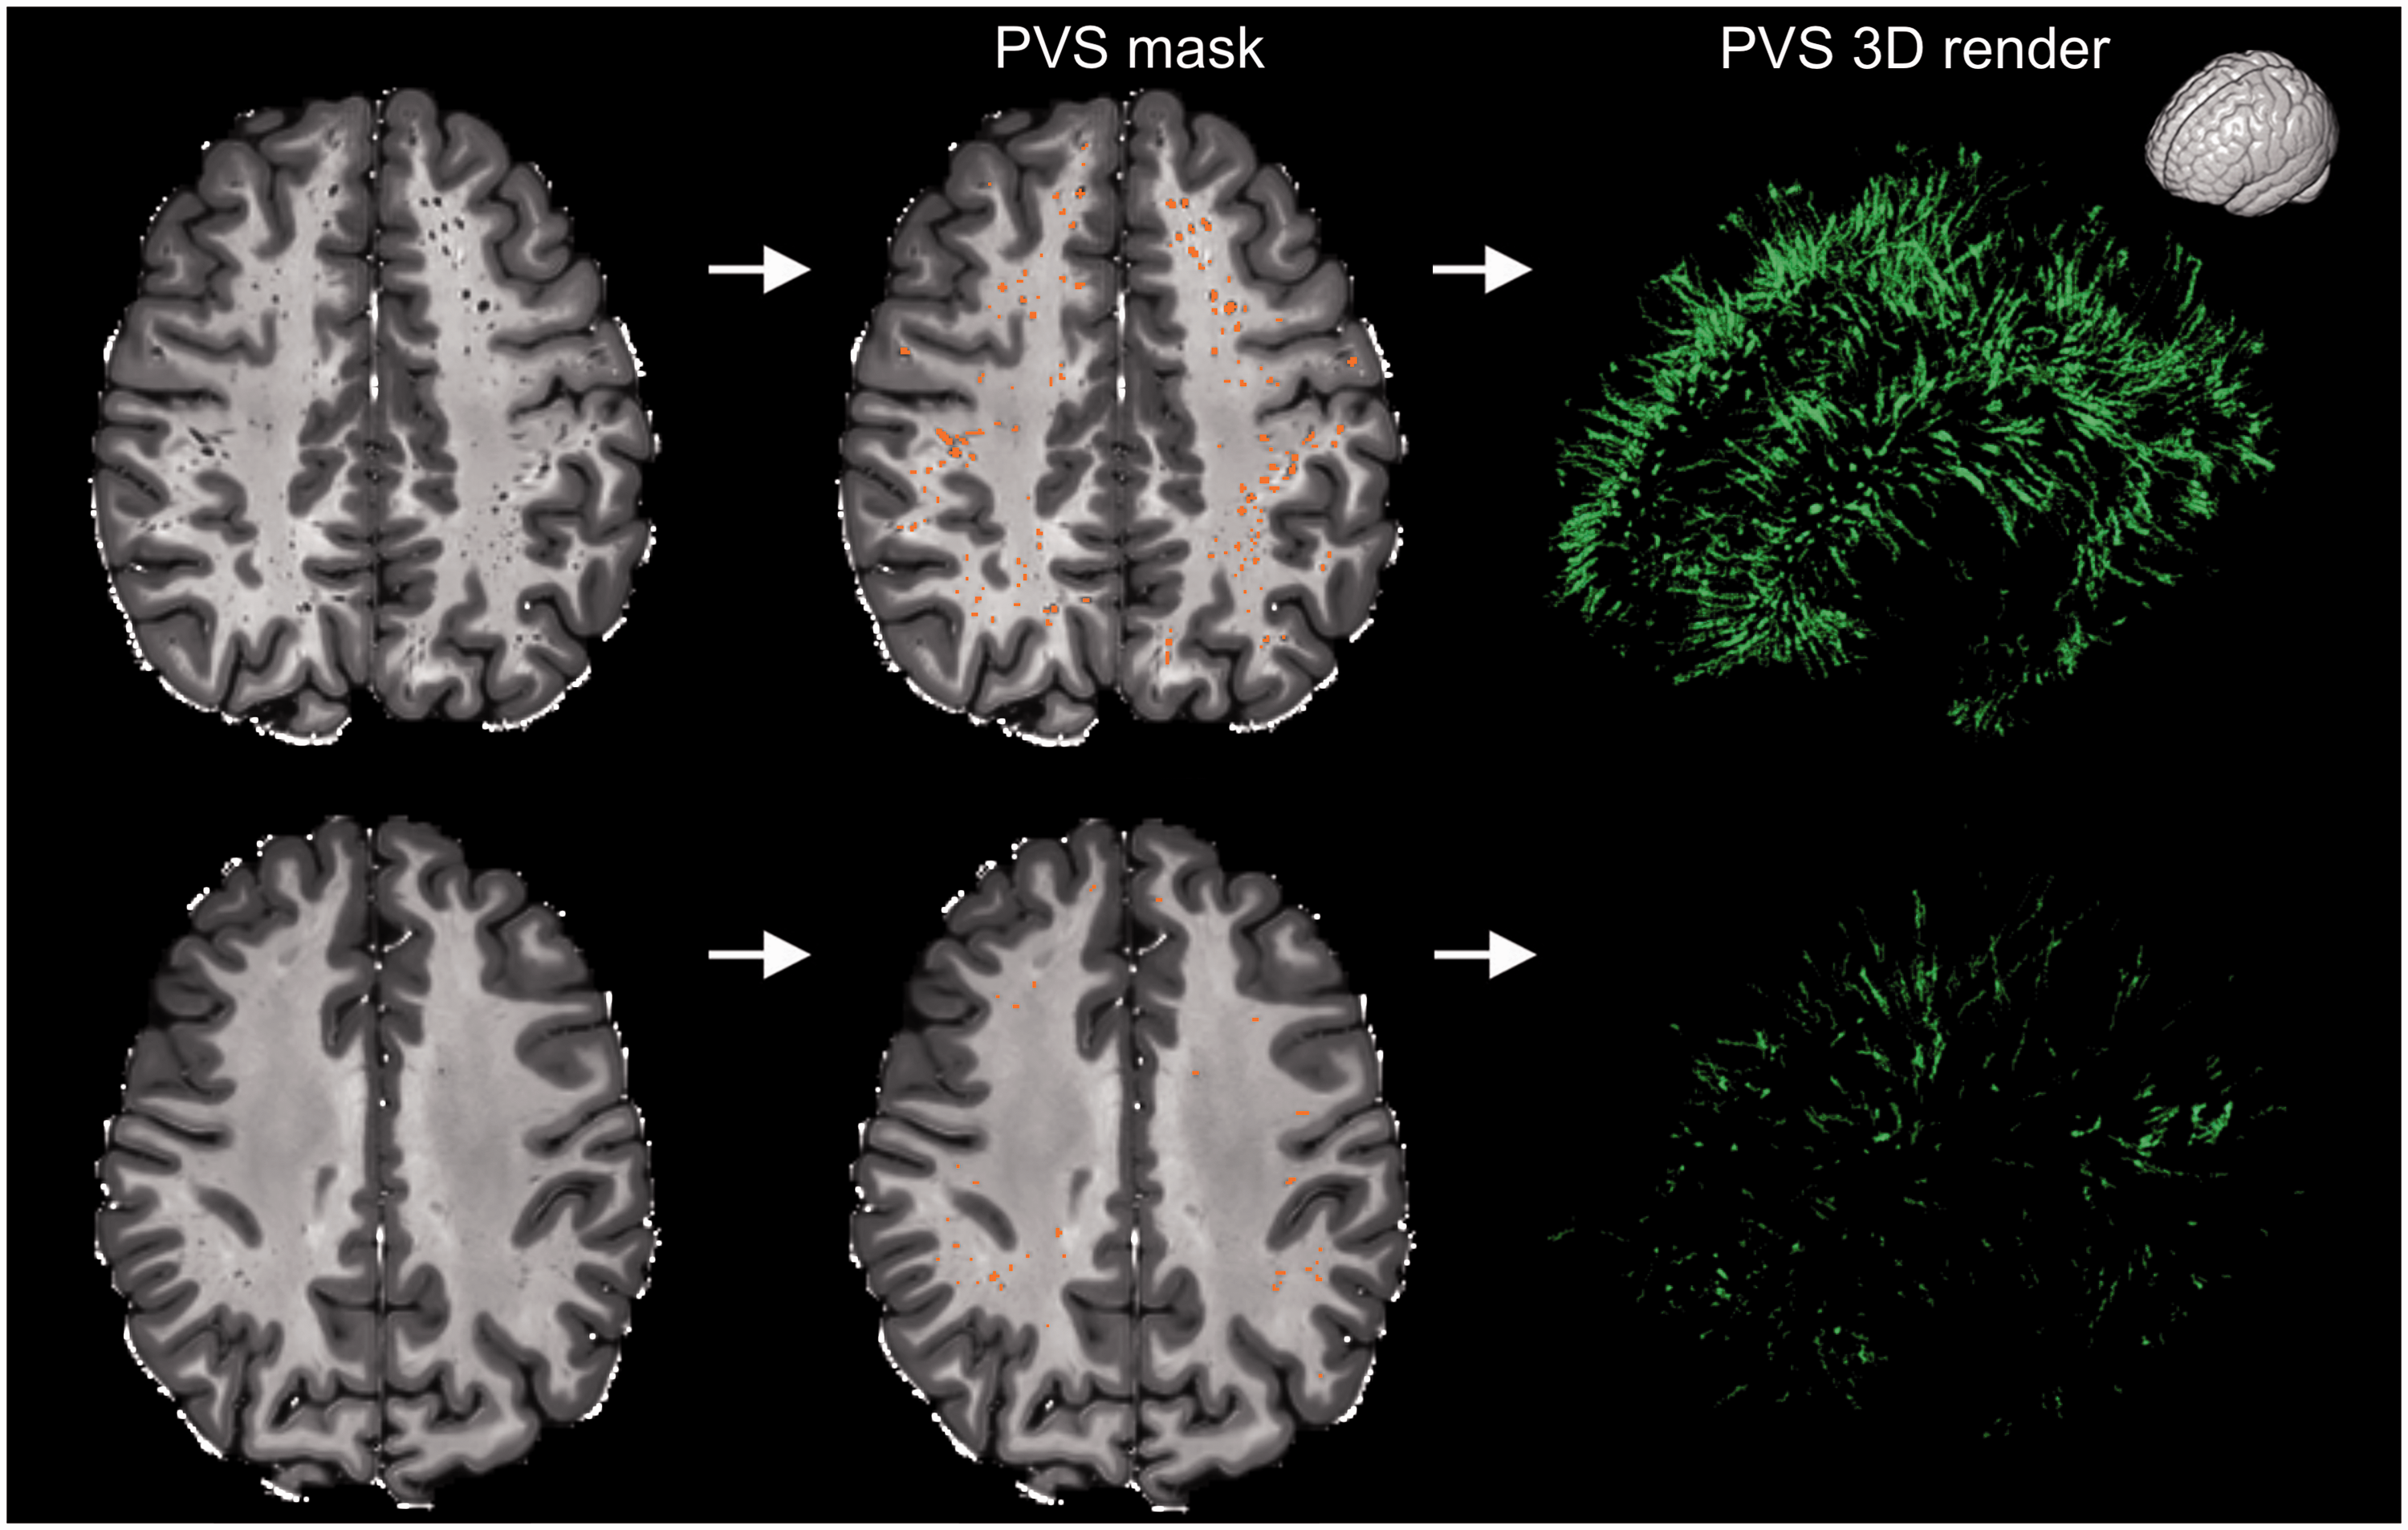
Examples showing the high inter-subject variability of perivascular spaces (PVS) in healthy participants. The participant on the top is a 32 years old male, while the participant on the bottom is a 22 years old female (two extreme cases are intentionally presented to highlight the high inter-subject variability in PVS). The MRI scans are shown on the left column and the PVS mask were overlaid in the center (orange). The images on the right are the corresponding 3D maps of the PVS masks. The orientation of the 3D maps is reported on the top right corner.
Among the ROIs segmented in the white matter, the superior frontal and parietal regions showed the highest percentage of PVS, including on average more than 8% and 6% of the total PVS volume, respectively (Figure 2(a) and Supplementary Figure 1).
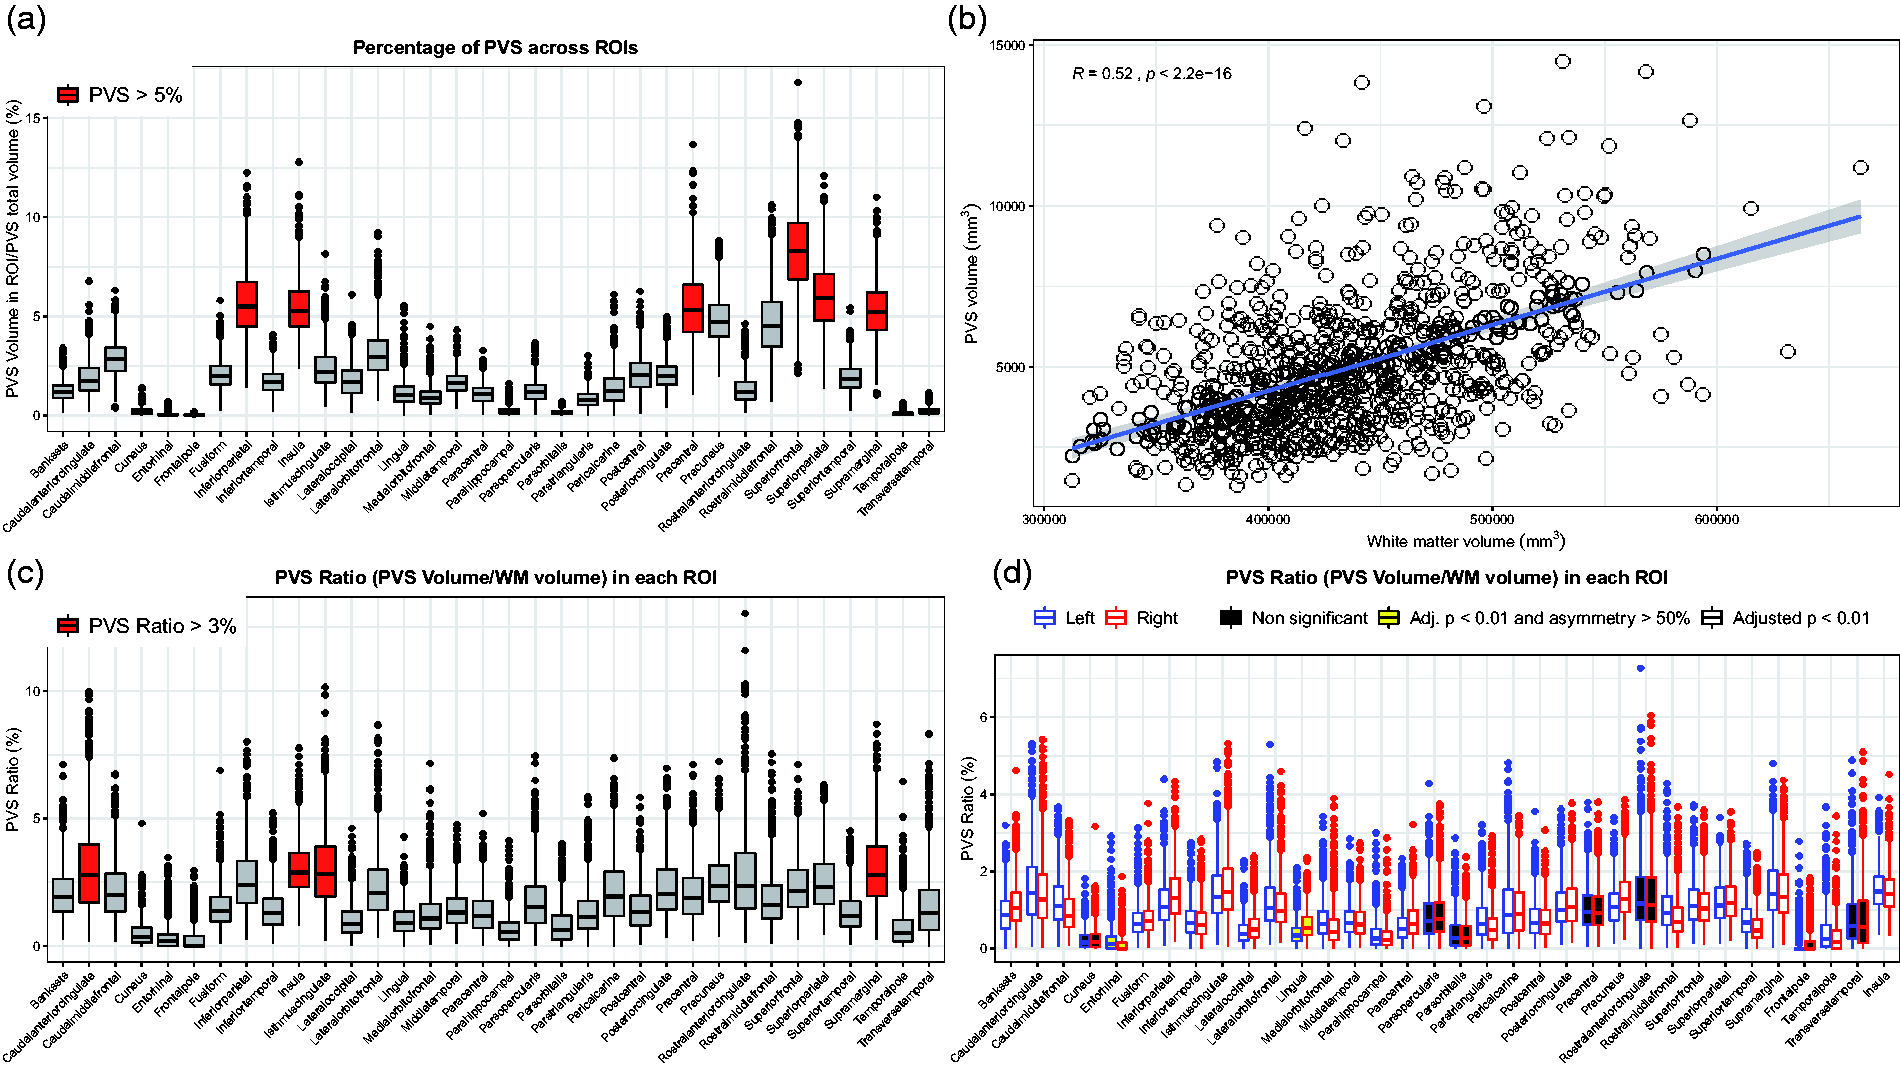
Distribution of the perivascular spaces (PVS) in the white matter and relationship between PVS and white matter. (a) Boxplot showing the percentage of perivascular space (PVS) in each region of interest (ROI). The ROIs showing more than 5% of total PVS volume are highlighted in red. X-axis labels are white matter regions, parcellated based on Desikan-Killiany atlas using FreeSurfer software. “Bankssts”: Banks of the Superior Temporal Sulcus. (b) Scatterplot showing the significant positive relationship between the measured perivascular space (PVS) and white matter volumes. Spearman's rank correlation coefficient. (c) Boxplot showing the PVS ratio (i.e., PVS volume/white matter volume) in each bilateral region of interest (ROI). The reported value in each ROI is the PVS ratio measured on the right and left side of the specific ROI combined. The ROIs with a PVS ratio higher than 3% are highlighted in red. (d) Boxplot showing the PVS ratio in each unilateral region of interest (ROI). For each ROI, the left boxplot represents the corresponding ROI on the left hemisphere (blue line), while the right boxplot is the corresponding ROI on the right hemisphere (red line). The adjusted p-values refer to the Wilcoxon matched-pairs signed rank test performed in each ROI to compare the two sides. The ROIs with a significant asymmetric distribution of PVS are in white boxes; the ROIs with a significantly asymmetric distribution of PVS having 50% higher PVS ratio on one side compared with its contralateral part are in yellow boxes; the ROIs with a symmetric distribution of PVS ratio across the two hemispheres (i.e., adjusted p-value > 0.01) are in black boxes. Outliers in boxplots show PVS values below
We observed a significant relationship between the PVS volume and the measured white matter volume, as assumed a priori (r = 0.52, p < 0.0001) (Figure 2(b)). Therefore, we calculated the PVS ratio, corresponding to the ratio between the PVS volume and the white matter volume.
The average PVS ratio in the whole white matter was 1.14 ± 0.43% (range: 0.34-3.13%). The regions with the highest PVS ratios were the white matter areas adjacent to the cingulate cortex, insula, and supramarginal gyrus (above 3%); on the other hand, the regions with the smallest PVS ratios were the white matter areas underlying the cuneus, entorhinal cortex, and the frontal pole cortex (Figure 2(c), Supplementary Figure 1, and Supplementary Table 2).
When comparing one side of each ROI with its contralateral part in the same subject, the relative difference in PVS ratio was 18% on average, variably exhibiting more PVS on the right or on the left side. All the regions showed a significant asymmetric distribution of PVS (Wilcoxon matched-pairs, p < 0.01), except the white matter areas underlying the frontal pole, pars orbitalis and opercularis, anterior cingulate, precentral, transverse temporal, cuneus, and pericalcarine regions. The white matter regions showing on average the highest asymmetric distribution of PVS were those underlying the lingual gyrus (50% higher PVS ratio on the right side) and the entorhinal cortex (120% higher PVS ratio on the left hemisphere) (Figure 2(d) and Supplementary Table 2).
Together, these results show that an asymmetric distribution of PVS across the two cerebral hemispheres can be considered physiological in most of the ROIs of healthy adults. Additionally, the entity of the asymmetry can be of great extent in some ROIs, with one side having a PVS ratio up to 120% higher than the contralateral side.
The PVS ratio is influenced by body mass index, age, and gender
Next, we investigated which demographic and clinical factors affect the amount of PVS in the brain under physiological conditions. In 897 participants (503 females and 394 males) included in the analysis, the mean age was 29.5 in females and 28 in males. The mean BMI was 26.7 kg/m2 and was slightly higher in males (26.95) compared with females (26.42). The univariate general linear models testing the clinical factors potentially related with the PVS ratio revealed 4 statistically significant variables: age, BMI, gender and systolic blood pressure (p < 0.01 in all cases; Table 2 and Figure 3(a) to (c)). Diastolic blood pressure, thyroid-stimulating hormone level, hematocrit, and glycated hemoglobin were not significant (Table 2). We included the significant factors as independent variables in a multivariate model testing PVS ratio as dependent variable: higher BMI, older age, and male gender, but not systolic blood pressure, are significant predictors of higher amount of PVS, although the average effect of these factors to PVS is relatively low (Table 2). To further analyze the effects of gender and BMI on PVS, we used a two-way ANCOVA model with 4 BMI groups ( < 20, 20–25, 25–30, >30), adjusting for age. The two-way interaction term between gender and BMI did not reach the statistical significance after controlling for the false discovery rate (Supplementary Table 3, p = 0.045). However, on the main effect analyses, we noted that the difference in PVS ratio between males and females is statistically significant in participants with BMI higher than 20 (Figure 3(d)). Interestingly, while in males the relationship between the increase in PVS ratio and the increase in BMI follows a linear trend, in females the increase in PVS is noted exclusively when the BMI is >30 (obese people) (Figure 3(d)). This result suggests that the relationship between BMI and PVS is distinct in males and females and not solely determined by a difference in BMI in the two groups.
Univariate and multivariate general linear models results.
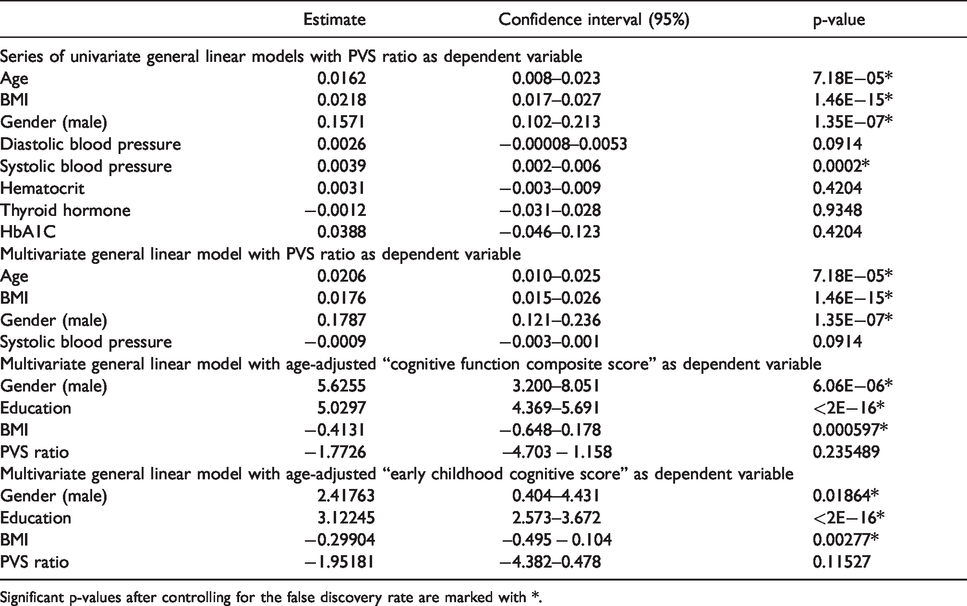
Significant p-values after controlling for the false discovery rate are marked with *.
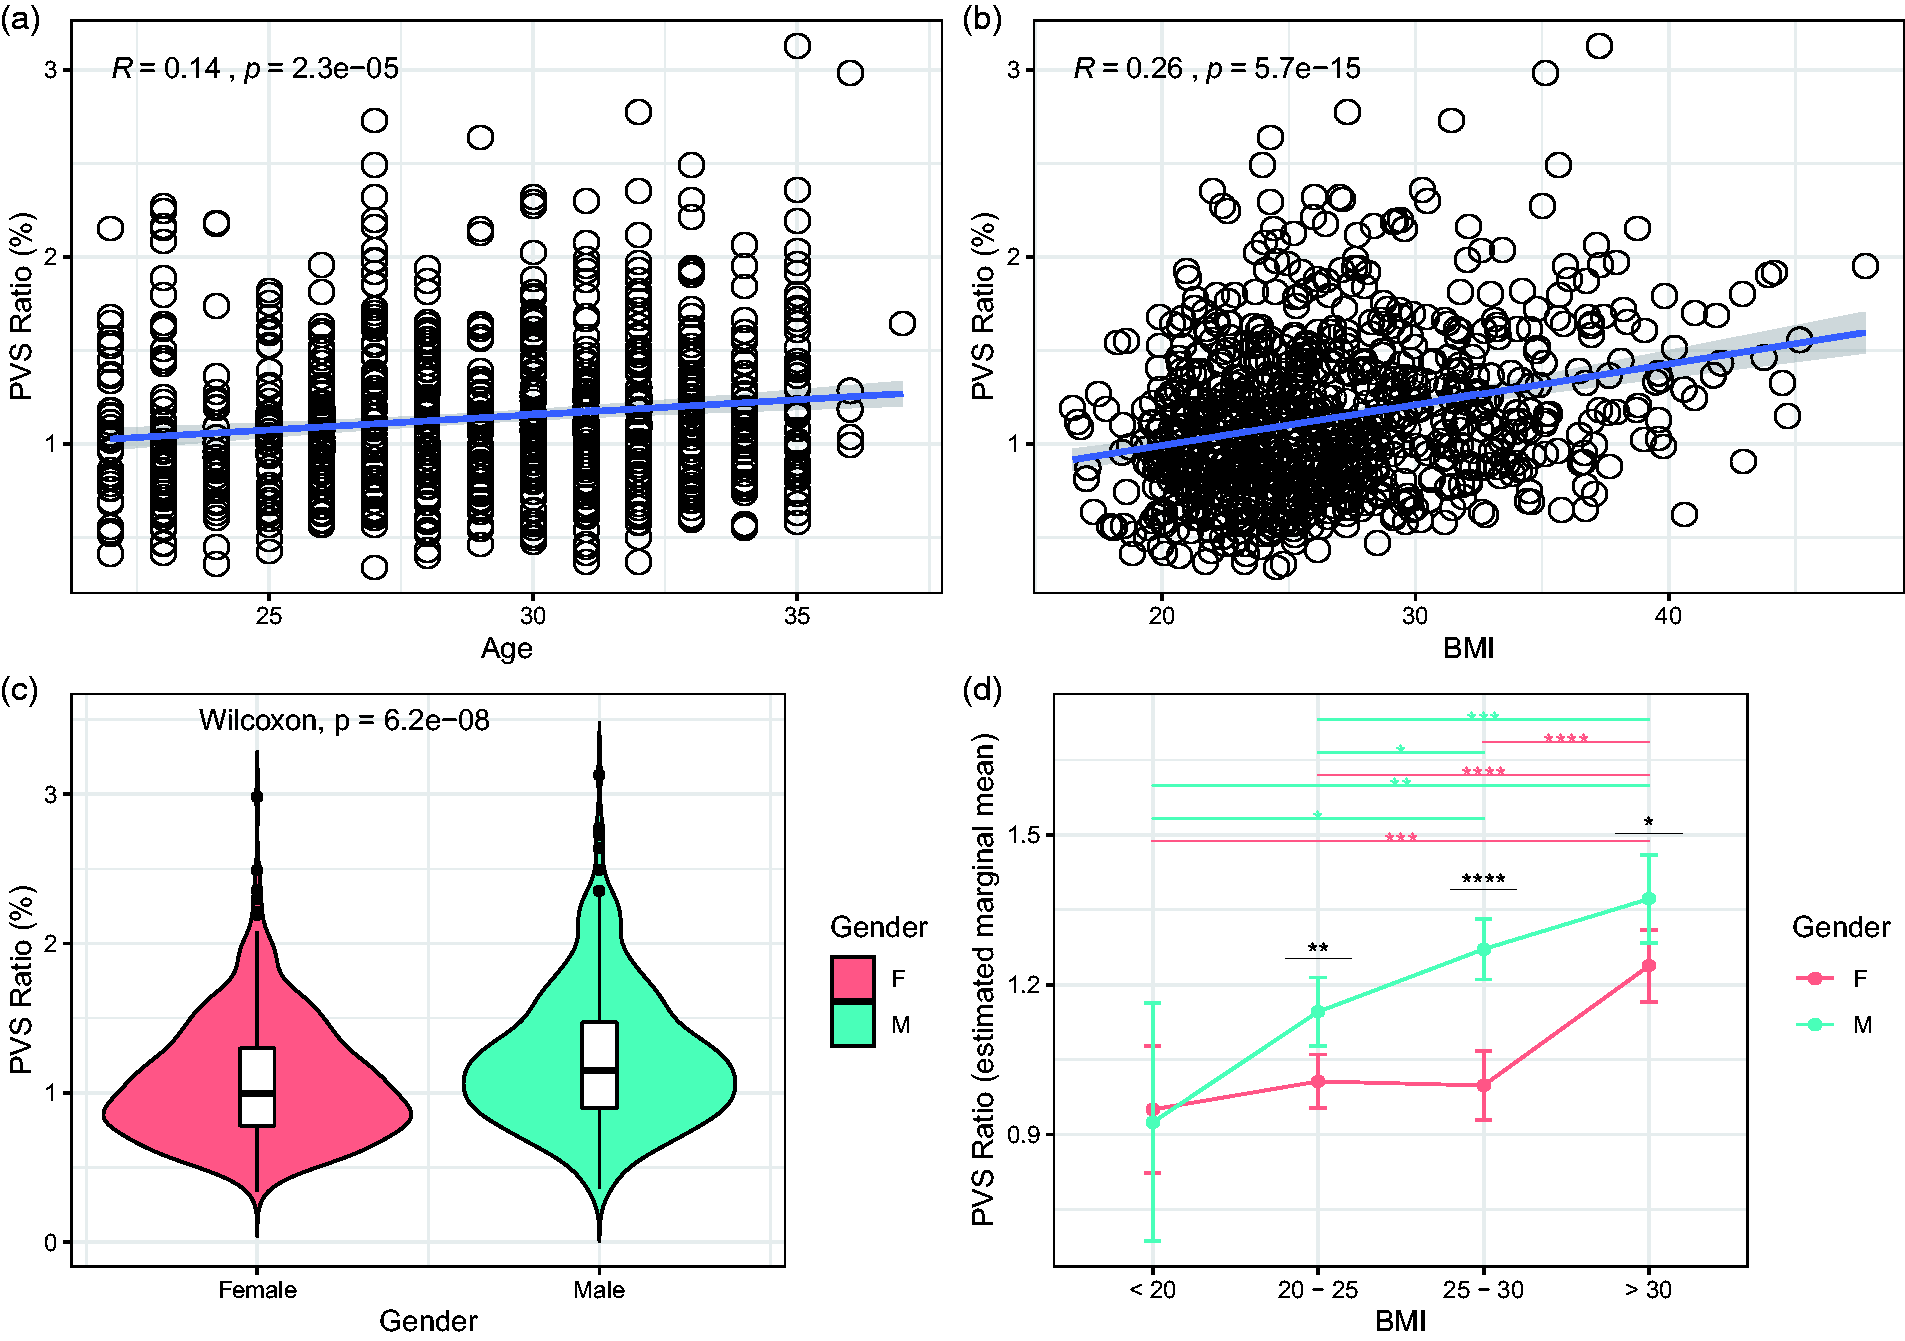
The perivascular space (PVS) ratio is influenced by age, body mass index (BMI), and gender. Scatterplots showing the relationship between PVS and age (a) and BMI (b) (Spearman’s rank correlation coefficient). (c) Violin plot showing the statistically significant difference in PVS ratio between males (green) and female (red) participants (Wilcoxon rank sum test). (d) Estimated marginal means of PVS ratio in males and females represented in each BMI group. Significance by ANCOVA for main effects (black *) and post-hoc comparisons (green and red *) controlling for age. The error bars are lower and upper bounds on a 95% confidence interval of the estimate. *: adjusted p-value < 0.05; **: adjusted p-value < 0.01; ***: adjusted p-value < 1x10⁻³; ****: adjusted p-value < 1x10⁻⁴. The following post-hoc comparisons were not significant after controlling for the false discovery rate: PVS ratio difference in males between BMI groups “20-25” and “25-30”; PVS ratio difference in males between BMI groups “< 20” and “25-30”.
We also investigated the role that cigarette smoking and alcohol could play in modulating PVS. The PVS ratio was not significantly different in regular smokers, occasional smokers, and non-smokers (Kruskal-Wallis, p = 0.49), and the number of cigarettes per day did not significantly correlate with the PVS ratio (r = –0.04, p = 0.55). The total number of alcoholic drinks consumed in one week on average was not significantly correlated with the PVS ratio (r = 0.55, p = 0.1).
In summary, this analysis shows that age, gender, and BMI influence the total volume of PVS, and that the relationship between BMI and PVS is different in males versus females.
Cognitive functions in healthy adults are not influenced by PVS
Whether the occurrence of MRI-visible PVS in the general elderly population is associated with cognitive dysfunction remains unclear. 56 , 57 We analyzed the effect of the PVS ratio to cognition in healthy young adults. The average years of education in this population are 14.9 ± 1.8 (range: 11–17) and the mean MMSE is 29 ± 1 (range: 23–30); the education level is slightly higher in females (14.98) compared with males (14.77), and MMSE is not significantly different in females compared with males (29.05 and 28.96, respectively; Wilcoxon, p = 0.44). The PVS ratio is not significantly correlated with the level of education (r = –0.04, p = 0.24, Supplementary Figure 3B) and the MMSE (r = 0.01, p = 0.73).
We performed a principal component analysis on a set of 19 NIH Toolbox age-adjusted behavioral tests to identify the tests explaining most of the variance: within the first component, explaining 30% of the variance, the most influential tests (loadings > 0.35) are the Cognitive Function Composite score (loading: 0.40) and the Early Childhood Composite score (loading: 0.37). These age-adjusted scores were included in a linear model (each at a time), corrected by gender and education, as dependent variables to investigate whether the PVS ratio affects cognitive performance. The models showed a significant trend towards the PVS ratio as a factor affecting both the Cognitive Function and the Early Childhood Composite scores (p = 0.0321 and p = 0.0150, respectively). However, when BMI was added as a covariate in both models, PVS ratio did not reach the statistical significance, while the BMI was found to be a significant factor for both the analyzed cognitive scores (p < 0.01 in both cases), where a higher BMI was associated with lower scores (Table 2). These results suggest that a higher amount of PVS in the brain of young adults does not significantly affect cognition, and that higher BMI is associated with lower cognitive scores. Therefore, the apparent association between the greater amount of PVS and worse cognitive performance in a healthy young population is potentially caused by the linear relationship between BMI and PVS.
The PVS ratio is influenced by the time of day
Next, we investigated whether the sleep quality and quantity as well as the time of day play a role in the extent of PVS detectable on MRI. In the whole cohort (n = 897), we did not find a significant relationship between PVS ratio and the average number of hours of sleep (r = –0.05, p = 0.11) or the sleep quality index (r = 0.04, p = 0.2). 45 participants (31 females, 14 males, mean age: 30.3 ± 3.3) from the HCP S900 release underwent a second MRI scan, with the same scanner and protocol, after 134 ± 63 days (median: 132; q0.25: 94; q0.75: 154; range: 18–328). We analyzed these scans in order to investigate whether the time of day influences the PVS volume. We tested whether in this dataset the designation of the time of day for the first and second MRI scans could be considered random or not. Based on the time of the earliest and the latest scan (acquired at 7:41 AM and 9:01 PM, respectively), we supposed that the MRI scanner was available from 7:30 AM to 9:30 PM. We assumed time slots of 30 minutes and an equal probability of being scanned in one of the possible 28 slots (from 7:30 AM to 9:00 PM), i.e. 0.04. Therefore, the expected number of participants (n = 45) being scanned in each time slot is 1.61 per time slot. For both the first and the second MRI scan, the observed frequency of acquisition times (rounded to the nearest half hour) was not significantly different from the expected (random) frequency of acquisition times (Chi-square test at 1% level of significance, 27 degrees of freedom, p = 0.78 and p = 0.68, respectively), hence we considered the designation of the time of day for the MRI scans to be random.
The mean BMI (26.9 ± 5.8) and amount of sleep (7.1 ± 0.9 hours) before the first MRI scan were not significantly different from those before the second MRI session (26.6 ± 5.7 and 7.2 ± 0.9, p = 0.23 and 0.41, respectively). The difference in minutes between the MRI scan performed at a later time of day and the MRI scan performed at an earlier time of day was computed (Figure 4(a)). The intra-individual difference in PVS volume between the MRI scan performed at a later time of day and the MRI scan performed at an earlier time of day was computed. We found a statistically significant relationship between the time difference and the PVS volume change (r = 0.34, p = 0.022, Figure 4(b)): the increase in PVS volume was greater when the difference between the time-of-day of the two MRI scans was larger. These results suggest that, in people with stable sleep habits, the amount of fluid within the PVS physiologically changes throughout the day, with more fluid detectable at later times of the day.
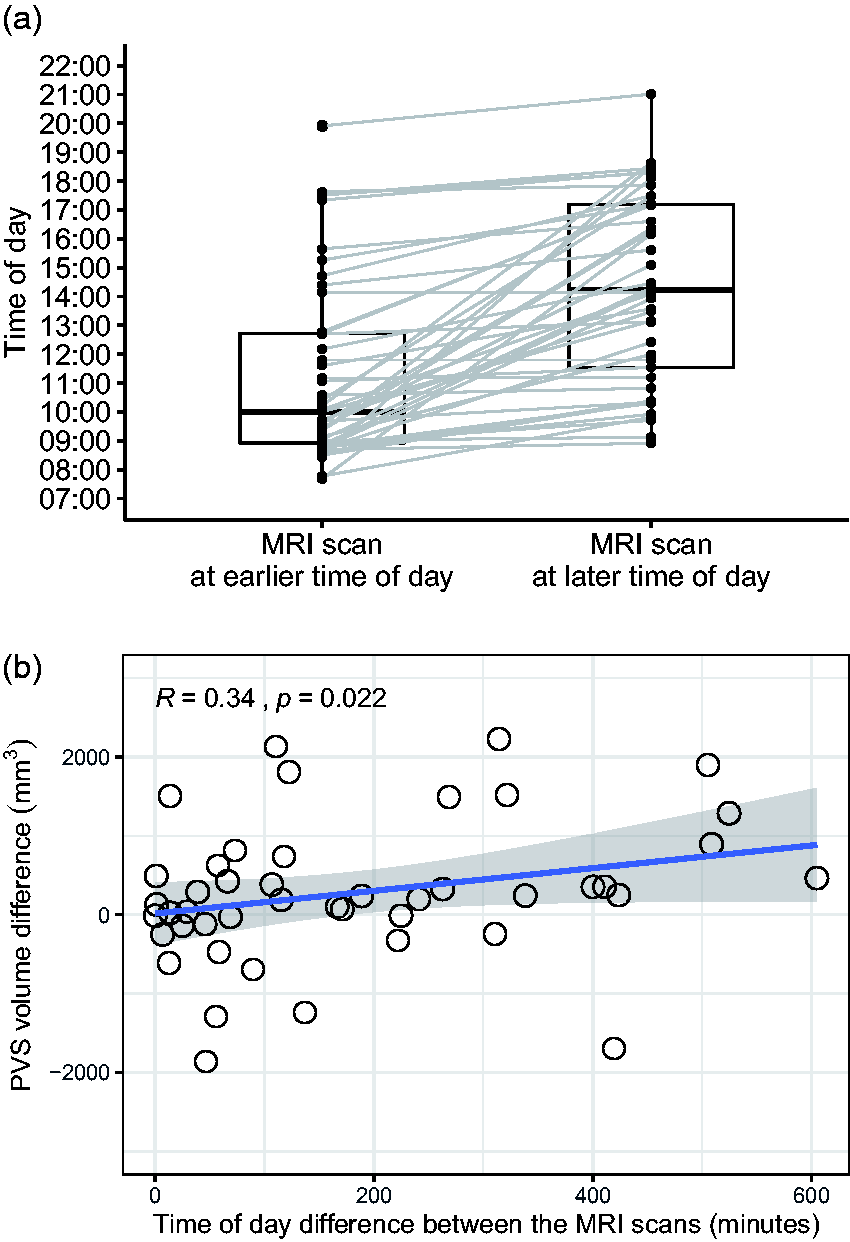
The perivascular space (PVS) volume in the single individual changes throughout the day. (a) Boxplot showing the difference in time of day between the MRI scan performed at a later time of day (right) and the MRI scan performed at an earlier time of day (left) in each participant (n=45). (b) Scatterplot showing the relationship between the difference in time-of-day the two MRI scans have been performed (in minutes) and the corresponding changes measured in the perivascular space volume (PVS). Spearman's rank correlation coefficient. None of the values included in this plot is a significant outlier (Extreme studentized deviate method, p>0.01).
The PVS ratio is influenced by genetic factors
Finally, to study the relationship between PVS and genetic factors, we focused on 3 groups: 51 couples of monozygotic twins (62 females and 40 males, mean age: 29.3 ± 3.4), 29 couples of dizygotic twins (36 females and 22 males, mean age: 29.3 ± 3.3), and 143 couples of non-twin siblings (148 females and 138 males, mean age: 28.4 ± 3.9) available on the HCP dataset. The correlation between the PVS ratio of each participant with the PVS ratio of the corresponding sibling was statistically significant in monozygotic twins and non-twin siblings (p < 0.01 in both cases, Figure 5(a) and (c)), but did not reach statistical significance in dizygotic twins after controlling for the false discovery rate, possibly due to the lower sample size (p = 0.037, Figure 5(b)). The correlation was still significant when all couples of siblings (twins and non-twins) were grouped together (r = 0.54, p < 0.01). After randomization of the pairs, achieved by exchanging one member of the siblings with another member from a different couple, the correlation between the 2 PVS ratios in the new randomized couples was not significant anymore (r = 0.027, p = 0.64, Figure 5(d)). In any of the 3 groups, the difference in the PVS ratio measured across matched siblings was not correlated with the corresponding difference in BMI between each member of the pairs (p = 0.91, 0.34, and 0.97, in monozygotic, dizygotic, and non-twin siblings, respectively, Supplementary Figure 2). These results suggest that genetic factors influence the amount of PVS in the brain.
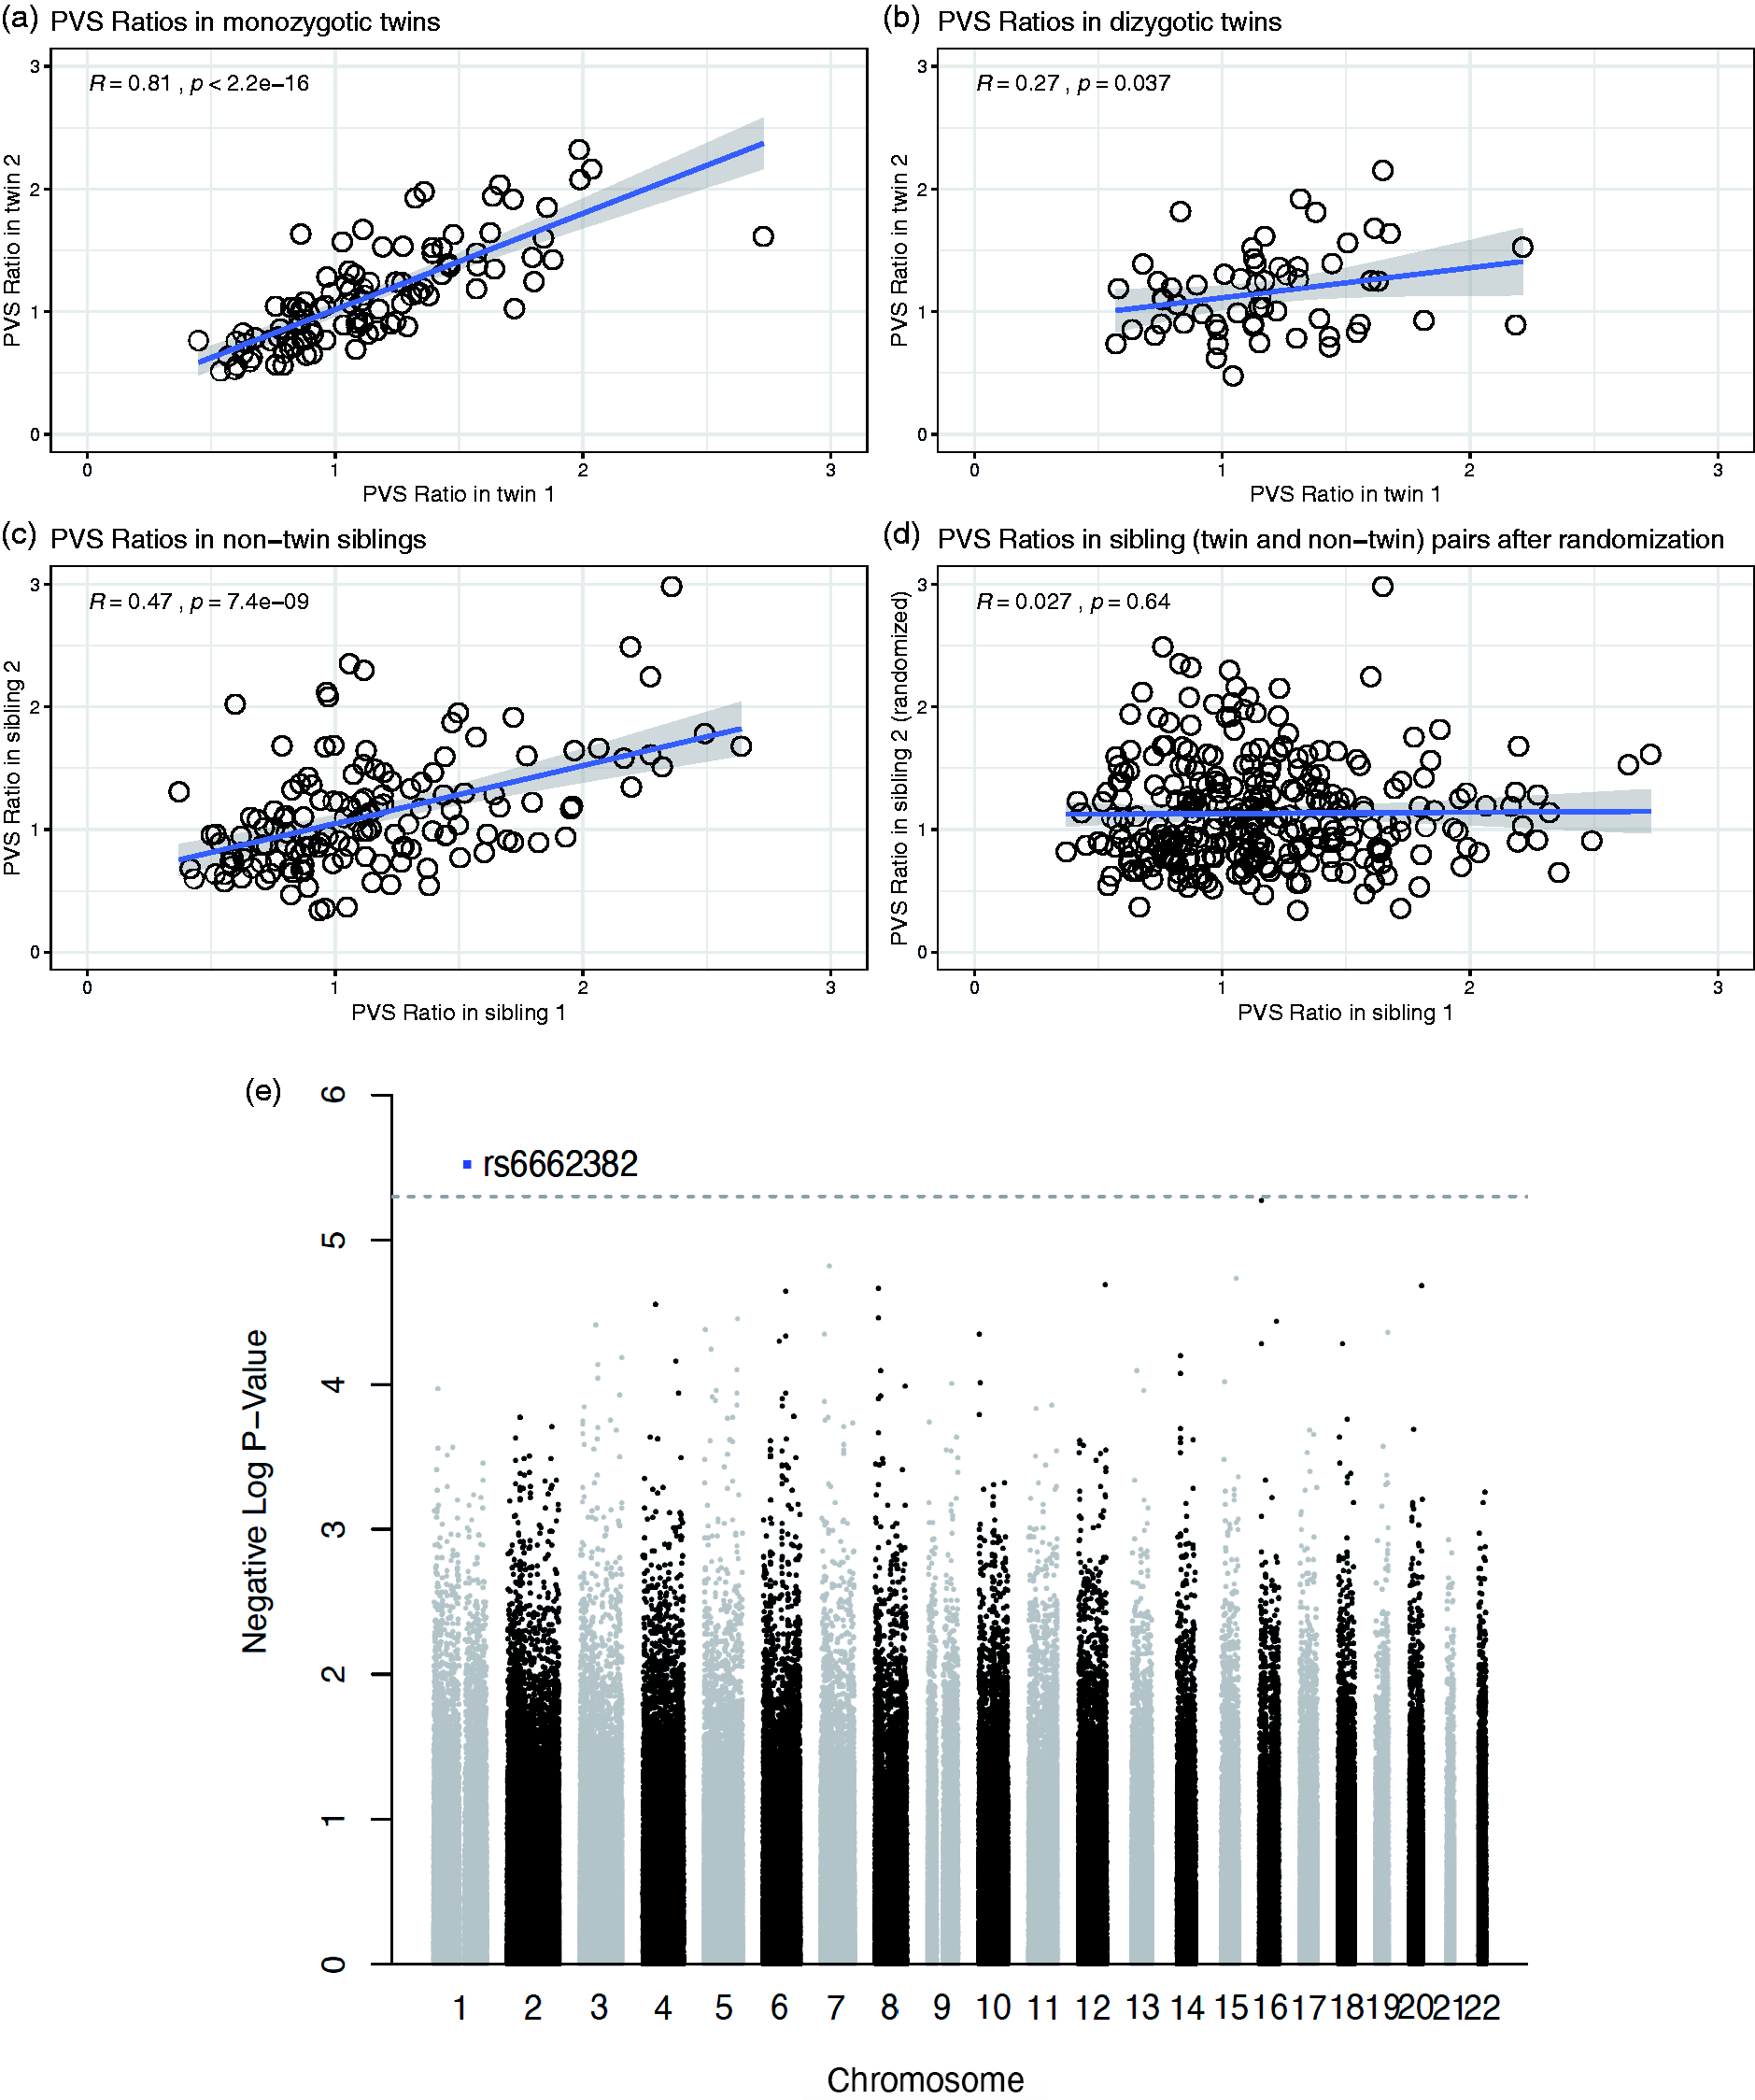
The perivascular space (PVS) ratio is influenced by genetics. Scatterplots showing the relationship of the PVS ratio in each member of the couples plotted against the PVS ratio of the corresponding sibling, in monozygotic twins (a), dizygotic twins (b), and non-twin siblings (c). (d) The correlation is not significant after randomization of one member in each couple, including twins and non-twin siblings. Spearman's rank correlation coefficient. (e) Manhattan plot showing the association p-values between SNPs and PVS ratio across the genome.
To gain insights on the specific genetic elements that could affect PVS, we performed a genome-wide association analysis in the 831 participants for which genetic data was available, with the goal of finding single nucleotide polymorphisms (SNPs) associated with PVS ratio. A SNP located in the OR10T2 gene (Olfactory Receptor Family 10 Subfamily T Member 2) in chromosome 1 was found to be significantly associated with PVS ratio at a suggestive association threshold (p = 3E-6. Figure 5(e)).
Discussion
Our findings demonstrate that perivascular spaces display a significant inter-subject variability in a healthy young population and that several factors contribute to the amount of PVS measured on MRI. We confirmed that the absolute volume of PVS is strongly correlated with the white matter volume, corroborating the importance of computing a white-matter-adjusted measure of PVS (PVS ratio). This is usually impracticable in the analysis performed with visual rating scales, representing a significant limiting factor for the correct interpretation of the results they can provide.
Concerning the distribution of PVS in the brain, the centrum semiovale and basal ganglia are typically recognized as the area where most of the PVS are usually visible, 58 but the physiological regional division in the white matter is not known. We showed that the majority of PVS are visible in the white matter below the superior frontal and parietal cortices, while the highest PVS ratio was found in the white matter adjacent to the cingulate and insular cortices (capsulae extrema and externa). Moreover, an asymmetric distribution of PVS across the two hemispheres was found in our healthy population, with some regions presenting more than 50% times higher PVS ratio on one side compared with the contralateral part. These results suggest that an asymmetric distribution of PVS across the white matter is possibly physiological and not related to pathology. Numerous types of data support the hypothesis that the human brain present asymmetries at multiple levels, including gross anatomy, cytoarchitecture, and functional level. 59 , 60 The cerebral blood flow and metabolic rate measured using Positron Emission Tomography and 15 O-labeled radiotracers, for example, were found to be asymmetric in multiple brain regions of healthy subjects, which was interpreted as a physiological asymmetry, 60 possibly caused by anatomical differences in the distribution of blood vessels and/or by the lateralization of brain functions. Similar asymmetries have also been found on functional MRI studies, based on blood oxygenation level-dependent contrast, in healthy people. 61 On the other hand, recent works in stroke and post-traumatic epilepsy show that the asymmetry in perivascular flow may play a key pathogenetic role in those diseases. 19 , 62 , 63 Further studies are required to clarify the significance of the asymmetric distribution of PVS volume in the white matter, to understand for example whether it corresponds to an asymmetric distribution of the blood vessels or to asymmetries in the flow of the perivascular fluid.
To our knowledge, this neuroimaging-based PVS map is the most structurally complete atlas of the human PVS to date and can be used as a resource for future quantitative investigations of PVS.
We also investigated factors potentially affecting PVS in a healthy population.
While aging has already been shown to be associated with more MRI-visible PVS, 64 we confirmed this finding even in a population with a relatively narrow age range (22–37). Interestingly, BMI represents a novel factor influencing the amount of PVS: BMI was the most significant variable correlated with PVS ratio in our population, although the correlation was relatively weak. Previous studies have shown that BMI has a linear relationship with CSF pressure in a population with normal CSF pressure values (8–15 mmHg). 65 Even though it was not possible to measure the CSF pressure in our population, this result suggests that the correlation between PVS and BMI could be a consequence of higher CSF pressure in participants with high BMI.
Additionally, obesity is known to critically affect vascular function, including the vascular contractile response, 66 which is thought to be one of the main factors driving fluid movement through the PVS. 67 Hence, vascular contractility could represent another link between BMI and PVS. Nevertheless, since BMI is a non-specific index which can be equally influenced by lean body mass, fat, and body fluid, the biological mechanisms explaining the relationship between BMI and PVS remain to be investigated.
Another interesting finding is that males showed higher PVS ratio than females. Previous studies using visual rating scores have reported greater prevalence of MRI-visible PVS in men compared with women, both in normal elderly and dementia cohorts. 10 , 31 , 68 Intriguingly, we observed an age-corrected gender difference in PVS ratio in all BMI groups except in participants with BMI less than 20 and the effect of BMI on PVS ratio is more pronounced in males compared with females, especially in people with BMI between 20 and 30. BMI is positively correlated with plasma biomarkers of inflammation. 69 The astrocytic response to inflammation has been previously demonstrated to be higher in males compared with females, possibly due to the perinatal testosterone which programs astrocytes for a different response to inflammatory challenges. 70 Therefore, the higher amount of PVS we found in male participants compared with BMI-matched females when BMI is higher than 20 might be related to a more vigorous inflammatory response in males, which can affect the perivascular flow and the size of PVS. 70 It would be interesting for future studies to explore the effects of high-fat diet on the cerebrovasculature and the perivascular flow, comparing males and females, and to verify the potentially different changes in the perivascular flow and whether these changes lead to pathological modifications at the cellular and cognitive levels.
Regarding cognitive function, our results do not substantiate a significant relationship between neuropsychological test scores and PVS ratio in young adults, although there is a trend showing more PVS in people who scored worse in some cognitive tests. Remarkably, this trend is mostly explained by the BMI, which appeared as a critical factor in relation with some cognitive scores, where a higher BMI was associated with lower scores. This finding, however, cannot support a biological causal connection between BMI and specific aspects of cognition. For example, it should be noted that in our population higher BMI was inversely correlated with the level of education (Supplementary Figure 3). In fact, several other epidemiological and cultural factors, potentially associated with BMI and not included in our analysis, could at least partially affect the scores obtained in the neuropsychological tests administered.
Concerning the analysis of sleep, previous human studies showed that people with impaired sleep efficiency and obstructive sleep apnea present increased PVS visibility, which was indirectly interpreted as PVS dysfunction. 15 , 71 Higher PVS volumes were correlated with objective polysomnography-derived measures of poor sleep quality. 15 Our findings do not show any significant difference in PVS ratio between people on different hours of sleep. This might be due not only to the high inter-subject variability on PVS related to other factors, but also to different body postures exhibited by each participant during sleep, 72 which were not considered in our study. In fact, animal studies showed that the position assumed during sleep is another critical factor affecting the CSF transport in the PVS. 72 Additionally, influence of sleep problems on the brain has been reported to occur in midlife and older ages, 73 , 74 so the effects on PVS might still be undetectable in the young population that we analyzed.
On the other hand, our results showed the time-of-day as an important element affecting the PVS volume. Specifically, a subset of people that underwent MRI scans twice in different days at different time showed a significantly higher PVS volume in the afternoon and the evening compared with the PVS volume measured on the same individual’ scan acquired at an earlier time of day, which is indicative of a circadian fluctuation in the perivascular flow. However, since the interval time between the two scans is relatively large, we cannot fully exclude that the changes detected in PVS volume might be determined by other factors, including aging. Increased uptake of CSF tracer gadobutrol into the entorhinal cortex overnight has been recently shown in patients with idiopathic normal pressure hydrocephalus and controls, 75 , 76 suggesting a critical role of natural sleep for glymphatic function, as indicated by studies in rodents. 77 A similar fluctuation has been also demonstrated in diffusivity measures of brain tissue derived from diffusion tensor imaging: mean diffusivity, which is significantly influenced by perivascular spaces as well, 78 was found to systematically increase from morning to afternoon scans. 79 More recently, the perivascular flow was also shown to be under circadian control in mice. 80 Here we further validated these findings, showing an increased amount of fluid within the PVS in the white matter at later time of day in the same person. These changes might be related to circadian oscillations in blood pressure and/or respiration, two regulators of the perivascular flow, 67 , 81 or to circadian regulation of the flow by aquaporin-4, a water channel supporting the fluid transport from the PVS to the cerebral parenchyma. 80
Finally, we analyzed for the first time the influence of genetic factors on the PVS ratio in a healthy population. We found that couples of siblings have more similar PVS ratio compared with couples of non-siblings. The similarity was more pronounced in monozygotic twins and was not explained by the difference in BMI. Subsequently, we looked for genome-wide significant association between SNPs and PVS ratio. Although none of the SNPs passed the Bonferroni threshold for GWAS, possibly because of the relatively small sample size of the analyzed cohort, SNPs that are associated with suggestive significance also provide crucial biological insights, given the polygenic and multifactorial nature of many complex phenotypes such as PVS. 82 Interestingly, the SNP showing the most significant association with PVS ratio was located in the OR10T2 gene, a highly conserved region which encodes for one type of olfactory receptors. Previous studies in humans and mammalians have shown an intimate connection between CSF circulation and olfactory-associated perineural, perivascular, and lymphatic compartments, which represent a significant drainage pathway and access route to the brain.83–87 Olfactory receptors may therefore represent an important regulator of the inflow and outflow of molecules in the perivascular spaces, consequently affecting the amount of fluid within the PVS.
Of note, since the measure and detectability of perivascular spaces depend on the resolution of the images, acquisition parameters, and the field strength of the MRI system 6 and can be significantly influenced by the presence of motion artifacts, a direct comparison of our results with data acquired at different field strength and/or resolution might be inappropriate. In addition to the quality and type of image, the tool used to segment PVS is another critical variable to take into consideration. Several approaches for PVS segmentation have been developed recently: 9 , 31 , 42 , 50 , 88 although some of them, including ours, make use of the Frangi filter to segment PVS, 9 , 42 , 50 it is important to note that different parameters and settings may lead to different outputs and measures of PVS.
This study represents the largest quantitative analysis of PVS in humans using MRI and the only one performed in healthy young adults. These findings can be used as a resource for clinicians and researchers investigating PVS: we provide PVS volumes, PVS/white matter ratios, and their regional distribution that can be helpful when studying PVS under pathological conditions and when attempting to identify patients with abnormal PVS size, location, and asymmetry. Moreover, we report several novel factors that significantly contribute to the observed high inter-subject variability of PVS visibility in healthy participants, that should be taken into consideration in future research studies analyzing PVS.
Supplemental Material
sj-pdf-1-jcb-10.1177_0271678X20972856 - Supplemental material for Body mass index, time of day, and genetics affect perivascular spaces in the white matter
Supplemental material, sj-pdf-1-jcb-10.1177_0271678X20972856 for Body mass index, time of day, and genetics affect perivascular spaces in the white matter by Giuseppe Barisano, Nasim Sheikh-Bahaei, Meng Law, Arthur W Toga and Farshid Sepehrband in Journal of Cerebral Blood Flow & Metabolism
Supplemental Material
sj-pdf-2-jcb-10.1177_0271678X20972856 - Supplemental material for Body mass index, time of day, and genetics affect perivascular spaces in the white matter
Supplemental material, sj-pdf-2-jcb-10.1177_0271678X20972856 for Body mass index, time of day, and genetics affect perivascular spaces in the white matter by Giuseppe Barisano, Nasim Sheikh-Bahaei, Meng Law, Arthur W Toga and Farshid Sepehrband in Journal of Cerebral Blood Flow & Metabolism
Supplemental Material
sj-pdf-3-jcb-10.1177_0271678X20972856 - Supplemental material for Body mass index, time of day, and genetics affect perivascular spaces in the white matter
Supplemental material, sj-pdf-3-jcb-10.1177_0271678X20972856 for Body mass index, time of day, and genetics affect perivascular spaces in the white matter by Giuseppe Barisano, Nasim Sheikh-Bahaei, Meng Law, Arthur W Toga and Farshid Sepehrband in Journal of Cerebral Blood Flow & Metabolism
Supplemental Material
sj-pdf-4-jcb-10.1177_0271678X20972856 - Supplemental material for Body mass index, time of day, and genetics affect perivascular spaces in the white matter
Supplemental material, sj-pdf-4-jcb-10.1177_0271678X20972856 for Body mass index, time of day, and genetics affect perivascular spaces in the white matter by Giuseppe Barisano, Nasim Sheikh-Bahaei, Meng Law, Arthur W Toga and Farshid Sepehrband in Journal of Cerebral Blood Flow & Metabolism
Footnotes
Acknowledgements
The authors would like to thank Lucia Ichino for her critical evaluation of the manuscript. The content is solely the responsibility of the authors and does not necessarily represent the official views of the NIH. Data were provided in part by the HCP, WU-Minn Consortium (1U54MH091657) and by the McDonnell Center for Systems Neuroscience at Washington University. MRI and clinical data can be accessed from ![]() .
.
Authors’ Contribution
G.B., F.S., N.S.B, M.L. and A.W.T. designed the research study. G.B., F.S., and N.S.B. analyzed and interpreted the data. F.S., N.S.B, M.L. and A.W.T. provided critical reading of the manuscript and G.B. wrote the manuscript. All authors edited and revised the manuscript and approved final submission.
Declaration of conflicting interests
The author(s) declared no potential conflicts of interest with respect to the research, authorship, and/or publication of this article.
Funding
The author(s) disclosed receipt of the following financial support for the research, authorship, and/or publication of this article: This research reported in this publication was supported by the National Institute of Mental Health of the NIH under Award Number RF1MH123223.
Supplementary material
Supplemental material for this article is available online.
References
Supplementary Material
Please find the following supplemental material available below.
For Open Access articles published under a Creative Commons License, all supplemental material carries the same license as the article it is associated with.
For non-Open Access articles published, all supplemental material carries a non-exclusive license, and permission requests for re-use of supplemental material or any part of supplemental material shall be sent directly to the copyright owner as specified in the copyright notice associated with the article.