
Abstract
Inhibition of histone deacetylases (HDACs) has been shown to reduce inflammation and white matter damage after various forms of brain injury via modulation of microglia/macrophage polarization. Previously we showed that the HDAC inhibitor scriptaid could attenuate white matter injury (WMI) after ICH. To access whether modulation of microglia/macrophage polarization might underlie this protection, we investigated the modulatory role of HDAC2 in microglia/macrophage polarization in response to WMI induced by intracerebral hemorrhage (ICH) and in primary microglia and oligodendrocyte co-cultures. HDAC2 activity was inhibited via conditional knockout of the Hdac2 gene in microglia or via administration of scriptaid. Conditional knockout of the Hdac2 gene in microglia and HDAC inhibition with scriptaid both improved neurological functional recovery and reduced WMI after ICH. Additionally, HDAC inhibition shifted microglia/macrophage polarization toward the M2 phenotype and reduced proinflammatory cytokine secretion after ICH in vivo. In vitro, a transwell co-culture model of microglia and oligodendrocytes also demonstrated that the HDAC inhibitor protected oligodendrocytes by modulating microglia polarization and mitigating neuroinflammation. Moreover, we found that scriptaid decreased the expression of pJAK2 and pSTAT1 in cultured microglia when stimulated with hemoglobin. Thus, HDAC inhibition ameliorated ICH-mediated neuroinflammation and WMI by modulating microglia/macrophage polarization.
Keywords
Introduction
Intracerebral hemorrhage (ICH) is a devastating subtype of stroke with high mortality and morbidity.1,2 Both gray matter and white matter injury (WMI) occur in ICH; however, WMI is a primary cause of poor outcome in ICH, usually resulting in disruption of signal transmission and neurological dysfunction.3,4 The pathophysiology of ICH includes primary and secondary injury, with neuroinflammation playing an important role in ICH-mediated secondary injury.5–9 Activation of microglia/macrophages plays an important role in the initiation and regulation of the immune response.10,11 As resident immune cells of the central nervous system (CNS), microglia play a dual (beneficial/detrimental) role in neurological diseases, especially in neuroinflammation after ICH. Indeed, after ICH, activated microglia polarize into either the classical M1 phenotype, secreting several pro-inflammatory cytokines, or the alternative M2 phenotype, producing anti-inflammatory factors that suppress the immune response and improve recovery after ICH.12–16 However, the underlying mechanisms driving microglia polarization after ICH are a topic that remain steeped in controversy.
Previous studies have demonstrated that histone deacetylase (HDAC) inhibitors suppress the inflammatory response and mitigate WMI after ischemic stroke or traumatic brain injury (TBI).17–20 Recent studies have suggested that the HDAC inhibitor, scriptaid, reduces gray matter and white matter damage. 21 Further, it has been shown to modulate microglia/macrophage polarization in an experimental mouse TBI model.17,18 Meanwhile, other HDAC inhibitors have been reported to confer neuroprotection in experimental rodent models of ICH.21–23 HDACs are grouped into four classes: I, II, III, and IV,24,25 and HDACs have been most widely studied in their classical role as histone modifiers and transcriptional repressors, especially class I HDACs, which includes HDACs 1, 2, 3, and 8. However, HDAC1 and HDAC2 are most abundantly expressed by microglia/macrophage and are significantly altered in microglia by LPS stimulation in vitro and in vivo.23–28 Inhibition of HDAC1 and HDAC2 activity after transient cerebral ischemia promoted microglia/macrophage polarization towards the M2 phenotype. 27 In addition, HDAC2 modulates functional recovery after stroke 28 and memory formation in mice. 29 In Parkinson’s disease, HDAC2 levels were significantly upregulated in nigral microglia. 30 Therefore, we hypothesize that HDAC2 plays an important role in modulating microglia polarization and alleviating white matter injury after ICH.
Many pathways play important roles in microglia/macrophage polarization, including the c-Jun N-terminal kinase (JNK), Notch, interleukin 10/glycogen synthase kinase 3/phosphatase and tensin homolog (IL10/GSK3/PTEN), and Janus kinase/signal transducers and activators of transcriptions (JAK/STAT)12,19,31,32 signaling pathways. Indeed, in a mouse TBI model, HDAC inhibition was shown to modulate the polarization of microglia/macrophages via the GSK3β/PTEN/Akt axis. In addition, many studies have reported that HDAC inhibitors suppress inflammation by inhibiting the JAK/STAT signaling pathway.19,33 However, few studies have reported the role of HDAC inhibitors in regulating the JAK/STAT signaling pathway after ICH. Therefore, we assessed the effects of HDAC inhibition on microglia/macrophage polarization and preservation of WMI after ICH, then investigated the specific mechanism of action relevant to their therapeutic effects.
Material and methods
Animals
C57BL/6 male mice (8–10 weeks, 20–26 g) were purchased from the Ling Chang biotechnological company (Shanghai, China). To investigate the function of HDAC2 in microglia after ICH, Cx3cr1CreER:Hdac2fl/fl conditional knockout mice (HDAC2 cKO mice) were generated by the Shanghai Model Organisms Center, Inc. Cx3cr1CreER mice and Hdac2fl/fl mice carrying the floxed Ifnar alleles but lacking Cre expression were used as controls. All animals were provided free access to food and water. Two weeks prior to induction of ICH, HDAC2 cKO mice received tamoxifen dissolved in warm corn oil for five days to induce gene recombination. RNA of HDAC2 exacted from sorting microglia was used to confirm HDAC2 was efficiently depleted in microglia (Supplemental Figure 1). All animal procedures were approved by the Animal Care and Use Committee of Fudan University and performed in accordance with the National Institutes of Health Guide for Care and Use of laboratory Animals. Experiments were reported according to the ARRIVE guidelines (http://www.nc3rs.org.uk/arrive). Animal group assignments were conducted at random using a lottery-drawing box. All main outcome studies, including neurobehavioral tests, electrophysiology, lesion volume, histology, and immunohistochemistry, were performed by investigators who were blind to group assignment and experimental conditions. Animals that died during or after surgery were excluded from the studies. The results for body weight and survival rate in each group are shown in the Supplemental Table 1.
ICH model
Wild-type (WT) and HDAC2 cKO mice were subjected to ICH as described previously.34,35 Briefly, animals were anesthetized with 4% chloral hydrate intraperitoneally. Blood was obtained from each animal via a femoral artery catheter for subsequent intracranial injection and for analysis of pH, PaO2, PaCO2, and blood glucose. Core body temperature was kept at 36.0 ± 1.0°C with a feedback-controlled heating pad. Mice were positioned in a stereotaxic frame where they received an infusion of 30 µl non-anticoagulated autologous blood obtained from the femoral artery or saline into the right basal ganglia (0.2 mm anterior, 3.5 mm ventral, and 2.5 mm lateral to the bregma) at a rate of 2 µl/min with a microinfusion pump. The infusion needle remained in position for a further 10 min after the blood was completely injected and then gently removed. The burr hole was filled with bone wax, and the skin incision was sutured. A total of 120 C57BL/6 mice, 38 wild-type mice, and 34 HDAC2 cKO mice were used for the experiment.
Immunohistochemistry, cell counting and fluorescence quantification
Mice were euthanized with sodium pentobarbital and perfused with 4% paraformaldehyde in 0.1 mM phosphate-buffered saline (PBS; pH 7.4). Brains were harvested and cryoprotected in 30% (wt/vol) sucrose in PBS, and frozen serial coronal brain sections (25 µm thick) were prepared on a cryostat (Sakura Finetek, Inc., Torrance, CA USA). The sections were blocked with 10% (vol/vol) normal donkey serum in PBS for 1 h, followed by overnight incubation (4°C) with the following primary antibodies: Rat anti-MBP (Abcam; 1:500 dilution); Rabbit anti-NF200 (Abcam; 1:1000 dilution); Rabbit anti-Iba1 (Wako; 1:1000 dilution); Mouse anti-SMI32 (Abcam; 1:500 dilution); Goat anti CD206 (Abcam; 1:200 dilution); and Rat anti CD16/32 (Abcam; 1:200 dilution). The appropriate Alexa-Fluor-conjugated antibodies (Invitrogen, Grand Island, NY, USA, 1:500) were used as secondary antibodies. Sections were mounted on slides and coverslipped with Fluoroshield with DAPI (Sigma-Aldrich, St. Louis, MO, USA). Cell numbers were calculated per square millimeter from three random microscopic fields on three sections (nine images total) cut through the corpus callosum (CC) (n = 4 animals per group). All counts were performed in a blinded fashion. The immunostaining intensity of MBP, SMI32, and NF200 was used to demonstrate axon damage after ICH.
Neurobehavioral tests
Behavioral tests, including the corner turn test, the foot fault test, the wire hanging test, and the cylinder test, were performed to evaluate sensorimotor function, as described previously.17,18,36 Before the behavior tests were performed, all animals were subjected to behavior training for three days, and animals displaying abnormal behavior were excluded. For the corner turn test, mice were allowed to proceed into a 30° angle corner, and the direction (left or right) of each subsequent turn was recorded. This procedure was repeated 20 times for each mouse. The percentage of right turns was calculated. For the wire-hanging test, mice were placed in the middle of a stainless steel bar (50 cm length; 2 mm diameter) resting on two vertical supports. The bar was elevated 37 cm above a flat surface. Mice were observed for 30 s in four trials. The amount of time spent hanging was recorded and scored according to the following system: 0, fell off; 1, hung onto the bar with two forepaws; 2, hung onto the bar with added attempt to climb onto the bar; 3, hung onto the bar with two forepaws and one or two hind paws; 4, hung onto the bar with all four paws and with tail wrapped around the bar; 5, escaped to one of the supports. The foot fault test was used to evaluate dysfunction of the forelimbs and hind limbs. Mice were placed on an elevated grid surface (30 L × 35 W × 31H cm) with a grid opening of 2.5 cm2. Each fall and slip between the wires with weight-bearing steps was recorded as a forelimb or hind limb foot fault. The cylinder test was used to assess forelimb use and rotational asymmetry. Mice were placed in a transparent cylinder (9 cm in diameter and 15 cm in height) for 10 min and all forelimb movements were recorded by a camera fixed above the cylinder. Forepaw (left/right/both) use on initial contact against the cylinder wall after rearing and during lateral exploration was counted. Forelimb preference was calculated using the following formula: (nonimpaired forelimb movement − impaired forelimb movement)/(non-impaired forelimb movement + impaired forelimb movement + both movements). Prior to ICH, animals were placed in the cylinder for 5 min to establish a baseline symmetry profile. Animals showing behavioral asymmetries were excluded from further analysis. All behavior tests were performed and evaluated by a blinded observer.
Morris water maze test
The Morris water maze test was performed to assess spatial memory between 28 and 34 days after ICH. As described previously,17,18 an 11 cm diameter platform was submerged in two quadrants of a 109 cm in diameter pool. The hidden platform test assessed the ability of the mice to find the platform without being able to directly see it, and the mice have to either remember its location relative to external spatial cues or perform a search. The platform was placed 1 cm under the water surface, and the water was made opaque with white, non-toxic tempera paint. Each mouse was released from one of four locations and was allotted 90 s to search for the hidden platform. At the end of each trial, the mouse was placed on the platform or was allowed to remain on the platform for 30 s with prominent spatial cues displayed around the room. Because the investigator was also a spatial cue, he/she always sat in the same location during each trial. Four trials were performed per day for five consecutive days with the location of the platform kept constant. Data were expressed as the time (in seconds) or latency to reach the submerged platform each day.
After the last day of the hidden platform test, a single 60-s probe trial was performed. The platform was removed, and each mouse was placed in the pool once for 60 s at the same starting location that was used during the initial hidden platform test. The time spent in the goal quadrant (where the platform had been located) and the swimming speed were both recorded. All tests were performed by researchers blind to experimental group assignment.
Quantitative real-time polymerase chain reaction
RT-PCR was performed as described previously. 37 Briefly, total RNA was extracted from ipsilateral basal ganglia at 4 and 12 h and 1, 3, 5, 7, and 14 days after ICH or from sham-operated brains using TRIzol reagent (Thermo Fisher Scientific, Waltham, MA, USA). RNA was reverse-transcribed into cDNA using the Superscript First-Strand Synthesis System (Invitrogen, Grand Island, NY, USA). RT-PCR was performed using the Opticon 2 Real-Time PCR Detection System (Bio-Rad) and SYBR gene PCR Master Mix (Invitrogen). Cycle time values were measured as a function of GAPDH mRNA levels in the same tissue. The sequences of the primer pairs for the M1and M2 phenotype genes are as follows (in pairs, sense and antisense)
iNOS: (F)
(R)
CD16: (F)
(R)
CD32: (F)
(R)
CD86: (F)
(R)
CD11b: (F)
(R) TTCTGGCRRGCTGAATCCTT
CD206: (F)
(R)
IL10: (F)
(R)
Arg1: (F)
(R)
CCL-22: (F)
(R)
TGFβ: (F)
(R)
Ym1/2: (F)
(R)
IL1β: (F)
(R)
TNFα: (F)
(R)
Compound action potential measurements
CAPs in the CC were measured as described previously. 38 The brain was cut into coronal slices (350 µm thick, bregma 1.06 mm) and placed in pregassed (95% O2/5% CO2) artificial cerebrospinal fluid (aCSF; 126 mmol/L NaCl, 2.5 mmol/L KCl, 1 mmol/L Na2H2PO4, 2.5 mmol/L CaCl2, 26 mmol/L NaHCO3, 1.3 mmol/L MgCl2, and 10 mol/L glucose; pH 7.4) for 1 h at room temperature. Slices were perfused with aCSF at a constant rate (3–4 mL/min) at 22°C. A bipolar tungsten-stimulating electrode (intertip distance, 100 µm) was positioned across the CC at ∼0.9 mm lateral to the midline. A glass extracellular recording pipette (5–8 MΩ tip resistance when filled with aCSF) was placed in the external capsule, 0.24–0.96 mm from the stimulating electrode in 0.24 mm increments. Only the recording at 0.48 mm from the stimulating electrode is reported here. Both electrodes were placed 50–100 µm below the surface of the slice, with adjustments to optimize the signal. 39 The CAP was amplified (× 1 k) and recorded using an Axoclamp 700B (Molecular Devices, San Jose, CA, USA) and then analyzed using pCLAMP 10 software (Molecular Devices, San Jose, CA, USA). Input–output curves were generated by varying the intensity of the stimuli from 0.05 mA to 0.55 mA in 0.05-mA increments (100 µs duration, delivered at 0.05 Hz). 40 Average waveforms of four successive sweeps in two slices per animal were analyzed. Myelinated fiber amplitude was defined as the difference from the first peak to the first trough (N1).
Primary microglia and oligodendrocyte cultures
Primary microglia and oligodendrocytes were collected from mixed cultures harvested from one to two days old postnatal rats, as described previously. 37 Oligodendrocytes were cultured in medium containing 15 nM triiodothyronine and 1 ng/mL ciliary neurotrophic factor. Hemoglobin (20 µM) was added to microglia for 6 h, and then microglial-conditioned media was transferred from microglial cultures to oligodendrocyte cultures via a transwell system (Figure 4(a)). The following assays were performed 24 h later: CCK8 assay for viability, LDH activity assay for loss of membrane integrity, and immunocytochemical staining for MBP and Iba1 were performed 24 h later.
Metabolic viability in vitro was assessed with the CCK8 assay. Live cells were incubated with CCK8 solution at 37°C for 2 h. Absorbance was measured at 450 nm (OD450) with a universal microplate reader. Cell death was evaluated using the LDH assay for loss of membrane integrity and release of LDH into the culture medium. To perform this assay, aliquots of 100 µL were taken from culture medium and added to 150 µL of LDH reagent (Sigma-Aldrich). Absorbance of the reaction was assayed spectrophotometrically by monitoring the reduction of NAD+ at 340 nm at 25°C over a period of 5 min in the presence of lactate. Data were expressed as a percentage of the maximum LDH activity in control wells in which all cells were lysed with Triton.
Electron microscopy
Electron microscopy was performed as described previously 38 to access myelin and axonal damage in the peri-hemorrhage area. Briefly, mice were perfused with saline, followed by ice-cold 4% paraformaldehyde and 0.1% glutaraldehyde in 0.1 mol/L PBS (pH 7.4). The perihematoma area tissue was microdissected into 1 mm blocks and fixed in 2% glutaraldehyde overnight. Next, tissues were washed in 0.1 mol/L sodium cacodylate buffer (pH 7.4) and postfixed in buffered osmium tetroxide for 1–2 h. Following serial dehydration in acetone, the tissue was embedded in epoxy resin. Sections of 60–90 nm thickness were placed onto 200 mesh grids, stained with uranyl acetate and lead citrate, and examined with a JEOL JEM-1230 transmission electron microscope. To examine both axonal damage and demyelination, we evaluated the number of myelinated axons per unit area and the g-ratio (ratio of axonal diameter with myelin sheath and axonal diameter without myelin sheath) as described previously.41,42
Western blot analysis
Cell lysates were run on SDS/PAGE gels, and proteins were detected on nitrocellulose blots with enhanced chemiluminescence reagents. Protein concentration was determined by a Bio-Rad protein assay kit. The primary antibodies were STAT1, pSTAT1, JNK2, and pJNK2, all diluted 1:1000. Membranes were blocked for 1 h in 5% nonfat milk that was dissolved in Tris-buffered saline solution and were incubated in primary antibody at 4°C overnight. We detected the target proteins with Scion Image by using secondary antibodies, and the relative densities of the bands were analyzed with ImageJ (version 1.49, NIH). Protein levels were expressed as a fraction of β-actin in the same lane.
Flow cytometry for sorting microglia
A gating strategy was used to sort microglia (Figure 3(d)). Samples were gated on live singlets prior to identifying leukocytes via forward and side scatter. Cell suspensions were prepared from the ipsilateral hemisphere of each mouse. Cells were first gated (single cell) on a forward scatter/side scatter (FSC-A/SSC-A) dot plot to exclude aggregates. The single cells were visualized using a side scatter (SSC-H/SSC-W) dot plot and gated to exclude debris and dead cells. The G2 events were next gated on a Ly6G/FSC-A dot plot for Ly6G-positive (G3) and Ly6G-negative (G4) cells. Ly6G-positive cells (infiltrated neutrophils, circle) were displayed on a CD11b/Ly6G dot plot and quantified. Ly6G-negative cells were displayed on a CD11b/CD45 dot plot, and CD11b+CD45low cells (microglia) were gated and quantified. Next, qRT-PCR for IL1β and TNFα was performed on cell-sorted microglia from HDAC2 cKO and WT mice seven days after ICH.
Statistical analyses
All data are presented as the mean ± standard deviation (SD). Kolmogorov–Smirnov test was used to assess the normal distribution of the data. Differences between two groups were analyzed with Student’s t-test (two-tailed), and differences between multiple groups were analyzed with one-or two-way ANOVA followed by the Bonferroni post hoc test. Differences were considered significant at p ≤ 0.05.
Results
Dynamic changes in messenger RNA expression of M1 and M2 markers and microglia/macrophages with M1 or M2 phenotypes
Surface marker expression and cytokine/chemokine production were used to distinguish microglia/macrophage polarization at different time points (4 h, 12 h, 1d, 3d, 5d, 7d and 14 d) after ICH. M1 phenotypic gene expression (iNOS, CD11b, CD16, CD32, and CD86) gradually increased over time 4 to 12 h after ICH and peaked 12 h to one day after ICH (Supplemental Figure 2(a)). All genes decreased to pre-ICH levels by 14 days after ICH. Compared with M1 markers, the M2 type messenger RNA markers included CD206, Arg1, CCL-22, Ym1/2, IL-10, and transforming growth factor-β (TGFβ), the expression of which increased 4–12 h after ICH and peaked on day 1 or 3. Furthermore, the expression of all M2 phenotype genes started to decrease three days after ICH and decreased to pre-injury levels by day 14 (Supplemental Figure 2(c)).
Apart from evaluating changes in messenger RNA expression to demonstrate microglia/macrophage dynamic changes after ICH, double immunostaining of representative M1-associated or M2-associated marker proteins and the microglia/macrophage marker Iba1 was performed to specifically evaluate dynamic changes in microglia/macrophage polarization in the ipsilateral basal ganglia at the same phase after ICH (Supplemental Figure 2(b) and (d)).
WMI after intracerebral hemorrhage
WMI after ICH was examined by double immunostaining for myelin basic protein (MBP) and nonphosphorylated neurofilament (SMI-32) in the basal ganglia. WMI is characterized by a decrease in MBP, and dephosphorylation of damaged neurofilament H epitope, which can be detected with the SMI-32 antibody. Therefore, we used the ratio of MBP to SMI-32 immunostaining intensity to evaluate the presence of WMI. As expected, damage to white matter was observed in the ipsilateral basal ganglia one, three, five, and seven days after ICH, as indicated by an increase in the SMI-32/MBP ratio (Supplemental Figure 3(a) and (c)). In contrast, there was little SMI-32 immunoreactivity and high MBP immunoreactivity in the contralateral basal ganglia of ICH mice (Supplemental Figure 3(b)) and sham-operated brains (data not shown).
To correlate WMI and microglia/macrophage polarization after ICH, we performed correlation analysis of SMI-32 immunostaining intensity with the number of cells expressing the M1 phenotypic marker, CD16/32, in the ipsilateral and contralateral striatum. There was a direct positive correlation of SMI-32 intensity with the number of CD16/32+ cells in the ipsilateral striatum (Supplemental Figure 3(d)) (p < 0.01) but no correlation in the contralateral striatum (data not shown), suggesting an increasing number of M1 phenotype microglia/macrophages may induce WMI after ICH.
Reduced expression of HDAC2 in microglia ameliorates neurological dysfunction and WMI after ICH
Knockdown of HDAC2 in the HDAC2 cKO mice significantly attenuated motor deficits at early time points after ICH (Figure 1(a) to (d)). The wire-hanging test showed HDAC2 cKO mice obtained higher score than WT mice after ICH and paw placement on the grid-walking test was improved significantly in HDAC2 cKO mice compared to WT mice after ICH. Furthermore, the HDAC2 cKO mice exhibited better spatial memory than WT mice in the Morris water maze test (Figure 1(e) to (g)). The HDAC2 cKO mice located a hidden platform faster over the five days of learning trials as denoted by a decrease latency to find the platform. HDAC2 cKO mice spent more time crossing over the correct location once the platform was removed on the final day of testing indicative of an improvement in memory function. In addition, the HDAC2 cKO mice swim more distance in the same quadrant as the platform after training than WT mice after ICH. The results suggested that decreasing Hdac2 gene expression in microglia ameliorates cognitive impairment after ICH in addition to improving neurological function.
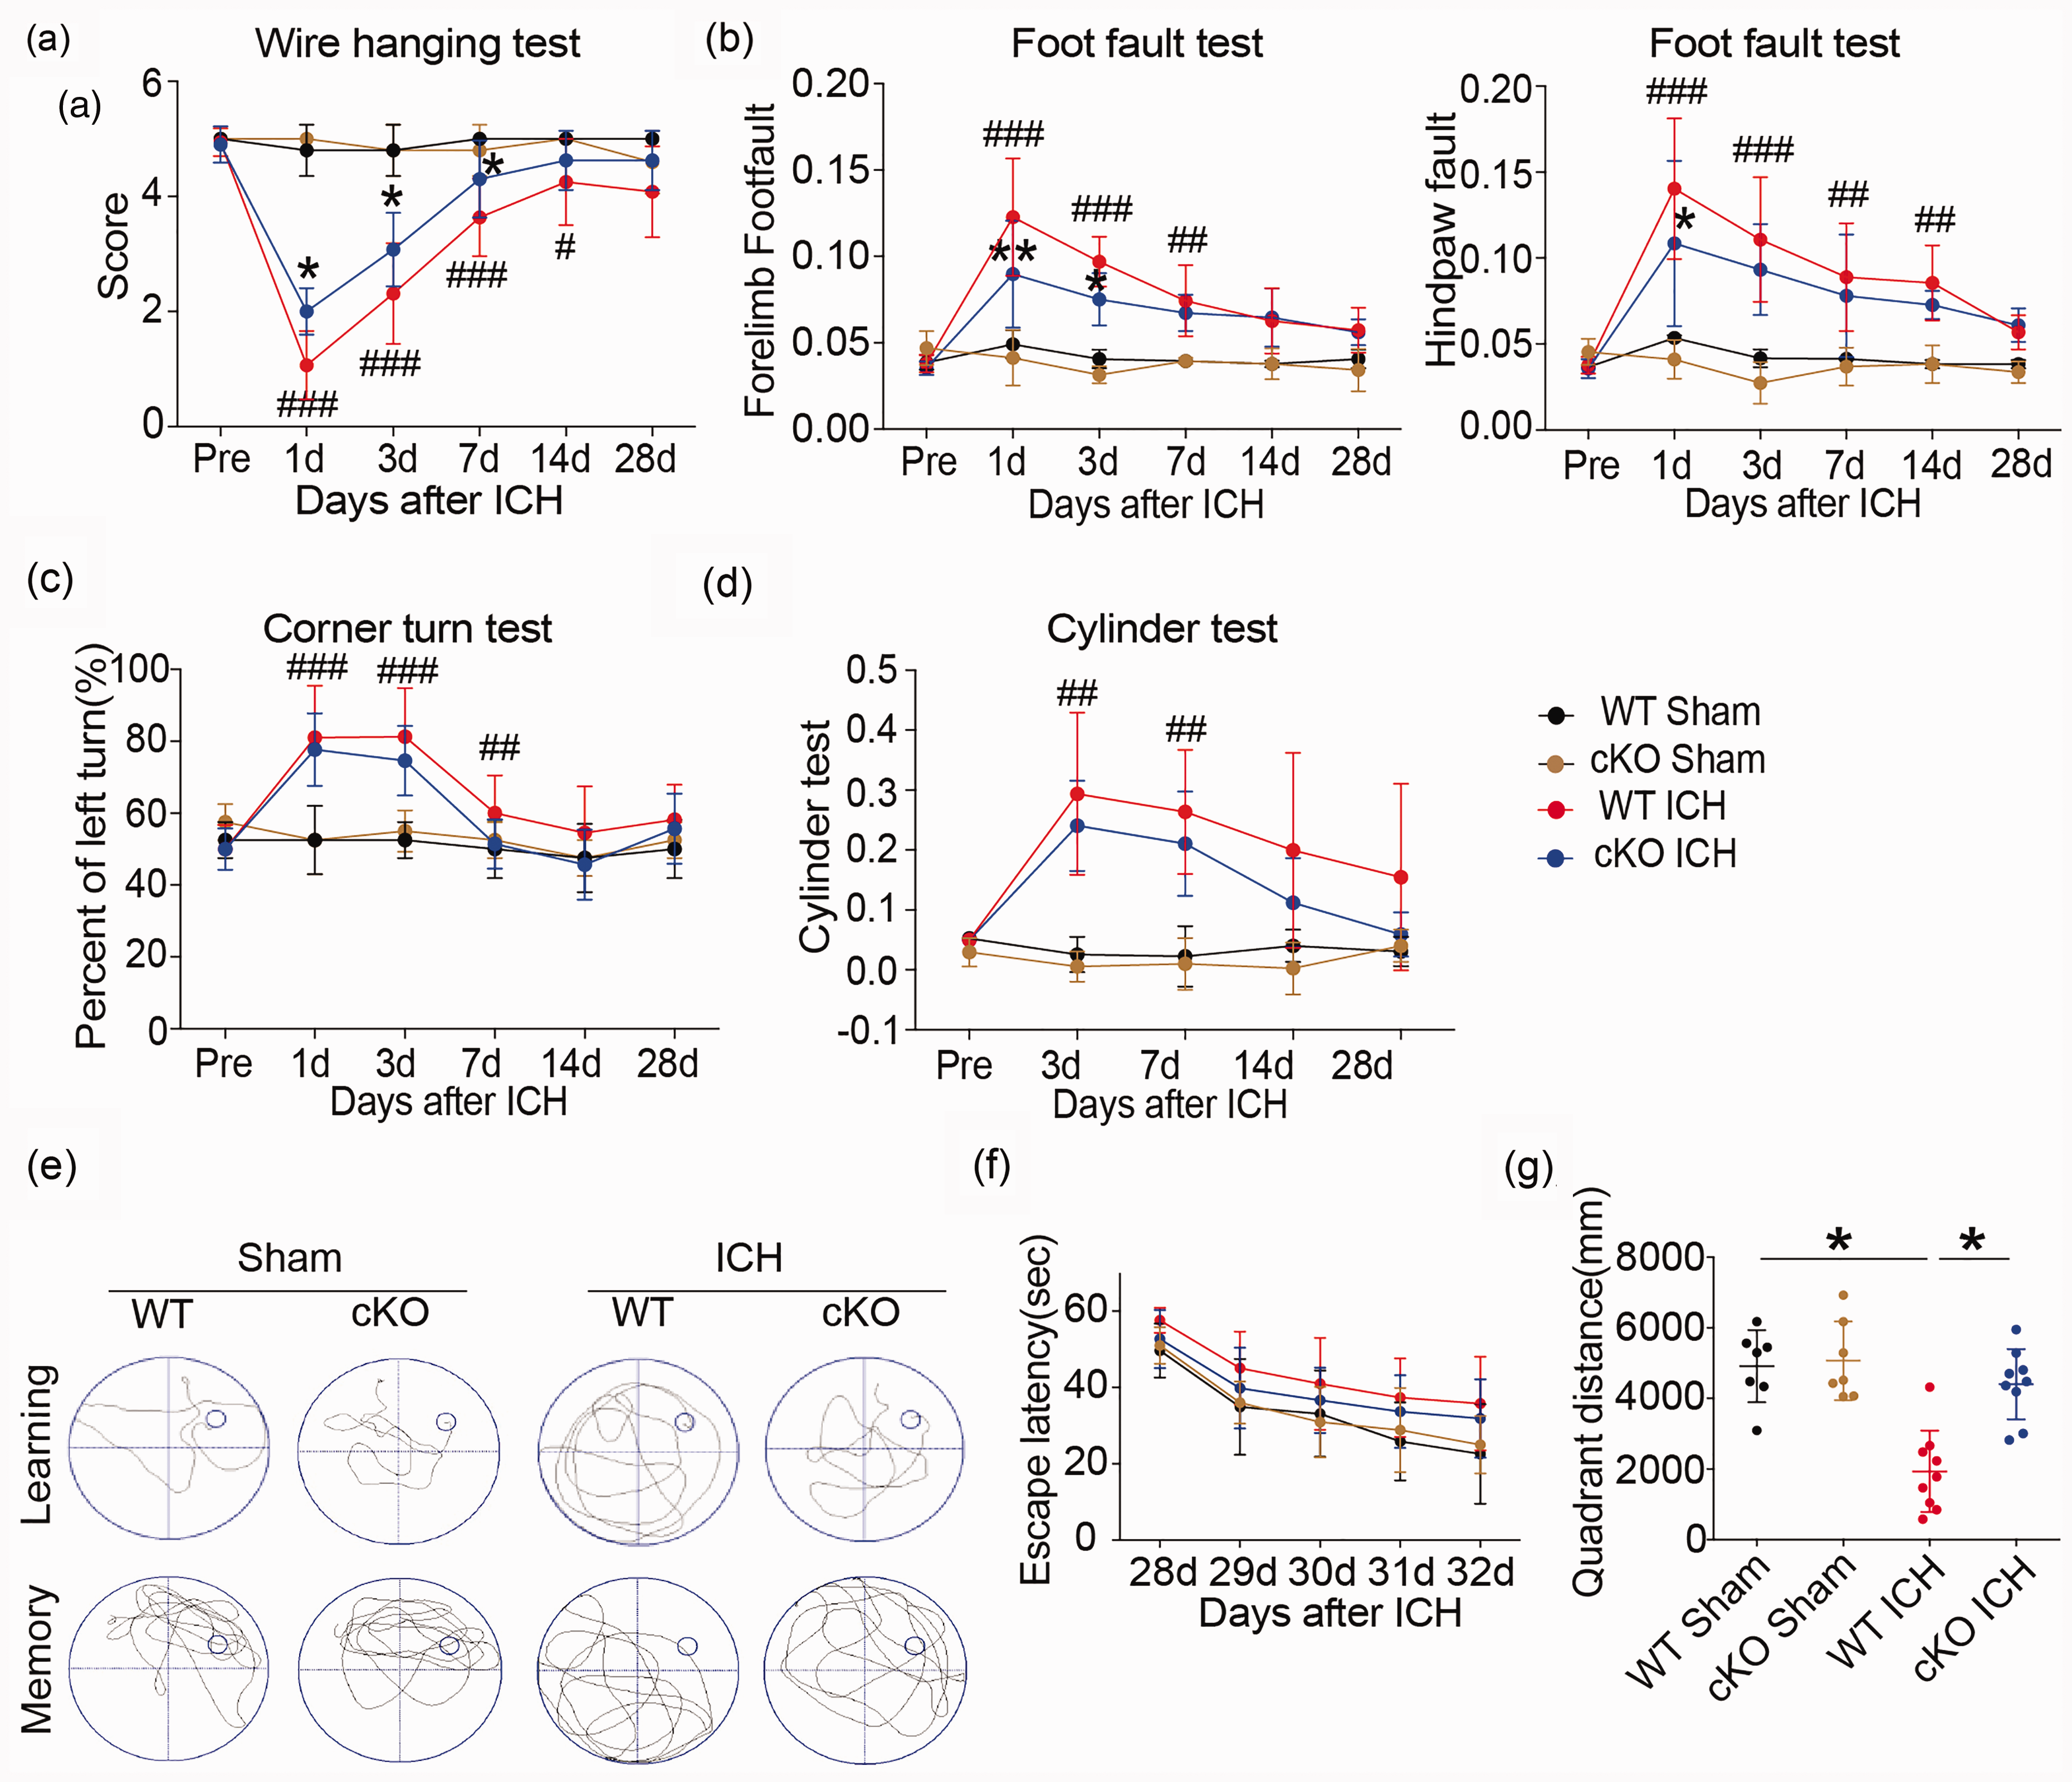
Neurological dysfunction in Cx3cr1CreER:Hdac2fl/fl and WT mice after ICH. (a–d) Sensorimotor dysfunction was significantly alleviated in Cx3cr1CreER:Hdac2fl/fl mice at the early phase after ICH. The Morris water maze test was performed to measure cognitive deficits after ICH (e–g). (e) Representative swim path from each treatment group during the spatial learning (top panel) and memory phage (bottom panel) of the Marris water maze test. (f) Latency to find the hidden platform in the cued learning response 28 to 32 days after ICH (spatial learning). (g) The total distance in the same quadrant as the platform after training in sham groups (WT and HDAC2 çKO mice) and ICH groups (WT and HDAC2 çKO mice). n = 10–12/group. *p ≤ 0.05, **p ≤ 0.01 vs. WT ICH; #p ≤ 0.05, ##p ≤ 0.01, ###p ≤ 0.001 vs. sham group. All data are presented as mean ± SD.
Examination of WMI in WT and HDAC2 cKO mice with MBP and NF200 immunostaining showed that 35 days after ICH, there was a significant decrease in MBP and NF200 immunoreactivity in the ipsilateral striatum and CC of ICH mice compared to sham-operated mice, indicating damage to myelin sheath and axons. However, the HDAC2 cKO mice exhibited higher immunostaining intensity than WT mice after ICH in the ipsilateral basal ganglia and the CC (Figure 2(a) to (c)), such that levels in the knockout mice were no different than the sham control mice. Thus, knockdown of the Hdac2 gene in microglia reduced WMI after ICH.
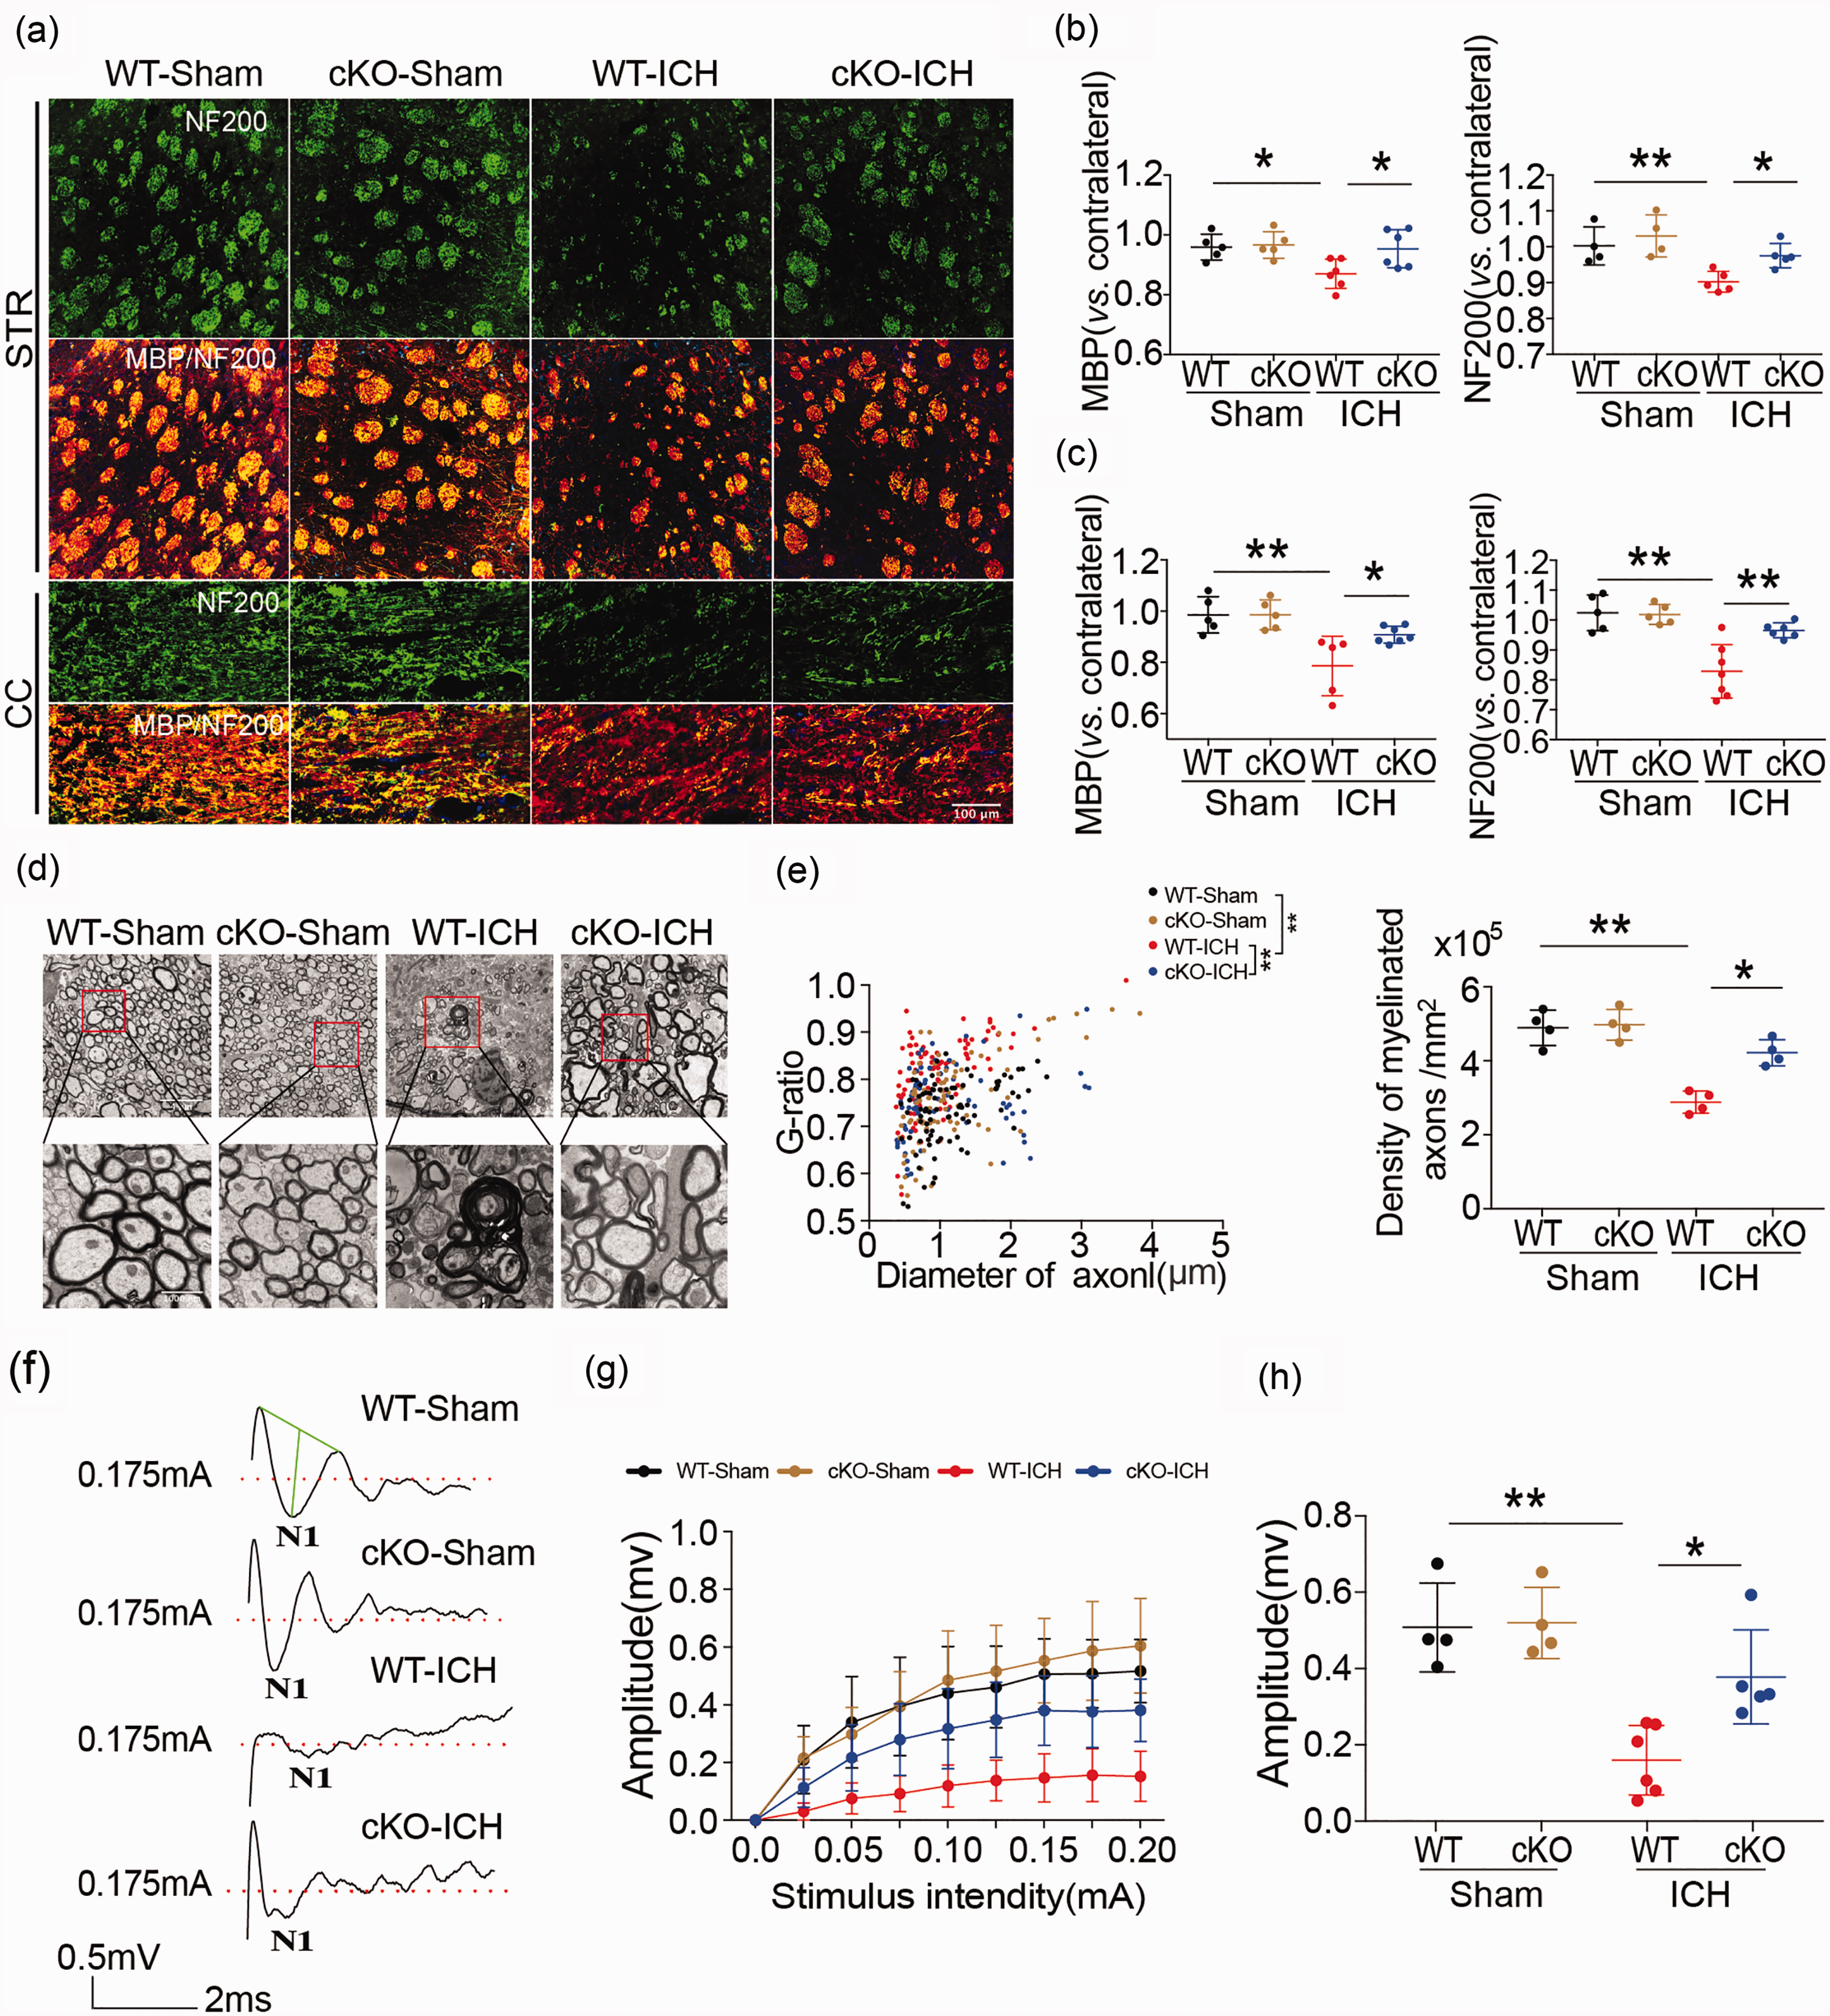
White matter injury in Cx3cr1CreER:Hdac2fl/fl and WT mice after ICH. (a–c) Double immunofluorescence staining for NF200 and MBP in the ipsilateral striatum and corpus callosum 35 days after ICH (Scale bar = 100 µm) and the fold decrease in MBP and NF200 in the striatum and corpus callosum demonstrated the degree of WMI 35 days after ICH. (d) Representative images of myelin sheath damage in sham groups (WT and HDAC2 çKO mice) and ICH groups (WT and HDAC2 çKO mice) 35 days after ICH (Scale bar = 4µm or 1000nm). (e) Quantification of the g-ratio (the ratio of axonal diameter to overall diameter of the axon plus myelin) and axon density in sham groups (WT and HDAC2 çKO mice) and ICH groups (WT and HDAC2 çKO mice) 35 days after ICH. (f) Representative traces of the evoked CAPs in the CC (stimulus, 0.175 mA; 0.48 mm lateral to the stimulating electrode) 35 days after ICH. (g) Signal conduction along nerve fibers, as measured by the amplitude of the N1 component of the CAPs in response to increasing stimulus strength (0.0–0.20 mA) (h) N1 amplitude in response to a 0.175 mA stimulus 35 days after ICH. Illustration of the regions for immunohistochemistry, RT-PCR, electron microscropy and CAP measurement is shown in Supplementary Figure 4. n = 5–7/group. * p ≤ 0.05, ** p ≤ 0.01. All data are presented as mean ± SD.
To further evaluate whether reducing Hdac2 expression in microglia preserved white matter integrity after ICH, we analyzed the ultrastructural changes in myelin sheath and axons. First, we examined the peri-hematoma tissue with electron microscopy 35 days after ICH. In the HDAC2 cKO mice, the number of myelinated axons and myelin-sheath thickness was greater than that in WT mice (Figure 2(d)). The quantification of the g-ratio (the ratio of axonal diameter to overall diameter of the axon plus myelin) and axon density in HDAC2 cKO mice were all higher than WT mice at 35 days after ICH (Figure 2(e)). To assess functional alterations in white matter, we examined the conduction of CAPs in myelinated axons. After ICH, the N1 segment amplitude decreased, indicating damage to myelinated axons. Conditional knockout of the Hdac2 gene in microglia significantly attenuated the decrease in amplitude of the N1 segment (Figure 2(f) to (h)). The amplitude of the N1 component of the CAPs in response to increasing stimulus strength (0.0–0.20 mA) was higher in HDAC2 cKO mice compared to WT mice at 35 days after ICH (Figure 2(g)). Then, we compared the N1 amplitude in response to a 0.175 mA stimulus 35 days after ICH, which also demonstrated that HDAC2 cKO mice exhibited a higher amplitude than WT mice (Figure 2(h)). Therefore, reducing expression of HDAC2 in microglia/macrophages ameliorates neurological dysfunction and WMI after ICH.
Hdac2 gene knockout modulates microglia/macrophage polarization and reduces neuroinflammation after ICH
Double immunostaining for the microglia/macrophage marker Iba1 and M1 phenotype marker or M2-type marker proteins in the basal ganglia after ICH was used to analyze microglia/macrophage polarization after ICH. Microglia/macrophage polarization in HDAC2 cKO mice seven days after ICH displayed significantly decreased CD16 and increased CD206 protein expression seven days after ICH (Figure 3(a) to (c)) compared to WT mice. To confirm the relationship between HDAC and inflammation after ICH in microglia, a gating strategy was used to sort microglia by flow cytometry (Figure 3(d)). Samples were gated on live singlets prior to identifying leukocytes by forward and side scatter. Cell suspensions were prepared from the ipsilateral hemisphere of each mouse. Cells were first gated (single cell) on a forward scatter/side scatter (FSC-A/SSC-A) dot plot to exclude aggregates. The single cells were visualized using a side scatter (SSC-H/SSC-W) dot plot and gated to exclude debris and dead cells. The G2 events were next gated on a Ly6G/FSC-A dot plot for Ly6G-positive (G3) and Ly6G-negative (G4) cells. Ly6G-positive cells (infiltrated neutrophils, circle) were displayed on a CD11b/Ly6G dot plot and quantified. Ly6G-negative cells were displayed on a CD11b/CD45 dot plot, and CD11b+CD45low cells (microglia) were gated and quantified. qRT-PCR analysis of cell-sorted microglia showed significantly decreased mRNA expression of the proinflammatory cytokines IL1β and TNFα from HDAC cKO compared to wild-type mice seven days after ICH (Figure 3(e) and (f)), providing further evidence that HDAC modulates inflammation via microglia/macrophage polarization.
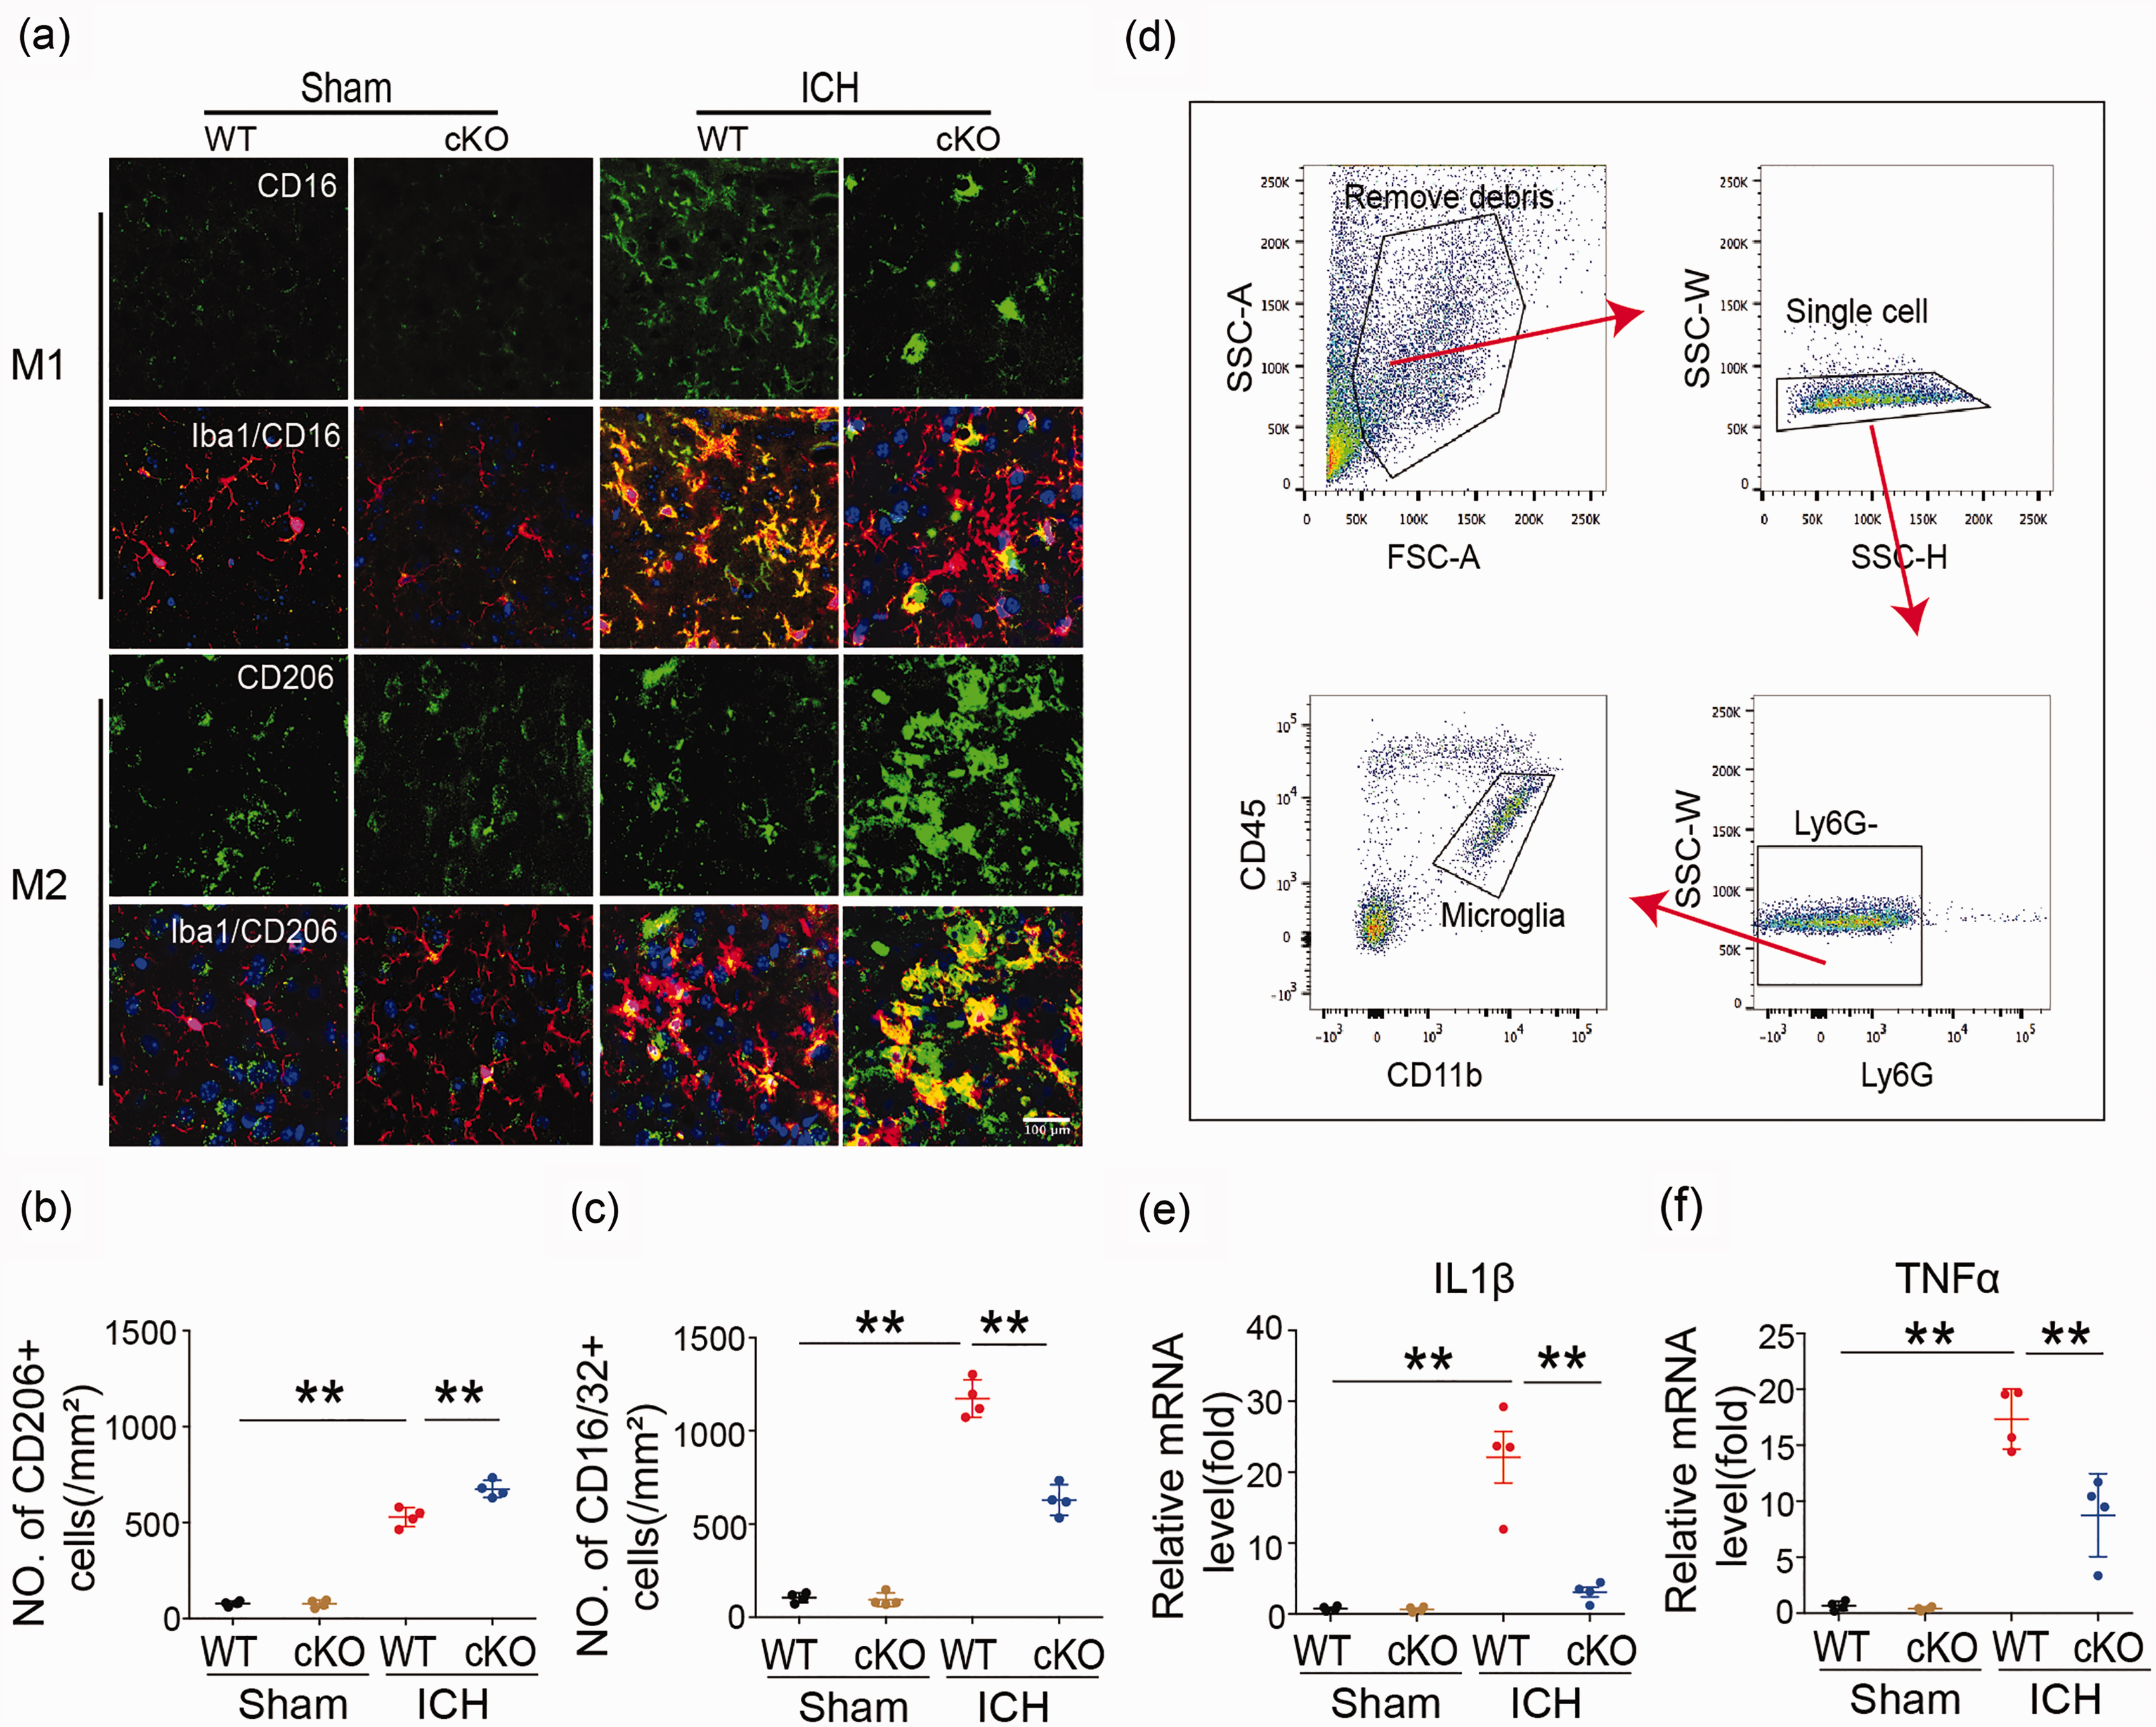
Microglia/macrophage polarization and neuroinflammatory response in Cx3cr1CreER:Hdac2fl/fl and WT mice 7 days after ICH. (a–c) Double immunostaining of the M1 marker CD16/32 and Iba1 marker for activated microglia in the ipsilateral basal ganglia and quantification of CD16/32+ cells seven days after ICH. Double immunostaining of the M2 marker CD206 and Iba1 marker for activated microglia in the ipsilateral basal ganglia and quantification of CD206+ cells seven days after ICH (Scale bar = 100 µm). (d) Gating strategy to isolate microglia for cell sorting experiments. (e, f) qRT-PCR for IL1β and TNFa was performed on cell-sorted microglia from HDAC cKO and wild-type mice seven days after ICH. n = 9–11. *p ≤ 0.05, **p ≤ 0.01. All data are presented as mean ± SD.
HDAC inhibition indirectly reduces oligodendrocyte injury via microglia after ICH in vitro and modulates microglia/macrophage polarization in primary microglia after ICH
Our in vivo results demonstrated that knockout of the Hdac2 gene could preserve the myelin sheath and axonal function after ICH. To further investigate the relationship between microglia/macrophage activation and WMI, primary microglia were stimulated by hemoglobin and co-cultured with oligodendrocytes in a transwell system to evaluate scriptaid-mediated protection of oligodendrocytes via modulation of microglia/macrophage activation (Figure 4(a)). We observed that medium from cultured primary microglia that were stimulated by hemoglobin decreased the immunostaining intensity of MBP, indicating damage to the cultured oligodendrocytes. However, scriptaid inhibited the decrease in MBP immunostaining intensity (Figure 4(b)). Consistent with the reduced MBP immunostaining, scriptaid also protected oligodendrocyte viability (Figure 4(c)), as assessed by LDH release and CCK8, coincident with a decrease in the gene expression of proinflammatory cytokines in vitro (Figure 4(d)). These results suggest that activated microglia may induce WMI by secreting proinflammatory cytokines after ICH. Scriptaid reduced this inflammatory response and attenuated WMI. Investigation of the mechanism by which scriptaid modulates phenotypic polarization of microglia/macrophages and induces its immunosuppressive effect on activated microglia implicates the JAK/STAT signal pathway, as scriptaid significantly decreased pJAK2 and pSTAT1 expression (Figure 4(e) and (f)).
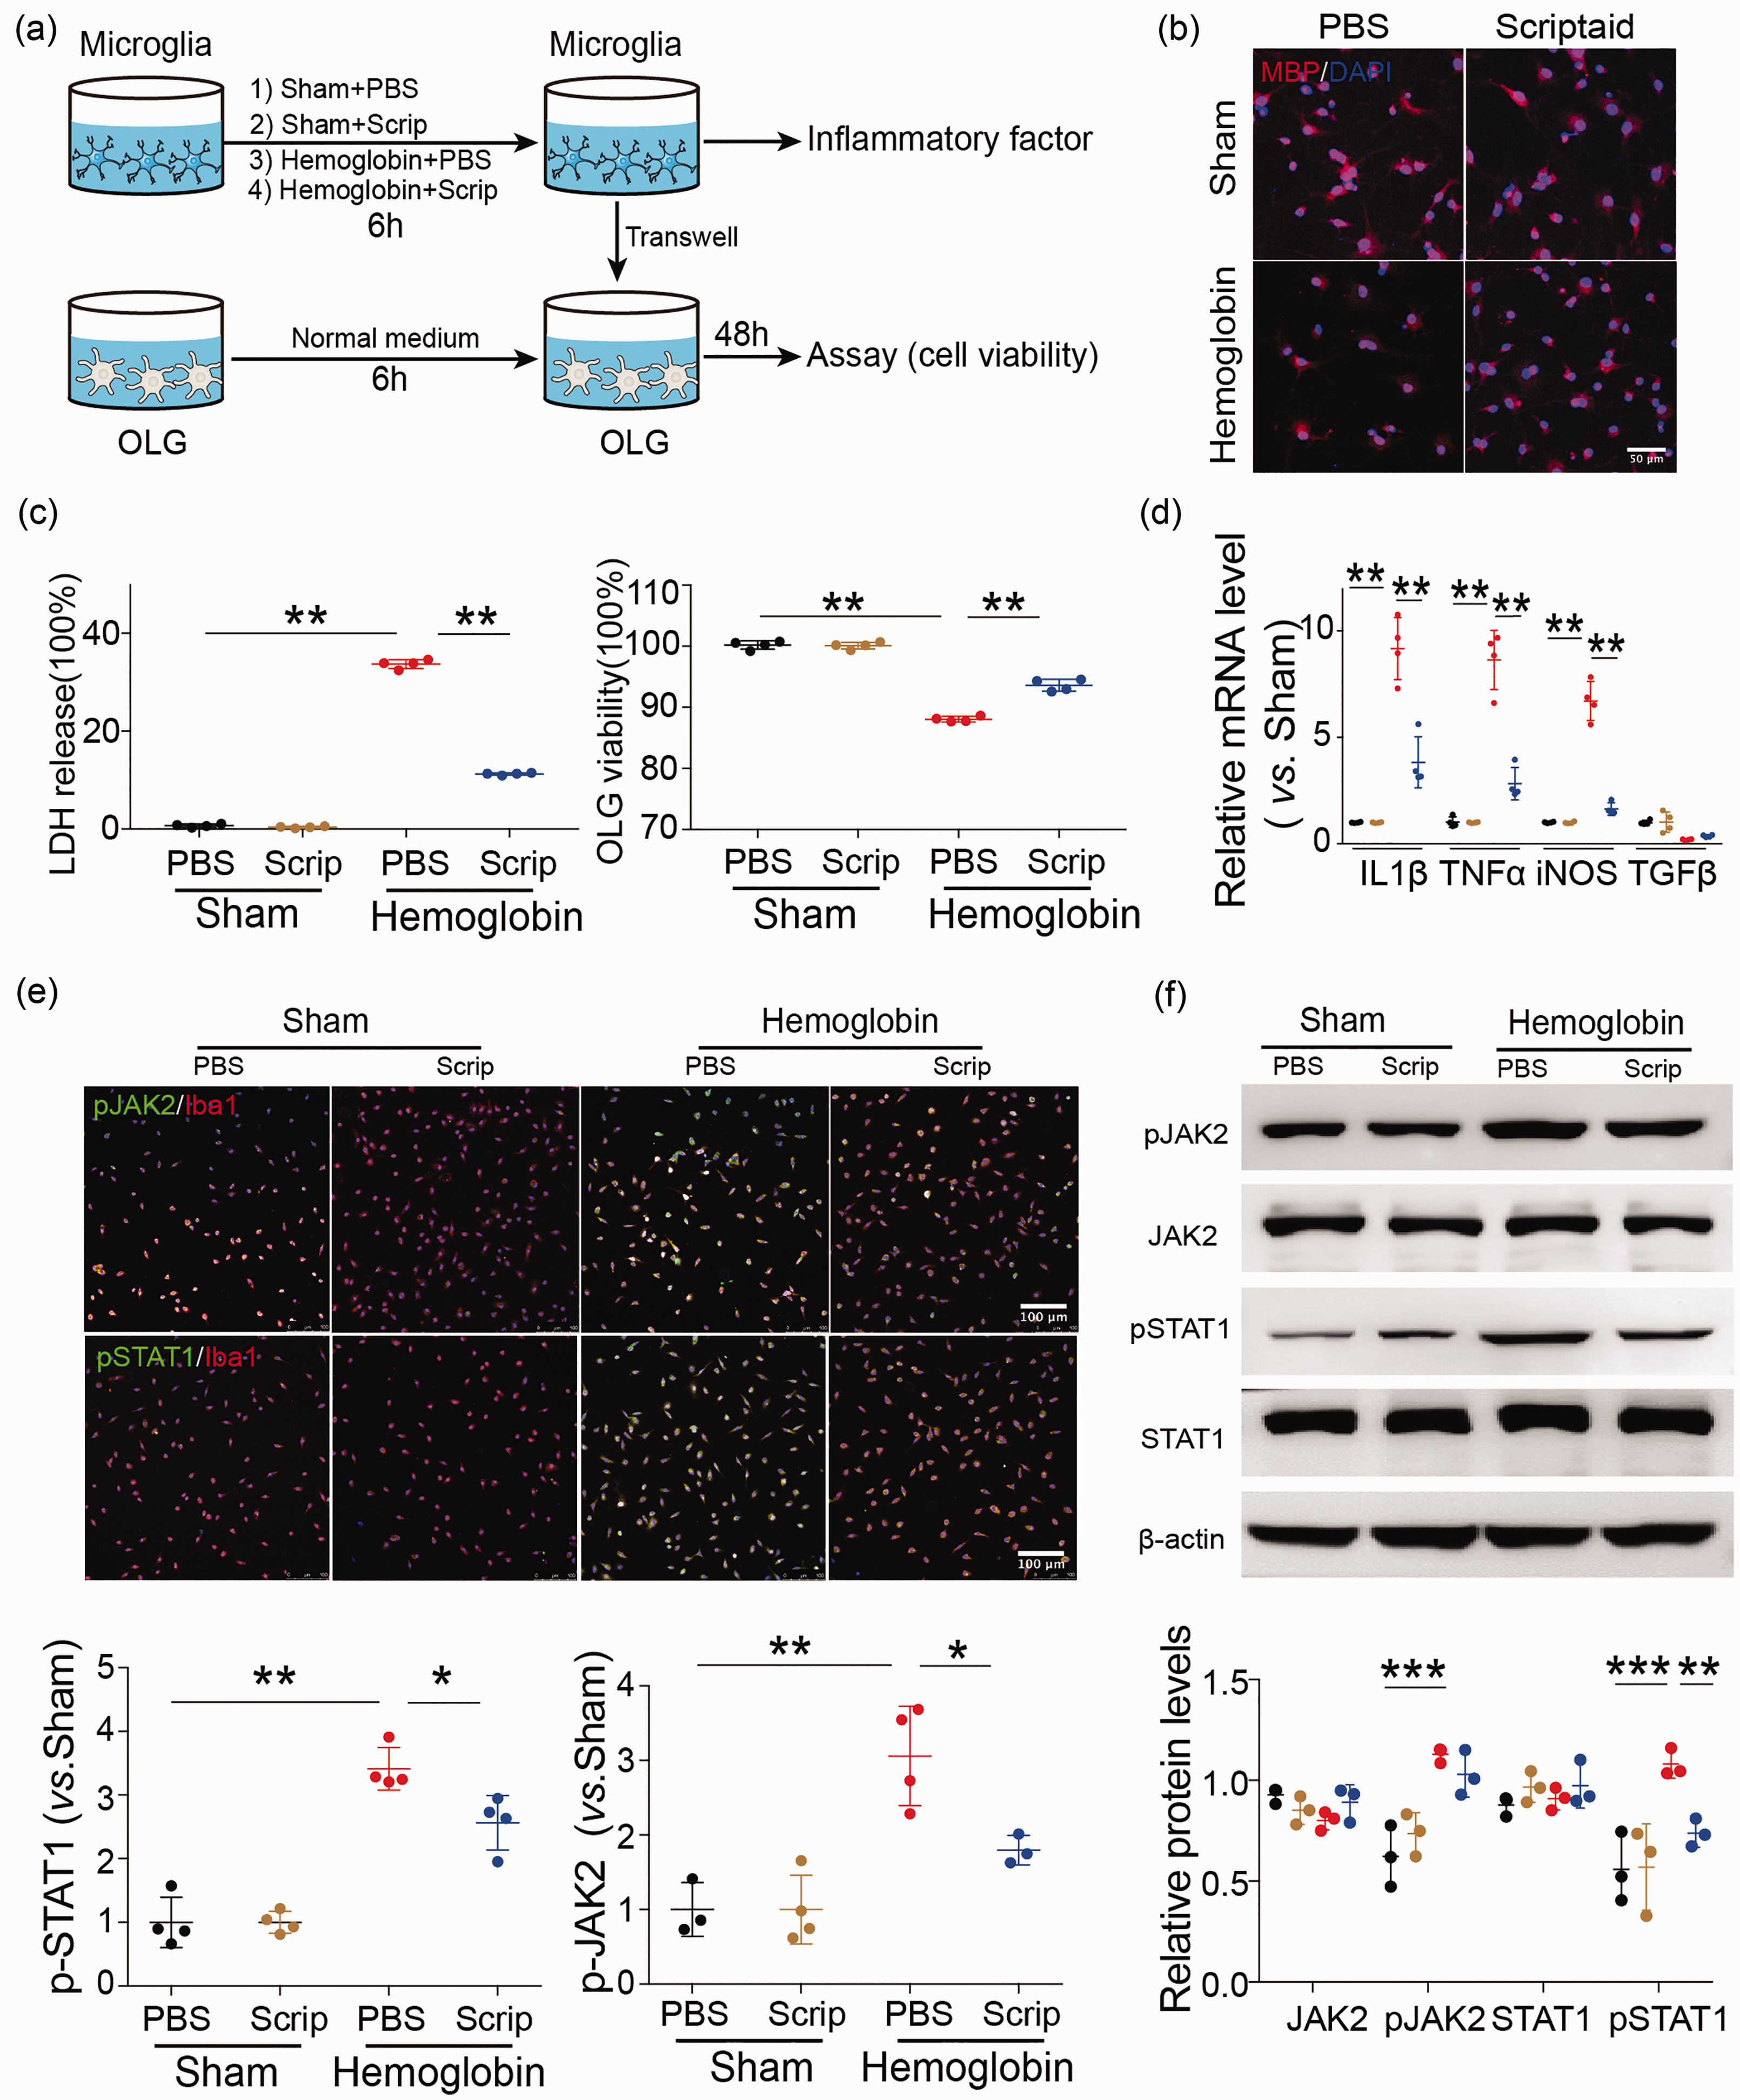
HDAC inhibition indirectly reduces oligodendrocyte injury via microglia after ICH in vitro and modulates microglia/macrophage polarization in primary microglia after ICH through the JAK2/STAT1 pathway. (a) In vitro experiments used a transwell system. Primary microglia were incubated with PBS, scriptaid (1 µM), hemoglobin (20 µM) +PBS and hemoglobin (20 µM) +scriptaid for 6 h and cocultured with primary oligodendrocytes (OLG) in a transwell system. (b) Double immunostaining images of MBP and DAPI in oligodendrocytes that were cocultured with primary microglia stimulated by PBS, scriptaid, hemoglobin +scriptaid and hemoglobin +PBS, respectively (Scale bar = 50 µm). (c) Quantifications of oligodendrocyte survival and cell death with LDH release and CCK8 in the transwell system. (d) RT-PCR demonstrated a decrease in proinflammatory-cytokine genes in the scriptaid-treated group in vitro (d). (e) Double immunostaining of the microglia marker Iba1 and pJAK2 and pSTAT1 in the PBS, Scriptaid, Hemoglobin+PBS and Hemoglobin+Scriptaid groups. (Scale bar=100 µm); quantifications of pSTAT1 and pJAK2 immunoreactivity in primary microglia stimulated by PBS, scriptaid, hemoglobin+scriptaid and hemoglobin+PBS, respectively. (f) Relative protein levels of JAK2, pJAK2, STAT1 and pSTAT1 in primary microglia stimulated by PBS, scriptaid, hemoglobin+scriptaid and hemoglobin+PBS, respectively. n=3–4/group, *p ≤ 0.05, **p ≤ 0.01, *** p ≤ 0.001). All data are presented as mean ± SD.
The HDAC inhibitor scriptaid improves neurological functional recovery and alleviates WMI after ICH
To analyze whether the HDAC inhibitor scriptaid could reduce WMI after ICH, mice were administered 3.5 mg/kg scriptaid 2, 26, and 50 h after ICH. Scriptaid alleviated sensorimotor dysfunction at early times (one to three days) after ICH (Figure 5(a) to (d)). The wire-hanging test showed higher score and paw placement on the grid-walking test were improved significantly in ICH+scriptaid group compared to ICH+vehicle group. Scriptaid-treated mice performed significantly better than vehicle mice in corner and cylinder test. Furthermore, assessment of learning and memory as measured by escape latency and quadrant distance, respectively, in the Morris water maze, indicated scriptaid significantly improved cognitive deficits after ICH (Figure 5(e) to (g)). The scriptaid-treated mice located a hidden platform faster over the five days of learning trials as denoted by a decrease latency to find the platform. Scriptaid-treated mice spent more time crossing over the correct location once the platform was removed on the final day of testing indicative of an improvement in memory function. In addition, the scriptaid-treated mice swim more distance in the same quadrant as the platform after training than vehicle mice after ICH. Therefore, scriptaid can not only improve sensorimotor dysfunction but also reduce cognitive deficits after ICH.
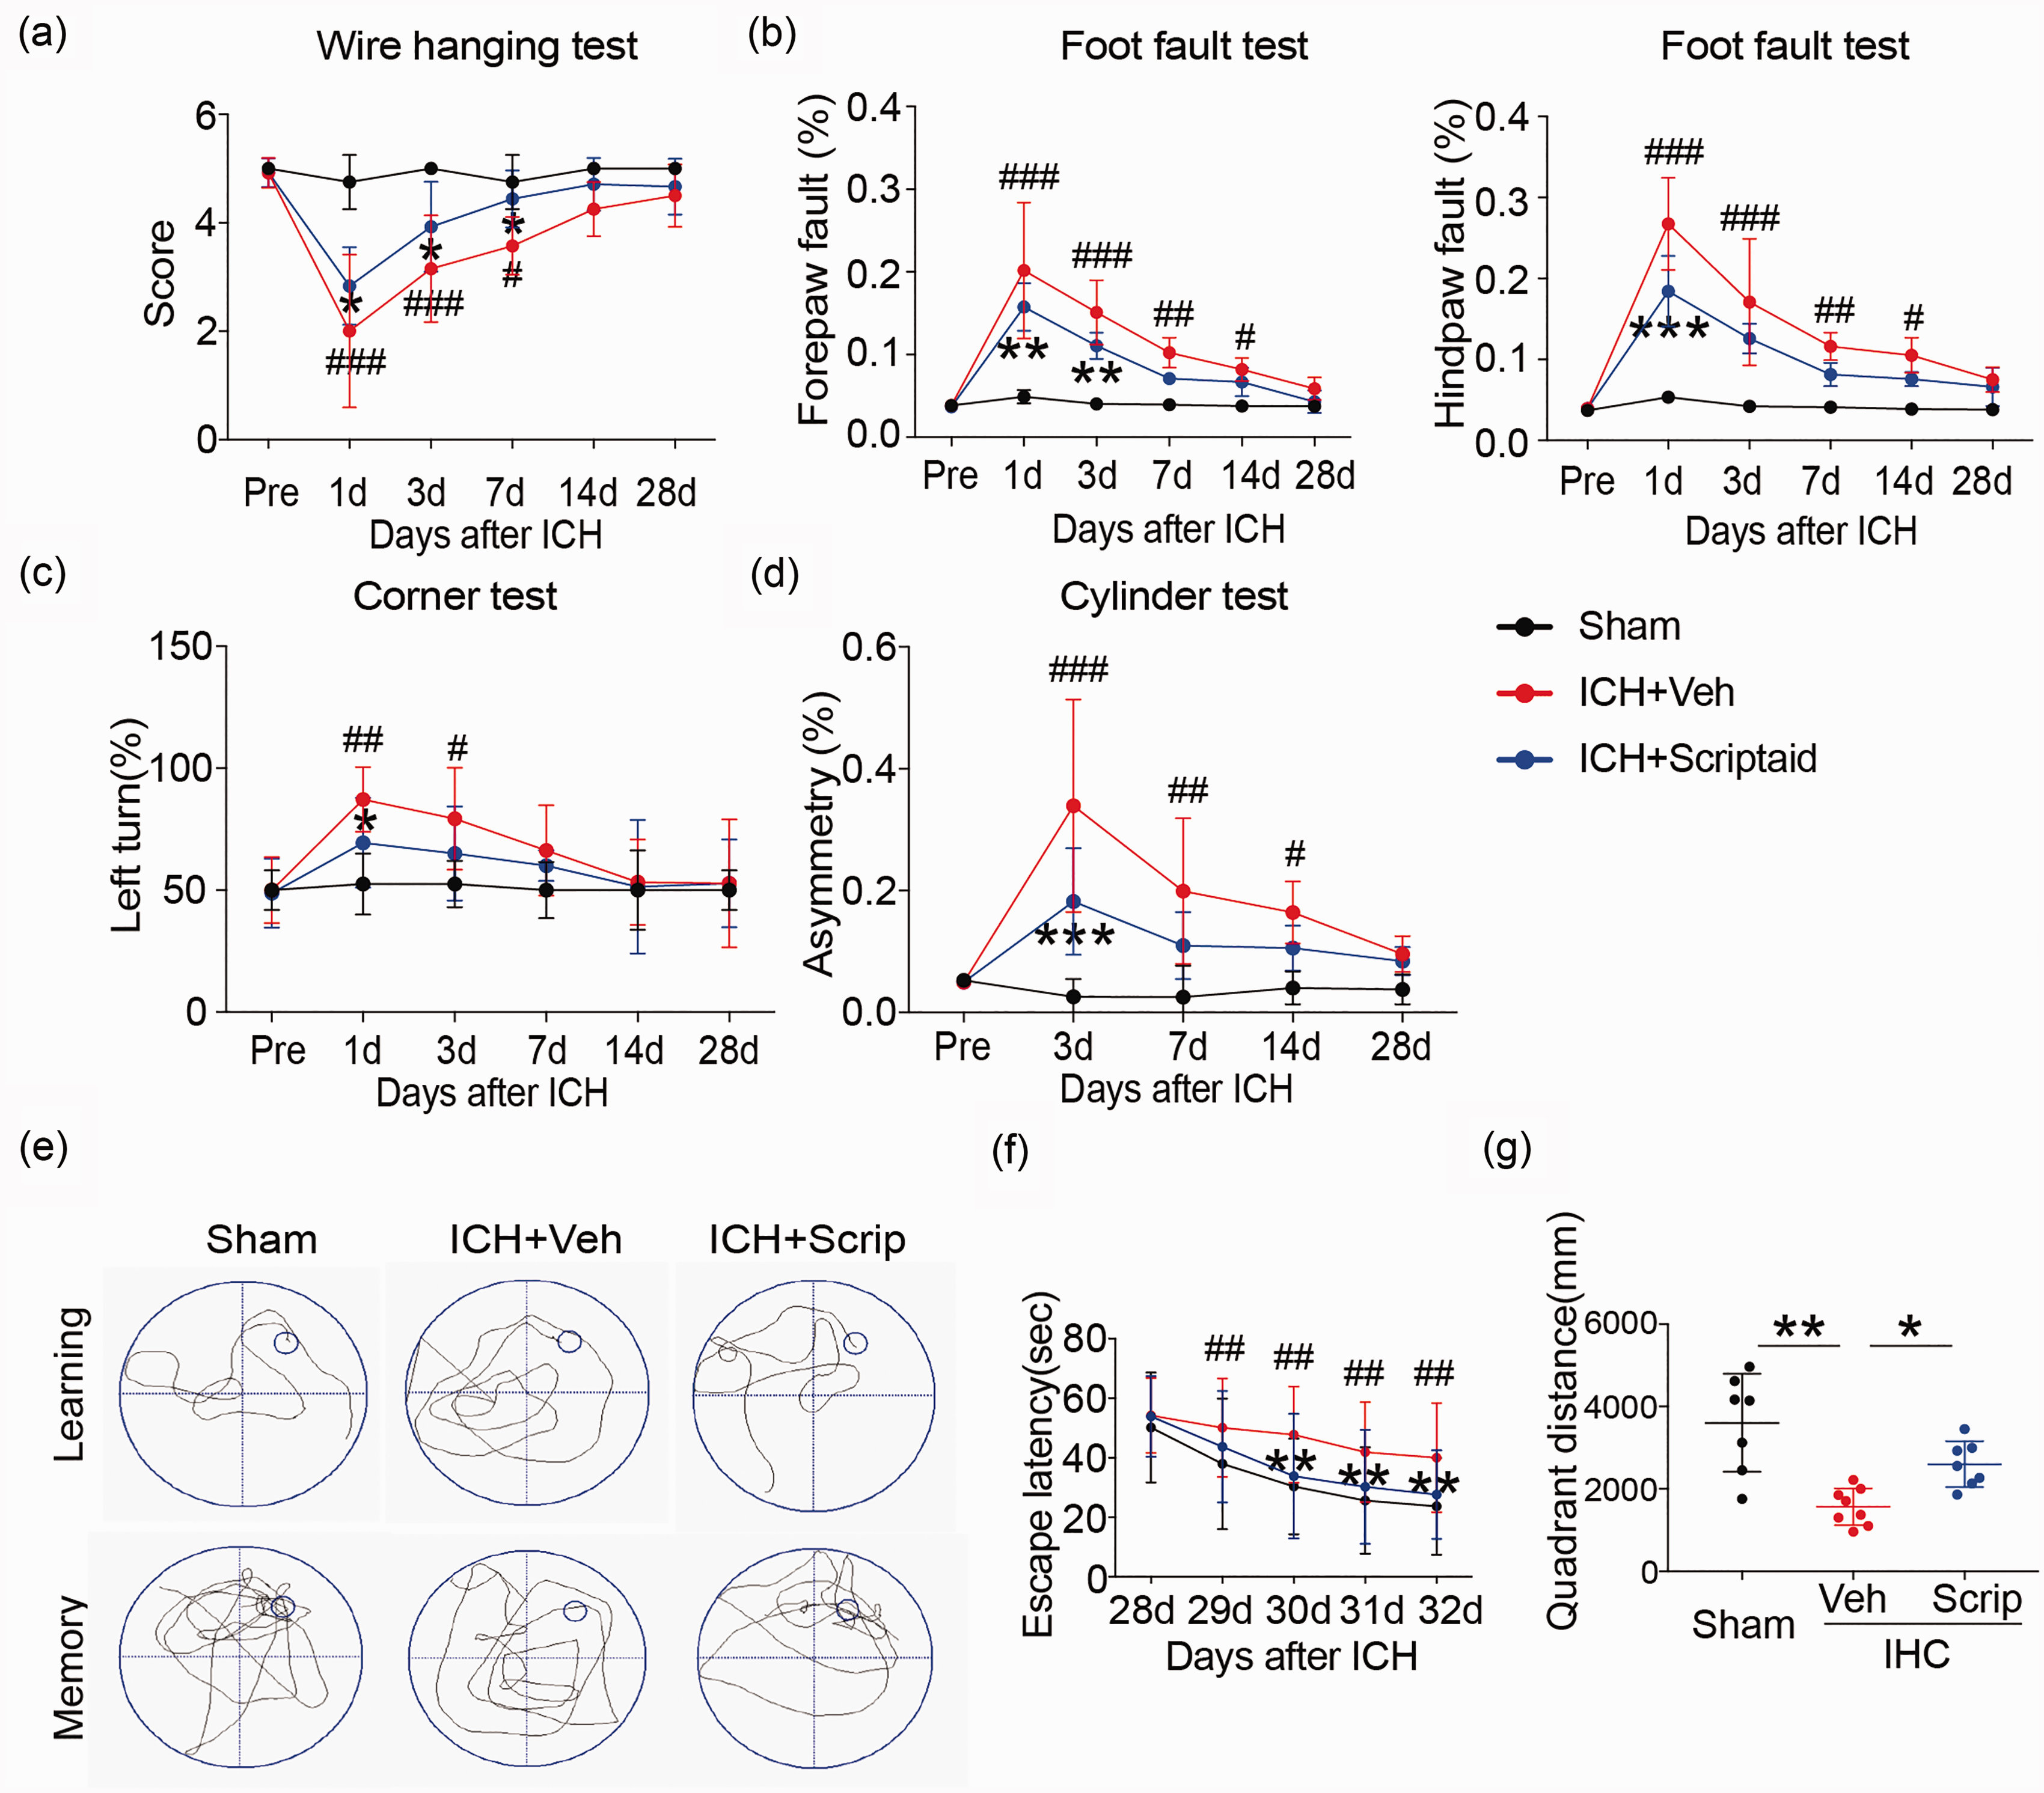
Scriptaid improves neurological function recovery after ICH. (a–d) Sensorimotor dysfunction was significantly alleviated in scriptaid-treated mice at the early phase after ICH. (e–f) The Morris water maze test was performed to measure cognitive deficits after ICH. (e) Representative swim path from each treatment group during the spatial learning (top panel) and memory phage (bottom panel) of the Marris water maze test. (f) Latency to find the hidden platform in the cued learning response 28 to 32 days after ICH (spatial learning). (g) The totally distance in the same quadrant as the platform after training for mice in sham, vehicle and scriptaid-treated groups. n = 10–12/group. *p ≤ 0.05, **p ≤ 0.01, *** p ≤ 0.001 vs. vehicle group; #p ≤ 0.05, ##p ≤ 0.01, ###p ≤ 0.001 vs. sham group. All data are presented as mean ± SD.
In association with the decrease in motor and cognitive deficits, scriptaid also prevented the ICH-induced decrease in MBP and NF200 immunoreactivity in the striatum and CC at 35 days (Figure 6(a) to (c)). Ultrastructural damage to white matter by ICH, measured by a decrease in the number of axons and reduction in the thickness of the myelin sheath, was also attenuated by scriptaid, providing further evidence that scriptaid preserves white matter integrity (Figure 6(d) and (e)). The quantification of the g-ratio (the ratio of axonal diameter to overall diameter of the axon plus myelin) and axon density in ICH+scriptaid group were all higher than ICH+veh group at 35 days after ICH (Figure 6(e)). Scriptaid-mediated preservation of white matter integrity correlated with improvement in white matter functional recovery 35 days after ICH. Indeed, after ICH, the N1 segment amplitude decreased, indicating damage to myelinated axons. Scriptaid significantly inhibited this decrease in the amplitude of the N1 segment (Figure 6(f) to (h)). The amplitude of the N1 component of the CAPs in response to increasing stimulus strength (0.0–0.20 mA) was higher in ICH+scriptaid group compared to WT mice at 35 days after ICH (Figure 6(g)). Then, we compared the N1 amplitude in response to a 0.175 mA stimulus 35 days after ICH, which also demonstrated that scriptaid-treated mice exhibited a higher amplitude than vehicle mice (Figure 6(h)). Therefore, scriptaid improves neurological functional recovery during the early phase after ICH and provides long-term preservation of white matter after ICH.
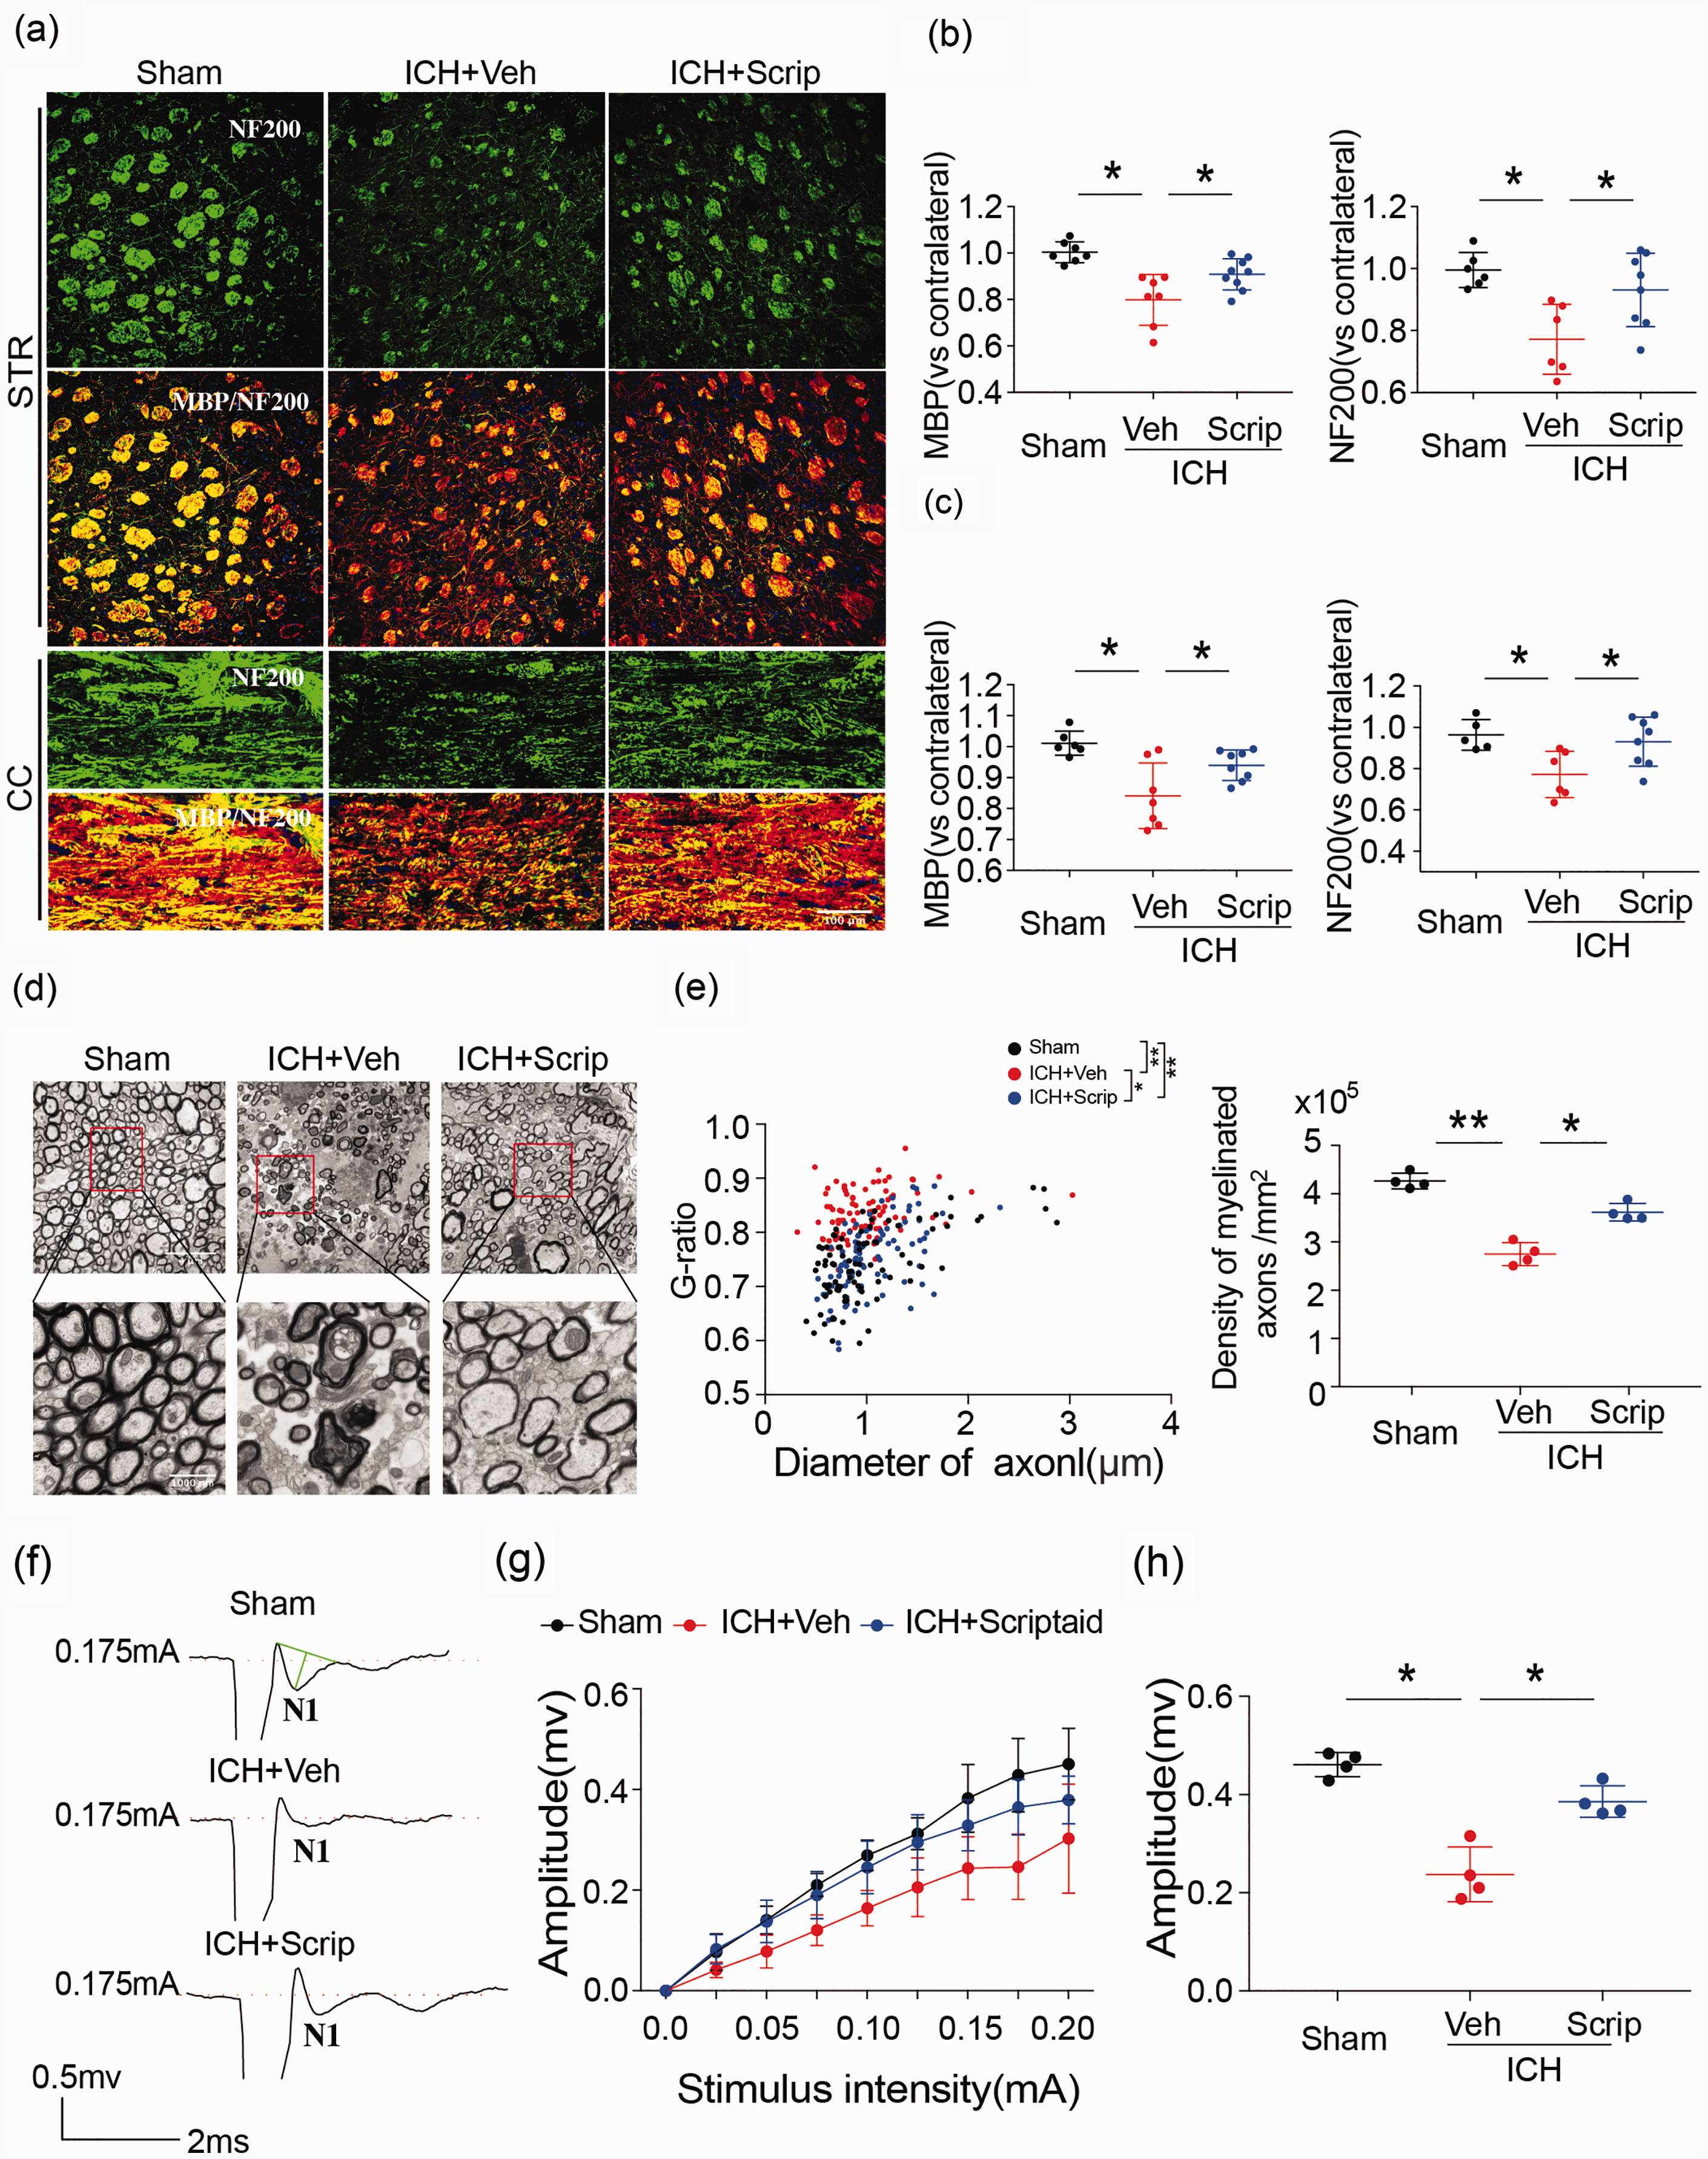
Scriptaid alleviates white matter injury after ICH. (a–c) Double immunofluorescence staining for NF200 and MBP in the ipsilateral striatum and corpus callosum 35 days after ICH (scale bar = 100 µm) and the fold decrease of MBP and NF200 in the striatum and corpus callosum demonstrated the degree of WMI 35 days after ICH. (d) Representative images of myelin sheath damage in sham, vehicle and scriptaid groups 35 days after ICH. (e) Quantification of the g-ratio (the ratio of axonal diameter to overall diameter of the axon plus myelin) and axon density in sham, vehicle and scriptaid groups 35 days after ICH. (f) Representative traces of the evoked CAPs in the CC (stimulus, 0.175 mA; 0.48 mm lateral to the stimulating electrode) 35 days after ICH. (g) Signal conduction along nerve fibers, as measured by the amplitude of the N1 component of the CAPs in response to increasing stimulus strength (0.0–0.20 mA). (h) N1 amplitude in response to a 0.175 mA stimulus 35 days after ICH. n = 5–9/group. *p≤ 0.05, **p≤ 0.01. All data are presented as mean ± SD.
Scriptaid modulates microglia/macrophage polarization and reduces neuroinflammation after ICH
We performed double immunostaining for the microglia/macrophage marker Iba1 and M1- or M2-type phenotypic marker proteins in the basal ganglia one, three, and seven days after ICH to analyze microglia/macrophage polarization after ICH. As expected, the M1 marker CD16 decreased and M2 marker CD206 increased in the scriptaid treatment group one, three, and seven days after ICH; however, these alterations were only significant seven days after ICH (Figure 7(a) and (b)). Moreover, the results of RT-PCR showed that scriptaid treatment decreased gene expression of proinflammatory cytokines one, three, and seven days after ICH in mice (Figure 7(c)).
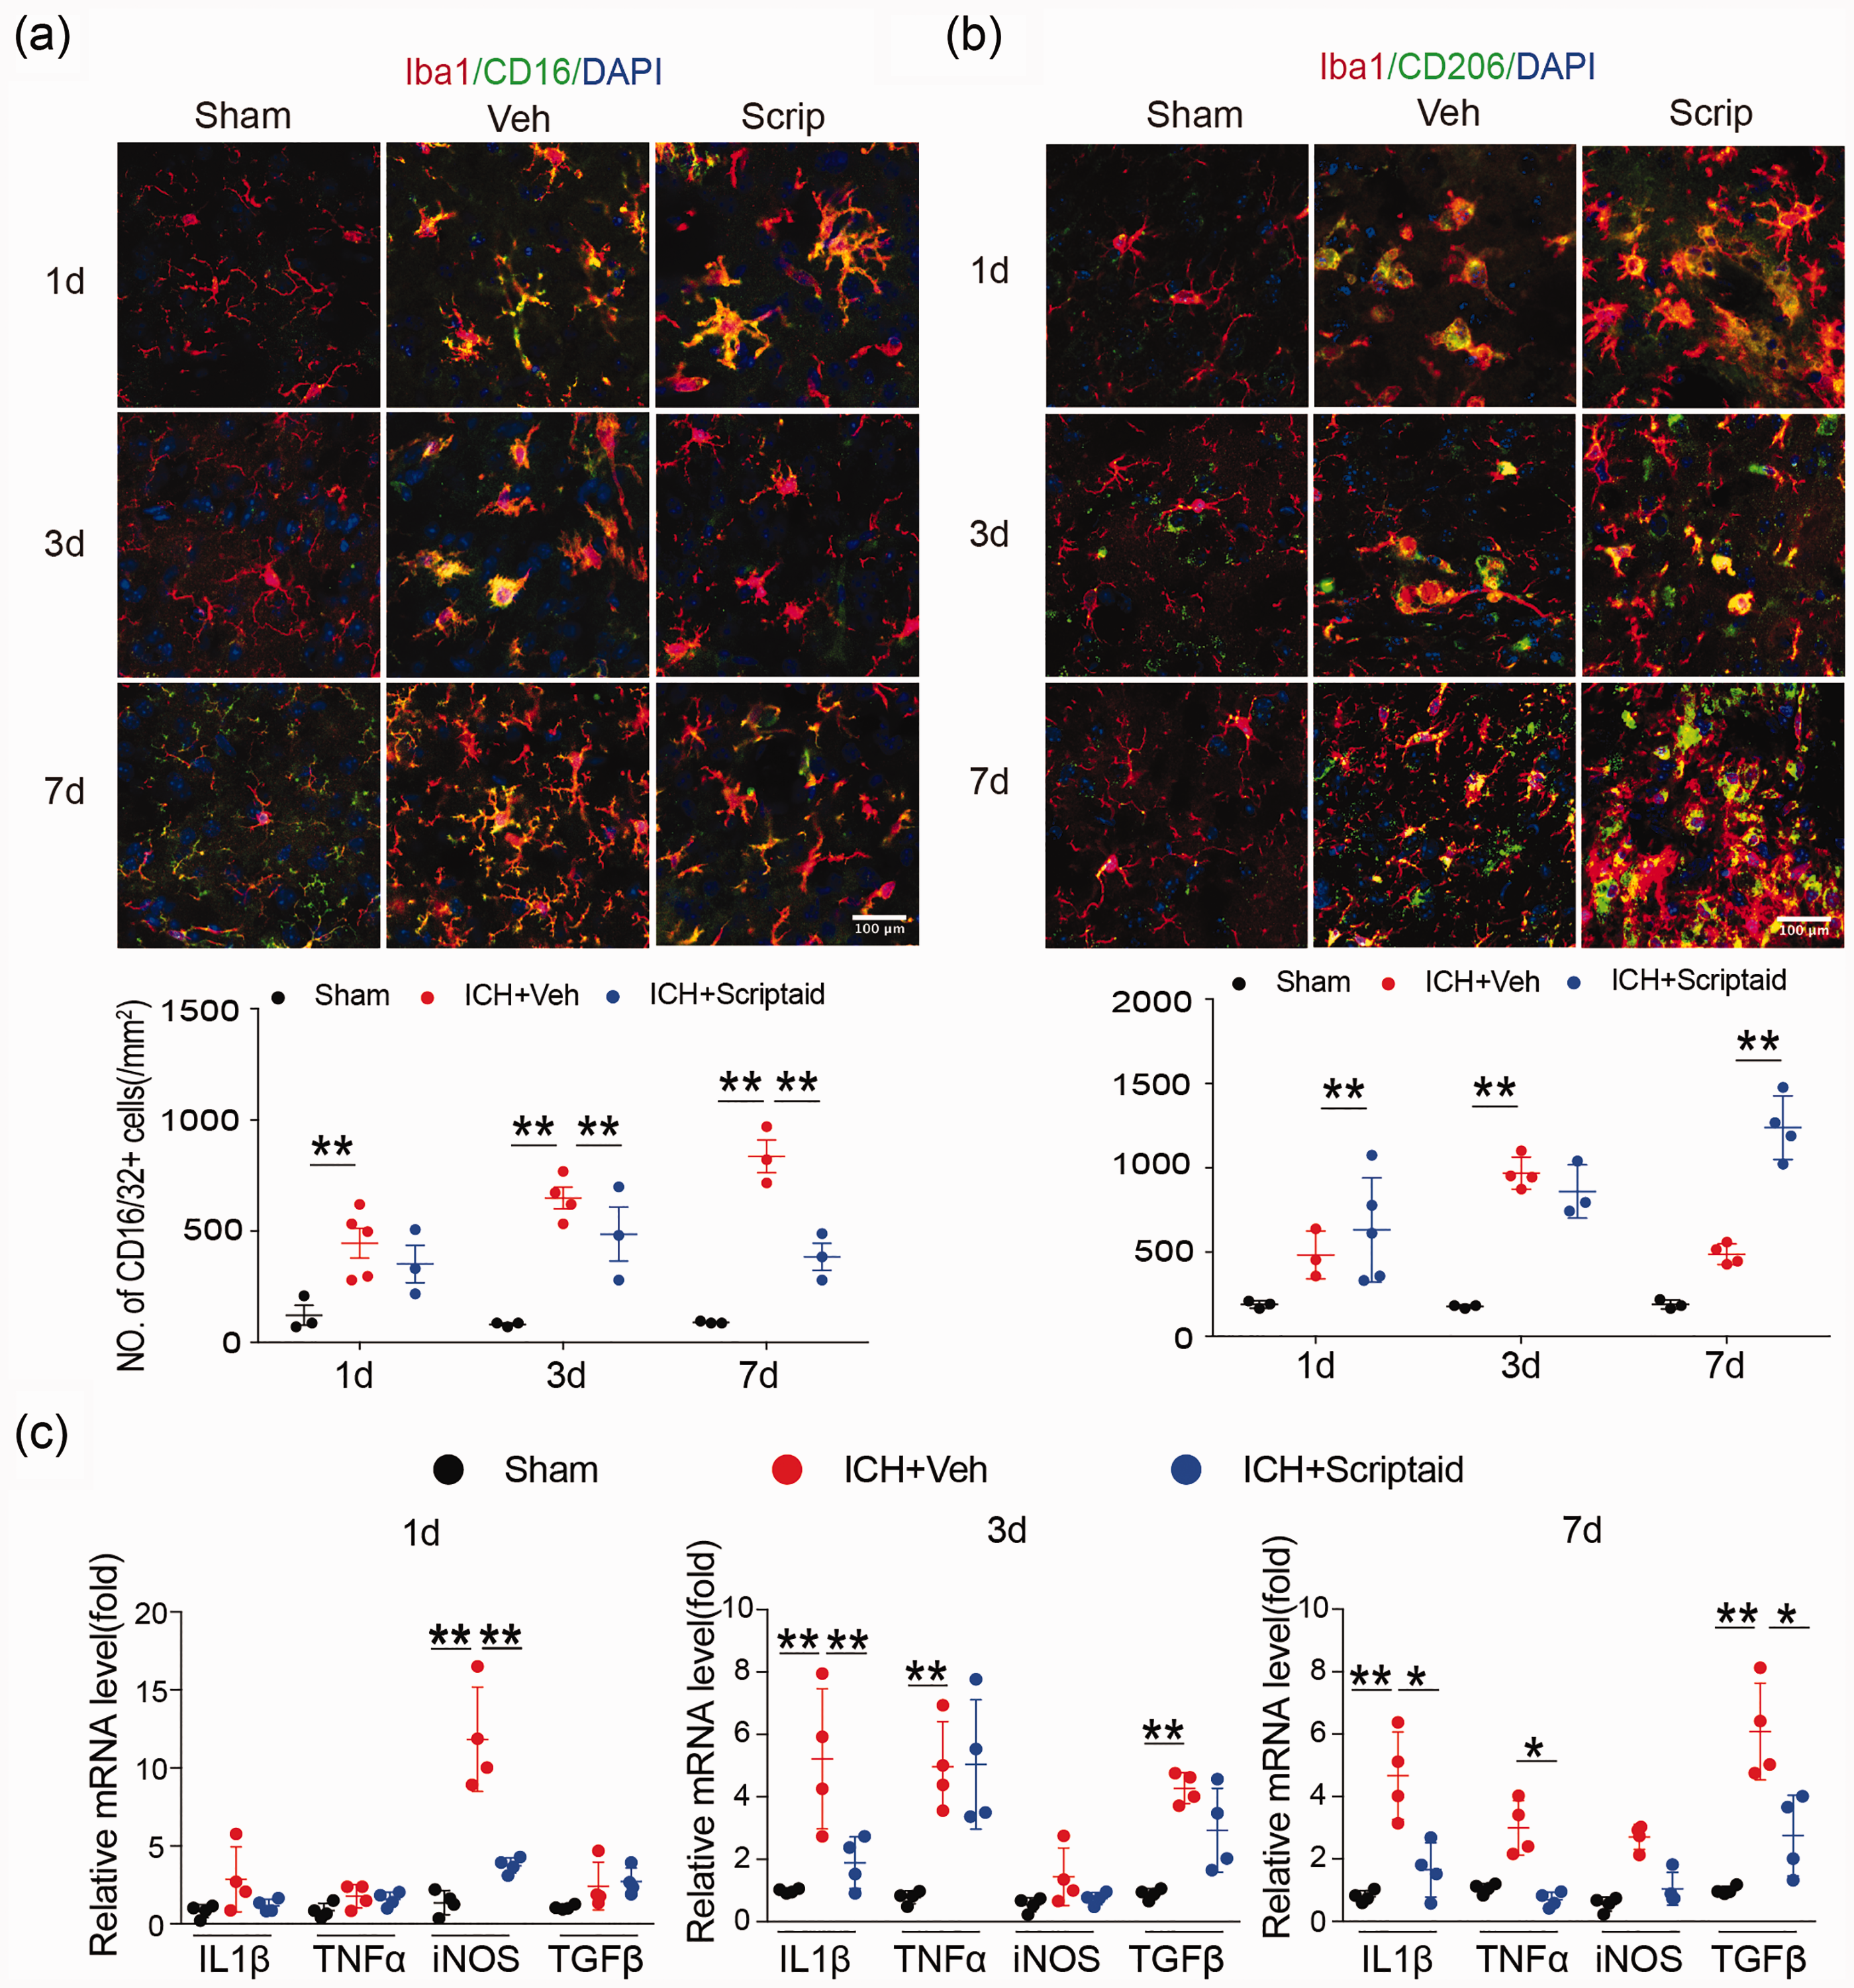
Scriptaid modulates microglia/macrophage polarization and reduces neuroinflammation after ICH. (a) Double immunostaining of the M1 marker CD16/32 and Iba1 marker in activated microglia in the ipsilateral basal ganglia and quantification of CD16/32+ cells one, three, and seven days after ICH. (b) Double immunostaining of the M2 marker CD206 and Iba1 marker for activated microglia in the ipsilateral basal ganglia and quantification of CD206+ cells one, three, and seven days after ICH. (Scale bar=100 µm). (c) RT-PCR demonstrated a decrease in proinflammatory-cytokine genes in the scriptaid-treated group. n = 5–6/group. *p≤0.05, **p≤0.01. All data are presented as mean ± SD.
Discussion
WMI is an important contributing factor to poor outcome in ICH patients. Although previous studies have demonstrated that WMI after ICH is mainly due to secondary neuroinflammation,4,42,43 there are still no effective therapies for the cognitive and sensorimotor deficits resulting from WMI in ICH patients. Previous studies have shown that various HDAC inhibitors facilitate hematoma resolution after ICH, the underlying cause of primary injury after ICH. 19 , 20 However, whether HDAC inhibitors also mitigate progressive WMI induced by secondary neuroinflammation after ICH remains to be elucidated. Given that microglia play a pivotal role in neuroinflammation,44,45 we assessed whether activation of HDAC, as shown to occur in response to ICH, 20 facilitates WMI by modulating neuroinflammation via microglia/macrophage polarization after ICH, as shown in other brain injury models. 14 Further, we examined if modulation of microglia/macrophage polarization was also the means by which scriptaid exerted its neuroprotective effects against ICH. Our results indicate that inhibiting HDAC steered microglia towards the anti-inflammatory M2 phenotype and alleviated WMI and the associated motor and cognitive deficits induced by ICH through modulation of the JAK/STAT signaling pathway. Thus, as with other brain injury models, 14 the phenotypic characteristics of microglia (i.e. M1 versus. M2 polarization) determine the extent of WMI after ICH.
Microglia are resident macrophages of the CNS that when activated play a crucial role in neuroinflammation. Previous studies have demonstrated that activated microglia can be polarized into a destructive M1 phenotype or a protective M2 phenotype, which can be distinguished by the surface markers and intracellular cytokines they express. 46 We observed a time-dependent increase in the expression of both M1- and M2-type microglia, and their associated pro-inflammatory and anti-inflammatory cytokines respectively, after ICH. Given the brain damage that ensues, it can be deduced that anti-inflammatory processes are either insufficient or are overwhelmed by the pro-inflammatory response, and indeed, there was a greater increase in the number of cells expressing the M1 phenotype versus the M2 phenotype in response to ICH. Silencing Hdac2 in microglia reduced the number of microglia expressing the M1 phenotype in favor of the M2 phenotype, and attenuated WMI. This preservation of white matter after conditional knockdown of Hdac2 correlated with better neurological, sensorimotor, and cognitive outcome.
As regulators of inflammation and immunity, HDACs play an important role in chromosome structure modification and gene expression. 24 In line with activated microglia taken on either a toxic M1 or beneficial M2 phenotype, they generate an environmental milieu that promotes or mitigates neuroinflammation by modulating the expression of pro-inflammatory or anti-inflammatory factors, respectively. M1 phenotype microglia/macrophage mainly secrete proinflammatory cytokines such TNF-α, IL-1β, iNOS, and chemotactic factors, resulting in acute neuroinflammation. An increase in the gene expression of pro-inflammatory IL1β and TNFα accompanied the M1 phenotypic shift induced by ICH in the current study, which was abated by conditional knockout of Hdac2 in mice. In addition, scriptaid could regulate microglia/macrophage polarization and alleviate WMI in mice ICH model. However, as a broad-spectrum HDACs inhibitor, scriptaid did not inhibit the HDAC2 in microglia specially. Therefore, cultured microglia exposed to hemoglobin was used to confirm the effect of scriptaid in regulating microglia activation after ICH. These data provide further evidence that HDAC modulates neuroinflammation through microglia polarization after ICH, in agreement with previous studies that showed HDAC inhibition suppresses inflammation in vivo and in vitro.26,47–49
HDAC inhibitors have previously been shown to exert neuroprotective effects in ischemic stroke and TBI animal models18,50 by modulating microglia toward a more beneficial phenotype. The present study affirms previous work in which we showed that scriptaid alleviated WMI and neurological deficits after ICH, 21 and more notably extends this work to provide a mechanistic framework by which this protection occurs. Similar to results obtained from conditional knockdown of the Hdac2 gene in mice, scriptaid alleviated WMI in both in vitro and in vivo models of ICH. The in vitro data suggest that as with TBI and ischemic stroke,18,50 this protection of white matter correlated with a reduction in the number of microglia expressing the M1 phenotype in favor of the M2 phenotype, concurrent with a reduction in inflammatory cytokines. Thus, similar to the effects of other HDAC inhibitors after ICH, scriptaid can alleviate primary damage induced by the hematoma as we have previously shown, 21 but as shown in the current study, it can also alleviate secondary neuroinflammation, which leads to additional WMI and poorer prognosis. Taken together, these results suggest that scriptaid may be a prime immunomodulatory therapeutic tool to mitigate WMI after various forms of white matter brain injury in the clinic, including ICH.
Previous studies have demonstrated that many pathways contribute to activation and polarization of microglia/macrophages, such as the JNK, Notch, IL10/GSK3/PTEN, and JAK/STAT signaling pathways.12,19,31,32 Signal transducers and activators of transcription (STATs) are essential transcription factors that drive the microglial immune response. For example, the HDAC inhibitor sodium butyrate has been shown to mitigate microglia-mediated neuroinflammation during ischemic stroke via the IL10/STAT3 signaling pathway. 19 Consistent with previous studies, our results showed that scriptaid reduced neuroinflammation and prevented activated microglia/macrophages from shifting to the M1 phenotype via activation of JAK/STAT signaling pathways. Indeed, immunofluorescence and Western blot analysis both showed that the expressions of the pJAK2 and pSTAT1 proteins decreased in the scriptaid treatment group after ICH. Therefore, we propose that scriptaid modulates microglia/macrophage polarization and reduces neuroinflammation after ICH through the JAK2/STAT1 axis.
Conclusion
In summary, our present study indicates that HDAC inhibition modulated microglia/macrophage polarization and mitigated neuroinflammation after ICH. As microglia-mediated neuroinflammation is an important contributing factor to WMI after ICH, the use of HDAC inhibitors could be a promising new therapeutic tool to mitigate WMI after ICH.
Supplemental Material
sj-pdf-1-jcb-10.1177_0271678X20942613 - Supplemental material for HDAC inhibition reduces white matter injury after intracerebral hemorrhage
Supplemental material, sj-pdf-1-jcb-10.1177_0271678X20942613 for HDAC inhibition reduces white matter injury after intracerebral hemorrhage by Heng Yang, Wei Ni, Pengju Wei, Sicheng Li, Xinjie Gao, Jiabin Su, Hanqiang Jiang, Yu Lei, Liangfu Zhou and Yuxiang Gu in Journal of Cerebral Blood Flow & Metabolism
Supplemental Material
sj-pdf-2-jcb-10.1177_0271678X20942613 - Supplemental material for HDAC inhibition reduces white matter injury after intracerebral hemorrhage
Supplemental material, sj-pdf-2-jcb-10.1177_0271678X20942613 for HDAC inhibition reduces white matter injury after intracerebral hemorrhage by Heng Yang, Wei Ni, Pengju Wei, Sicheng Li, Xinjie Gao, Jiabin Su, Hanqiang Jiang, Yu Lei, Liangfu Zhou and Yuxiang Gu in Journal of Cerebral Blood Flow & Metabolism
Footnotes
Authors’ contributions
Heng Yang and Wei Ni designed and performed experiments, analyzed the data and wrote the manuscript. Xinjie Gao, Pengju Wei and Sicheng Li provided specific input relating to the cell culture, cell isolation experiments, and the flow cytometric analyses. Jiabin Su, Yu Lei, Hanqiang Jiang contributed to writing the manuscript and commented on the manuscript at all stages. Liangfu Zhou, Yuxiang Gu initiated, directed and funded the entire study, designed the experiments, analyzed the data, and wrote the manuscript.
Funding
The author(s) disclosed receipt of the following financial support for the research, authorship, and/or publication of this article: This work was financially supported by grants 2014CB541604, 2016YFC1301702 and 2016YFSF110141 from the National Ministry of Science and Technology (MOST); grants 81500987, 817712374, 81801155, and 81870917 from the National Natural Science Foundation of China (NSFC); grant 15140902300 and 18511102801 from Science and Technology Commission of Shanghai Municipality (STCSM); and grant 2018SHZDZX03 from Shanghai Municipal Science and Technology Major Project.
Declaration of conflicting interests
The author(s) declared no potential conflicts of interest with respect to the research, authorship, and/or publication of this article.
Supplemental material
Supplemental material for this article is available online.
References
Supplementary Material
Please find the following supplemental material available below.
For Open Access articles published under a Creative Commons License, all supplemental material carries the same license as the article it is associated with.
For non-Open Access articles published, all supplemental material carries a non-exclusive license, and permission requests for re-use of supplemental material or any part of supplemental material shall be sent directly to the copyright owner as specified in the copyright notice associated with the article.