
Abstract
During slow-wave sleep, synaptic transmissions are reduced with a concomitant reduction in brain energy consumption. We used 3 Tesla MRI to noninvasively quantify changes in the cerebral metabolic rate of O2 (CMRO2) during wakefulness and sleep, leveraging the ‘OxFlow’ method, which provides venous O2 saturation (SvO2) along with cerebral blood flow (CBF). Twelve healthy subjects (31.3 ± 5.6 years, eight males) underwent 45–60 min of continuous scanning during wakefulness and sleep, yielding one image set every 3.4 s. Concurrent electroencephalography (EEG) data were available in eight subjects. Mean values of the metabolic parameters measured during wakefulness were stable, with coefficients of variation below 7% (average values: CMRO2 = 118 ± 12 µmol O2/min/100 g, SvO2 = 67.0 ± 3.7% HbO2, CBF = 50.6 ±4.3 ml/min/100 g). During sleep, on average, CMRO2 decreased 21% (range: 14%–32%; average nadir = 98 ± 16 µmol O2/min/100 g), while EEG slow-wave activity, expressed in terms of
Introduction
The restorative function of sleep in the healthy brain is well established, with sleep playing an important role in synaptic downscaling and homeostasis.1,2 In fact, when sleep is disrupted or insufficient, both cognitive function and cardiovascular health are subject to deterioration. 3 In the US, up to 40% of the population suffers from various degrees of insomnia, 4 a condition that is particularly prevalent in the elderly. 5 Fractured sleep is known to have adverse implications on cognition and memory 6 and is likely to contribute to age-related cognitive decline as well as to neurodegenerative disorders, including Alzheimer’s and Parkinson’s disease. 7 Persistent insomnia also augments the risk for hypertension, diabetes, stroke and heart disease. 3
Madsen et al. 8 found that during deep sleep (slow-wave sleep, SWS) the cerebral metabolic rate of oxygen (CMRO2) was reduced by up to 25%, in contrast to light sleep, where the decrement in metabolism was only 5%. 9 The authors used invasive techniques involving repeated simultaneous sampling of arterial and venous blood from the radial artery and internal jugular vein, respectively, along with infusion of 133Xe serving as an inert gas to determine cerebral blood flow (CBF) via the Kety-Schmidt technique. From these data, they were able to compute CMRO2 as the product of arterio-venous difference in O2 saturation and CBF. Boyle et al., 10 using similar methods, found that during polysomnographically verified sleep, cerebral glucose utilization fell to a nadir of 72% and oxygen consumption to 83% relative to wakefulness. PET methods are also capable of imaging CMRO2, 11 but that approach is costly and cumbersome because it requires three separate tracer injections. Further, neither of these methods provides the temporal resolution needed to associate dynamic changes in CMRO2 with sleep stage. The availability of such a method would therefore provide means to study patients with sleep disorders and offer new insights into sleep-stage and age-dependent alterations in brain oxygen utilization.
In this pilot study, we explored the potential of the OxFlow MRI method, previously developed by some of the authors,12–16 to quantify the hypothesized reduction in CMRO2 during sleep, as well as following awakening during continuous scanning. The method allows measurement of CMRO2 at a temporal resolution of seconds via a joint quantification of cerebral blood flow (CBF) and venous oxygen saturation (SvO2). Experiments were conducted on test subjects first during wakefulness to evaluate technical and physiologic stability of the derived quantities. The effect of reduced consciousness was subsequently evaluated, initially without, and subsequently with, concurrent electroencephalography (EEG) to relate the decrements in CMRO2 following sleep onset to changes in slow-wave EEG power.
Materials and methods
OxFlow MRI
The principles of OxFlow have been described extensively elsewhere.12,14,17 Briefly, the technique interleaves susceptometry-based oximetry (‘Ox’) with phase contrast-MRI (‘Flow’) without gating, using a gradient-echo sequence with two or more echoes. Venous oxygen saturation (SvO2) is retrieved from two flow compensated, equal polarity echoes differing in echo time, and blood flow (BF) is obtained from two flow-encoded interleaves of the first echo, differing in the first moment of the z-gradient along the direction of flow. The present implementation was based on golden angle radial k-space sampling with KWIC filtering, 12 subsequently referred to as rOxFlow.
Study protocol
General
The protocol for this feasibility study was submitted and approved by the University of Pennsylvania Institutional Review Board (IRB# 832748) as guided by the ethical principles set forth in the Belmont Report. All participants provided written informed consent before the examinations, in compliance with the Health Insurance Portability and Accountability Act. Toward quantifying CMRO2 non-invasively during two states of consciousness (wakefulness and sleep) with rOxFlow, three sets of studies were performed: the first examined the stability of the MRI metrics in a phantom and subsequently in test subjects; the second set of experiments evaluated the feasibility of the protocol, in which the pulse sequence was run with ‘eyes open’ (constrained to stay awake) and ‘eyes closed’ (free to fall asleep), in the absence of EEG monitoring. Finally, participants were scanned with concurrent EEG and rOxFlow during spontaneous progression to sleep.
Temporal stability of the rOxFlow method ex vivo and in vigilant test subjects
The stability of the rOxFlow method was first evaluated in a flow phantom consisting of a vinyl tube placed in a cylindrical plastic container, filled with a 1.5% agarose gel doped with 0.1 mM Gd-DTPA. The inner tube was filled with distilled water and connected to an electrical pump (Masterflex L/S, Cole-Parmer, Illinois, US). MRI data were acquired continuously for 28 min. Flow velocity and background field-corrected, inter-echo phase difference (ΔΦ) maps were generated, from which total flow and ΔΦ in flow voxels relative to surrounding stationary medium (ΔΦflow-static) were calculated over the time-course. Subsequently, the stability of the rOxFlow-derived parameters was assessed in five healthy subjects, during 32 min of wakefulness (Table 1). Participants were prompted to watch a video and attested that they were awake during the entire imaging period.
Participant characteristics.
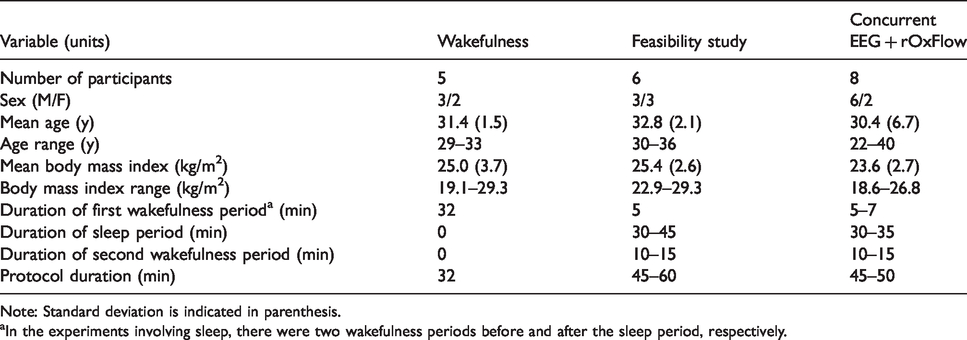
Note: Standard deviation is indicated in parenthesis.
aIn the experiments involving sleep, there were two wakefulness periods before and after the sleep period, respectively.
Whole-brain oxygen metabolism during wakefulness and sleep
The purpose of these preliminary experiments was to evaluate the feasibility of scanning subjects during sleep, in terms of subjects’ ability to sleep in supine position on the scanner table, and to determine whether metabolic parameters could be retrieved during progression from wakefulness to sleep. The examinations were conducted in late afternoon. MRI rOxFlow data were collected continuously for 45–60 min in six healthy subjects (Table 1). Participants were instructed to respond to a visual cue, administered every 2 min by squeezing the scanner’s squeeze ball. They were deemed asleep in case of missing response. If they responded to the second visual prompt, they were asked to close their eyes to initiate sleep. We refer to this initial time as ‘wakefulness period,’ W1. All subjects were awakened by the operator via the scanner’s intercom after 30–40 min and urged to stay awake with eyes open for the final 10–15 min of the protocol (second wakefulness period, W2). All subjects were required to report, after the MRI protocol, whether they were able to fall asleep in the scanner.
Once the feasibility of the protocol was demonstrated, MRI with concurrent EEG monitoring was performed in another set of eight volunteers (see Table 1 for participant characteristics). Subjects underwent this combined protocol between 8 and 10 p.m. to facilitate in-scanner sleep.
Some strategies were adopted to promote rapid sleep onset: the scanner table was padded for comfort; a leg cushion was provided to prevent back pain; during the central portion of the acquisition scan room lights were turned off, and gray noise was delivered through MR-compatible headphones (for some but not all subjects). EEG and MRI data were collected simultaneously and continuously for 50 min.
During the first 5–7 min (W1), a standard visual stimulus in the form of a white cross on black background was provided (for all but one of the subjects). Participants were instructed to close their eyes after extinction of lights, which served as a cue to indicate that they were free to sleep. All subjects were awakened by the operator via the scanner’s intercom after 30 min, asked to press the squeeze-ball to confirm that they were awake, and prompted to stay awake with eyes open for the remaining 10–13 min of the protocol (W2). As in the feasibility study, all subjects were required to report whether they were able to sleep.
Study participants
All the experiments were conducted at the Hospital of the University of Pennsylvania. Participants were recruited between October 2017 and July 2019 from a pool of healthy subjects, with normal sleep cycle (6–9 h) and no overt current or past sleep disorders. Preference was given to candidate subjects who reported, based on prior experience, to be able to fall asleep in the MRI scanner. Exclusion criteria were claustrophobia, abnormal body mass index (outside the range of 18–30 kg/m2). Collectively, 14 volunteers were scanned (Table 1). The experiments involving EEG and MRI took place in late evening, after the participant consumed a light dinner, to promote the onset of sleep. Sleep deprivation was not required, but abstinence from caffeine or excitant drink at the day of the examination was encouraged. Two out of 14 volunteers participated in both the feasibility and the actual EEG+MRI study.
MRI data acquisition
All MRI was performed at 3 T (Siemens Prisma, Erlangen, Germany) with subjects positioned supine, head-first using a 64-channel head-neck coil. The coil provided adequate space to connect cables from EEG cap electrodes to the amplifier. For all human subject scans, the MRI protocol comprised the following sequences: T1-weighted high-resolution anatomic scan for brain volume estimation, used for normalizing CMRO2 and CBF to 100 g of tissue; sagittal scout angiogram visualizing brain and neck vessels, as a means to identify superior sagittal sinus (SSS) and carotid bifurcation; time-of-flight axial scans to prescribe two slices, one each at the level of the SSS and internal carotid and vertebral arteries. For the time series quantification of CMRO2, both blood flow and venous oxygen saturation are measured at the SSS. However, since the latter drains the cerebral cortex only, total CBF (tCBF) quantification requires measurement of flow velocities in all inflow conduits (internal carotid and vertebral arteries), which is more involved, and which is therefore conducted once before initiation of the time series. A calibration factor 
Imaging pulse sequence scan parameters.
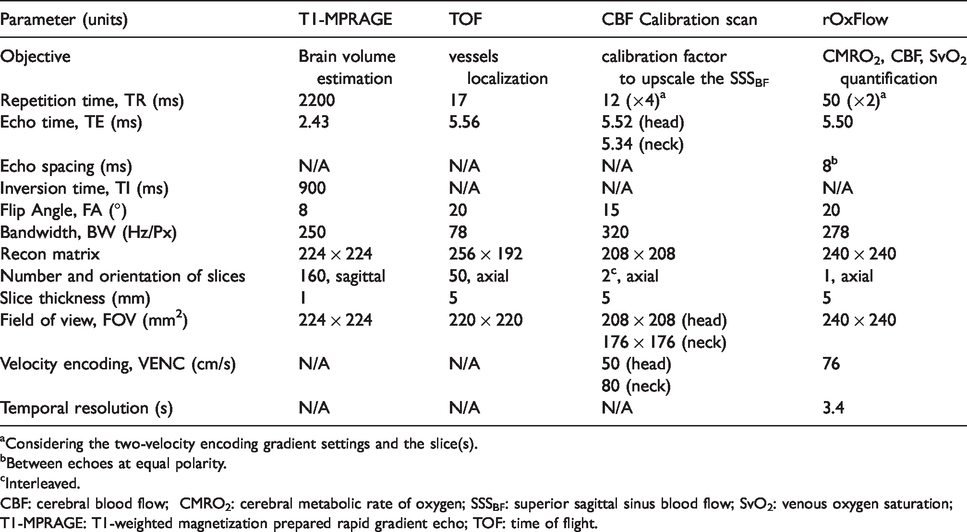
aConsidering the two-velocity encoding gradient settings and the slice(s).
bBetween echoes at equal polarity.
cInterleaved.
CBF: cerebral blood flow; CMRO2: cerebral metabolic rate of oxygen; SSSBF: superior sagittal sinus blood flow; SvO2: venous oxygen saturation; T1-MPRAGE: T1-weighted magnetization prepared rapid gradient echo; TOF: time of flight.
The rOxFlow sequence uses golden angle radial k-space sampling (more details in Cao et al. 12 ). TR of the sequence was selected based on the tradeoff between temporal resolution and EEG-data contamination: TR = 50 ms allowed achieving a temporal resolution tres = 3.4 s (2×TR×34, with 2 the number of flow encodings and 34 the number of views in the central portion of k-space); 1/TR corresponded to a frequency of 20 Hz, out of the EEG bands of interest needed to establish the onset of sleep. The MRI acquisitions were preceded by the EEG cap placement and preliminary EEG tests (see below). The acquisition protocol is illustrated in Figure 1.
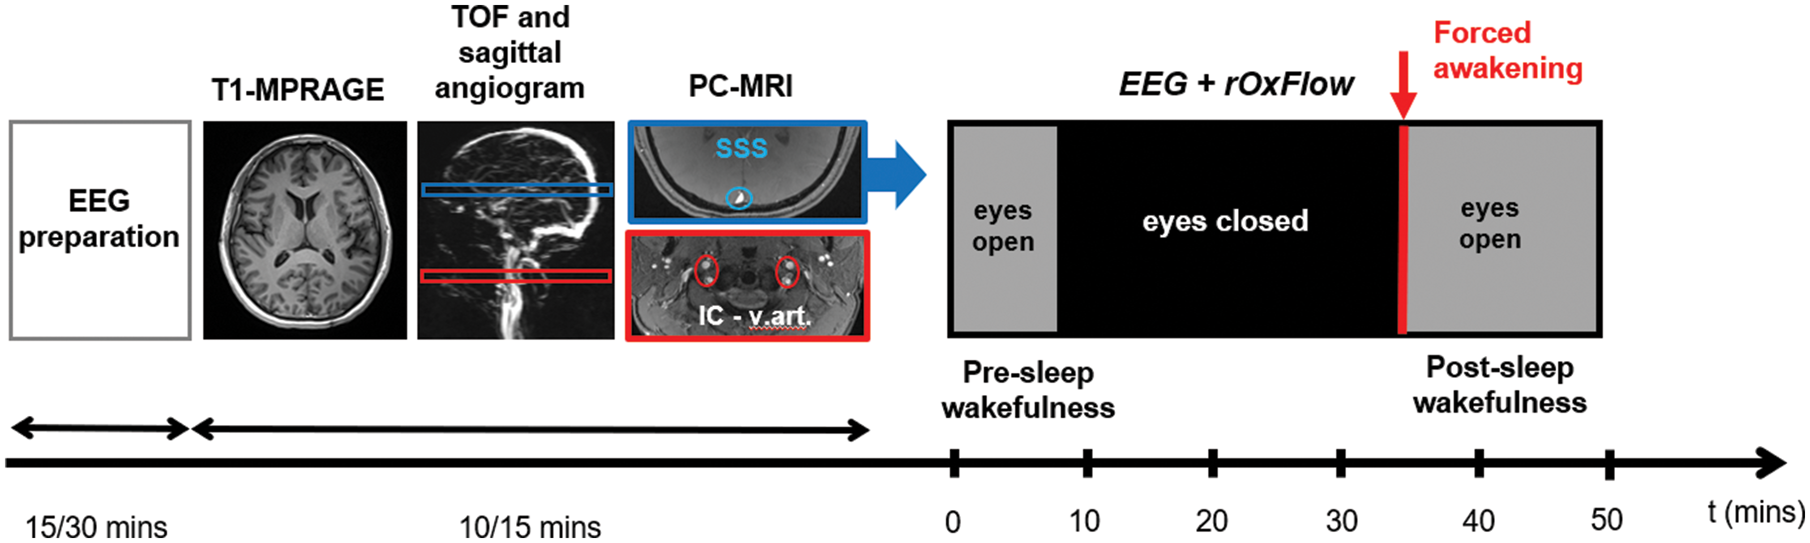
Concurrent EEG and radial-OxFlow (rOxFlow) acquisition sequence. EEG set-up is followed by acquisition of anatomic T1- weighted images for the determination of brain volume, and time-of-flight (TOF) axial and sagittal angiograms, used to prescribe two slice locations for phase contrast (PC)-MRI at the head and neck levels (SSS: superior sagittal sinus, indicated in blue; IC-v.art: internal carotid and vertebral arteries, indicated in red). At the SSS location, the concurrent EEG+rOxFlow acquisition is performed with eyes open (in the presence of a neutral stimulus), or eyes closed (lights off). After 30–35 min, the subject is prompted to squeeze the ball to indicate that he/she is awake.
Other physiological parameters
Participants’ hemoglobin concentration (Hb) was measured from a finger stick blood sample (Hemocue Hb 201+, HemoCue America, CA, US), performed in triplicate, from which the average reading was calculated. Arterial oxygen saturation (SaO2, in %HbO2) and heart rate (bpm) were recorded during the entire rOxFlow protocol by a pulse oximeter finger-probe (Veris Medrad 8600, Bayer, PA, US).
EEG data acquisition
EEG data were recorded in the MRI scanner using a 15-channel customized MR-compatible sleep cap and a 32-channel amplifier (BrainAmp MR Plus, Brain Products GmbH, Gilching, Germany). Scalp electrodes were placed according to the international 10–20 system (see Figure C.1 in Suppl. Mat.). Once the EEG cap was in place, the signal quality was tested comparing the
Data processing
Processing of MRI data
Image reconstruction 12 and extraction of MRI hemodynamic parameters (CBF, SvO2, CMRO2) were performed with in-house MATLAB scripts (MATLAB R2016b MathWorks, Inc., Natick, MA). First, the radial k-space data were corrected for phase errors due to gradient-induced eddy current effects. 18 A KWIC (k-space weighted image contrast) filter was applied to the data:19 34 views were used to encode the central k-space region, while a progressively higher number of views were included towards higher k-values. At the outer-most region of k-space, 610 views were employed, satisfying the Nyquist sampling criterion for a 240 × 240 matrix. 19 A sliding-window of 34 views was used for the dynamic series, and the reconstruction window consisted of 610 views. This reconstruction scheme yielded a temporal resolution of tres = 3.4 s (2×TR×34, with the factor of 2 accounting for the number of velocity encodings, TR = 50 ms) and temporal footprint (time required to acquire all 610 views) of tftp = 61 s (2×TR×610). For regridding (resampling of radial MRI data onto a Cartesian grid), the weights provided by the KWIC filter were used in conjunction with non-uniform fast Fourier Transform. For the wakefulness/sleep protocol of 50 min, N = 30,000 projections were acquired, corresponding to 864 image frames.
From the PC-MRI data, after phase-unwrapping, blood flow was quantified in the SSS, and upscaled to yield total CBF; SvO2 was also quantified in the SSS via MRI susceptometry.
20
CMRO2 was then computed by invoking Fick’s Principle13–15:

Processing of EEG data
EEG data were preprocessed using Brain Vision Analyzer software (Version 2.1, Brain Products, Gilching, Germany). First, imaging and electrocardiographic (ECG) pulse artifacts were removed using the average artifact subtraction method,21,22 including a low-pass filter of 30 Hz. In brief, imaging artifacts were automatically marked based on recurring patterns. The thus-defined intervals were then averaged, and their means subtracted from each interval. ECG pulse artifacts were removed by constructing an average ECG artifact template that was subtracted from the EEG data. Data were then high-pass filtered (0.5 Hz cut-off). Thereafter, independent component analysis was used to suppress artifacts caused by eye movement, muscle activation, temporal electrode noise and residual pulse artifacts, followed by visual inspection.
After Fourier processing, EEG power values within the total frequency range 0–30 Hz, i.e. comprising sub-
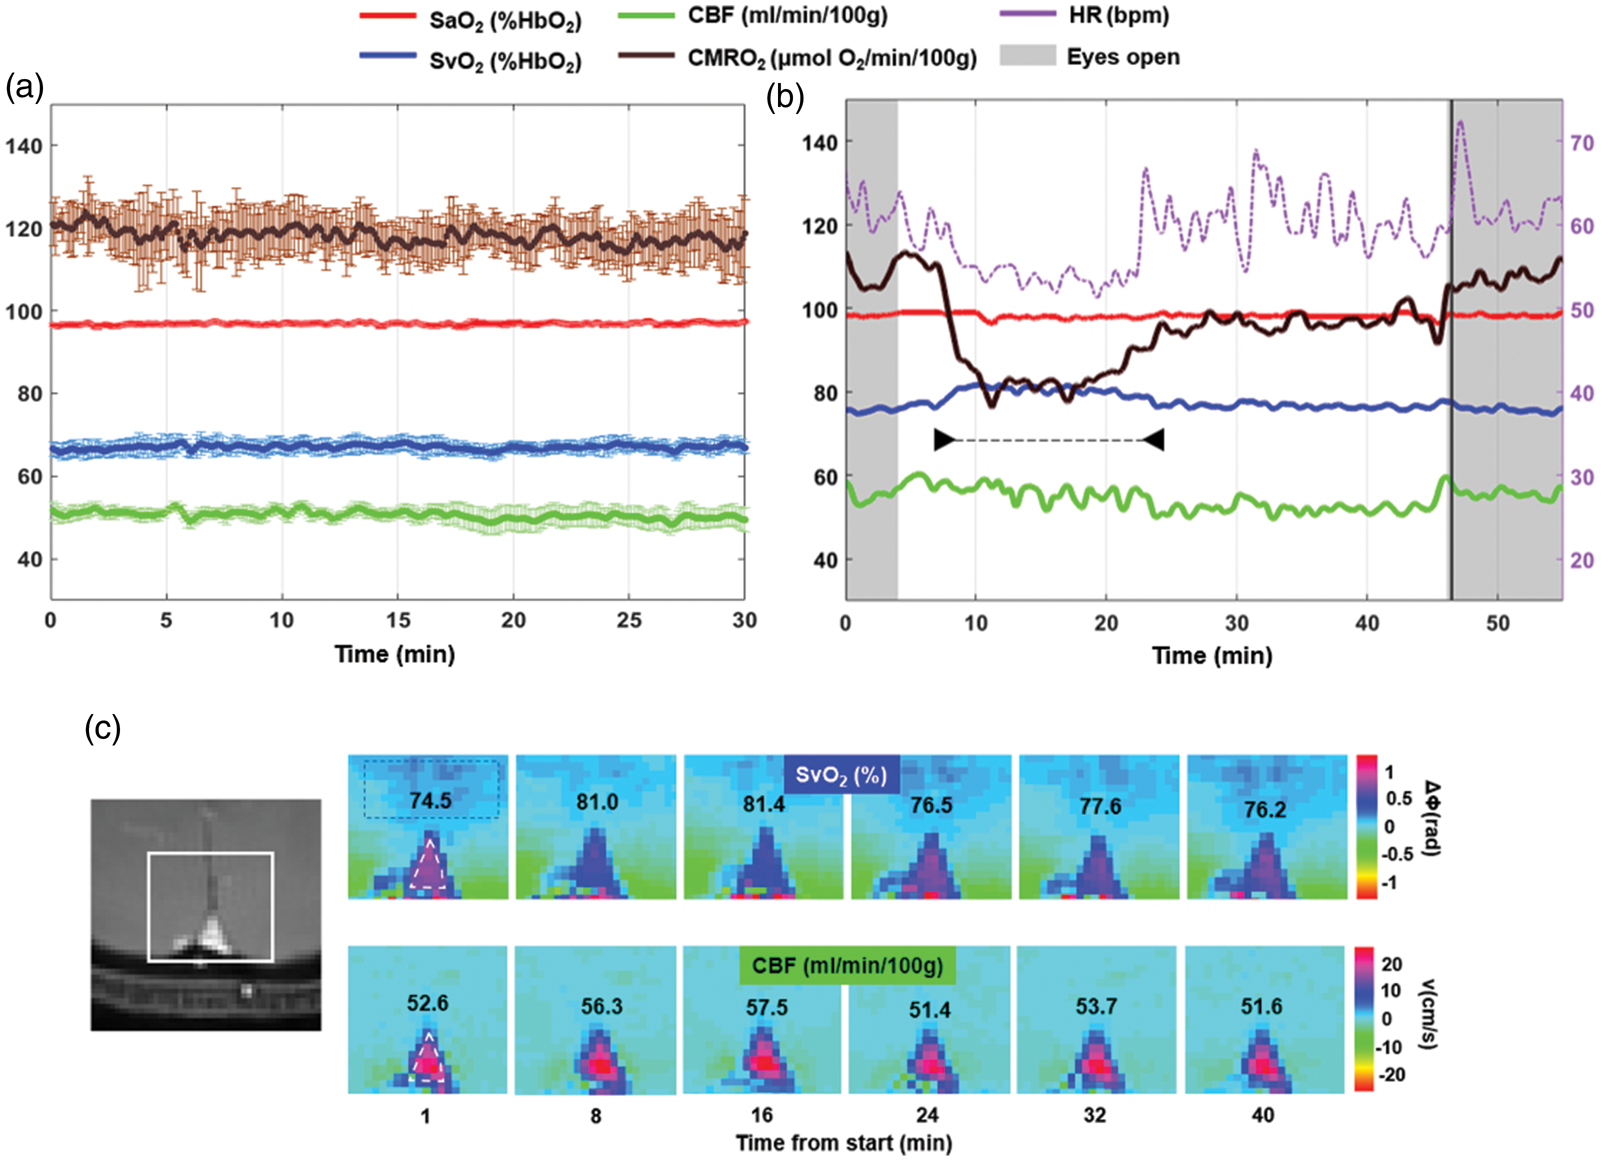
Radial OxFlow (rOxFlow) during wakefulness and sleep. (a) Temporal stability of rOxFlow during wakefulness. The group means of the metabolic quantities extracted from a pool of five subjects are plotted as a function of time during 30 min of alert wakefulness (CMRO2: cerebral metabolic rate of O2; SaO2: arterial O2 saturation; SvO2: venous O2 saturation; CBF: total cerebral blood flow). Error bars represent standard errors. (b) Metabolic parameters measured in a subject (F, 36 years), self-reporting to be able to fall asleep (arrowheads). Note the large drop in CMRO2, rise in SvO2 along with drop in heart rate (HR). During the initial and final portions of the protocol, the subject was awake, with eyes open. Vertical black line indicates the awakening through vocal instructions. (c) Magnitude image showing the region encompassing the superior sagittal sinus (SSS, left). Colormaps of ΔΦSSS-ref, phase difference between SSS (triangle) and a reference region in the tissue (rectangle) and velocity maps plotted for different time points, in the subject of panel B. ΔΦSSS-ref is used to compute SvO2, expressed as %HbO2. CBF was obtained as the product of voxel velocity and SSS cross-sectional area and expressed in ml/min/100 g tissue. The respective SvO2 and CBF values are inserted in the image panels.
Statistical analysis
Statistical analysis was performed with SPSS Statistics v20 (Armonk, NY: IBM Corp.). Differences in the metabolic parameters between the two wakefulness periods (W1 and W2) and sleep (S) were evaluated with one-way ANOVA. Homoscedasticity was assessed via Levene’s test. Post hoc Bonferroni or Games-Howell tests were used, respectively, for homogeneous and heterogeneous variances. Associations between CMRO2 and slow-wave EEG spectral power density, and between CMRO2 and heart rate were evaluated via linear regression.
Results
Temporal stability of the rOxFlow method ex vivo and in vigilant test subjects
The rOxFlow acquisitions in the flow phantom yielded stable values for measured flow velocities, with a coefficient of variation (CV)
Whole-brain oxygen metabolism during wakefulness and sleep: Results from the feasibility study
The temporal evolution of the rOxFlow metrics during the wakefulness-sleep protocol is shown in Figure 2(b), for a representative subject acquired without EEG monitoring. The subject subsequently reported to have descended into sleep during the ‘eyes closed’ period (white region in the plot). Notice the steep decrease in CMRO2, which was reduced by 25%, relative to the pre-sleep wakefulness period (W1). This reduction was mainly driven by an increase of 7% in SvO2 with respect to W1 during the declared sleep period indicated in the graph. CBF did not change significantly; however, during sleep, fluctuations in this parameter were larger than in the awake state. Heart rate (HR) time evolution paralleled CMRO2 changes, decreasing by approximately 14% during sleep, compared to W1. Notice in Figure 2(c) the decrease in ΔΦ, corresponding to elevated SvO2, at time points t = 8–16 min, falling within the period of maximum CMRO2 reduction.
Among the six participants, four reported that they were able to sleep, while two did not. The major impediments to sleep initiation and maintenance were acoustic gradient noise (these subjects were provided with earplugs but not headphones with gray noise to mask pulse sequence noise), and some physical discomfort (the scanner table was not fitted with leg cushions at the time of the feasibility study). Despite failure of subjectively perceived sleep, in one of the participants, CMRO2 decreased by as much as 17%, during drowsiness (see Figure B.1 in Supp. Mat). In the group of six subjects participating in the feasibility study, among those who were able to sleep, average reduction in CMRO2 was 23.7 ± 7.5% (range 14–32.3%).
EEG correlated CMRO2 monitoring
Sleep onset and major impediments
Concurrent EEG+rOxFlow acquisition was performed in eight subjects (average age ± SD = 30.4 ± 6.7 years, age range 22–40 years). According to participant self-assessments and EEG data, four subjects (S01, S02, S07, S08) were able to sleep during the pre-determined period, while staying awake for the initial and final parts of the protocol (W1 and W2, respectively). As reported by the subjects who did not manage to sleep, the prevailing reasons preventing sleep onset were discomfort due to the constraint to stay still in the supine position (1 case), acoustic scanner noise (2 cases), skin irritation caused by the dielectric EEG gel (2 cases); psychological factors, such as perceived pressure to achieve the goal to fall asleep (2 cases), and mind wandering (2 cases).
CMRO2 reduction during and post-sleep
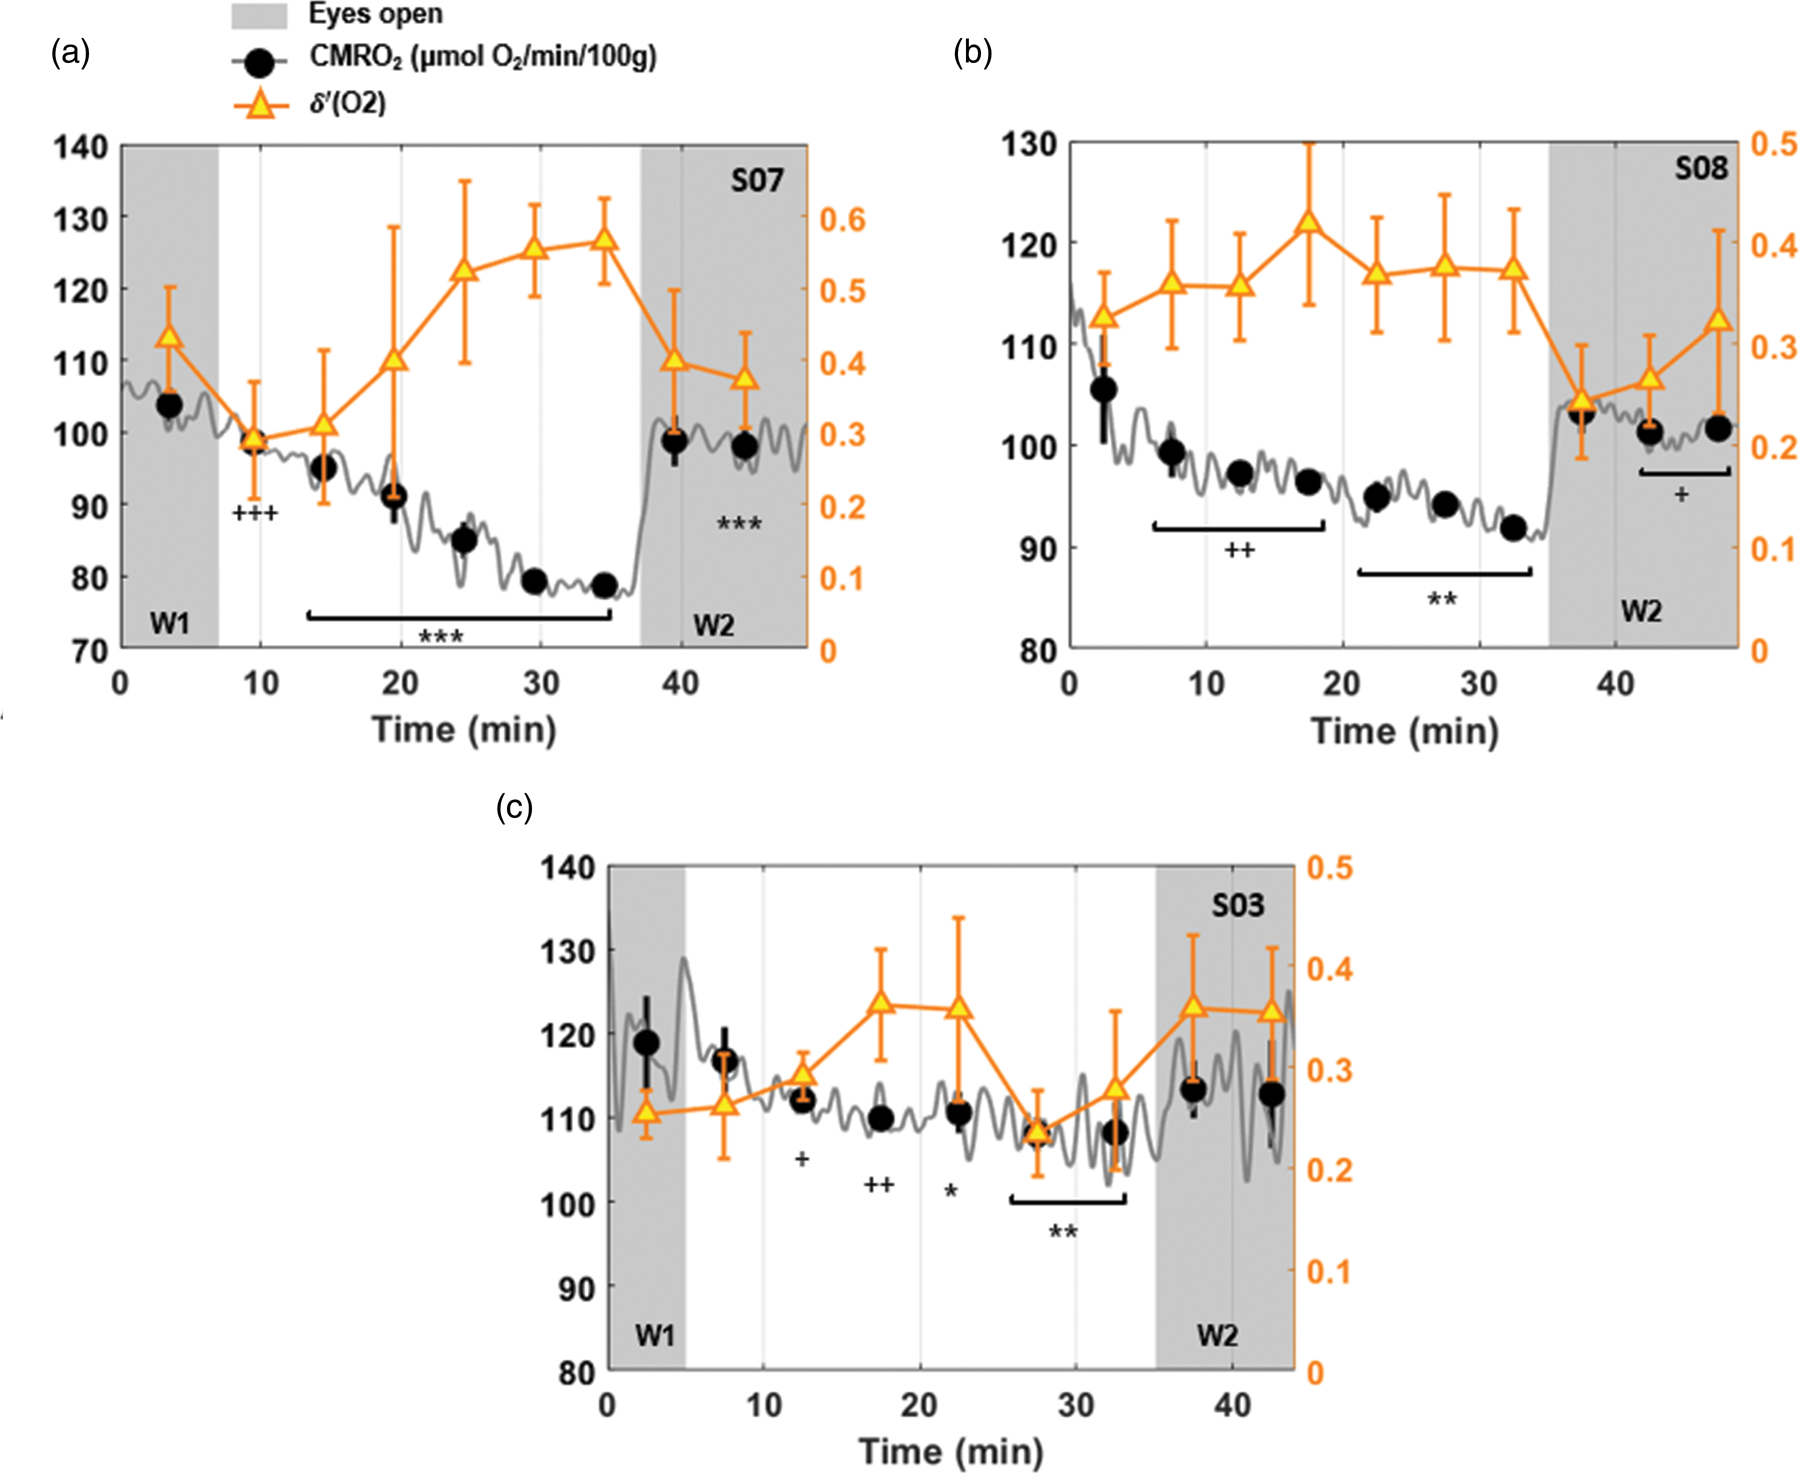
In the ‘successful’ cases (participants able to stay awake when needed, and to sleep anytime between W1 and W2), a gradual decrease in CMRO2 was noticed after the initial wakefulness period, W1 (Figure C.3 in Supp. Mat.). Considering temporal means over 5-min intervals, the average reduction in CMRO2 was 17.8% in these subjects, with a maximum decrease of 24% in the study group (Table 3). After the pre-determined sleep period, in accordance with the forced awakening via scanner interphone, there was a rapid, steep increase in CMRO2, which stabilized during the final wakefulness period (W2) around a value 8% below that of W1 (average over the sub-group of subjects able to sleep). Among the ‘unsuccessful’ attempts (participants were able to stay awake per protocol but failed to proceed to sleep during the predetermined sleep period), in three out of four subjects, CMRO2 was reduced by ca. 8% during the ‘eyes closed’ portion of the protocol but did not differ between W1 and W2. In one subject who did not manage to sleep (S06 F, 31 y), CMRO2 did not decrease during the ‘eyes closed’ period; instead, it was slightly elevated by 3%, and by 8% during W2 relative to W1. This participant reported that mind wandering first and frustration for not being able to fall asleep later prevented her to relax.
Cerebral metabolic rate of oxygen (CMRO2) during wakefulness and EEG-verified sleep.
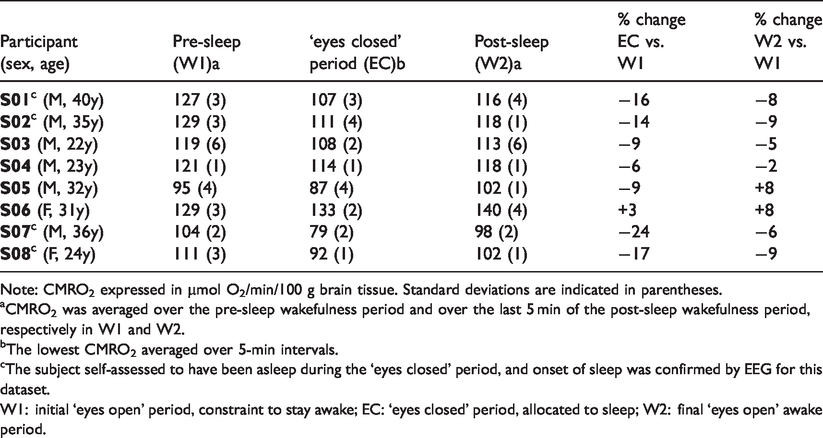
Note: CMRO2 expressed in µmol O2/min/100 g brain tissue. Standard deviations are indicated in parentheses.
aCMRO2 was averaged over the pre-sleep wakefulness period and over the last 5 min of the post-sleep wakefulness period, respectively in W1 and W2.
bThe lowest CMRO2 averaged over 5-min intervals.
cThe subject self-assessed to have been asleep during the ‘eyes closed’ period, and onset of sleep was confirmed by EEG for this dataset.
W1: initial ‘eyes open’ period, constraint to stay awake; EC: ‘eyes closed’ period, allocated to sleep; W2: final ‘eyes open’ awake period.
Association between CMRO2 and relative
-power during sleep
For the subjects able to sleep, the decrease in the metabolic rate of oxygen was significantly associated with increase in
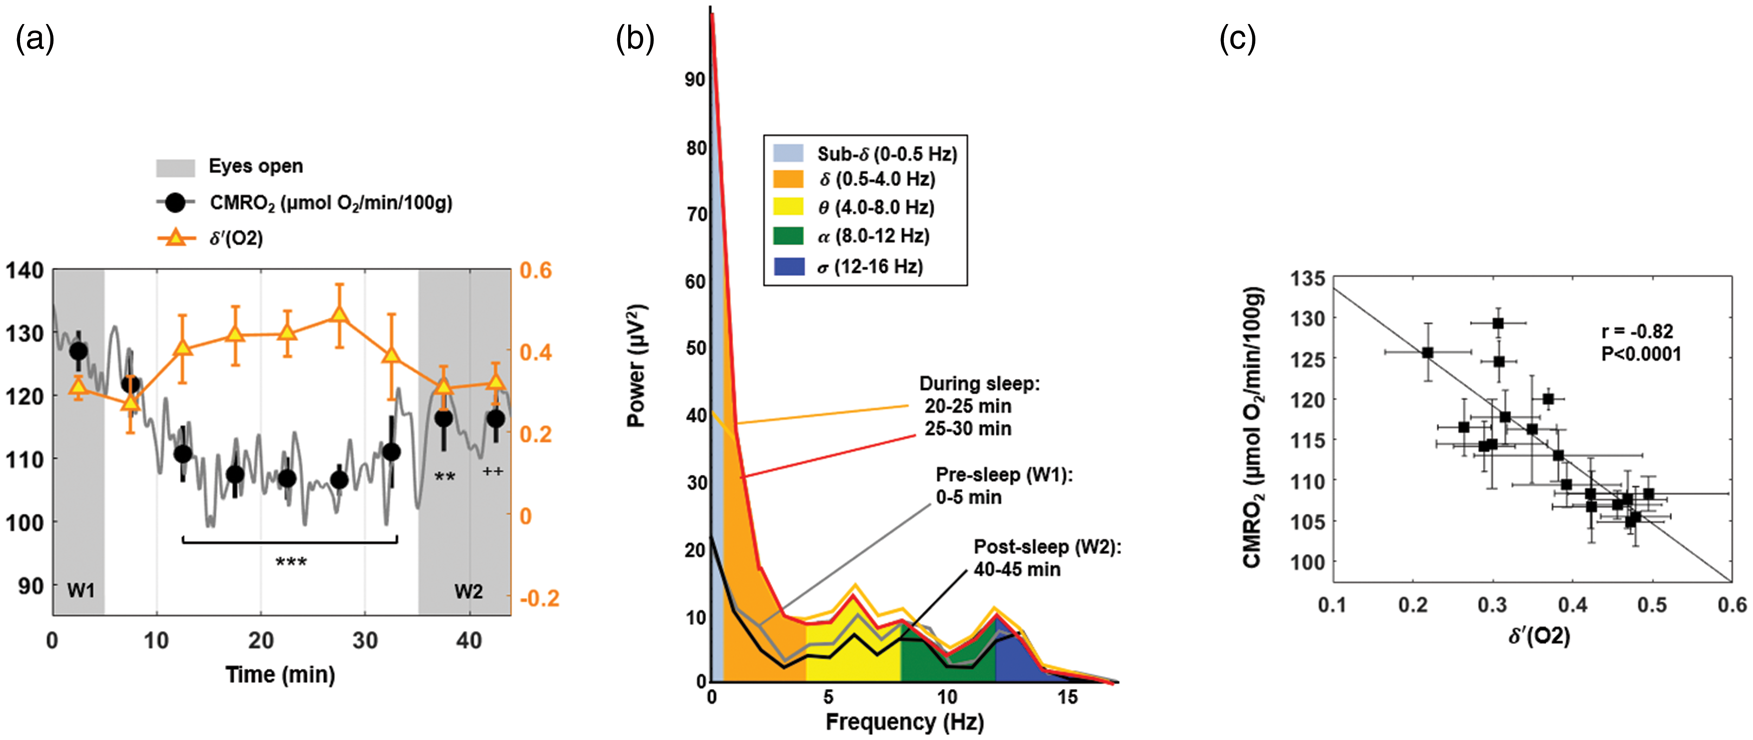
CMRO2 and temporal evolution of
Cerebral metabolic rate of oxygen and
Association between CMRO2 and heart rate
For subjects descending into sleep, CMRO2 changes during the time series were paralleled by changes in heart rate (HR) in that CMRO2 and HR were positively correlated with each other (P < 0.0005 for subjects S01, S02, S07, S08) with R2 ranging from 0.25 to 0.48 (see Table C.1 in Suppl. Mat.). The time point of minimum CMRO2 occurred simultaneously with lowest HR (reduced by about 10% in the sub-group of subjects able to sleep; see Table C.2 in Suppl. Mat.). In distinction, for subjects unable to sleep, CMRO2 was not associated with HR.
Discussion
In this pilot study, we used a new, non-invasive, high temporal resolution measurement of brain oxygen consumption to study dynamic changes in brain metabolism during wakefulness and sleep. Our major findings indicate a significant inverse relationship between CMRO2 and fractional delta power
The temporal stability of the radial OxFlow (rOxFlow) sequence was found to be excellent demonstrating the virtual absence of scanner hardware-induced fluctuations in signal phase and amplitude. Moreover, the derived hemodynamic and oximetric parameters (CMRO2, SvO2, CBF) were highly stable during a 30 min of wakefulness in five healthy subjects, with an average CV for CMRO2 around 6%.
CMRO2 at baseline (during period W1), averaged across the subjects participating in the EEG+MRI examinations (N = 8, mean age ± SD = 30 ± 7 years) was 116.9 ± 12 µmol O2/min/100 g, which was in good agreement with previous findings by Cao et al. 12 and Rodgers et al. 14 These two studies reported CMRO2 of 120.1 ± 19.6 µmol O2/min/100 g (10 subjects; age range 23–22 years) with rOxFlow at 1.5 T, and 125 ±11.4 µmol O2/min/100 g (10 subjects; mean age ±SD = 29 ± 4 years) using Cartesian OxFlow at 3.0 T, respectively.
Comparing the time-courses in the studies where the eyes open/closed modalities were used, in which collectively 12 different subjects went through two wake periods at the beginning and at the end of the protocol, and were at liberty to sleep in the central part, substantial physiological variability was noticed with respect to sleep initiation. In the case shown in Figure 2(b), after an initial 5-min latency period, CMRO2 was found to drop abruptly by 25%, whereas in other cases (e.g. those depicted in Figures 3(a) and 4(a), the subjects descended more gradually into sleep. A common finding in the subjects able to sleep was the rapid increase in CMRO2 following forced awakening (see also Figure 4(b) and (c)). This steep increase was paralleled by an increase in heart rate (Figures 2(b) and C.3 in Supp. Mat.). The difference in sleep initiation patterns from a metabolic point of view could be a function of the subjective psychological pressure at the time of scanning. The rather sudden CMRO2 rise upon awakening could be due to acoustic stimuli coupled with execution of a task, that is squeezing the scanner’s squeeze-ball to provide proof of awakening.
Among the subjects unable to sleep, drowsiness or the result of mere relaxation in supine position presumably led to gradual small reduction in CMRO2 (averaging 8% in the subject group undergoing EEG+MRI). In distinction, in the ‘successful’ cases, CMRO2 fell, on average, by 17.8%, which is consistent with the extent of decreased brain oxygen metabolism of ∼17% found by Boyle et al. 10 These authors found no association between sleep stage (established with EEG) and metabolic rate; rather, the observed reduction was linked to sleep duration. However, even though in Boyle et al. 10 subjects were under observation throughout the night, the metabolic measurements occurred in intervals of 2 h only. In distinction, besides being completely noninvasive, a major strength of our approach is the capability to monitor hemodynamic and metabolic parameters every 3.4 s throughout the sleep/wake protocol. The extent of sleep-related CMRO2 reduction we found is intermediate between the values reported by Madsen et al.,8,9 who found average CMRO2 to be lowered by 25% during deep sleep (stage N3), but only by 5% during light sleep (stages N1 and N2).
The occurrence of sleep has previously been found to be paralleled by a reduction in systemic (whole-body) as well as brain glucose utilization 10 and oxygen metabolism, expressed by VO2. 26 Diminished cerebral oxygen metabolism, manifested by a drop in CMRO2, has been linked to a reduction in mental activity and a downregulation of synaptic transmissions.2,10,27 The reduction in metabolic demand during sleep is regulated by either reduced CBF or oxygen extraction, or both (see Figure C.5 in Suppl. Mat.). Evidence for reduced CBF during non-REM sleep and in post-sleep with respect to pre-sleep wakefulness was provided in a study using PET in 37 healthy male volunteers, 28 who were examined after mild to severe sleep deprivation (24–54 h), and in a more recent study, using simultaneous EEG/fMRI-arterial spin labeling in 19 participants partially sleep deprived. 29 We also noticed that CBF during W2 was on average 8% lower relative to W1, regardless of occurrence of sleep; moreover, CBF gradually decreased during the entire protocol; however, the CBF nadir, or the minimum average considering 5-min time windows, was shifted forward with respect to the CMRO2 nadir in case of sleep onset (data not shown). Furthermore, we observed that during EEG-corroborated sleep periods, CBF displayed noise-like quasi-periodic excursions not present during the pre and post-sleep wake period (see, for instance Figure C.3(a) and (b) in Suppl. Mat.). These CBF changes could be modulated by altered ventilation and breathing patterns during sleep and the consequent variation in CO2 levels. Another possible explanation would link these spontaneous rhythmic oscillations in venous CBF to oscillations in cerebrospinal fluid, recently shown to occur during slow-wave sleep, attributed to a mechanism of metabolic waste clearance. 30
Together with reduced CMRO2, we found that in the cases where sleep occurred during the ‘eyes closed’ period, the heart rate decreased by typically 6 bpm relative to W1 (corresponding to an average reduction of 10%, range 7–14%; see also Table C.2 in Suppl. Mat.). The decrease in heart rate during non-REM sleep is well known,31,32 and has generally been attributed to increased parasympathetic modulation. 33 We investigated the correlation between CMRO2 and heart rate variations during the entire protocol: a highly significant positive relation was found (r = 0.5–0.7, P < 0.0005) for the subjects able to sleep.
The integration of EEG into the rOxFlow pulse sequence for high-speed brain oximetry enabled quantification of metabolic changes during wakefulness and sleep. While fMRI with concurrent EEG monitoring had previously been achieved with filters designed to mitigate gradient noise interference for standard EPI sequences for fMRI studies, no such filters existed for concurrent EEG and OxFlow. We achieved effective filtering of gradient and cardio-ballistic artifacts to allow derivation of EEG power spectra during the rOxFlow acquisition, with no evidence of essential EEG information loss. In fact, we were able to demonstrate an inverse relationship between slow-wave (
The present pilot study has limitations. In the portion involving concurrent EEG monitoring, 50% of the subjects did not manage to initiate sleep during the allocated period. Although abstaining from caffeine was required, and the experimental setup was conceived in a way to maximize subject’s comfort, we did not encourage active sleep deprivation, nor did we use any sleep-inducing drugs, which would have enhanced the success rate (but could have altered cerebral oxygen metabolism). However, there were other practical issues rendering in-scanner sleep difficult to achieve. Chief among the physical factors was acoustic gradient noise, next to the discomfort caused by the space constraints within the scanner bore, the difficulty to lie still in supine position, and occasional acute irritation of the scalp caused by the dielectric gel used for EEG cap placement. Among the psychological factors, there was the distress caused by the perception of being observed and the compulsion to achieve the goal of falling asleep.
Although some of the above issues are difficult to mitigate, strategies to reduce acoustic scanner noise do exist. 37 Mental distress could be mitigated by conditioning the subject in an environment mimicking the scanner, including simulated noise while wearing the EEG cap attempting to sleep in supine position, or by referring the subject that the goal of the study is to scan during quiet wakefulness (relaxation in eyes closed), avoiding to put pressure on the ‘task’ of falling asleep.
Finally, in our protocol, the maximum duration of continued scanning with concurrent EEG was 55 min. Given a typical latency on the order of 10–20 min 38 , this reduces the potential sleep period to 20–25 min, clearly considerably below a full sleep cycle, lasting 80–120 min. 39 The current state of the art for concurrent acquisition of EEG activity and MRI (via rOxFlow MRI), and the denoising technique used to remove radiofrequency and gradient-induced noise contaminating the EEG signal, does not allow distinction of different sleep stages (nor was this an objective of the present study). Of essence, however, is that the power spectral analysis used enables quantification of the contribution of slow-wave activity to the EEG spectrum.
It is estimated that about 50 to 70 million Americans suffer from sleep disorders 40 ), with approximately 35% of them sleeping less than 7 h. 41 Poor and fractured sleep (due for example to insomnia, obstructive sleep apnea, restless legs syndrome, REM-apnea) or insufficient sleep, play a major role in the etiology of cancer, metabolic and cardiovascular disease, 3 generally increase the risk of chronic health conditions, 42 and overall adversely impact the quality of life. Further, insufficient sleep elevates the risk of automobile and occupational accidents, 43 and results in poor work performance. Importantly, oxidative injury may result from lack of sleep due to the sustained high metabolic rate of the awake brain. 44 In fact, recent evidence suggests that increased amyloid and tau deposition in Alzheimer’s disease are associated with reductions in slow-wave sleep.45,46 Gaining a better sense of how the brain metabolic changes relate to sleep onset and maintenance is crucial for estimating the clinical implications of sleep disorders. The ability of doing so noninvasively using MRI-correlated EEG provides a safe and cost-effective approach for future research in this topic area.
Conclusions
This pilot study demonstrates the feasibility of noninvasively quantifying changes in brain oxygen metabolism that occur with the transition from wakefulness to slow-wave sleep by means of quantitative MRI conducted with concurrent EEG monitoring.
Supplemental Material
sj-pdf-1-jcb-10.1177_0271678X20919287 - Supplemental material for Cerebral metabolic rate of oxygen during transition from wakefulness to sleep measured with high temporal resolution OxFlow MRI with concurrent EEG
Supplemental material, sj-pdf-1-jcb-10.1177_0271678X20919287 for Cerebral metabolic rate of oxygen during transition from wakefulness to sleep measured with high temporal resolution OxFlow MRI with concurrent EEG by Alessandra Caporale, Hyunyeol Lee, Hui Lei, Hengyi Rao, Michael C Langham, John A Detre, Pei-Hsin Wu and Felix W Wehrli in Journal of Cerebral Blood Flow & Metabolism
Footnotes
Funding
The author(s) disclosed receipt of the following financial support for the research, authorship, and/or publication of this article: research reported in the publication was supported by the National Institute of Health (R01 HL122754, R01 HL139358) and by the National Center for Advancing Translational Sciences of the National Institutes of Health under award number UL1TR001878.
Acknowledgements
The authors wish to acknowledge Dr. Richard Schwab, Penn Sleep Center, for helpful discussions, and Erin Englund, Ana Rodriguez-Soto and Andrew Wiemken for their assistance with the experiments.
Declaration of conflicting interests
The author(s) declared no potential conflicts of interest with respect to the research, authorship, and/or publication of this article.
Authors’ contributions
A Caporale and H Lee conducted the MRI procedures, optimized processing of the images and analyzed the data. H Lei and H Rao designed and implemented the concurrent EEG protocol, including gradient filter design, and data processing. A Caporale drafted the manuscript. PH Wu optimized part of the MRI data analysis pipeline. FW Wehrli conceived the overall study. He also reviewed and edited the manuscript, along with, MC Langham, JA Detre. All authors read and approved the final version of the manuscript.
Supplemental material
Supplemental material for this article is available online.
References
Supplementary Material
Please find the following supplemental material available below.
For Open Access articles published under a Creative Commons License, all supplemental material carries the same license as the article it is associated with.
For non-Open Access articles published, all supplemental material carries a non-exclusive license, and permission requests for re-use of supplemental material or any part of supplemental material shall be sent directly to the copyright owner as specified in the copyright notice associated with the article.