
Abstract
Global and regional changes in cerebral blood flow (CBF) can result in biased quantitative estimates of amyloid load by PET imaging. Therefore, the current simulation study assessed effects of these changes on amyloid quantification using a reference tissue approach for [18F]flutemetamol and [18F]florbetaben. Previously validated pharmacokinetic rate constants were used to simulate time-activity curves (TACs) corresponding to full dynamic and dual-time-window acquisition protocols. CBF changes were simulated by varying the tracer delivery (K1) from +25 to −25%. The standardized uptake value ratio (SUVr) was computed and TACs were fitted using reference Logan (RLogan) and the simplified reference tissue model (SRTM) to obtain the relative delivery rate (R1) and volume of distribution ratio (DVR). RLogan was least affected by CBF changes (χ2 = 583 p < 0.001, χ2 = 81 p < 0.001, for [18F]flutemetamol and [18F]florbetaben, respectively) and the extent of CBF sensitivity generally increased for higher levels of amyloid. Further, SRTM-derived R1 changes correlated well with simulated CBF changes (R2 > 0.95) and SUVr’s sensitivity to CBF changes improved for later uptake-times, with the exception of [18F]flutemetamol cortical changes. In conclusion, RLogan is the preferred method for amyloid quantification of [18F]flutemetamol and [18F]florbetaben studies and SRTM could be additionally used for obtaining a CBF proxy.
Introduction
Amyloid-beta accumulation (Aβ) in the brain is one of the hallmarks of Alzheimer’s disease (AD). It can be visualised and quantified using positron emission tomography (PET) and both static or dynamic scanning protocols can be used.1,2 The static protocol has the advantage of a short scan duration together with relatively simple processing and analytical steps, while the dynamic protocol provides higher accuracy at the cost of a much longer scan, more complex processing and advanced kinetic analysis. The semi-quantitative parameter obtained from a static scan, the standardized uptake value ratio (SUVr), depends on post-injection starting time and duration of the acquisition, and may be affected by changes in cerebral blood flow (CBF) as demonstrated for [11C]PiB.3–6 In contrast, the non-displaceable binding potential (BPND), derived from a dynamic PET scan, is less sensitive to noise, more robust against CBF changes, and for [11C]PiB it has been shown to be the parameter of choice when measuring longitudinal changes in amyloid burden.5,6 This characteristic may be especially important in situations where changes in CBF can occur, such as when measuring disease progression or treatment response in clinical trials. As a compromise between the protocols mentioned above, dynamic data acquisitions from a dual-time-window protocol have gained attention, in which data are acquired separately for early and late phases of tracer uptake to reduce overall scanning time, maintain high quantitative accuracy and provide tracer delivery information.7,8
Cerebral blood flow declines with age and differs per brain region. 9 Compared with young adults (25 years), elderly (late 70s) can present with up to 25% CBF reductions, with an average annual CBF decline in grey matter of approximately 0.5%.9,10 On top of this global decline, day-to-day whole brain CBF fluctuations of around 30% have been reported in test–retest studies; however, this percentage was assumed to consist of both physiological as well as measurement error. 11 Furthermore, drugs may also exert an effect on CBF,12,13 thus potentially compromising the measurement of amyloid changes associated to pharmacological interventions. In the context of AD, additional relative CBF changes may be present, as focal reductions in CBF have been observed in several brain regions.14–16 A study on non-demented older adults scanned with [11C]PiB showed that subjects with elevated [11C]PiB signals experienced greater relative CBF variations, mainly in those regions showing increased amyloid deposition. 17 Given that CBF differs per region, declines with age, and that additional regional CBF changes occur during the course of Alzheimer’s disease, it is important to assess whether and, if so, to which extent these changes affect quantification of amyloid load. Furthermore, the additional effects of acquisition start-time and duration on quantitative accuracy need to be understood, due to its relevance in clinical and research practice. 3
The effect of CBF changes on amyloid load quantification has been assessed previously for [11C]PiB, [18F]florbetaben and semi-quantitative measures of [18F]florbetapir.5,7,18 These studies showed that large cortical CBF reductions resulted in a maximum change of ±10% in SUVr. For large global CBF reductions, a larger bias was observed for [11C]PIB as compared with [18F]florbetaben and [18F]florbetapir.5,7,18 These between tracer differences are to be expected due to differences in tracer kinetics and corresponding equilibrium times. However, the effect of CBF changes on quantification of [18F]flutemetamol scans remains unknown, just as the potential effects of such changes on novel dual-time-window protocols. Therefore, the present simulation study aimed to assess the effects of regional (i.e. target and reference tissues) and global CBF changes on quantitative amyloid measures derived from static, dynamic and dual-time window scanning protocols using reference tissue approaches, 8 thereby focusing on [18F]flutemetamol and [18F]florbetaben, the two tracers used within the AMYPAD consortium. A second aim was to assess whether the relative delivery rate (R1) of both ligands could be used to accurately monitor changes in CBF.16,19
Materials and methods
Subjects and PET data
Previously reported clinical PET data from 6 [18F]flutemetamol and 20 [18F]florbetaben subjects (both control and AD subjects), consisting of regional time-activity curves (TACs) and whole blood and/or plasma input curves, were used for this simulation study.20,21 All participants provided written informed consent in accordance with the Declaration of Helsinki. The Ethical Committee of the University Hospitals Leuven approved the study protocol for the [18F]flutemetamol study (EudraCT 2007-000784-19, Registered 8 February 2007). For [18F]florbetaben, the local Institutional Review Board of University of Leipzig, the National Radiation Safety Committee, and the German Federal Institute for Drugs and Medical Devices approved the study protocol (EudraCT 2006-003882-15, Registered 2006). The first group received a bolus injection (<40 s) of 181 ± 5 MBq [18F]flutemetamol and were scanned on a Siemens HiRez Biograph 16 PET/CT scanner.3,20 The second group received an injection of 300 ± 60 MBq [18F]florbetaben (over 90 s) and were scanned on a ECAT HR+ Siemens/CTI scanner. 21 As described previously, whole blood curves and metabolite-corrected plasma input curves were available for [18F]flutemetamol, and metabolite-corrected plasma input curves and discrete whole blood samples for [18F]florbetaben. 8 Subsequently, regional TACs were fitted using the reversible two-tissue compartment model (four rate constants) with additional blood volume fraction parameter (2T4k_Vb) to obtain pharmacokinetic rate constants for the target (composite cortical region consisting of anterior and posterior cingulate, frontal, parietal, and lateral and medialtemporal cortex) and reference tissue (grey matter cerebellum). 8
TAC simulations
Based on the pharmacokinetic rate constants estimated from the clinical data mentioned above, realistic target and reference tissue TACs of 130 min duration were simulated using the 2T4k_Vb model (see Figure 1 and Table 1 for the rate constants). 8 Target tissue TACs were simulated for a clinically observed range of BPND values (captured by five simulated BPND values, Figure 1), and noise (0, 1 and 2%) corresponding to regions of interest (ROI) of various sizes was added to the target tissue TACs. 22 This resulted in a total of 50 TACs per noise level (identical TACs in case of 0% noise) and for each simulated BPND (see Figure 1 for a flowchart of the method). No noise was added to reference tissue TACs due to its relatively large volume.
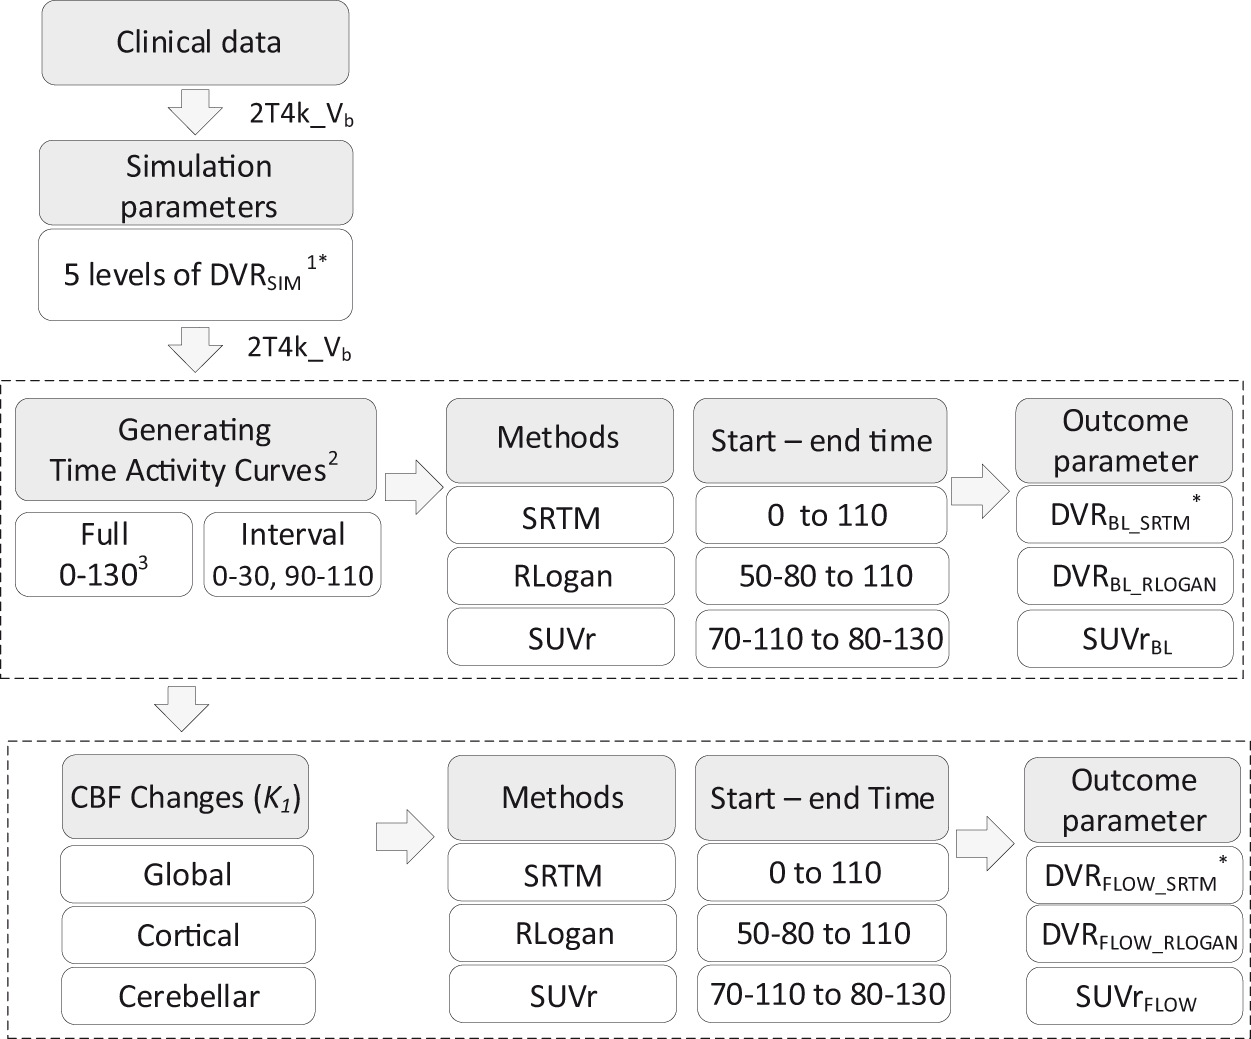
Schematic overview of the applied methods. 1. [18F]flutemetamol DVRSIM (simulated volume of distribution ratio) ranged from 1.022 to 1.778, [18F]florbetaben DVRSIM ranged from 1.026 to 2.051. 2. All steps were repeated for 1 and 2% noise. 3. All values are minutes post injection (p.i.). *Here DVR refers to BPND+1. Abbreviations: Vb: blood volume; BL: baseline (no cerebral blood flow change); SRTM: simplified reference tissue model; RLOGAN: reference Logan, SUVr: standardised uptake value ratio; FLOW: with changes in cerebral blood flow.
Rate constants used for CBF simulations.
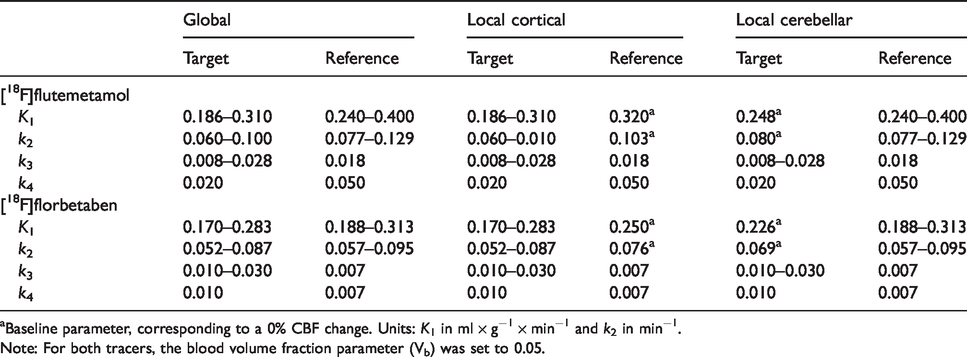
aBaseline parameter, corresponding to a 0% CBF change. Units: K1 in ml × g−1 × min−1 and k2 in min−1.
Note: For both tracers, the blood volume fraction parameter (Vb) was set to 0.05.
Simulating CBF changes
Given that the rate constant for tracer delivery (K1) can be considered a proxy for blood flow as long as the extraction remains constant (
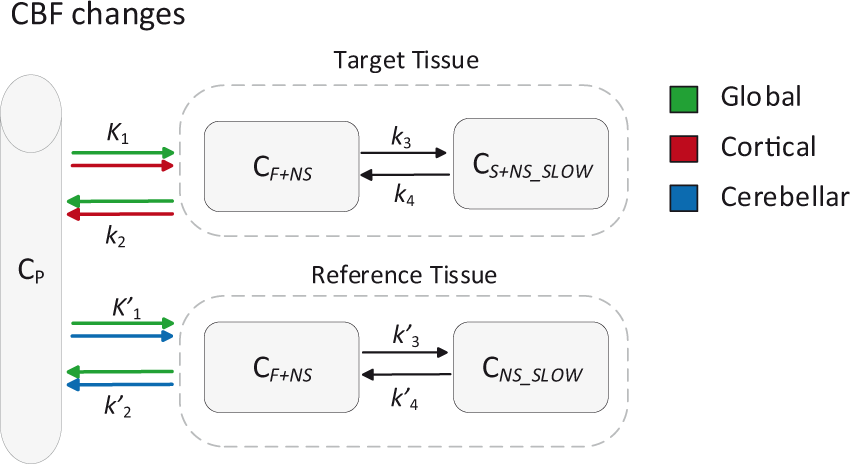
Schematic overview of the simulated CBF changes. C P : tracer plasma radioactivity concentration, C F+NS : free and non-specifically bound concentration in tissue, C S+NS_SLOW : specifically bound and slow non-specifically bound concentration in tissue, all units Bq*ml−1. Units of the rate constants: K1 in ml × g−1 × min−1 and k2, k3, k4 in min−1.
Global CBF changes: equal variations in K1 and k2 for target and reference tissues.
Cortical CBF changes: variations in K1 and k2 only for the target tissue, reference tissue parameters were kept constant.
Cerebellar CBF changes: variations in K1 and k2 only for the reference tissue, target tissue parameters were kept constant.
Dual-time-window TACs
In addition to the full 130 min TACs, dual-time-window TACs (here called ‘interval TACs’) were created by removing data points from target and reference tissue TACs according to the dual-time-window protocol. 8 In short, the first 110 min were used (corresponding to a dynamic scanning protocol) and data points between the early (0–30 min post injection (p.i.)) and late acquisition phase (90–110 min p.i.) were deleted.
Estimating parameters of interest
SUVr was calculated from the 130 min full TACs, for starting times (t*) ranging from 70 to 110 min p.i. (interval t*: 3× 5 min, 4 × 2.5 min, 3 × 5min), and durations of 10, 15 and 20 min. Next, 110 min of the full TACs (corresponding to a dynamic scanning protocol) and interval TACs were fitted using reference Logan (RLogan) to estimate the volume of distribution ratio (DVR). 24 The implementation of this model did not require fixing k2ʹ (as per equation (7)). 24 The linearization start times (t*) evaluated ranged from 50 to 80 min p.i. (in steps of 10 min) and interpolation of interval target tissue TACs was performed using cubic interpolation, as the method is routinely used for parametric imaging. Finally, 110 min of the full TACs and the interval TACs were fitted using the simplified reference tissue model (SRTM) to estimate R1, k2 and BPND. 25 Given that SRTM requires a continuous input to fit the target tissue TACs, missing data points of the reference tissue interval TACs were interpolated using the 2T4k_Vb model together with a typical, tracer specific input function as validated previously. 8 In addition, for both tracers, boundary values (optimized for full, noiseless TACs) were set for all kinetic parameters to prevent physiologically implausible results (Supplementary Figure 1). Optimal boundaries were defined based on the simulated parameter range and lower boundaries were fine-tuned (based on parameter histograms) in case of k2. This procedure selected the boundary value that resulted in least bias (calculated from the simulated BPND+1) across CBF scenarios and amyloid binding levels
Statistical analysis
For all analyses (i.e. all amyloid levels, starting times, durations, scanning protocols and for TACs both with and without noise), parameter estimates obtained in the absence of CBF variations were used as baseline parameters (SUVr_BL, R1_BL, DVRBL_SRTM and DVRBL_RLOGAN, Table 1). Next, percentage change as a result of CBF variations was calculated relative to each baseline for 
Non-parametric Kruskal–Wallis tests were used to assess differences in sensitivity to CBF variations between methods and simulated BPND values.
26
In addition, the maximum percentage change due to CBF variations was compared between methods and for the whole spectrum of simulated BPND values. Furthermore, to assess the relationship between
Results
Evaluation of outcome parameter(s)
The resulting boundary values for [18F]flutemetamol were: R1: lower boundary (LB) = 1e-6 upper boundary (UB) = 2.00, k2: LB = 0.018 UB = 2.00, BPND: LB = −0.50 UB = 5.00. For [18F]florbetaben, boundary values were: R1: LB = 1e-6 UB = 2.00, k2: LB = 0.028 UB = 2.00, BPND: LB = −0.50 UB = 5.00.
Sensitivity to CBF changes – Comparison between methods
[18F]flutemetamol
Overall,
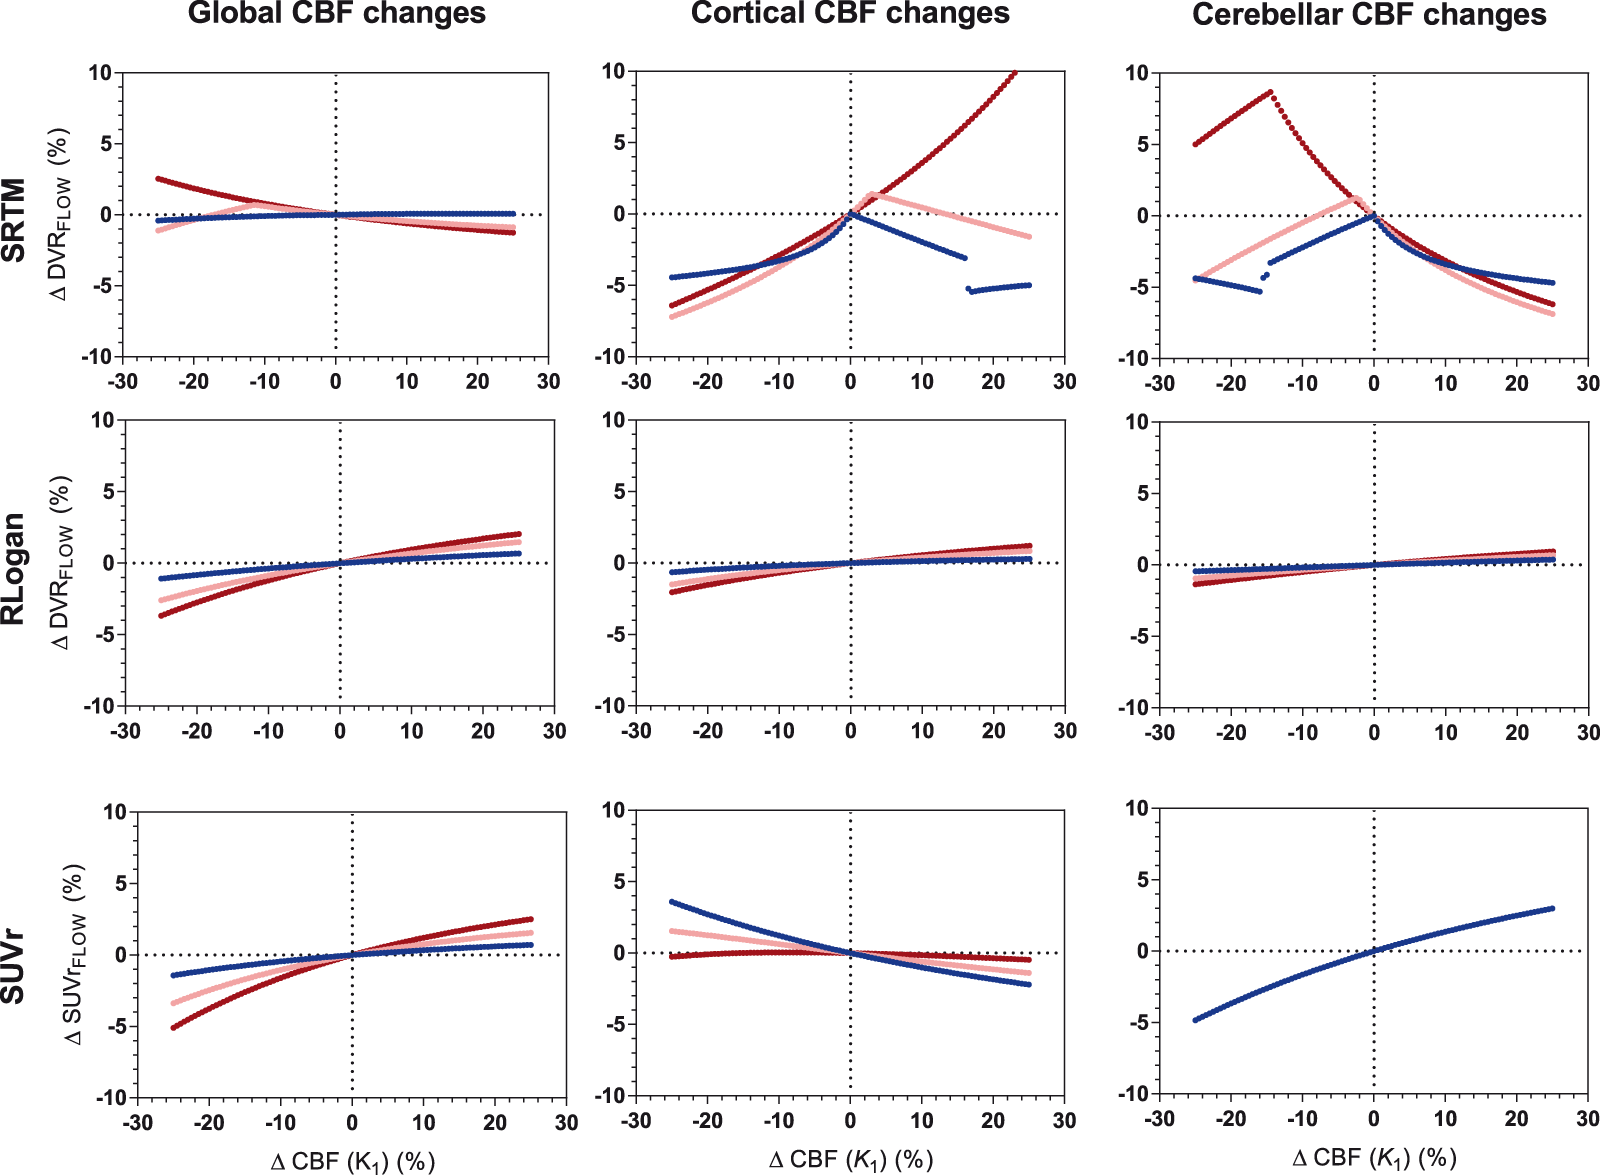
[18F]flutemetamol: sensitivity to CBF changes across methods for three levels of amyloid load. Low amyloid (blue): DVR = 1.022, intermediate amyloid (pink): DVR = 1.400, high amyloid (red): DVR = 1.778. Four values (between 10 and 10.6%) for SRTM cortical CBF changes high amyloid are not shown. RLogan linearization time was 50–110 min p.i., SUVr uptake time was 90–110 min p.i.
[18F]florbetaben
Overall,
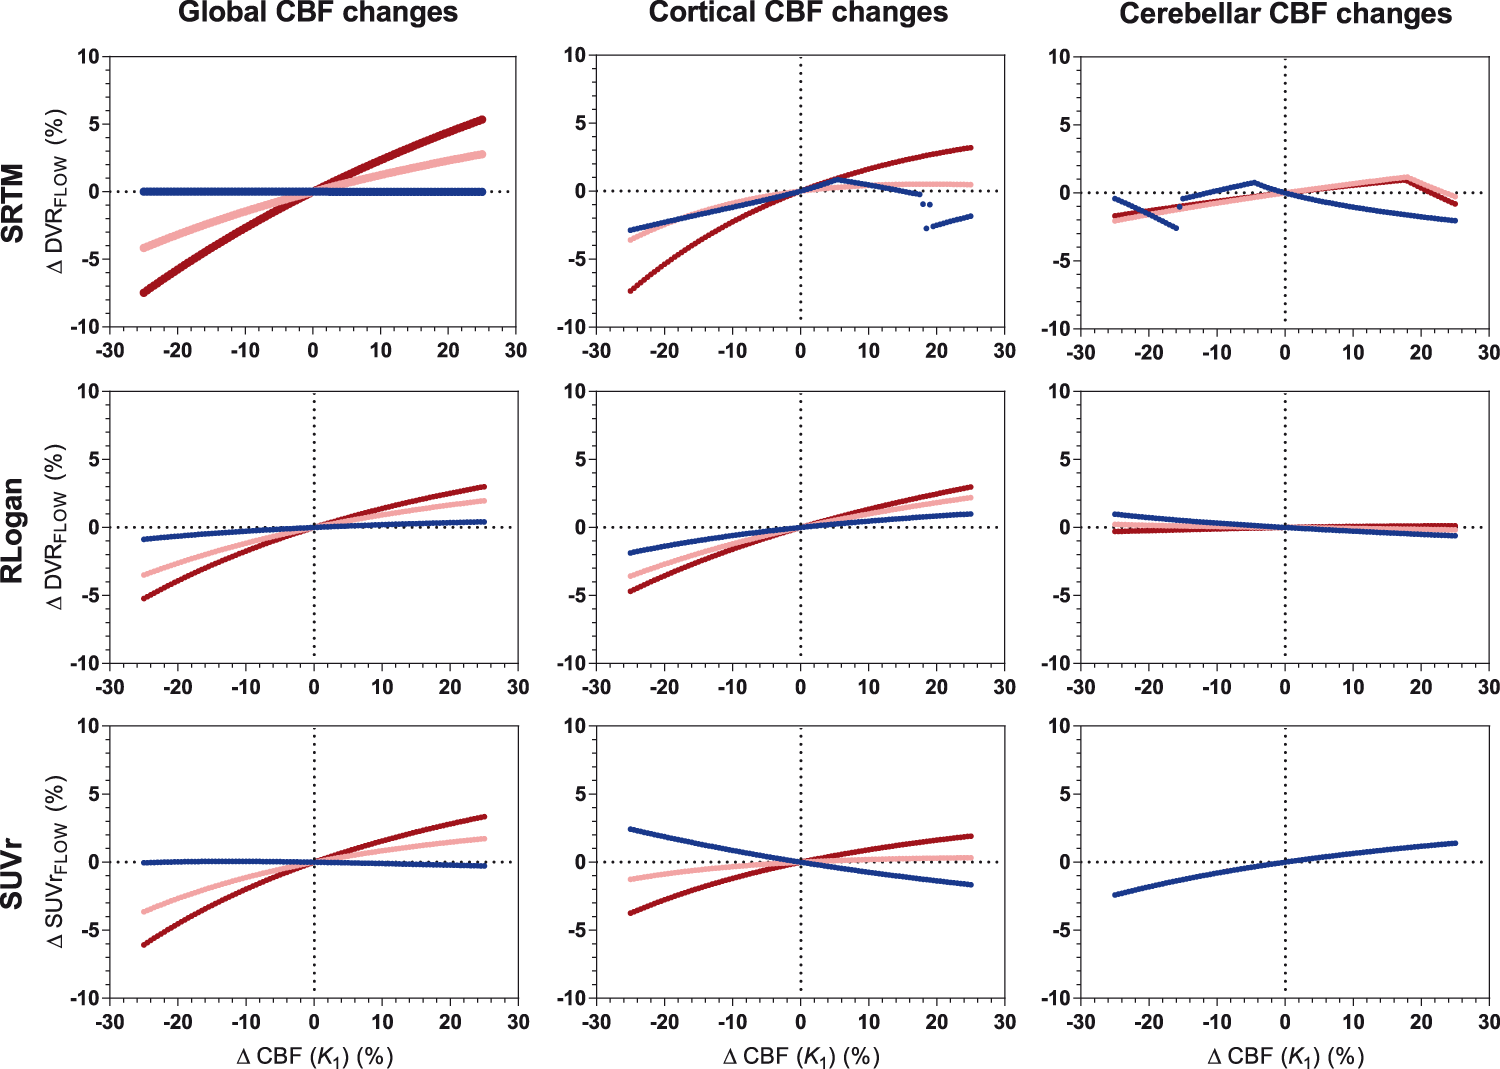
[18F]florbetaben: sensitivity to CBF changes across methods for three levels of amyloid load. Low amyloid (blue): DVR = 1.026, intermediate amyloid (pink): DVR = 1.538, high amyloid (red): DVR = 2.051. RLogan linearization time was 50–110 min p.i., SUVr uptake time was 90–110 min p.i.
Relative delivery and CBF changes
For [18F]flutemetamol, correlations between simulated ΔCBF and ΔR1_FLOW were high for all amyloid levels both for cortical (R2 = 0.98 to 1.00, p < 0.001) as well as cerebellar CBF changes (R2 = 0.97 to 1.00, p < 0.001). For [18F]florbetaben, high correlations were also observed between simulated ΔCBF and ΔR1_FLOW across amyloid levels both for cortical (R2 = 0.98 to 0.99, p < 0.001) and cerebellar CBF changes (R2 = 0.95 to 0.99, p < 0.001). Very similar results were obtained for R1 estimates derived from interval TACs (data not shown).
Sensitivity to CBF changes – Full versus interval TACs
For [18F]florbetaben, full TACs were found to be less sensitive to CBF changes than interval TACs (p < 0.001), while for [18F]flutemetamol, the opposite effect was found (p < 0.001). Post hoc tests revealed that for [18F]florbetaben this effect was present for both models, while for [18F]flutemetamol the effect was only present for SRTM. Furthermore, for both tracers, most outliers were present for interval compared to full TACs (outliers interval TACs: [18F]flutemetamol: 91.67%, [18F]florbetaben: 66.67%). These outliers were only observed for TACs fitted with SRTM, predominantly corresponding to low simulated amyloid levels (Figure 5). For [18F]florbetaben, interval TAC-derived
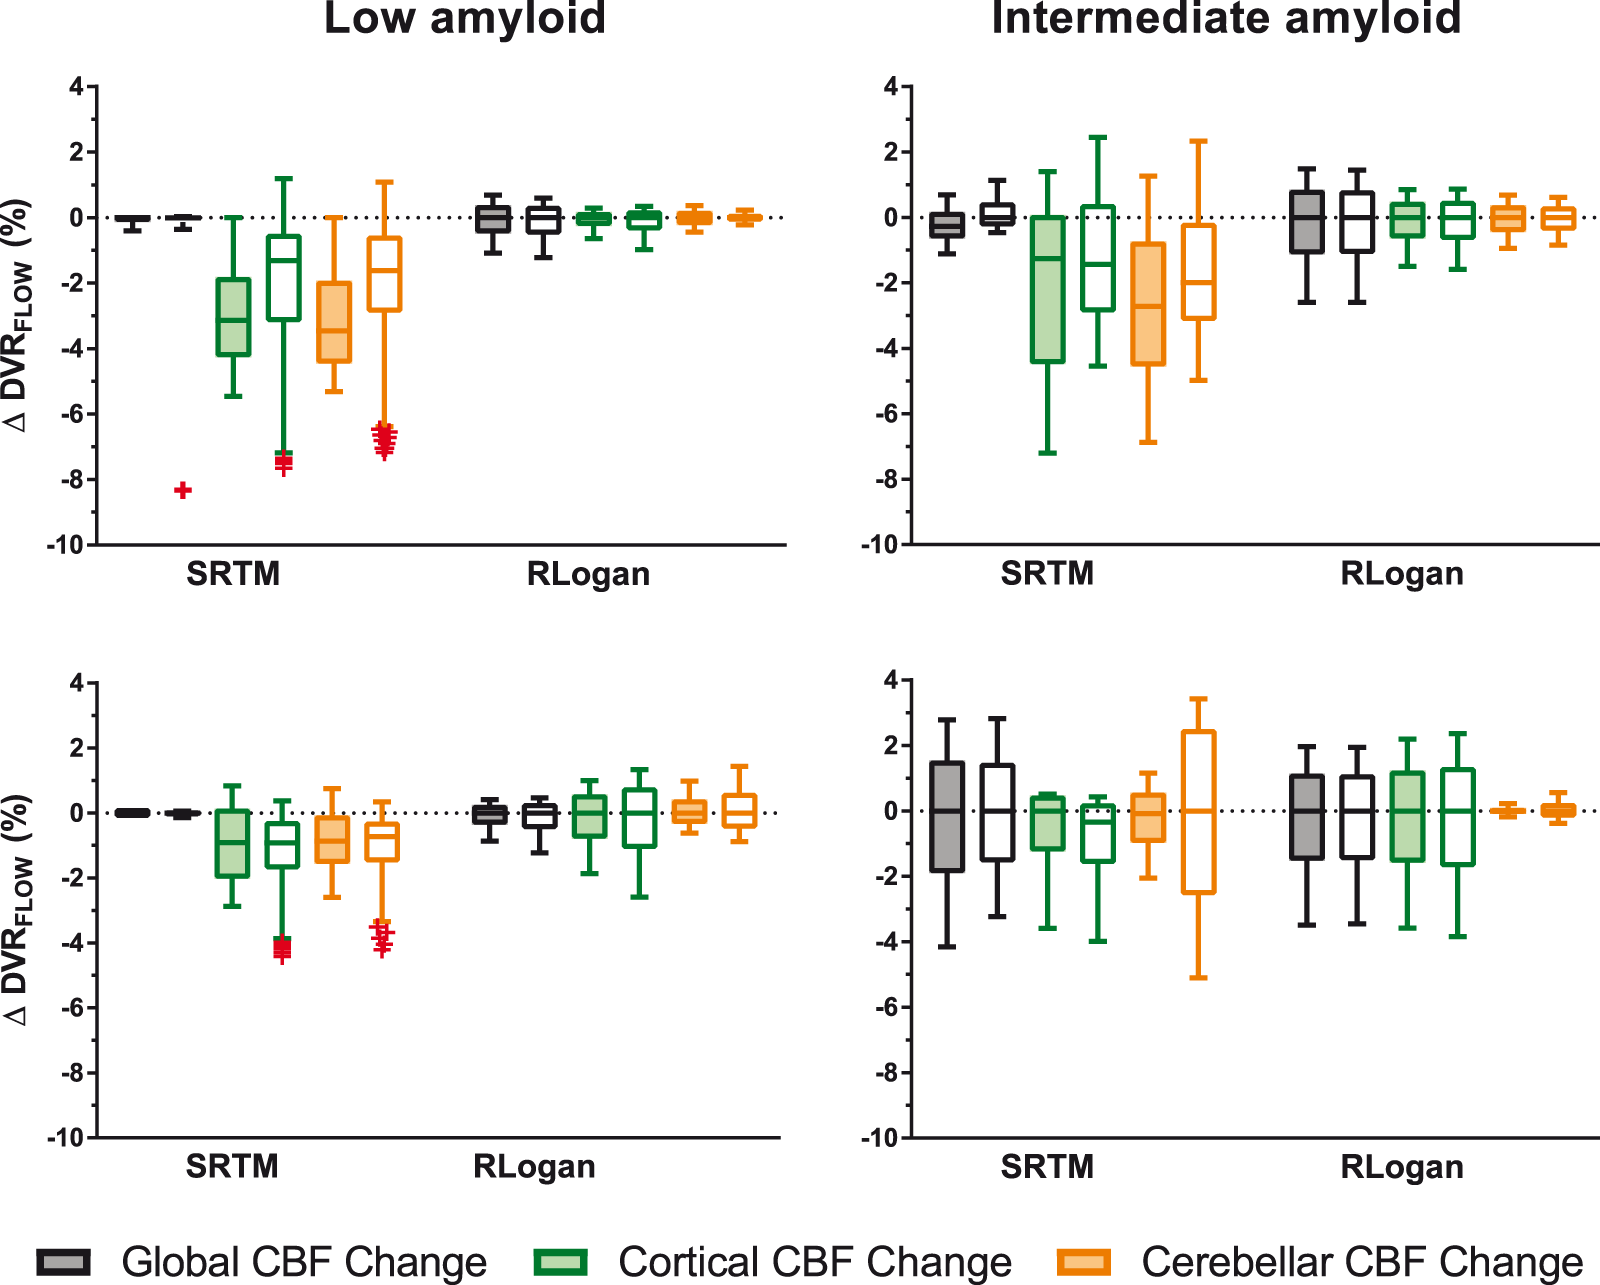
Comparison of full and interval TACs and their sensitivity to CBF changes. Coloured boxes represent full- and uncoloured boxes interval TACs. Upper row [18F]flutemetamol, bottom row [18F]florbetaben. Note: whiskers were defined according to the Tukey method and outliers are depicted as red crosses.
Sensitivity to CBF changes – The effect of noise
Overall, effects of noise on the sensitivity of the different methods to CBF changes were minimal for full TACs (maximum difference: 1 percentage point (p.p.)), see Supplementary Figure 2). Furthermore, for interval TACs, more outliers and a larger sensitivity were observed at higher compared to lower noise levels.
Sensitivity to CBF changes – Acquisition start time and duration
Overall, later uptake times showed a decreased sensitivity to CBF changes for both tracers ([18F]flutemetamol: χ2 = 54, p < 0.001, [18F]florbetaben: χ2 = 127, p < 0.001). Post hoc tests revealed the effect was not present for [18F]flutemetamol cortical changes. Furthermore, CBF increases resulted in a higher
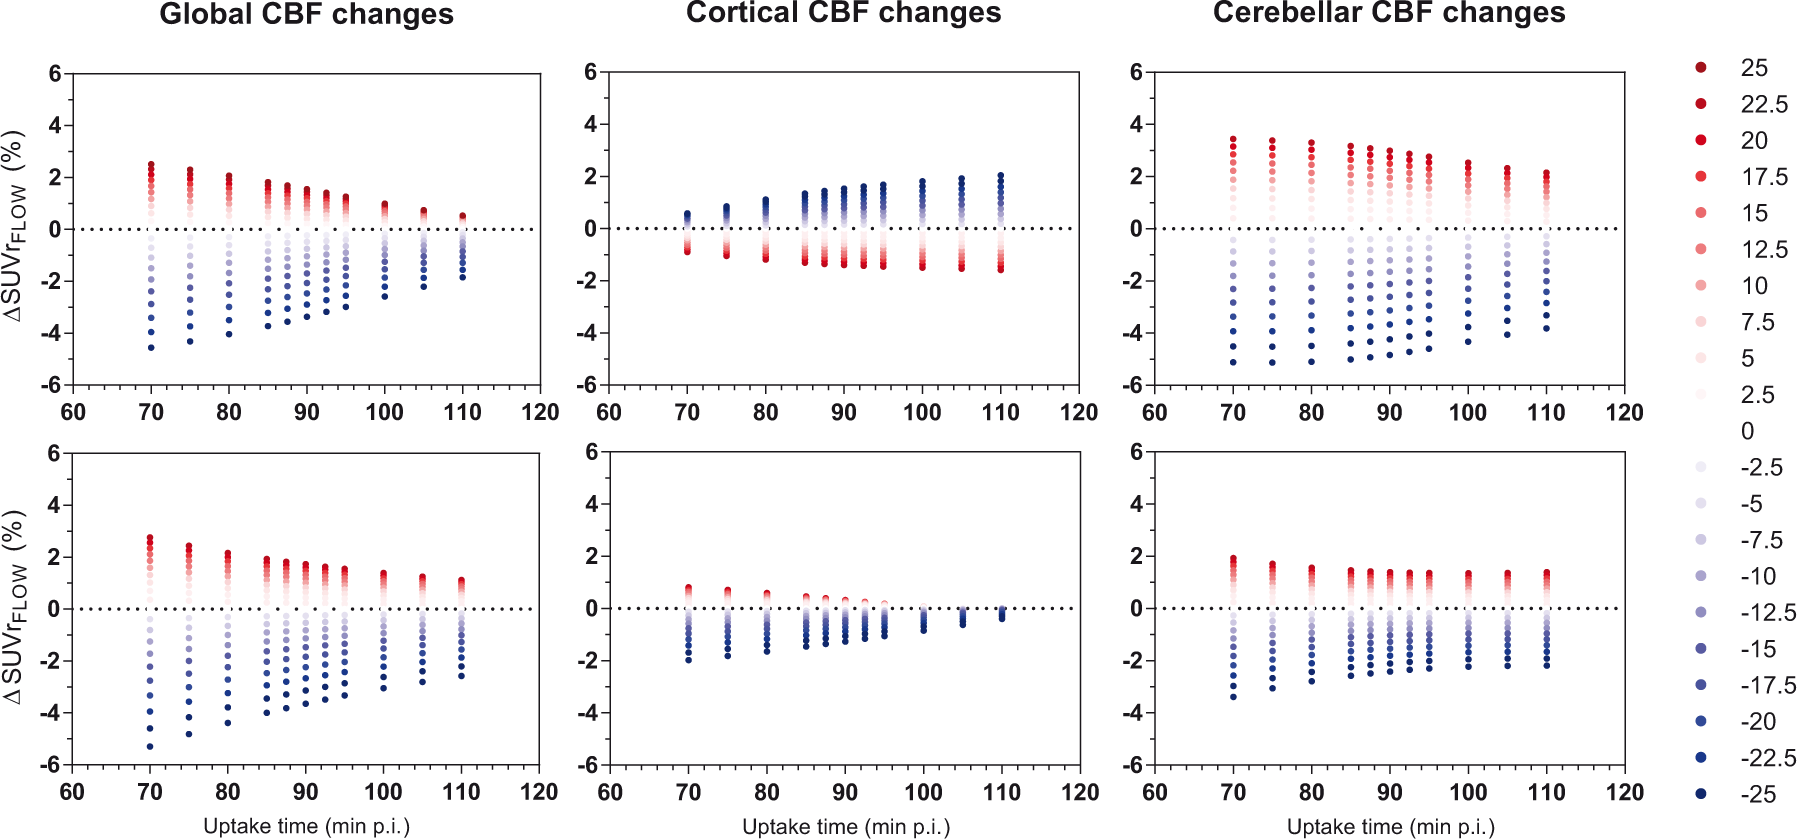
The effect of uptake time on sensitivity of SUVr to CBF changes. Upper row is [18F]flutemetamol and bottom row is [18F]florbetaben, depicted for intermediate amyloid (DVR = 1.400 and DVR = 1.538 for both tracers respectively) Red dots resemble CBF increases and blue dots CBF decreases.
Discussion
The current simulation study assessed the effect of global and regional CBF changes on regional amyloid quantification based on static, dynamic and dual-time-window scanning-protocols using reference tissue approaches for [18F]flutemetamol and [18F]florbetaben. The results of the present simulation study indicate that, compared with
The finding that
The finding that
With respect to
It is of interest to note that, in some cases, the confounding effects of perfusion changes were different between the two tracers. TACs were simulated using parameters derived from existing studies.20,21 Although sample sizes of those studies were different, it is unlikely that this had an effect on the final results, as both datasets consisted of 50% AD patients and 50% healthy controls. The most likely explanation for these differences in results is the difference in tracer kinetics of the two tracers, which can be deduced from the rate constants used for the simulations (Table 1). As mentioned above, reference tissue kinetics of both tracers were best described by including a second compartment, thereby violating the assumptions of a reference tissue model to some degree. More specifically, individual k3 and k4 parameters, as well as their ratio, differed between both tracers. This, in combination with differences in target tissue kinetics, could explain the observed differences between both tracers, which were most pronounced for SRTM, a model that assumes single tissue kinetics in both target and reference tissues. In other words, the difference in sensitivity to perfusion changes between both tracers is most likely due some degree of violation of underlying model assumptions, which may be different for the two tracers.
For both tracers, strong relationships (R2 ≥ 0.95) were observed between SRTM-derived R1 changes and simulated changes in CBF. This finding was in agreement with the high correlation observed between SRTM-derived R1 and 15 O-H2O PET, reported by a combined 15 O–H2O PET and [18F]florbetapir study. 16 More specifically, it suggests that for both [18F]flutemetamol and [18F]florbetaben, R1 could be used as a proxy for measuring CBF.
Finally, the effect of noise (resembling regions of interest) on sensitivity to CBF changes for
As mentioned before, the main goal of this work was to assess the effect of global and regional CBF changes on regional amyloid quantification for [18F]flutemetamol and [18F]florbetaben studies. Overall, a maximum CBF-induced change in amyloid outcome measure of 13.4% (SRTM) was observed across methods. However, it must be noted that the evaluated range of CBF changes was more extreme than the change one would typically expect during the timespan of a clinical trial or longitudinal study from an ageing or early AD perspective. On the other hand, in late AD stages, the CBF changes may be larger and drugs may also exert effects on CBF.12,13,15 Although the exact size of the effect is unknown for many drugs, the effect of regularly used substances such as caffeine and nicotine ranges from −22 to +25%.28,29 Therefore, besides the effect of drugs or stimulants, effects of CBF changes on
The present results suggest that if large changes in amyloid load are to be expected, the possible confounding effects due to changes in perfusion are likely to be insignificant, obviating the need for a dynamic scanning protocol. However, in drug development studies, the drug may have unknown effects on perfusion, which must be well understood prior to implementation of simplified methods based on a static scanning protocol. This is especially relevant in secondary prevention trials, where measured changes in amyloid load may be small. In those cases, a dynamic or dual-time-window protocol should be used to assess whether changes in perfusion have occurred and to estimate their magnitude. Based upon this information, it can be decided whether a static protocol is sufficient or a dynamic protocol is needed to address a specific clinical or research question. Finally, it should be noted that a dynamic or dual-time-window scanning protocol also can provide a measurement of relative perfusion, which may be an additional relevant source of information. It should be noted that an exhaustive assessment of additional sources of bias was outside the scope of the present study. However, it is known from previous studies that SUVr typically shows a positive bias, while RLogan tends to underestimate the gold standard, and these intrinsic biases challenge the pooling of data from different methods.5,7,20,21 Moreover, other factors such as image contrast and test-retest reliability may play a role when deciding on the method of choice for analysing data. 6 This implies that additional research, in particular test-retest and parametric imaging studies, is warranted.
Finally, given that the linear model (RLogan) outperformed the non-linear model (SRTM) with respect to robustness against CBF changes, one could conclude that SRTM is not the optimal model for describing the tracer’s kinetics. Alternatively, a linearised form, basis function implementation of SRTM (RPM) 30 could be evaluated, which has shown improved performance, especially for noisy data, compared to the original implementation of SRTM for [18F]flutemetamol. 20 The present study focussed on data corresponding to a region of interest level. As a next step, future studies could validate the application of parametric methods, such as RPM and SRTM2, 31 against the present results. The implementation of these methods (for example RPM’s basis function settings) would ideally be validated using imaging data.
Conclusion
RLogan was least affected by changes in cerebral blood flow and is therefore, at least within this context, the preferred method for regional amyloid quantification of [18F]flutemetamol and [18F]florbetaben. The same data could be analysed again using SRTM in order to determine the relative rate of delivery R1, which showed good correlation with CBF. Finally, in most cases, effects of CBF changes on SUVr were relatively small, in particular for later uptake-times.
Supplemental Material
JCB918029 Supplemental Material - Supplemental material for Simulating the effect of cerebral blood flow changes on regional quantification of [18F]flutemetamol and [18F]florbetaben studies
Supplemental material, JCB918029 Supplemental Material for Simulating the effect of cerebral blood flow changes on regional quantification of [18F]flutemetamol and [18F]florbetaben studies by Fiona Heeman, Maqsood Yaqub, Isadora Lopes Alves, Kerstin Heurling, Santiago Bullich, Juan D Gispert, Ronald Boellaard, Adriaan A Lammertsma and on behalf of the AMYPAD Consortium in Journal of Cerebral Blood Flow & Metabolism
Footnotes
Funding
The author(s) disclosed receipt of the following financial support for the research, authorship, and/or publication of this article: the project leading to this application has received funding from the Innovative Medicines Initiative 2 Joint Undertaking under grant agreement No 115952. This Joint Undertaking receives the support from the European Union’s Horizon 2020 research and innovation programme and EFPIA ![]() . JDG holds a ‘Ramón y Cajal’ fellowship (RYC-2013-13054) from the Spanish Ministry of Science, Innovation and Universities.
. JDG holds a ‘Ramón y Cajal’ fellowship (RYC-2013-13054) from the Spanish Ministry of Science, Innovation and Universities.
Acknowledgements
The authors would like to thank AMYPAD for all support and in particular prof. Frederik Barkhof for facilitating this research. In addition, we would like to thank Christopher Foley from GE for his feedback and the staff of the department of Nuclear Medicine, University of Leipzig for skilful acquisition and analyses of the [18F]florbetaben data during the clinical development.
Authors’ contributions
FH, MY, ILA, JDG, RB and AAL contributed to the concept and design of the study. SB, and KH provided the data. FH and MY contributed to the data analysis. FH, MY, ILA, KH, JDG, SB, RB and AAL contributed to the interpretation of the data. Technical or material support was provided by MY, SB and KH. FH, MY, ILA, and AAL drafted the manuscript. FH, MY, ILA, KH, JDG, SB, RB and AAL read, critically reviewed, and approved the manuscript.
Availability of data and materials
The data generated in this simulation study are included in this article (and its supplementary materials) or can be made available upon reasonable request. Any requests regarding data received from GE Healthcare and Life Molecular Imaging GmbH can be directed towards those companies.
Declaration of conflicting interests
The author(s) declared the following potential conflicts of interest with respect to the research, authorship, and/or publication of this article: SB is employed by Life Molecular Imaging GmbH. All other authors declare that they have no conflict of interest.
Supplemental material
Supplemental material for this article is available online.
References
Supplementary Material
Please find the following supplemental material available below.
For Open Access articles published under a Creative Commons License, all supplemental material carries the same license as the article it is associated with.
For non-Open Access articles published, all supplemental material carries a non-exclusive license, and permission requests for re-use of supplemental material or any part of supplemental material shall be sent directly to the copyright owner as specified in the copyright notice associated with the article.