
Abstract
Longitudinal positron emission tomography (PET) imaging of beta-amyloid is used in basic research and in drug efficacy trials in Alzheimer's disease (AD). However, the extent of amyloid accumulation after clinical onset is not fully known. Importantly, regional PET data are typically quantified using the standardized uptake value ratio (SUVR), which according to simulations is sensitive to changes in regional cerebral blood flow (rCBF). We aimed to better understand the potentials of longitudinal amyloid imaging by disentangling the influence of blood flow on SUVR using experimental data. [18F]AV-45 PET data from 101 subjects, ranging from cognitively normal to AD patients, in the Alzheimer's Disease Neuroimaging Initiative were extracted. The relationship between global cortical distribution volume ratio, indicator of rCBF (R1), and SUVR was examined using multilinear regression. There was a significant effect of rCBF on SUVR. The effect increased by disease severity. Results suggest that changes in rCBF can produce apparent changes in SUVR in AD. Therefore, future longitudinal studies should measure amyloid changes in a way not sensitive to this effect, ideally using quantitative PET imaging. Furthermore, the results suggest no true accumulation beyond clinical onset and highlight the risks of longitudinal amyloid imaging in drug trials in AD.
Keywords
INTRODUCTION
Positron emission tomography (PET) imaging has contributed to our understanding of Alzheimer's disease (AD). In recent years, radioligands binding specifically to fibrillar amyloid-β (Aβ) have been successfully applied. 1 The radioligands have enabled in vivo detection of amyloid deposits2–5 and have been implemented in clinical research including longitudinal amyloid imaging such as in the Alzheimer's Disease Neuroimaging Initiative (ADNI) or in the Australian Imaging Biomarkers and Lifestyle study.6,7 Importantly, cross-sectional results indicate that the prevalence of high amyloid binding is 15% to 25% in cognitively normal (CN) elderly controls, 50% to 70% in patients with mild cognitive impairment (MCI), and 85% to 95% in those with probable AD.8–11 The findings suggest that the process of amyloid accumulation starts several years before clinical onset, is slow and gradual with only a few per cent annual increase in amyloid burden. 12 For example, findings using the radioligand [ 11 C]PIB indicate an annual change in standardized uptake value ratio (SUVR) units of about 0.025 to 0.050 (i.e., 2% to 5%) in MCI and AD patients.6,8,9 However, the accumulation appears to taper off around the time of clinical diagnosis. Whereas some longitudinal studies have reported slight further increases in clinical AD for baseline positive patients6,8,13,14 others have not been able to do so.9,10,15
For treatment of AD, there is a large unmet medical need for disease-modifying drugs. Clinical development of such drugs rely on biomarker data showing drug effect on the underlying pathology. In particular, studies on disease modifiers acting directly or circuitously on the amyloid pathway have made use of serial, longitudinal amyloid imaging to monitor and compare the rate of amyloid accumulation between actively treated and placebo groups of patients.14,16,17 For the purpose of future drug development, a good understanding of the expected accumulation rate in untreated patients is of key importance.
The typical acquisition protocol used for clinical amyloid PET imaging is a short (10 to 30 minutes) interval initiated several minutes (typically at least 50 minutes for 18 F tracers) after radioligand injection.18,19 This approach provides data for calculation of the SUVR between amyloid-rich target regions and an amyloid-free reference region. In the standard quantification procedure, the regional radioactivity concentration is first converted to standardized uptake values (SUVs) typically by a global normalization involving a division with total injected radioactivity and multiplication with body weight. Then, the ratio between target and reference regions is calculated to obtain regional SUVRs. The reference region is typically the cerebellar gray matter, the whole cerebellum, or a white matter dominated region (e.g., brain stem or centrum semiovale). The timing of the PET acquisition corresponds to the quasi-steady-state (secular or transient equilibrium) phase of radioligand binding (Figure 1).20,21 This phase is characterized by a gradual wash-out of radioactivity from both target and reference regions and the time curve for the ratio of radioactivity between target and reference regions is almost stable though with a slight positive slope for several radioligands.22–26
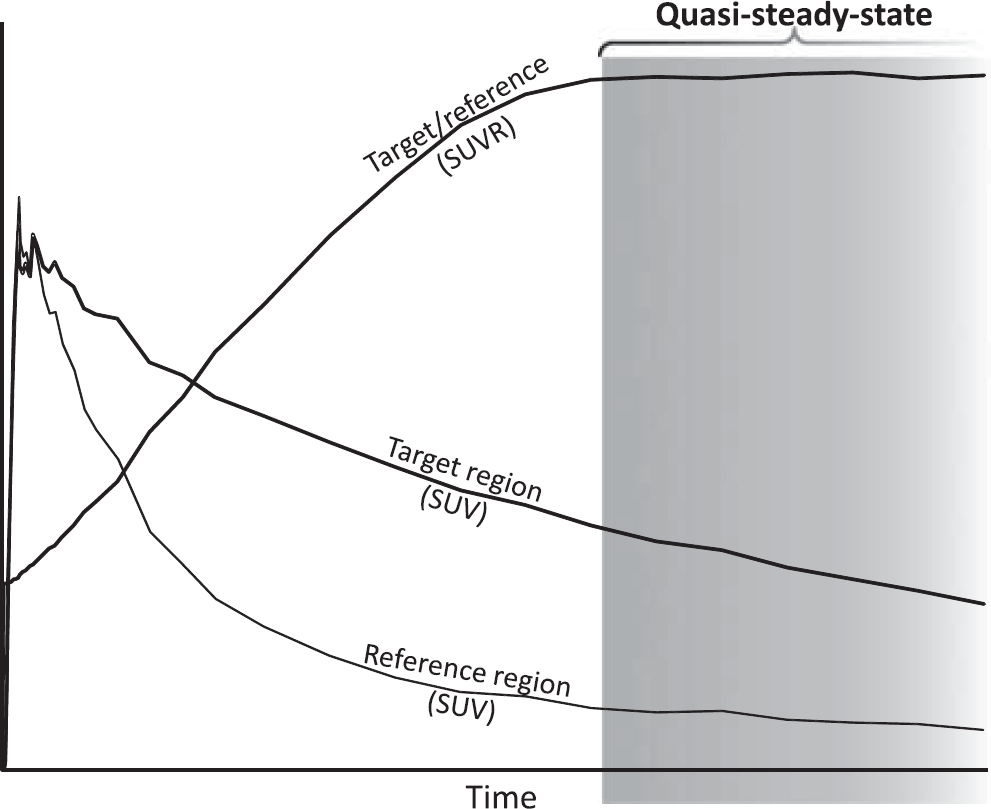
Schematic plot to illustrate quasi-steady-state (secular equilibrium) phase of radioligand binding. In this phase, the radioligand is washing out from both regions rich in amyloid (target) and devoid of amyloid (reference). The ratio of regional radioactivity between target and reference is near horizontal or slowly increasing. The quasi-steady-state phase in principle is open ended, in practice bracketed by complete radioactive decay and radioligand elimination from the body many hours after injection. SUVR, standardized uptake value ratio.
The SUVR value is viewed as an index for specific binding and its proportionality to the distribution volume ratio (DVR), obtained using fully quantitative PET acquisition and analysis, has been shown for several amyloid radioligands.22–24,26 However, the quasi-steady-state SUVR values are biased in the sense that they overestimate DVR as the time window of acquisition occurs after the peak time of specific binding.20,27 For amyloid radioligands, the overestimation by quasi-steady-state SUVR has been estimated to be 30% to 70%.22–24,26
A further property of the quasi-steady-state SUVR value is that the overestimation is sensitive to absolute or relative changes in regional cerebral blood flow (rCBF). For amyloid imaging, such an effect has recently been suggested from recent experimental data with [ 11 C]PIB, showing an unexpected overall longitudinal decrease of amyloid load in a group untreated AD patients when using quasi-steady-state SUVR for quantification. 28 Moreover, the effect was further evaluated in the same study through the use of simulations. 28 In case of quasi-steady-state SUVR, this effect is such that the overestimation is larger when rCBF in the target areas is reduced compared with the reference region. 28 This effect is a concern since reduced rCBF is a core feature of AD pathophysiology.29,30 Longitudinal monitoring of SUVR values for amyloid load may thus be influenced by changes in rCBF. In contrast, changes in rCBF do not appear to have a significant effect on DVR values estimated using nonlinear modeling or graphical analysis. 28 In summary, quasi-steady-state SUVR can be understood as a composite value consisting of an amyloid load-(specific binding) dependent component and a rCBF-dependent component. Though the rCBF-dependent component may be small it may anyhow influence longitudinal amyloid imaging by confounding estimates of the potential increase in amyloid plaque load when gradual changes in rCBF occur such as after clinical AD diagnosis.
The overall aim of the current work was to better understand the effect of rCBF changes on SUVR values when following amyloid accumulation longitudinally as part of large multicenter clinical studies or drug trials. The rCBF-dependent component of the quasi-steady-state SUVR was disentangled with the help of independent estimates of specific binding (DVR) and of relative target-to-reference differences in rCBF. To estimate relative differences in rCBF, we used estimates of R1, which is the ratio of the flow-dependent kinetic rate constant K1 in the target and reference regions, respectively. The present analysis was based on [ 18 F]AV-45 PET data in CN subjects, patients with early/late MCI (EMCI and LMCI), or clinical AD from the ADNI database.
MATERIALS AND METHODS
SUBJECTS
Data used in the preparation of this article were obtained from the ADNI database (adni.loni.usc.edu). The ADNI was launched in 2003 by the NIA (National Institute on Aging), the NIBIB (National Institute of Biomedical Imaging and Bioengineering), the FDA (Food and Drug Administration), private pharmaceutical companies, and non-profit organizations, as a $60 million, 5-year public private partnership. The primary goal of ADNI has been to test whether serial magnetic resonance imaging (MRI), PET, other biologic markers, and clinical and neuropsychologic assessment can be combined to measure the progression of MCI and AD. Determination of sensitive and specific markers of very early AD progression is intended to aid researchers and clinicians to develop new treatments and monitor their effectiveness, as well as lessen the time and cost of clinical trials. The ADNI is the result of efforts of many coinvestigators from a broad range of academic institutions and private corporations, and subjects have been recruited from over 50 sites across the United States and Canada. The initial goal of ADNI was to recruit 800 subjects, but ADNI has been followed by ADNI-GO and ADNI-2. To date, these three protocols have recruited over 1,500 adults, ages 55 to 90, to participate in the research, consisting of CN older individuals, people with EMCI or LMCI, and people with early AD. The follow-up duration of each group is specified in the protocols for ADNI-1, ADNI-2, and ADNI-GO. Subjects originally recruited for ADNI-1 and ADNI-GO had the option to be followed in ADNI-2. For up-to-date information, see www.adni-info.org. Access to the data was granted by the ADNI Data and Publications Committee in return for accepting to follow the guidelines of the ADNI data use agreement. Participants in ADNI had given informed consent to the sharing and use of their deidentified data with the general scientific community for research purposes.
The ADNI imaging database was searched for subjects who had [ 18 F] AV-45 PET data both immediately after injection (0 to 20 minutes) and at time of quasi-steady-state (50 to 70 minutes post injection (p.i.)). At time of the present analysis, 105 such subjects could be identified and PET and MRI data were downloaded from the ADNI Laboratory of Neuroimaging server (http://www.loni.uda.edu/ADNI/). Data for three subjects were excluded from analysis because the early and late PET data had different voxel value units and could not be merged for quantification. Yet another subject was excluded since the early PET data revealed double bolus injections (8 to 9 minutes apart) thus violating the condition of a single bolus experiment. By the end, data from 101 subjects were entered into the analysis. Subject characteristics are presented in Table 1.
Subject characteristicsa
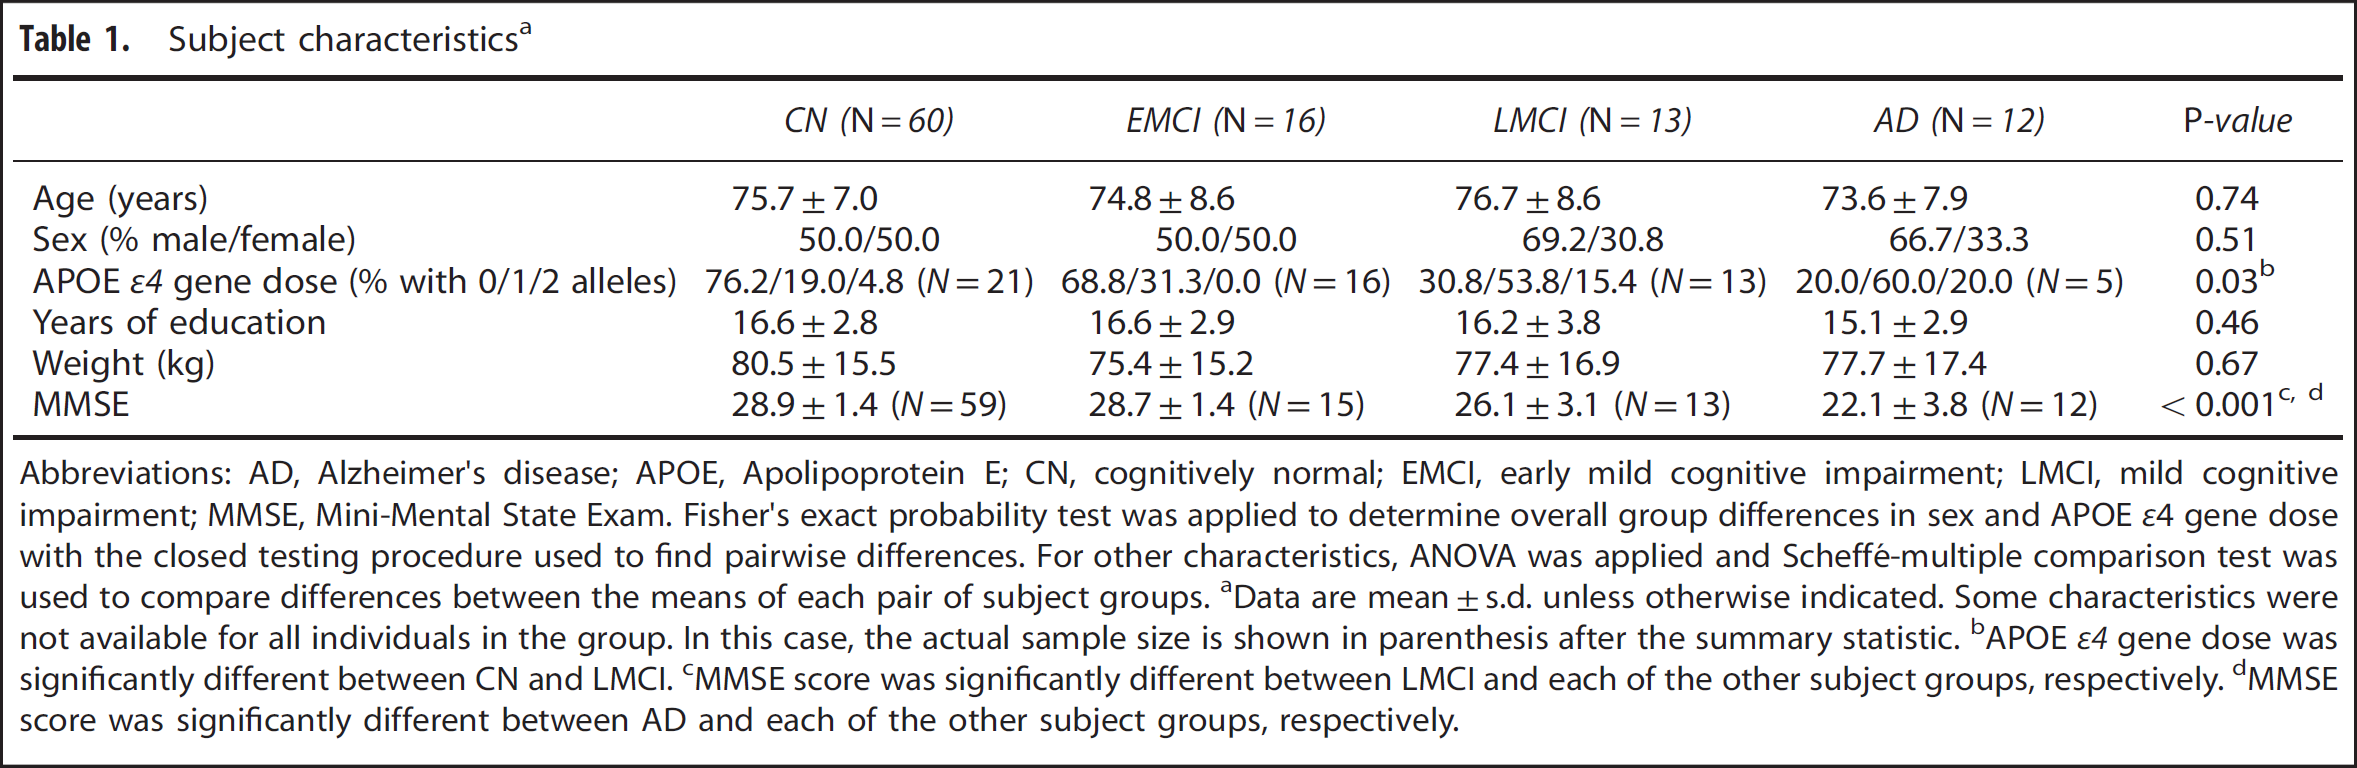
Abbreviations: AD, Alzheimer's disease; APOE, Apolipoprotein E; CN, cognitively normal; EMCI, early mild cognitive impairment; LMCI, mild cognitive impairment; MMSE, Mini-Mental State Exam. Fisher's exact probability test was applied to determine overall group differences in sex and APOE ε4 gene dose with the closed testing procedure used to find pairwise differences. For other characteristics, ANOVA was applied and Scheffé-multiple comparison test was used to compare differences between the means of each pair of subject groups.
Data are mean±s.d. unless otherwise indicated. Some characteristics were not available for all individuals in the group. In this case, the actual sample size is shown in parenthesis after the summary statistic.
APOE ε4 gene dose was significantly different between CN and LMCI.
MMSE score was significantly different between LMCI and each of the other subject groups, respectively.
MMSE score was significantly different between AD and each of the other subject groups, respectively.
Image Acquisition and Preprocessing
The PET data had been acquired on 10 different PET systems (4 GE models, 3 Philips models, and 3 Siemens models) at 19 imaging sites. According to the ADNI protocol, 370 MBq was to be injected intravenously. Injection data were available for 69 of the subjects in the sample indicating injection of 363 ± 28 MBq on average (range 275 to 406 MBq; 90% of cases within a ± 10% margin of target dose) thus confirming an overall acceptable level of adherence to the protocol. The protocol for early acquisition provided 20 frames in 20 minutes after injection with 4 × 15 seconds, 4 × 30 seconds, 3 × 60 seconds, 3 × 120 seconds, and finally 2 × 240 seconds duration. The late acquisition protocol provided four 5-minute frames starting 50 minutes after injection.
The ADNI preprocessing scheme involves several steps that start with the reconstructed 4D (dynamic) decay-, scatter-, and attenuation-corrected early or late PET data sets and yield reoriented 3D (both early and late) and 4D (only early) PET images with harmonized isotropic 8 mm resolution along all three image axes (see Supplementary Figure S1 in the Supplementary material for a flow-chart diagram). However, time-activity curves (TACs) are not readily available in the ADNI database. Thus, to obtain the TACs required for the present analysis, the early and late PET data were merged into a single 70-minute 4D PET image. This required additional preprocessing of the available images since the individual PET frames are available in the database in fully preprocessed variant for early data only. Importantly, the individual frames of late data are provided only in partially preprocessed version (i.e., after frame-by-frame realignment) and the final steps of standardizing the orientation and smoothing had not been performed on separate frames. Therefore, to obtain the data for the later part of the TAC we performed the preprocessing steps described below (the flow chart in Supplementary Figure S1 in the Supplementary material also indicates the additional steps). The ADNI-defined concepts are quoted within brackets (see also http://adni.loni.usc.edu/methods/pet-analysis/pre-processing/):
The parameters describing the rigid body transformation of the 3D (average) late PET image (‘Co-registered, Averaged’ in ADNI data) into standardized orientation and grid size (‘Co-reg, Avg, Standardized Image, and Voxel Size’) were not available in the database. The parameters were instead obtained using the coregistration algorithm in the software package SPM (SPM5, http://www.fil.ion.ucl.ac.uk/spm/).
The individual frames of the framewise realigned 4D late image (‘Co-registered Dynamic’) were then resliced to standard orientation and grid size by using the coregistration parameters from step 1.
The convolution kernel that had been used for smoothing the PET images from different PET systems to produce images with uniform isotropic resolution of 8 mm full-width at half maximum was not available in the ADNI database. Therefore, the kernel was approximated by deconvolution from the smooth (‘Co-reg, Avg, Std Img and Vox Siz, Uniform Resolution’) and unsmoothed (‘Co-reg, Avg, Standardized Image and Voxel Size’) 3D (average) late PET images. An analogous approximation procedure was applied to the early averaged PET images. The variant of the convolution kernel with lowest voxelwise standard deviation in the noncentral portion of the kernel image (i.e., the one with the least background noise) was selected as the final kernel.
The individual frames of the 4D early PET image in standardized orientation (‘AV45-Early Coreg, Dyn, Standardized Image and Voxel Size’) were then smoothed with the convolution kernel to obtain an image with uniform resolution. Note that even though the ADNI data already contained a smoothed variant of the 4D early PET image a new one was anyhow calculated so that exactly the same kernel was applied for both early and late frames.
Similarly, the individual frames of the 4D late PET image in standardized orientation (obtained in step 2) were smoothed using the calculated convolution kernel. In contrast to step 4, as noted above, these data were not available in ADNI.
The early and late smoothed frames were merged into a single 4D data set with 20 frames.
The time frames of the 4D image were integrated to obtain a 3D (average) PET image corresponding to the full merged data set.
The T1-weighted MR image was reoriented so that the anterior-posterior commissures defined the horizontal and the mid-sagittal sulcus the vertical plane. The coregistration parameters describing the rigid body transformation between the reoriented MR image and the 3D PET image (from step 7) were obtained using SPM.
Image Postprocessing and Analysis
The reoriented MR image was segmented into gray, white, and cerebrospinal fluid segments using an algorithm in SPM, which simultaneously provides the parameters (and their inverse) for normalization to the MNI (Montreal Neurological Institute) template space. The template for automated anatomic labeling (AAL) of regions, 31 defined in the MNI space, was warped into the individual MRI space using the inverse normalization parameters. Five double-sided regions of interest (ROIs) were selected for the present analysis as target regions: lateral frontal cortex (AAL regions F1, F2, F30, F3T), lateral temporal cortex (AAL regions T1, HESCHL, T2, T3), medial parietal cortex (AAL region PQ), anterior cingulate cortex (AAL region CIA), and the posterior cingulate cortex (AAL region CIP). To serve as a reference region, the cerebellar cortex was selected, consisting of the following AAL regions: CERCRU1, CERCRU2, CER3, CER4_5, CER6, CER7B, CER8, CER9, CER10, VER1_2, VER3, VER4_5, VER6, VER7, VER8, VER9, and VER10. The ROI masks were resliced into the space of the PET image using the coregistration parameters obtained previously. The resliced masks were applied to each frame of the final 4D PET image (from step 6 above) to obtain regional TACs for quantification.
In the main analysis and for each ROI, only voxels with the highest membership in the individual gray-matter probability map were retained to exclude voxels that consist predominantly of white matter and/or cerebrospinal fluid. In detail, from voxels, having a summed probability on the gray, white, and cerebrospinal fluid segments above 50%, only the ones with the highest probability for gray matter were retained, i.e., the gray matter probability of retained voxels was always greater than 17%.
Three additional analyses were also performed. The first two aimed to better understand the impact of using target and/or reference regions, which are more dominated by white matter, a frequent practice in amyloid imaging. In both analyses, the whole cerebellum, including white matter, was used as the reference region. Furthermore, the first additional analysis also included the white-matter dominated voxels in target regions, i.e., it omitted the use of MRI-driven segmentation from the analysis process. The second additional analysis kept the use of gray-matter segmentation in the target regions as described in the main analysis.
The third additional analysis aimed to understand the impact of partial volume effects (PVEs). To this end, a geometric transfer matrix-based PVE correction scheme was applied to obtain corrected TACs. 32 For further details, please see the Supplementary material.
Quantification
The quasi-steady-state SUVR was calculated from the TAC data at 50 to 70 minutes p.i. (SUVR50–70). Different possible nonlinear and linear methods were considered for the quantification of DVR, which were evaluated in a preparatory analysis, using simulated TACs based on the previously published [ 18 F]AV-45 data, 26 to test the sensitivity of the methods to the gap in PET data between 20 and 50 minutes (data not shown). The evaluation of nonlinear reference region-based compartment models indicated that such models may not be reliably used in presence of the gap, leading to convergence errors and bias in the binding potential estimates with an R1 dependency. However, the graphical multilinear reference Logan fit showed an excellent linear correlation (R 2 > 0.998, slope ~0.95) between DVR estimates from continuous and interrupted TACs.33,34 Thus, DVR from the full 0 to 70 minutes PET data using multilinear reference Logan fit was used to serve as a reference for amyloid density. To serve as an estimate of relative difference in rCBF between target and reference regions, the parameter R1 was calculated from early PET TAC data (SUVR 0 to 2 minutes p.i.), which previously has been shown to provide accurate estimates. 35 No correction was made for blood volume content in the TACs in lack of blood radioactivity information. However, blood volume content should in general be similar between target and reference regions thus it should largely cancel out when estimating R1 with any remaining effect likely parallel to R1. For each parameter, the values obtained for the five target ROIs were averaged to obtain a single global measure for the individual.
In theory, the exact relationship between the three parameters (DVR, R1, and SUVR50–70) is nonlinear and with no known analytical solution. Thus in the present analysis we instead evaluated how well the relationship between the parameters can be approximated using a simple linear function with two independent variables. More specifically, to determine the blood flow-dependent component in SUVR50–70 the three parameters (DVR, R1, and SUVR50–70) from all PET images (N = 101) were entered into a multivariate total least squares (TLS) regression analysis.
36
The TLS approach is advantageous since it accounts for the fact that both dependent (SUVR50–70) and independent (DVR and R1) variables contain observational errors, which should be of similar magnitude. The TLS evaluation was implemented using principal component analysis.
36
From the resulting three principal components the one with the lowest eigenvalue provided the direction perpendicular to the plane corresponding to the best fit in terms of the TLS error, i.e., minimizing the perpendicular distance of each fitted 3D point (DVR, R1, SUVR50–70 parameter triplet) to the plane. Thus, the 3D point defined by the R1, DVR, and SUVR50–70 triplet could be projected perpendicularly to the closest 3D point on the plane (subsequently referred to as 


Furthermore, the measured SUVR50–70 value can be expressed as the fitted 


To highlight the impact of the multivariate fit, a similar TLS fit as well as a simple linear correlation analysis were performed on SUVR50–70 versus DVR, and SUVR50–70 versus R1, respectively.
RESULTS
The ADNI PET data were successfully preprocessed and TACs were extracted as described in Materials and methods for the 101 subjects. Initially, we examined the direct relationship between SUVR50–70 and DVR for the 101 subjects included (Figure 2A and Table 2, first row). The correlation was highly significant with ~95% of the total variance explained. The fit shows that the SUVR50–70 values were about 60% higher than the DVR values (Figure 2A).
Total least square analyses of the relationships between SUVR50–70, DVR, and R1
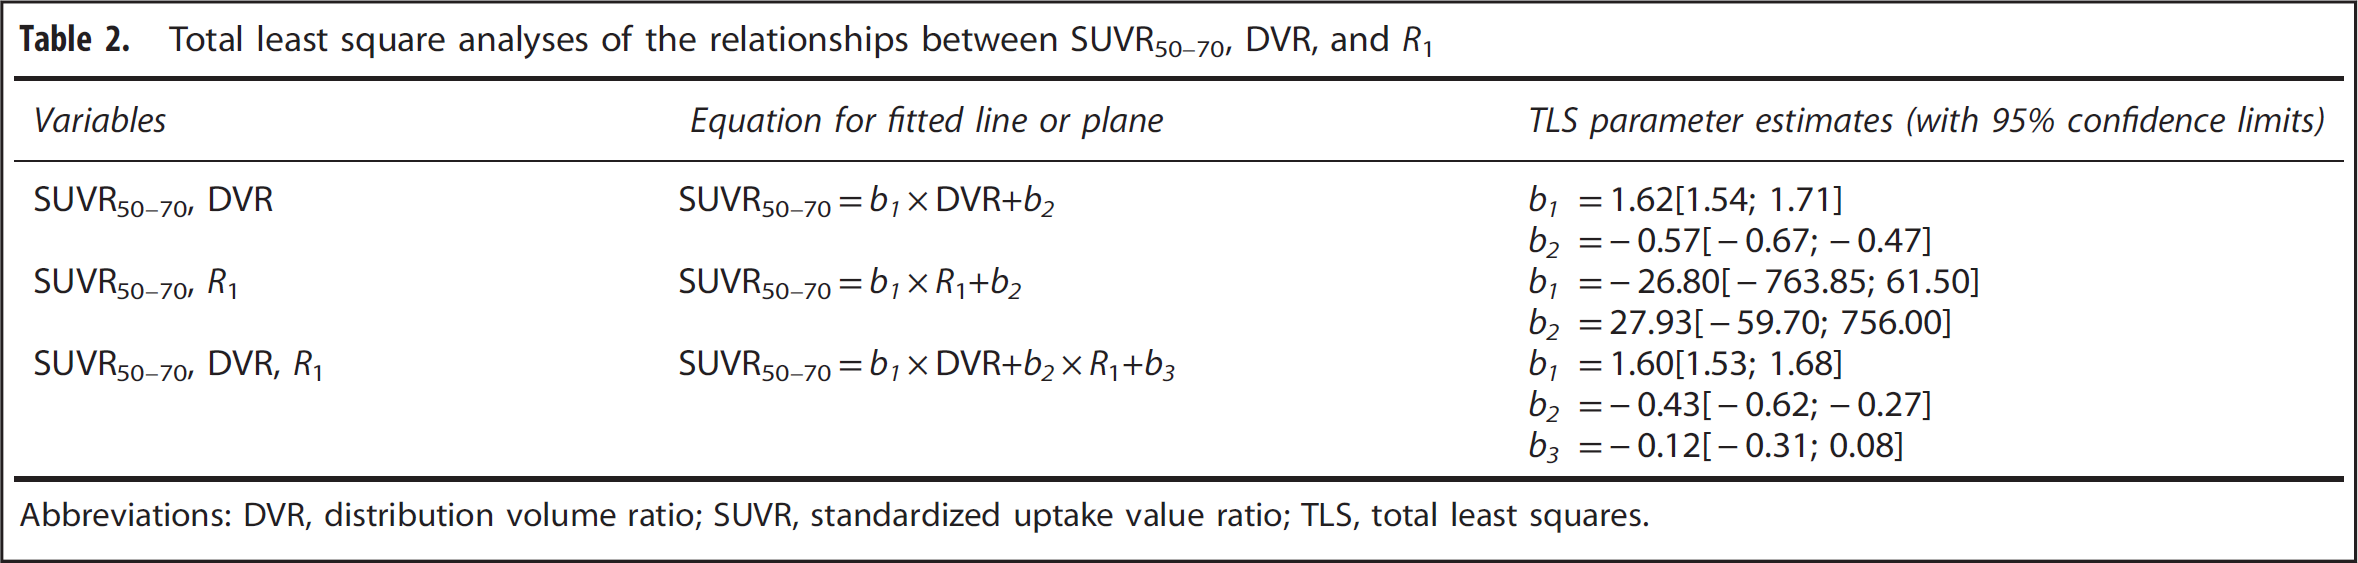
Abbreviations: DVR, distribution volume ratio; SUVR, standardized uptake value ratio; TLS, total least squares.
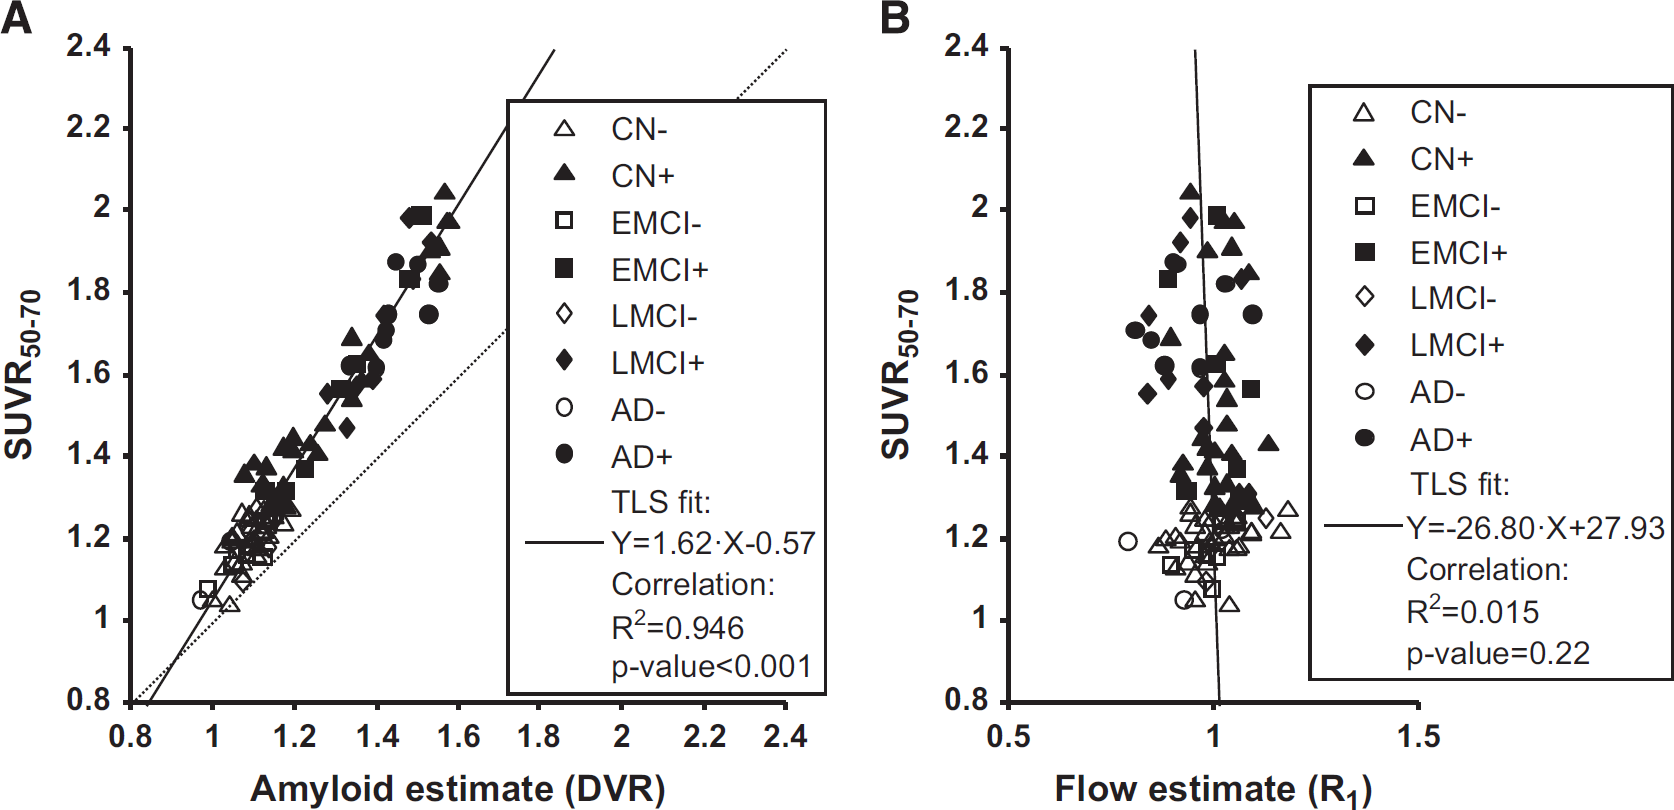
Regression of SUVR50–70 values against estimates of amyloid and relative flow, respectively. For illustration purposes, subjects with high and low amyloid load were separated using the SUVR50–70 cutoff of 1.277, which was obtained by converting the typical [
11
C]PIB threshold of 1.47 using the regression line in (
Subsequently, the relationship between SUVR50–70 and R1 was evaluated (Figure 2B and Table 2, second row). The correlation was low and could only explain about 1.5% of the total variance. Accordingly, the TLS-fitted linear relationship appeared to be noninformative with a near-vertical slope and 95% confidence limits crossing zero for both fitted parameters.
In the central analysis of this work, the three parameters SUVR, DVR, and R1 were entered into a multivariate TLS analysis. To illustrate the overall outcome of the analysis, a 3D orthographic projection is shown in Figure 3. It can readily be seen that the fitted plane is tilted not only along the axis of amyloid binding (DVR), with higher SUVR50–70 for higher amyloid load, but also along the axis of relative blood flow (R1), with higher SUVR50–70 for lower relative blood flow. Furthermore, visual inspection reveals that most of the points (70% to 80%) were close to the fitted plane with off-plane points symmetrically scattered on both sides of the plane.
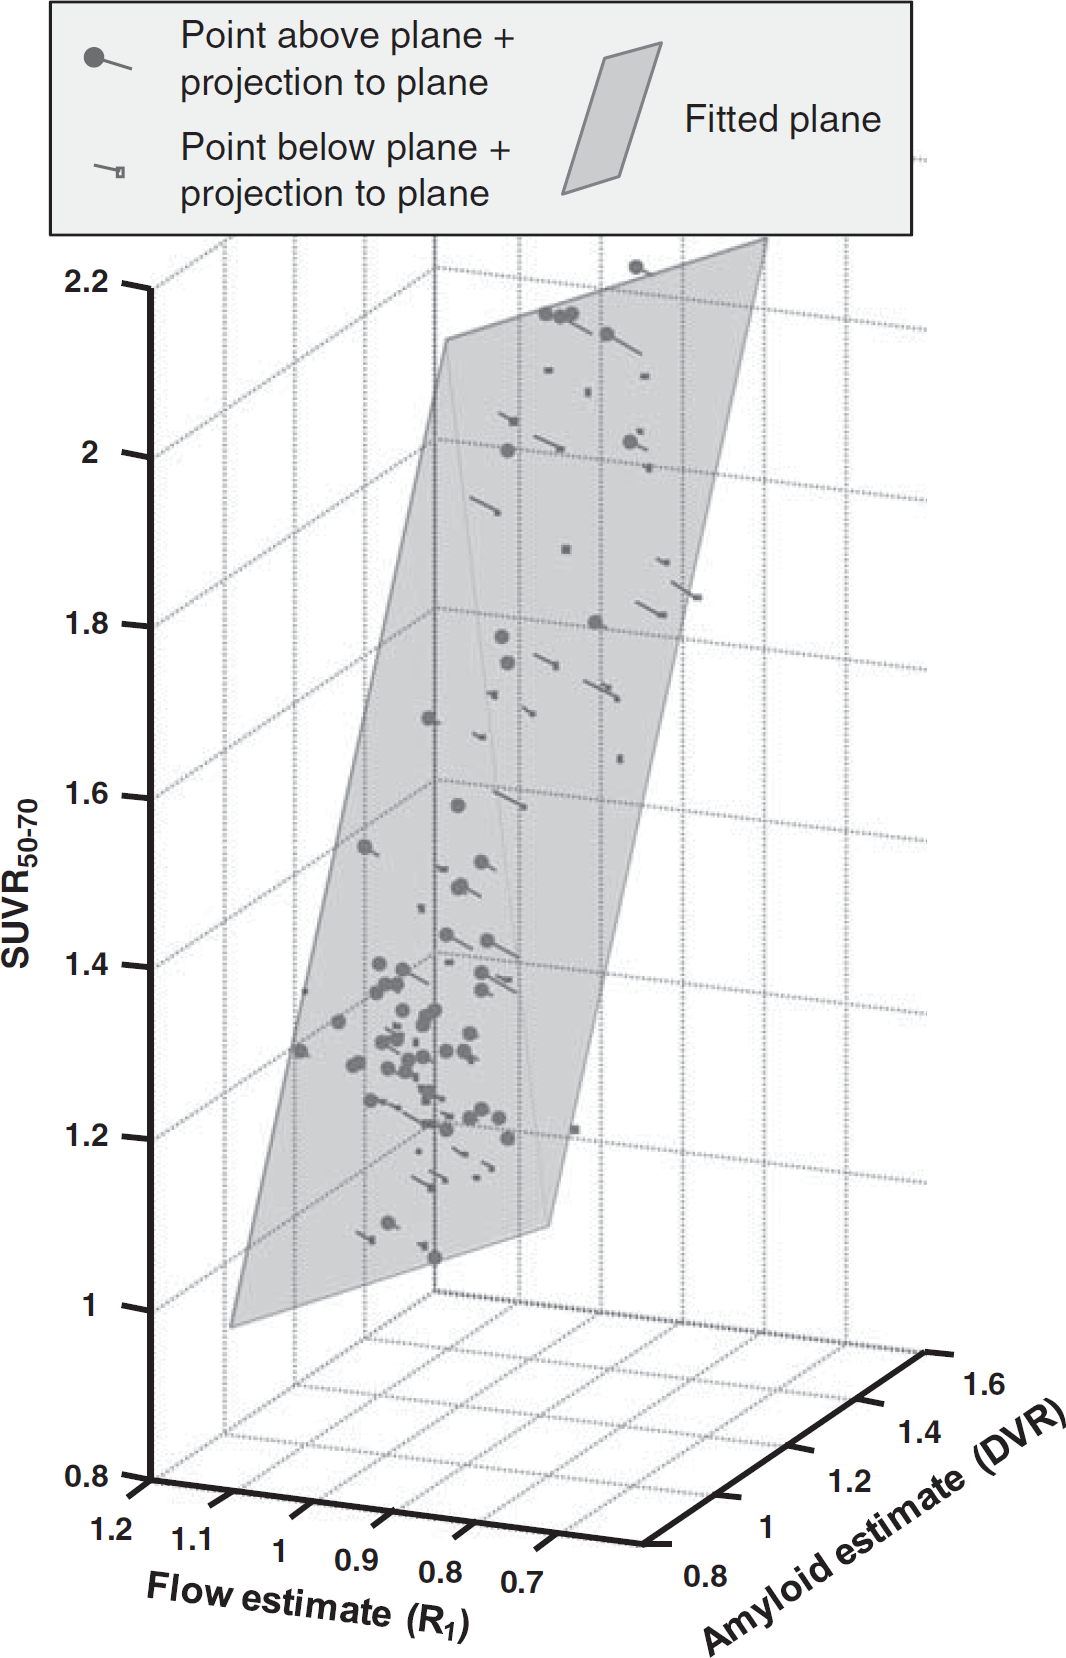
Orthographic projection of three-dimensional scatter plot showing input data entered into multivariate total least squares (TLS) analysis (N = 101 parameter triplets). Gray semi-transparent plane indicates the TLS fitted plane (equation: SUVR50–70 = 1.60 × DVR-0.43 × R1 − 0.12) with lines connecting data points perpendicularly to the plane (i.e., showing the vectors defined by ε1, ε2, and ε3). Data points above plane are shown with filled round symbols, those below with empty square symbols. DVR, distribution volume ratio; SUVR, standardized uptake value ratio.
Parameters of the multivariate TLS analysis are given in Table 2, row 3. The slope parameter along the DVR axis (b1) was similar to that seen for the univariate analysis (Figure 2A and first row of Table 2) with a slightly more narrow 95% confidence interval. However, the slope parameter along the R1 axis (b2) was markedly different when compared with the noninformative univariate regression (Figure 2B and Table 2, second row) with 95% confidence limits indicating a significant negative relationship with a slope of −0.43 between SUVR50–70 and R1. There was a negative point estimate for the intercept term (b3) in the multivariate model but it was not significantly different from zero.
Based on the fitted multivariate model, it was possible to disentangle correlation among the three parameters. There was a strong correlation between the flow-corrected values (FCSUVR50–70, see equation (5)) and the DVR estimates (Figure 4A). Comparing the regression with that shown in Figure 2A it appears that even though the differences were small yet both the total variance explained and the significance of the regression may have increased. Visually, the points were in general closer to the fitted line.
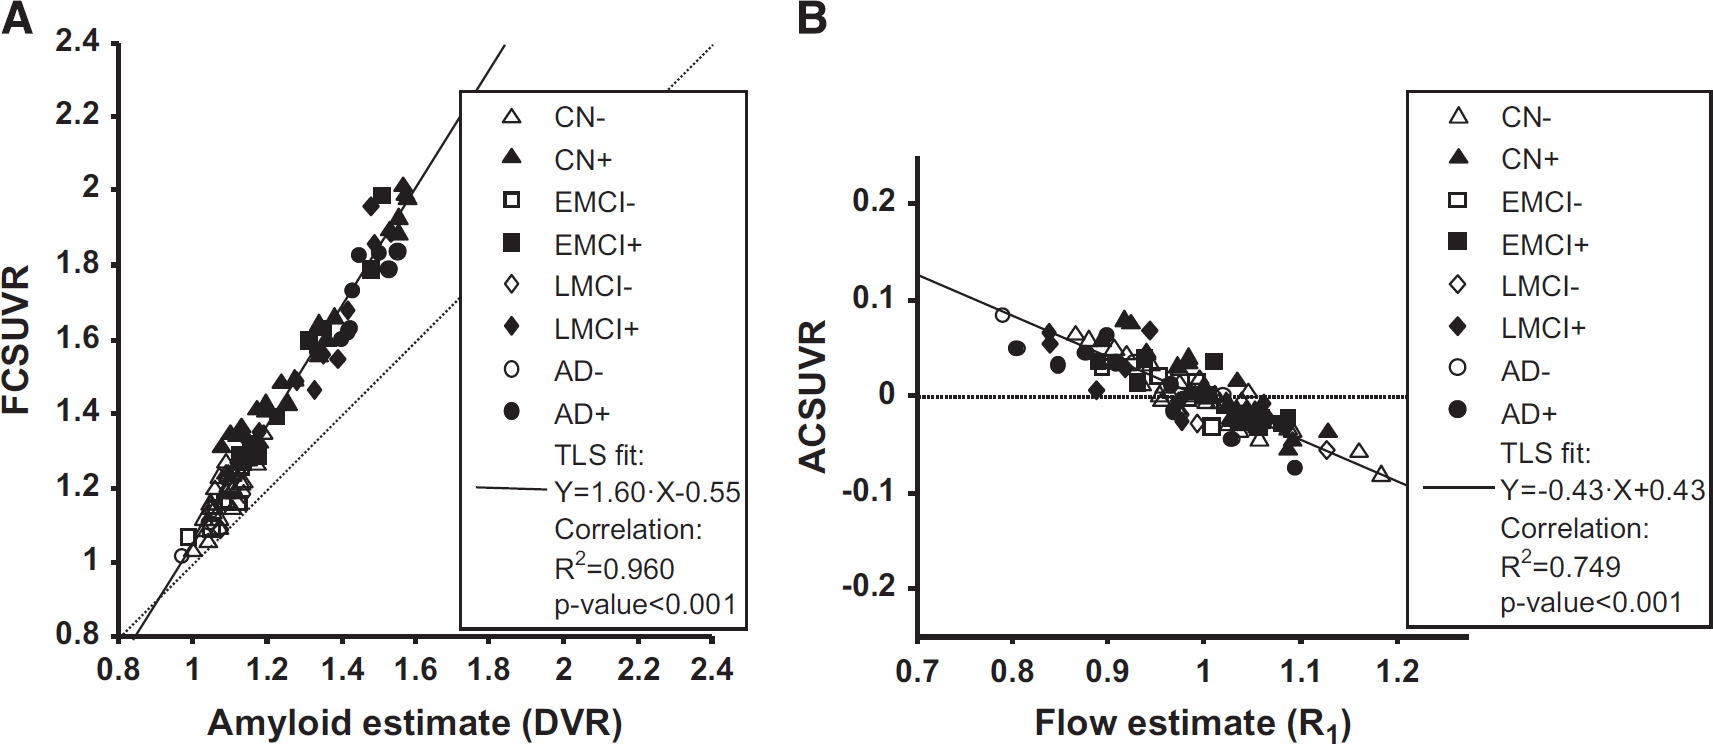
Regression of corrected SUVR50–70 values against estimates of amyloid and relative flow, respectively. Scatter plots show global cortical variables in all subjects (N = 101). Individual symbols indicate group membership and amyloid positivity (see legend for details). Solid line shows total least squares (TLS) fitted line (equation in legend, together with results of simple linear correlation). (
Figure 4B illustrates the regression of cortical amyloid-corrected values (ACSUVR50–70, see equation (7)) versus the R1 estimates. According to correlation analysis, ~75% of the total variance could be explained by a linear relationship, which is in agreement with visual inspection of the scatter points since they appear to be close to the fitted line.
To examine the effect of blood flow on SUVR50–70 in more detail, the flow-dependent component in SUVR50–70 was extracted from the various subject groups (Figure 5). On average, the AD group had the highest component (mean±s.d. = 0.030 ± 0.040, N = 12), followed by LMCI (mean±s.d. = 0.010 ± 0.038, N = 13) with values close to zero in EMCI (mean±s.d. = 0.002 ± 0.026, N = 16) and CN (mean±s.d. = −0.001 ± 0.028, N = 60). The mean blood flow-dependent effect was different in an uncorrected multiple comparison at the α = 5% level between AD and EMCI (P value: 0.033), and between AD and CN (P value: 0.0019), respectively (two-sided, two sample t-test). Performing an ANOVA indicated an overall group effect at the α = 5% level (P value: 0.018) and a conservative Scheffé-multiple comparison procedure indicated a retained significant group difference between AD and CN. 38
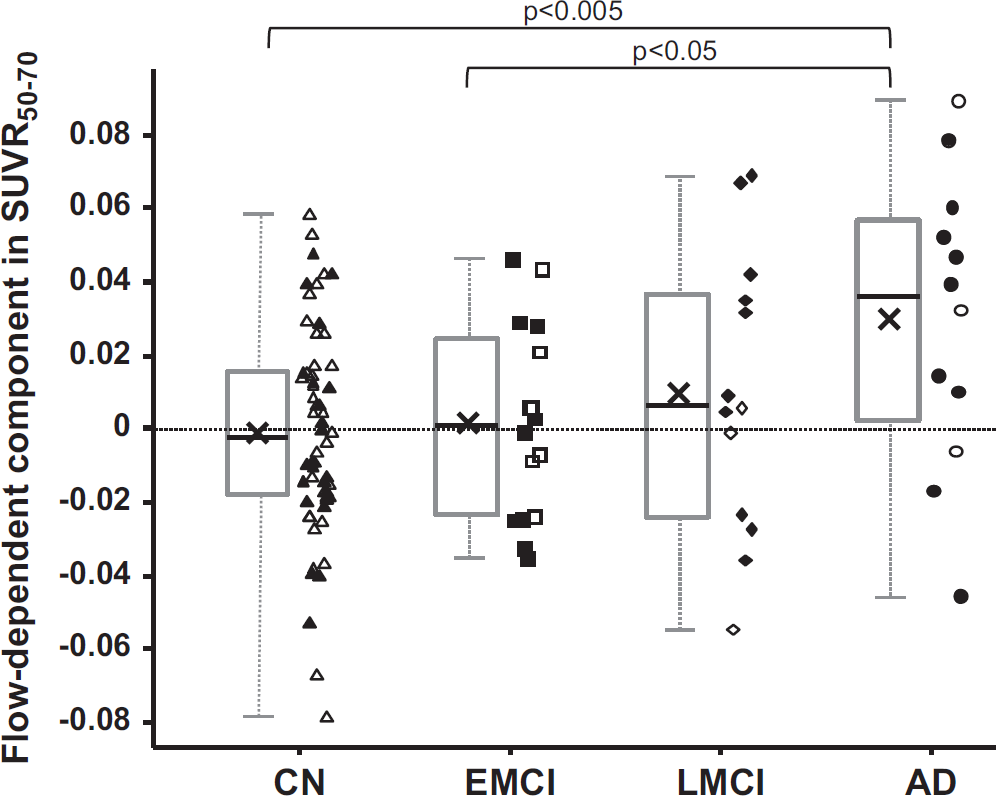
Box plots of flow-dependent component in SUVR50–70 in the four subject groups: CN, EMCI, LMCI, and AD. The gray boxes indicate the upper and lower quartiles, the black lines in the boxes show the median, the black x marker the mean and the whiskers indicate the minimum and maximum values. Individual data points are also plotted with open symbols showing amyloid negativity and filled symbols indicating amyloid positivity. Points are randomly shifted horizontally to decrease visual clutter. Significant group differences are indicated above the plot with the corresponding P-value cutoff (two-tailed, two-sample t-test). AD, Alzheimer's disease; CN, cognitively normal; EMCI, early mild cognitive impairment; LMCI, mild cognitive impairment; SUVR, standardized uptake value ratio.
Detailed results of the three additional analyses are presented in the Supplementary material. In short, the multivariate analysis yielded a fitted plane with a slope along the R1 axis of −0.40 (95% CI: - 0.61 to − 0.23) in the first, - 0.34 (95% CI: - 0.46 to − 0.23) in the second and −0.83 (95% CI: - 1.32 to − 0.50) in the third additional analysis, respectively.
DISCUSSION
Aβ aggregates, which may take the form of diffuse plaques or dense core, neuritic plaques, are a major pathologic hallmark of AD with postmortem histopathologic detection of neuritic plaques contributing to the definitive diagnosis of the disease. 39 A gradual increase in amyloid plaque load over the years preceding clinical onset has been described in the literature.8,12 However, there is less consistency among reports regarding the presence of further increase in amyloid load after clinical onset.6,8–10,13–15 In contrast, changes in brain structure (atrophy), rCBF (hypoperfusion), and function (hypometabolism) have been unequivocally shown for both the preclinical and clinical phases of AD.29,30 In this context, one can note that in vivo quantification of cerebral amyloid using PET imaging necessarily involves the delivery and removal of intravenously injected radioligand to and from brain tissue. Consequently, longitudinal changes in rCBF may lead to altered radioligand kinetics. The possible presence of such effects on SUVR-based estimates for amyloid plaque load have recently been suggested from experimental data and further highlighted by use of simulations. 28 The present work is the first direct quantification of the effect of relative rCBF differences on quasi-steady-state SUVR using single-occasion experimental data. Using a multivariate TLS regression approach for [ 18 F]AV45 data, the aim was to disentangle the blood flow-dependent component of the quasi-steady-state SUVR50–70 values that are typically used to assess amyloid load in a clinical setting. The main finding is a significant negative relationship between relative rCBF (R1) and SUVR50–70 with an ~0.04 unit increase in SUVR50–70 for every 0.1 unit decrease in R1.
The observed effects on SUVR50–70 may not at first appear to be large yet the implications of these findings can be substantial in the context of longitudinal monitoring of Aβ load as a biomarker of disease progression for drug development. Even though no longitudinal data for [ 18 F]AV-45 have been published to date yet longitudinal [ 11 C]PIB results may anyhow be considered thanks to the aforementioned head-to-head data for these radioligands. Assuming an approximately 60% lower affinity of [ 18 F]AV-45 (ref. 40) the 0.025 to 0.050 SUVR/year change reported in MCI/AD using [ 11 C]PIB may correspond to an [ 18 F]AV-45 change of 0.015 to 0.030 SUVR/year. Thus, the blood flow effects of 0.01 and 0.03 observed in LMCI and AD, respectively, in the present analysis appear to be comparable to the indirectly estimated annual change values in the SUVR values for [ 18 F]AV-45 binding.
Consequently, it is plausible that the reported longitudinal increase in SUVR after clinical onset of AD is apparent and influenced by longitudinal reductions in rCBF. At present, it cannot be excluded that there is no increase in amyloid load beyond clinical onset of AD. This observation is of particular importance for drug trials with longitudinal amyloid imaging, which recruit patients reaching clinical onset before or potentially during the trial period, i.e., AD or LMCI patients. Specifically, the uncertainty as to the true rate of amyloid accumulation in such populations poses challenges to confidently calculate the power to determine the necessary subgroup sample sizes.
In the primary analysis, only gray-matter dominated voxels were selected for both the target and reference regions since this approach allows for the most straightforward interpretation of the findings with a typical expected R1 parameter in healthy tissue of 1. The first two additional analyses in the current paper evaluated the use of white-matter rich whole cerebellar reference region and unsegmented target regions (see Supplementary material). As expected, the parameters of the fitted multivariate plane were somewhat different yet, importantly, the calculated negative slope along the R1 axis was anyhow significant and the group differences were similar so that implications and the final conclusions are the same. Therefore, it appears that the challenges posed by the blood flow effect cannot be addressed by the choice of reference region.
The third additional analysis evaluated the influence of PVE on the observed relationships between the parameters. Partial volume effect in PET images comprises spill-out of measured radioactivity signal from cortical regions and spill-in of radioactivity from adjacent white matter. Together with an influence of changes in rCBF, PVEs may result in the alteration of the kinetic parameters (R1, DVR, and SUVR) in complex ways. The analysis indicates that PVE overall dampens the dynamic range of all three parameters in such a way that both slopes of the bivariate TLS-fitted plane are more shallow without PVE correction (i.e., in the main analysis) than with it (i.e., in the third additional analysis). In other words, PVEs do not create the observed blood-flow effects, rather they appear to reduce the influence of rCBF to some extent. Importantly, however, the blood flow effect was anyhow persistent across all variants of the TLS analysis. Furthermore, the observed groupwise trends and differences were also similar across analyses albeit the P values were somewhat less significant in the PVE correction-based analysis probably due to more variance in the corrected data. In conclusion, the observed relationship between the parameters, importantly that between SUVR50–70 and R1, in the main analysis do not appear to be simply the consequence of PVEs. Nonetheless, the influence of PVEs on quantification should also anyhow be considered in longitudinal studies especially in AD patients with more rapidly progressing cortical atrophy.
A limitation of the current paper is that only [ 18 F]AV-45 data was used in the analysis. However, it can be assumed that such effects would impact all radioligands when using the quasi-steady-state SUVR approach. In any case, in the future the blood flow effect should be estimated from experimental data for other radioligands as well. A further limitation was that the PET and TAC data had a gap (20 to 50 minutes p.i.). However, the impact on graphical analysis, used to estimate DVR, should in theory be limited. First, the profiles of the cumulative integrals of the TACs of the target and reference regions were well captured for the important phases, i.e., early distribution and quasi-steady-state. Second, due to the trapezoidal integration of TAC data, used in calculating the points for the graphical plot, the missing TAC data between 20 and 50 minutes p.i. were effectively approximated by linear interpolation. Furthermore, the preparatory analysis, described in Materials and methods, also suggested that the data gap may have limited influence on the graphical DVR estimates such that any consequent error in the estimated slope along the R1 axis in the TLS fit should be within 10% (data not shown). Thus, the data gap likely did not account for the effect shown in the main analysis.
Another limitation of the present work is that coregistration and smoothing parameters used in the preprocessing of PET data had to be recalculated since they were not readily available in the ADNI database. However, comparisons between the ADNI-provided and the recalculated average PET images indicated excellent voxelwise correlation and agreement between the two variants (R 2 value of 0.996 ± 0.0037 for voxelwise intensities across subjects and a bias in global cortical SUVR50–70 of 0.0002 ± 0.0061, min: - 0.0296, max: 0.0242). As such, the use of recalculated parameters should not have caused the observed effect of relative differences in rCBF.
An additional potential concern is that the PET data used originate from multiple imaging sites and from different PET systems. First, it is good to point out that the ADNI protocol has standardized image acquisition parameters and a preprocessing scheme yielding images with harmonized resolution so measured regional kinetics of the tracer should not be expected to be substantially different between subjects. Second, the possible influence of the aforementioned heterogeneity was anyhow evaluated by data partitioning: by repeating the TLS analysis several times on subsets of data so that only certain sites and/or PET systems were included at each run. Importantly, the TLS-fitted planes from all such subanalyses were very similar to the main analysis: both slopes (along the DVR and R1 axes, respectively) were statistically significantly different from zero but not significantly different from the estimates in the main analysis (detailed data not shown). As such the results presented appear to be robust and should not simply be the consequence of multisite heterogeneity. In any case, further line of research on the influence of rCBF changes on the quantification of longitudinal amyloid accumulation would benefit from dedicated studies tailor-made for that purpose. Finally, the multicenter nature of the ADNI data can be viewed as an advantage aiming to understand the practical importance of the effect of rCBF changes in the context of large applied clinical studies and drug trials with similar multisite designs.
Based on the present findings, it appears that valid, accurate longitudinal monitoring of Aβ load requires at the minimum a correction of the quasi-steady-state SUVRs. Such a correction may be possible to some degree with the help of early acquisition or perhaps separate [ 18 F]FDG data. 35 Preferably, however, it is advisable to use an acquisition protocol and quantification approach that is free from blood flow effects in the first place, such as a continuous (4D) quantitative PET acquisition with DVR estimation using graphical analysis or nonlinear modeling.
In summary, the current findings suggest that changes in rCBF can in essence produce an effect on quasi-steady-state SUVR values that are at a similar level as the previously reported annual SUVR increases, i.e., equivalent to a 2% to 5% apparent increase in amyloid burden in LMCI/AD. Therefore, future longitudinal studies, either in basic research on disease pathophysiology or in drug efficacy trials, must account for the blood flow effect by measuring amyloid changes in a way that is not sensitive to this effect. The best-suited option for this purpose is quantitative PET imaging providing DVR estimates. Finally, the hereby experimentally implicated uncertainty as to the true rate of amyloid accumulation after clinical onset highlights the challenges of using this biomarker in clinical drug trials in LMCI/AD patients.
DISCLOSURE/CONFLICT OF INTEREST
The first (ZC) and second (LF) authors are, respectively, full and part time employees of, and both are shareholders in AstraZeneca.
Footnotes
ACKNOWLEDGMENTS
Data collection and sharing for this project was funded by the Alzheimer's Disease Neuroimaging Initiative (ADNI) (National Institutes of Health Grant U01 AG024904) and DOD ADNI (Department of Defense award number W81XWH-12-2-0012). ADNI is funded by the National Institute on Aging, the National Institute of Biomedical Imaging and Bioengineering, and through generous contributions from the following: Alzheimer's Association; Alzheimer's Drug Discovery Foundation; Araclon Biotech; BioClinica, Inc.; Biogen Idec Inc.; Bristol-Myers Squibb Company; Eisai Inc.; Elan Pharmaceuticals, Inc.; Eli Lilly and Company; EuroImmun; F. Hoffmann-La Roche Ltd and its affiliated company Genentech, Inc.; Fujirebio; GE Healthcare; Innogenetics, N.V.; IXICO Ltd.; Janssen Alzheimer Immunotherapy Research & Development, LLC.; Johnson & Johnson Pharmaceutical Research & Development LLC.; Medpace, Inc.; Merck & Co., Inc.; Meso Scale Diagnostics, LLC.; NeuroRx Research; Neurotrack Technologies; Novartis Pharmaceuticals Corporation; Pfizer Inc.; Piramal Imaging; Servier; Synarc Inc.; and Takeda Pharmaceutical Company. The Canadian Institutes of Health Research is providing funds to support ADNI clinical sites in Canada. Private sector contributions are facilitated by the Foundation for the National Institutes of Health (![]() ). The grantee organization is the Northern California Institute for Research and Education, and the study is coordinated by the Alzheimer's Disease Cooperative Study at the University of California, San Diego. ADNI data are disseminated by the Laboratory for Neuro Imaging at the University of Southern California.
). The grantee organization is the Northern California Institute for Research and Education, and the study is coordinated by the Alzheimer's Disease Cooperative Study at the University of California, San Diego. ADNI data are disseminated by the Laboratory for Neuro Imaging at the University of Southern California.
References
Supplementary Material
Please find the following supplemental material available below.
For Open Access articles published under a Creative Commons License, all supplemental material carries the same license as the article it is associated with.
For non-Open Access articles published, all supplemental material carries a non-exclusive license, and permission requests for re-use of supplemental material or any part of supplemental material shall be sent directly to the copyright owner as specified in the copyright notice associated with the article.