
Abstract
Arterial spin labeling (ASL) magnetic resonance imaging (MRI) utilizes arterial blood water as an endogenous contrast agent to provide a quantitative measure of cerebral blood flow (CBF). Recently, hyperintense signal within dural venous sinuses in ASL images of sickle cell anemia (SCA) patients has been shown to be consistent with elevated flow velocities and may indicate capillary shunting and reduced oxygen extraction. Here, we performed oxygen extraction fraction (OEF) and CBF measurements in adults (cumulative n = 114) with (n = 69) and without (n = 45) SCA to test the hypothesis that hyperintense venous ASL signal is associated with reduced OEF. Higher categorical scores of shunting on ASL MRI were associated with lower OEF in participants with silent cerebral infarcts or white matter hyperintensities (p = 0.003), but not in those without lesions (p = 0.551). These findings indicate that venous hyperintense signal in ASL images in SCA patients may represent a marker of capillary-level disturbances in oxygen exchange efficiency and small vessel pathology.
Keywords
Introduction
Sickle cell anemia (SCA) is an inherited blood disorder in which erythrocyte production with hemoglobin-S results in hemolytic anemia,1,2 and the resulting reduction in the oxygen carrying capacity of blood leads to an elevated risk for ischemia and overt stroke.3,4 While recent progress has been made in our understanding of potential cerebral hemodynamic risk factors for overt stroke in adults with SCA5 and physiological response to therapy,6–8 less is known regarding the pathophysiology underlying silent cerebral infarcts (SCI) and white matter hyperintensities (WMH). Importantly, SCA patients have reduced prevalence of traditional stroke risk factors, and less than 15% have intracranial and extracranial vasculopathy. As such, the etiology of such infarcts is likely at least partly attributable to microvascular and tissue-level pathology.
While initially clinically silent, such lesions are associated with progressive decline of cognitive function in numerous disorders, 9 including SCA where they have been shown to be present in upwards of 50% of adults by 30 years of age. 10 Recent studies have also underscored the importance of studying the physiology of such lesions, particularly SCI, 11 indicating that presence of SCI may represent a risk factor for future SCI. 12 Elucidating functional changes that occur prior to this brain injury could identify avenues for therapeutic intervention aimed at slowing or preventing the burden of cognitive decline due to lesions.
Hemodynamic magnetic resonance imaging (MRI) methods including arterial spin labeling (ASL) 13 are being used with increasing frequency to elucidate mechanisms of hemodynamic impairment, 14 including in patients with SCA.15–18 In the pseudo-continuous implementation of ASL, a train of radiofrequency pulses is used to label arterial blood water as it passes through the cervical arteries. 19 After a post-labeling delay, which ideally allows for labeled blood water to reach cerebral capillaries and exchange with tissue water, 20 a fast readout is used to acquire cerebral blood flow (CBF)-weighted images. Quantitative cerebral blood flow (CBF; ml blood/100 g tissue/minute) images are calculated upon subtraction of these labeled images from control images in which no tagging of blood water occurs, and subsequent application of the solution to the flow modified Bloch equation. 21 In healthy parenchyma, there is believed to be near-complete exchange between blood water and tissue water at the capillary level due to the relatively long capillary transit time of approximately 1 s. In such cases, the venous magnetization is nearly identical between the control and label conditions, and the CBF map does not contain venous signal. However, if the transit of blood through capillaries is accelerated, 22 labeled arterial blood water may traverse the capillaries rapidly and pass into the venous system without exchanging with tissue water. This so-called capillary shunting would manifest as venous hyperintense signal on ASL images, which has previously been shown to be associated with higher arterial blood velocities. 23
Alterations in tissue-level hemodynamic function as compensation for anemia have been demonstrated in individuals with SCA in the form of CBF upregulation, which can manifest through increases in arterial blood velocity and/or in cerebral blood volume. 24 Given that oxygen exchange efficiency is partially dependent on the rate of blood and water transit through the capillary bed, 25 we and others have posited that elevated blood velocities in patients with SCA could result in capillary shunting.17,23 Importantly, such shunting effects could lead to suboptimal oxygen delivery to brain tissue despite compensatory increases in CBF, as has recently been observed using contrast-based perfusion methods in patients with neurodegeneration.25,26 The purpose of this work was to test whether venous hyperintense signal in ASL MRI may also be an indicator of impaired tissue-level hemodynamic function, particularly reduced oxygen extraction fraction (OEF), in adults with SCA. In addition, we sought to understand how relationships between venous hyperintense signal and tissue-level physiology may be affected by the presence of SCI and WMH in adults with and without SCA.
Materials and methods
Participant demographics
All components of this study were performed in compliance with the Declaration of Helsinki of 1975 (and as revised in 1983) and the Health Insurance Portability and Accountability Act. All protocols were approved by the Vanderbilt University Medical Center Institutional Review Board (IRB Study 140915), and all participants (n = 125) provided informed, written consent for this prospective cross-sectional study. Individuals with SCA (n = 77), defined as phenotype hemoglobin SS or Sβ0-thalassemia, were recruited from a comprehensive sickle cell disease clinic. Exclusion criteria for all subjects included pregnancy or other contraindications to MRI, poor volume coverage in ASL imaging, or excessive motion during the scan session. Age- and race-matched control volunteers without SCA or sickle trait (n = 48) were also recruited. Exclusion criteria for control participants included sickle cell trait (as confirmed by high performance liquid chromatography), and incidental, significant structural abnormalities on MRI of the brain not deemed to be of vascular origin.
Neurological examination
All participants with SCA had a detailed clinical history and underwent a neurological examination by a stroke neurologist (LCJ).
MRI acquisition
MRI data were acquired using a 3.0 T Philips whole-body scanner (Philips Healthcare, Best, The Netherlands). Non-sedated MRI scanning of the head without contrast was performed using a body coil for radiofrequency transmission and a 16-channel neurovascular coil for reception. Blood hematocrit values were measured for each participant via venipuncture within seven days of the scan. Arterial oxygen saturation values were obtained from pulse oximetry at the time of imaging.
Structural imaging and angiography
T1-weighted imaging for tissue segmentation was performed using a magnetization-prepared-rapid-gradient-echo sequence (repetition time (TR)/echo time (TE) = 8.2/3.7 ms; spatial resolution = 1.0 × 1.0 × 1.0 mm3). Fluid-attenuated inversion recovery (FLAIR) MRI (TR/TE = 11,000/120 ms; inversion time = 2800 ms; spatial resolution = 1.0 × 1.1 × 4.0 mm3) was performed in two planes (axial and coronal) for assessment of infarcts and WMHs. Diffusion-weighted imaging (DWI; TR/TE = 2924/83 ms; b = 0 and 1000 s/mm2; spatial resolution = 1.8 × 1.8 × 4 mm3) was performed to assess for acute lesions. Time-of-flight MR angiography (MRA) of the head (TR/TE = 23/3.5 ms; spatial resolution = 0.6 × 0.6 × 0.7 mm3) was performed to assess stenosis of major intracranial vessels. Time-of-flight MRA of the neck (TR/TE = 18.6/3.2 ms; spatial resolution = 0.9 × 0.9 × 3.0 mm3) was performed to assess cervical stenosis.
Arterial spin labeling MRI
Pseudo-continuous ASL (pCASL) MRI was performed for the measurement of CBF and assessment of venous hyperintense signal with 20 blocks of alternating acquisitions with and without spin labeling. Labeling of arterial blood water (total duration = 1000 ms) was achieved using a train of Hanning-windowed block pulses in a 13-mm thick plane placed 93 mm inferior to the center of the corpus callosum and approximately 10 mm inferior to the confluence of the vertebral arteries. The shorter labeling duration of 1000 ms was used here as the pCASL scan analyzed was also part of a broader multiple post-labeling delay protocol, and the shorter duration was required to sensitize the sequence to blood arrival. Images of the brain containing labeled blood were acquired following a post-labeling delay = 1900 ms using a multi-slice 2D single-shot echo planar gradient-echo readout (TR/TE = 3675/13 ms; spatial resolution = 3.0 × 3.0 × 7.0 mm3). Background suppression was not utilized to avoid slice-dependence of the signal-to-noise ratio. An identical readout scheme was used for images with no labeling of blood water. Equilibrium magnetization (M0) images were acquired following the ASL scan using a similar readout technique, without spin labeling and with TR = 15,000 ms.
T2-relaxation-under-spin-tagging MRI
T2-relaxation-under-spin-tagging (TRUST) 27 MR data were acquired for whole-brain OEF assessment. Labeling of venous blood water was achieved with sinc-gauss inversion applied to the cerebrum followed by a delay time = 1022 ms during which a non-selective T2 preparation module that provided variable T2-weighting was used with effective echo times (eTEs) = 0, 40, 80, and 160 ms. Single-slice images were then acquired with an echo planar gradient-echo readout (TR/TE = 1978/3.6 ms; spatial resolution = 3.4 × 3.4 mm2) at the level of the superior sagittal sinus approximately 20 mm above the confluence of the sagittal and transverse sinuses (averages = 3 per eTE). An identical readout scheme was used for the images with no labeling of venous blood water.
Data processing
Venous hyperintense signal
CBF-weighted images were calculated from the pCASL data by pair-wise subtraction of images with and without spin labeling. These CBF-weighted images were transformed into structural (T1-weighted) native space. Three reviewers (stroke neurologist: LCJ, neuroradiologist: TLD, and imaging physicist: MRJ) who were blinded to status as SCA versus control participant and other imaging findings independently assessed for venous hyperintense signal. The presence of hyperintense signal was assessed in major dural venous sinuses, including the superior sagittal sinus, inferior sagittal sinus, and the straight sinus (Figure 1). Venous hyperintensity scores (VHS) of 0 = no venous hyperintensity, 1 = focal hyperintensity, or 2 = diffuse hyperintensity were assigned to each participant based on reviewer consensus; this consensus hyperintensity score was used in all subsequent analyses.
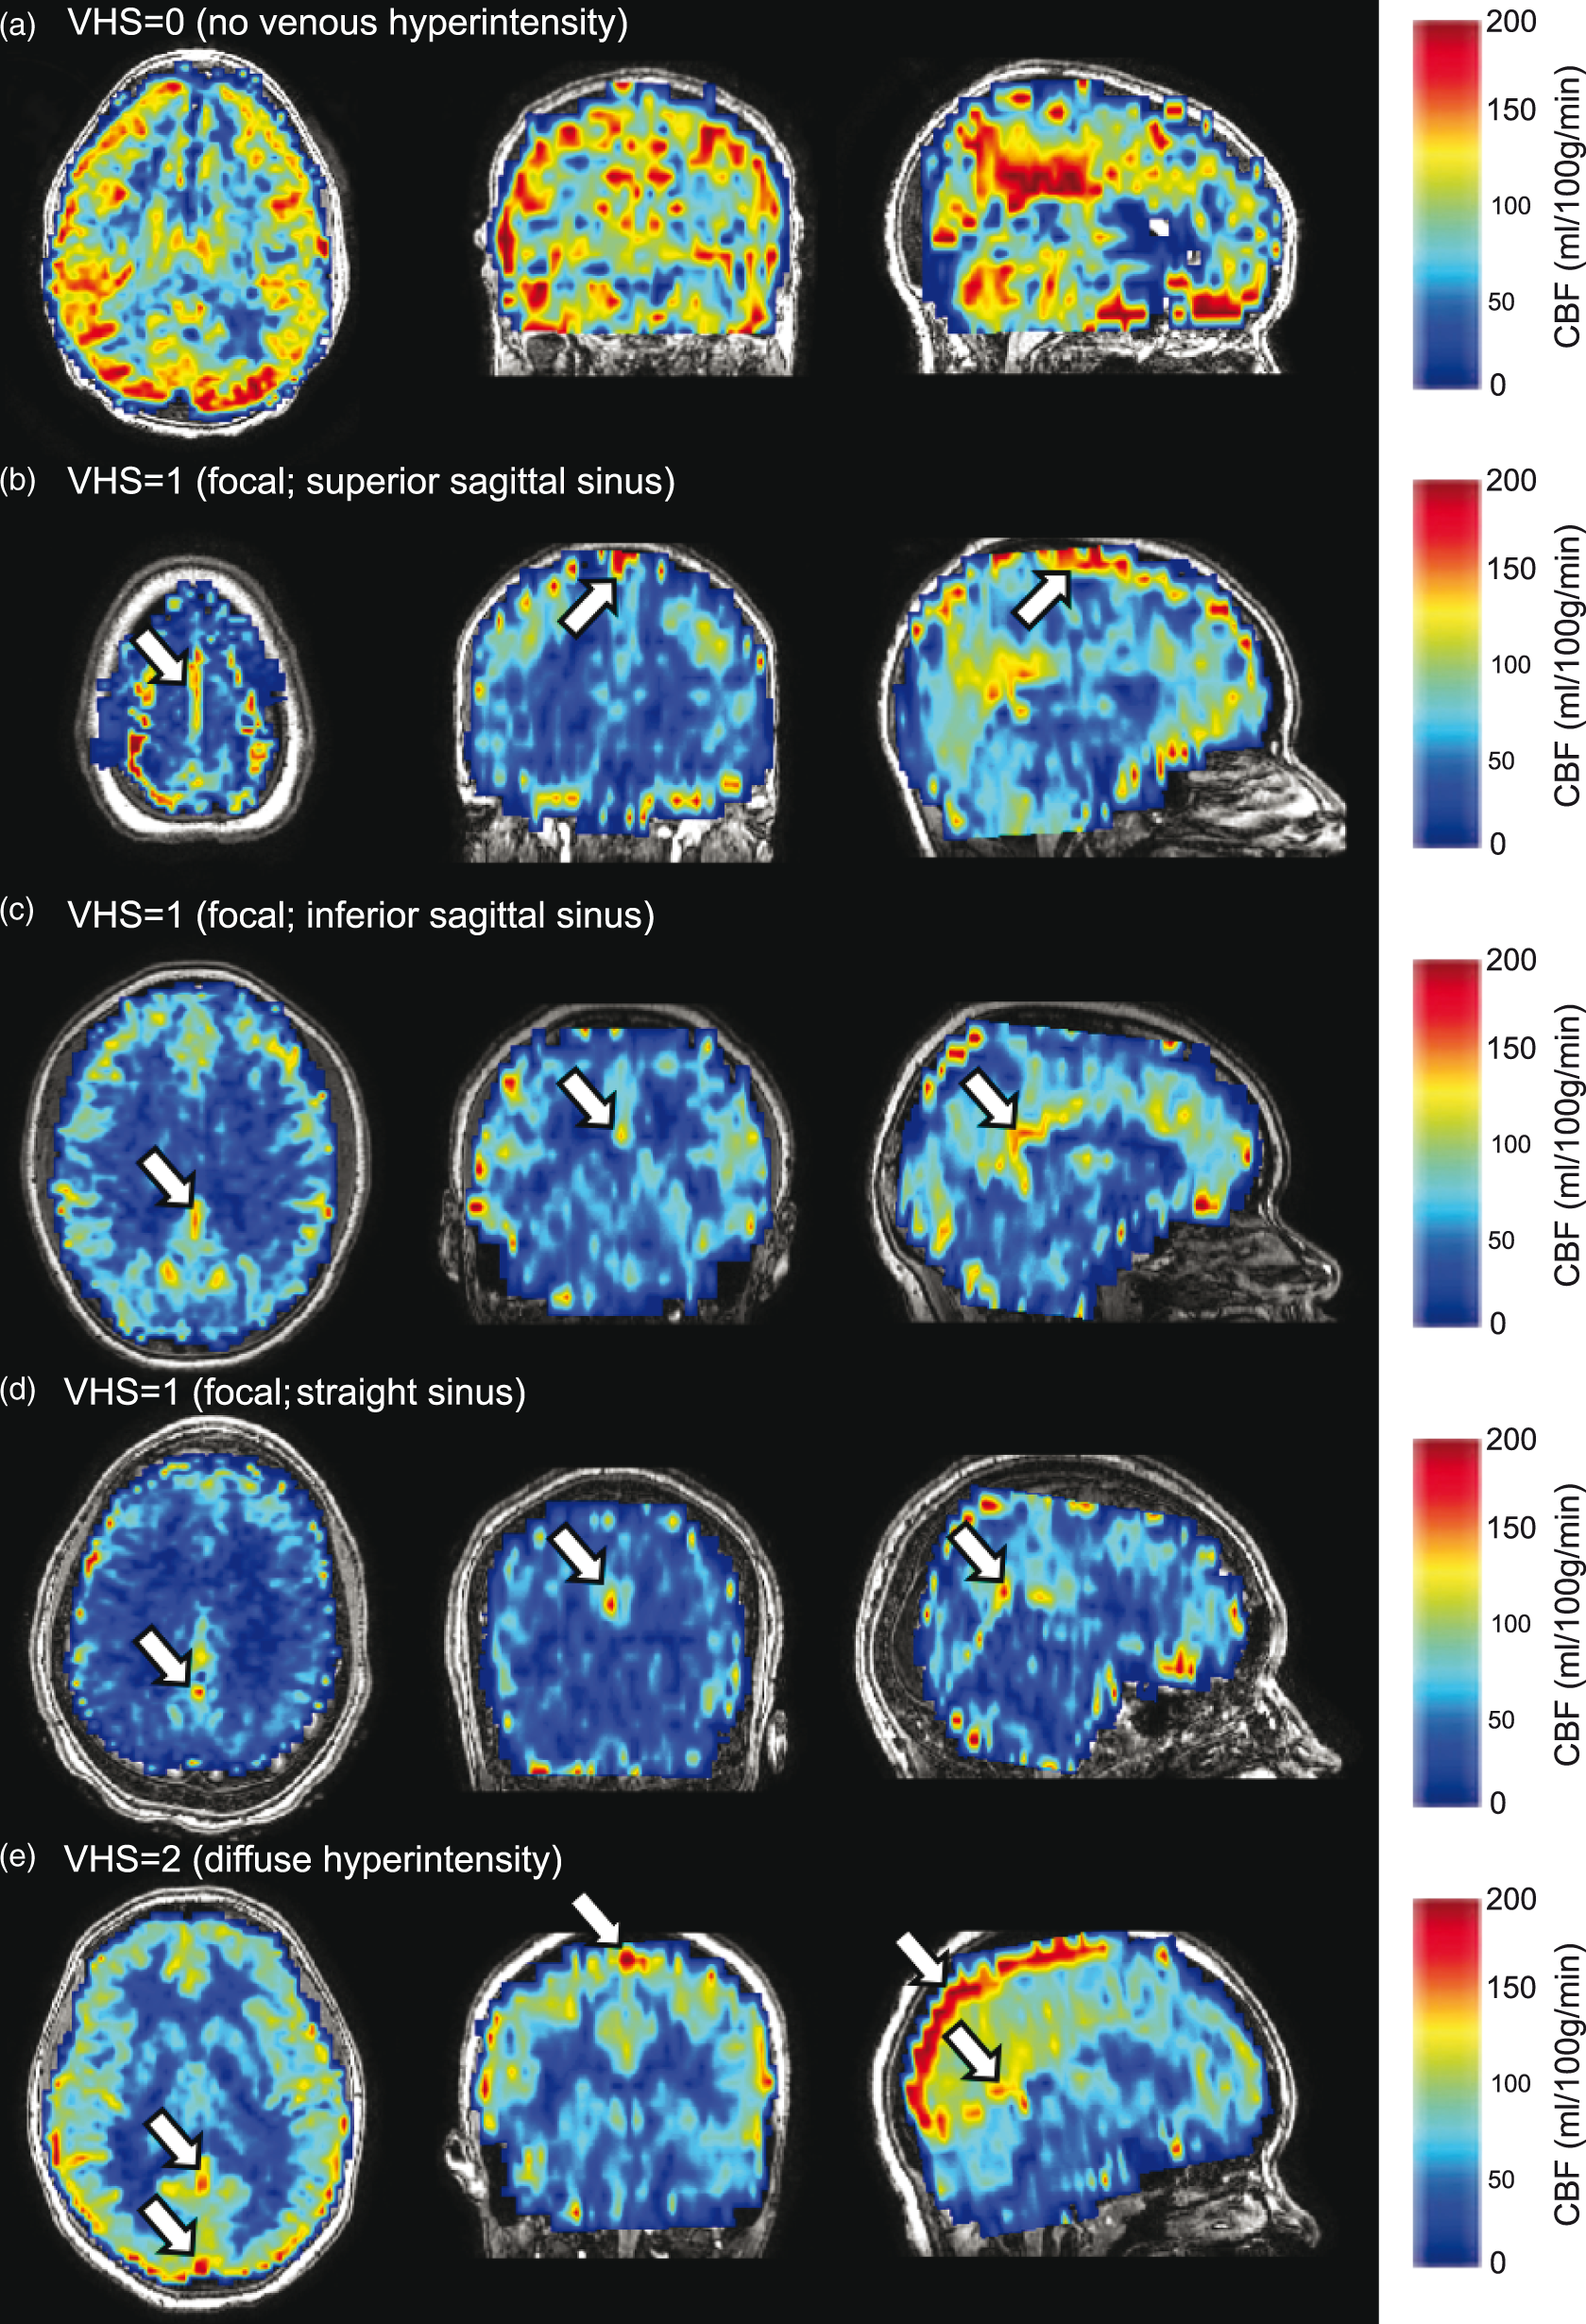
Venous hyperintense signal assessment: Representative examples of venous hyperintense signal (white arrows) in controls (b–d) and adults with sickle cell anemia (a, e) are shown on cerebral blood flow (CBF) maps overlaid on anatomical (T1-weighted) images and windowed to allow visualization of hyperintensities. A venous hyperintensity score (VHS)=0 was assigned if no hyperintense signal was observed (a). A grade of VHS = 1 was assigned if focal signal hyperintensities were observed in the superior sagittal sinus (b), inferior sagittal sinus (c) or straight sinus (d). A grade of VHS = 2 was assigned if signal hyperintensities were diffused and could be traced along the superior sagittal sinus to the level of the confluence of the sinuses, with or without hyperintensities in the inferior or straight sinuses (e).
Volumetrics and characterization of lesions
T1-weighted images were skull-stripped 28 and segmented 29 into gray matter, white matter, and cerebrospinal fluid using standard FSL routines (FMRIB; Oxford, UK). Gray matter and white matter volumes were calculated from the segmentations and normalized to intracranial volume to yield volume fractions. Anatomical imaging was reviewed independently by two board-certified neuroradiologists (LTD and SP), and disagreements were resolved via consensus. Infarcts were defined using standard SCA criteria as areas of signal hyperintensities on T2-weighted FLAIR of size ≥3 mm in diameter in one imaging plane and visible in both axial and coronal planes. 30 Infarcts were further classified as overt or silent. Our classification of small vessel infarcts included lacunes of presumed vascular origin, a term that is often used in the adult cerebral small vessel disease literature. WMH were defined as lesions in the white matter of size ≤3 mm for consistency with SCA literature. Participants were classified into three groups by their most significant ischemic lesion(s): overt stroke, SCI and/or WMH, or no lesions/normal MRI of the brain. No participants had evidence of hyperacute lesions on DWI.
Neurological examination
To classify infarcts as overt or silent, the results of the neurological exam were interpreted together with the radiological findings. If the neurological examination was normal or an abnormality on neurologic examination could not be explained based on location of the infarct-like lesion, infarcts were judged to be silent. 30
Cerebral blood flow
CBF was quantified from the CBF-weighted pCASL data using a two-compartment kinetic model.
31
Subject-specific arterial blood longitudinal relaxation times (T1) were calculated based on measured hematocrit,
32
while tissue T1=1.33 s was assumed for all subjects. Mean ASL inversion efficiencies and tissue transit times appropriate for SCA patients (efficiency = 0.72; transit time = 1.02 s) and age-matched controls (efficiency = 0.91; transit time = 1.13) were used as previously measured.
18
Oxygen delivery to the brain was calculated in units of ml O2/100 g tissue/min according to equation (1)16

Oxygen extraction fraction and cerebral metabolic rate of oxygen consumption
Venous blood water T2 was measured by mono-exponential curve-fitting of the TRUST-MRI data across four effective echo times. Calculated venous T2 and measured hematocrit were then converted to venous oxygen saturation using three available calibration models: a bovine blood 33 model calculated over a hematocrit range of 35–55%, a normal human hemoglobin (HbA) model 34 calculated over a larger hematocrit range of 10–55%, and a sickle human hemoglobin (HbS) model calculated over a hematocrit range of 24–40%, but with no hematocrit dependence. 35 Details regarding the different model assumptions are summarized in the Discussion. OEF was calculated separately for each model as the relative ratio between venous oxygen saturation and arterial oxygen saturation, which was measured with pulse oximetry.
As a supplementary analysis, we also considered the cerebral metabolic rate of oxygen consumption (CMRO2), which can be estimated in units of ml O2/100 g tissue/min by combining the above measurements according to equation (2)

Statistical analysis
Statistical analyses were performed using non-parametric methods and with R Statistical Software (R Foundation for Statistical Computing, Vienna, Austria). Comparisons with a two-sided type-I error p ≤ 0.05 were considered significant, and comparisons with two-sided 0.05 < p ≤ 0.10 were also noted as non-significant findings that may be the target of future studies with larger sample sizes. Continuous variables are presented as median (interquartile range). Categorical variables are presented as frequencies.
First, we assessed inter-rater agreement for VHS grading using Fleiss’ κ. We then evaluated whether venous hyperintense signal was more prevalent, and whether degree of venous hyperintense signal was greater, in adults with SCA compared to controls using the Chi-squared test of equal proportions. We also compared differences in prevalence of venous hyperintense signal by sex in the SCA and control groups separately using two-tailed Chi-squared tests.
To understand the effect of overt stroke on tissue volumes, we compared normalized gray and white matter fractions in SCA participants with versus without overt stroke using Wilcoxon rank-sum tests. We also compared gray and white matter fractions in the subgroup of participants without overt stroke but with SCI and/or WMH or without SCI and/or WMH using a similar statistical approach.
To understand any possible relationship between hematocrit, OEF, CBF, oxygen delivery, and the presence and degree of venous hyperintense signal in adults with SCA, we performed the following series of analyses. First, we used a Wilcoxon rank-sum test to determine whether these parameters differed between groups with venous hyperintense signal absent (i.e. VHS = 0) versus present (i.e. VHS > 0). Second, we utilized a Jonckheere-Terpstra test to determine whether each physiological parameter exhibited a monotonic association with increasing VHS degree. To understand the potential effects of lesions on the relationship between venous hyperintense signal and tissue-level physiology, we repeated the second step of this analysis after categorizing the SCA group according to the three levels of impairment: (i) those with overt stroke, (ii) those without overt stroke but with SCI and/or WMH and (iii) those without either class of lesions (normal MRI). We performed these analyses separately in adult controls as appropriate, given the observed venous hyperintense signal and lesion distribution. As a secondary analysis, we performed these comparisons after calculating the CMRO2; as CMRO2 is not a direct measurement but calculated from the above measurements, and is prone to propagation of small measurement errors, we present these results as supplemental data.
Results
Prevalence and demographics of venous hyperintense signal
Demographic, neurological and imaging findings in adults with SCA and adult controls are shown here.
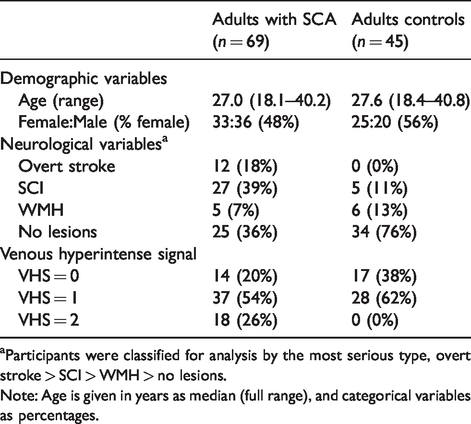
Participants were classified for analysis by the most serious type, overt stroke > SCI > WMH > no lesions.
Note: Age is given in years as median (full range), and categorical variables as percentages.
There was substantial inter-rater agreement between the two raters for assessment of venous hyperintense signal degree across all participants (Fleiss’ κ=0.77; p < 0.001). The degree of venous hyperintense signal, assessed by the prevalence of individuals with VHS = 2, was significantly greater in adults with SCA (18/69; 26%) compared with controls (0/45; 0%) (Chi-squared p < 0.001). Overall, venous hyperintense signal was identified as present (VHS > 0) in 79% (55/69) of adults with SCA and in 62% (28/45) of adult controls without SCA (Chi-squared p = 0.040). However, the relatively high fraction of controls (62%) with VHS = 1, but none with VHS = 2, and a similar fraction of SCA participants having VHS = 1 (54%) is consistent with mild VHS = 1 not being specific to SCA pathology. The proportion of males with VHS > 0 was similar in adults with SCA (29/36; 81%) and controls (16/20; 80%) (p = 0.960), while the proportion of females with VHS > 0 was higher in the SCA group (26/32; 79%) versus controls (13/25; 48%) (Chi-squared p = 0.018). Adults with SCA and VHS > 0 were younger (age = 26.1 [20.8, 28.9] years) compared to SCA adults with VHS = 0 (age = 30.7 [24.7, 32.9] years) (Wilcoxon rank-sum test; p = 0.029). However, no significant association was found between age and VHS degree (Jonckheere-Terpstra test; p = 0.110) in adults with SCA. In adult controls, there was no difference in age between individuals with VHS = 0 (age = 27.5 [25.1, 32.5] years) and VHS = 1 (age = 27.8 [24.9, 32.1] years) (Wilcoxon rank-sum test; p = 0.861).
Volumetrics and lesion burden
In adults with SCA, gray matter volume fraction was not significantly different between participants with prior overt stroke versus those without (Wilcoxon rank-sum p = 0.127; Figure 2(a)), but white matter volume fraction was significantly lower in those with versus without overt stroke (Wilcoxon rank-sum p = 0.031; Figure 2(b)). In adults with SCA without overt stroke, neither gray matter volume fraction (Wilcoxon rank-sum p = 0.508; Figure 2(c)) nor white matter volume fraction (Wilcoxon rank-sum p = 0.571; Figure 2(d)) was different between participants with versus without prior SCI and/or WMH.
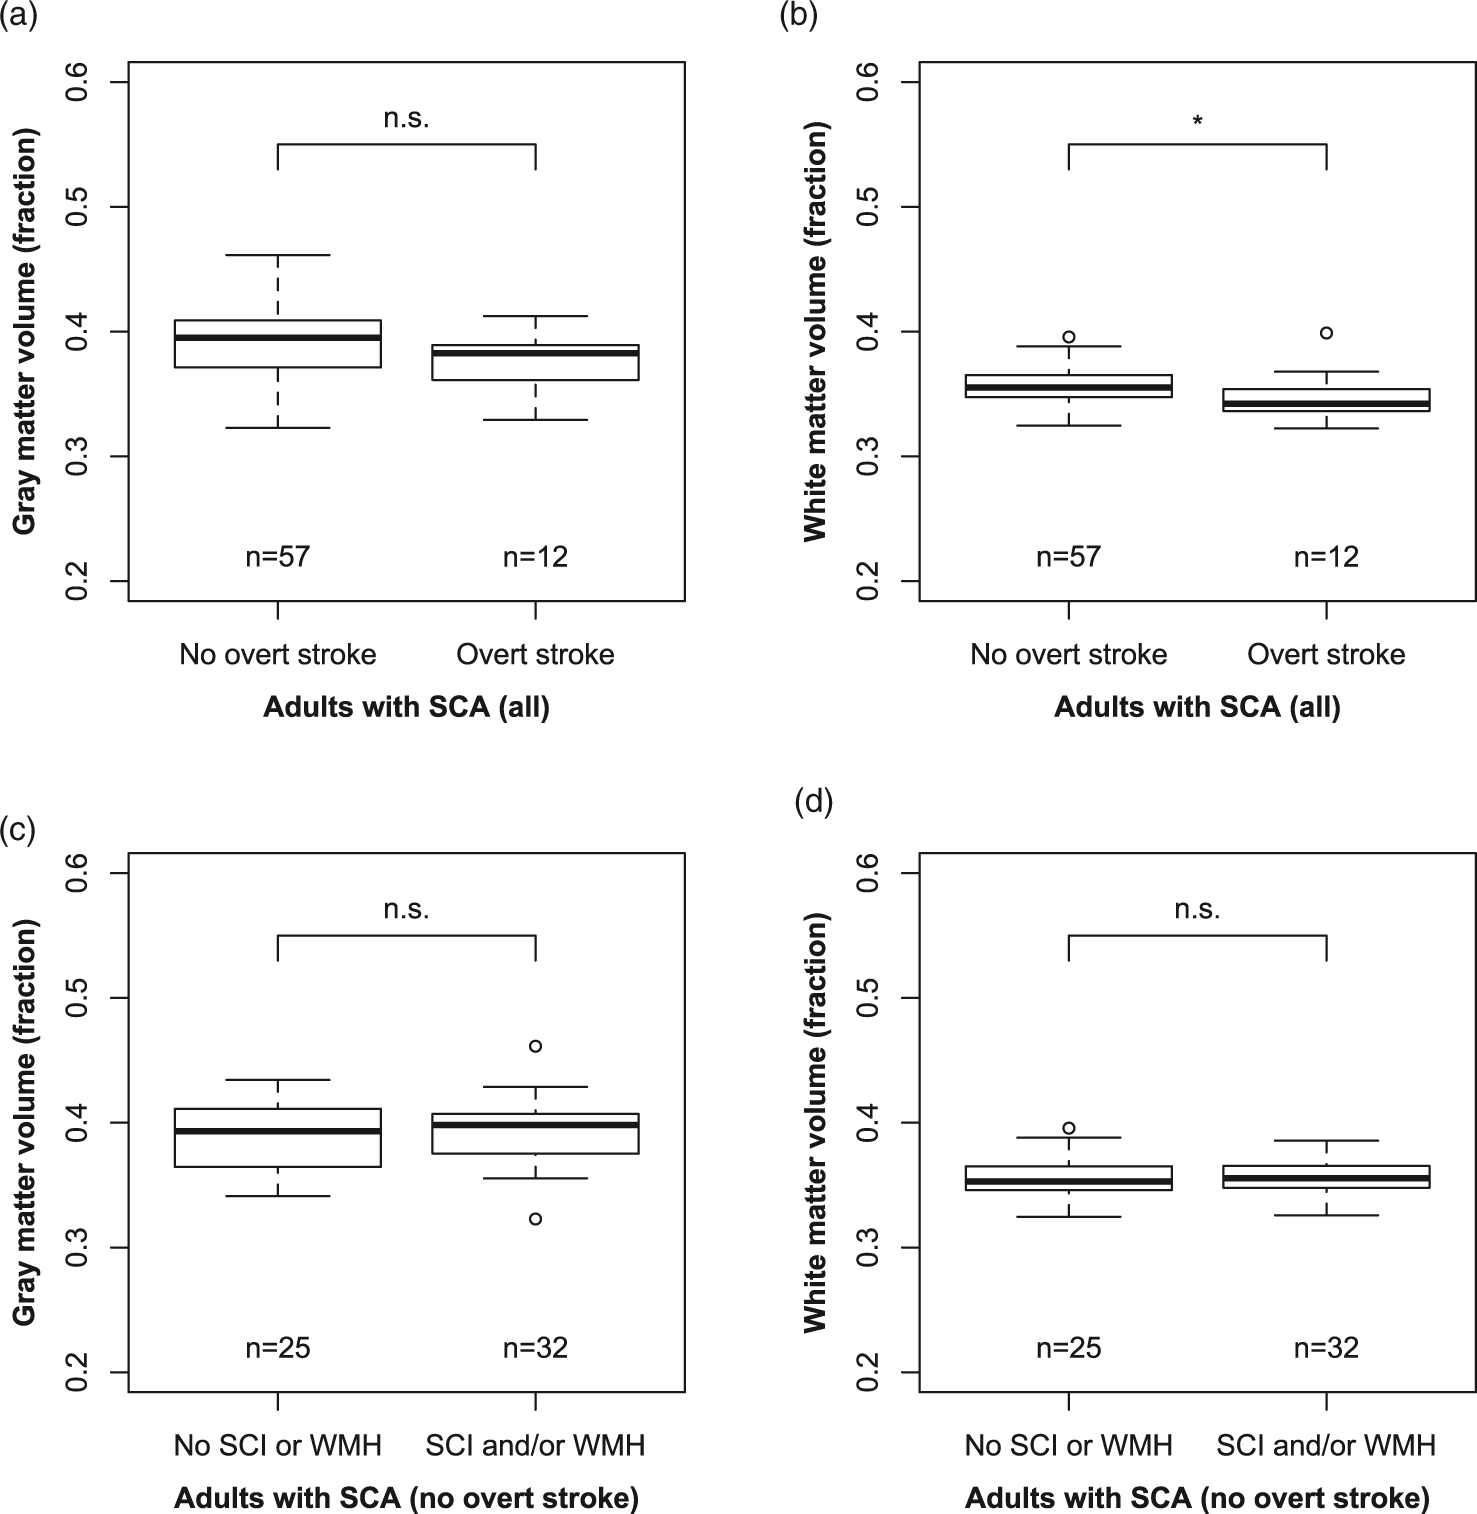
Volumetrics and lesions: Box-and-whisker plots display the association between normalized gray matter volume (a, c), normalized white matter volume (b, d) and history of overt stroke (a, b) and history of silent cerebral infarcts (SCI) or white matter hyperintensities (WMH) (c, d). The central line represents the median, the box represents bounds for the 25th and 75th percentiles, and the lower and upper whiskers represent 1.5 times the interquartile range beyond the 25th and 75th, respectively. Data beyond the whiskers are represented with circles. Statistical results are presented from Wilcoxon rank-sum tests. *p ≤ 0.05, **p ≤ 0.01, and n.s. p > 0.05.
Venous hyperintense signal in adults with sickle cell anemia
In all adults with SCA (n = 69), hematocrit was not significantly different for VHS = 0 (hematocrit = 27.5 [24.5, 29.8] %) compared to VHS > 0 (hematocrit = 25.0 [23.0, 28.0] %) (Wilcoxon rank-sum p = 0.142) participants. However, there was a significant association between hematocrit and degree of venous hyperintense signal (Jonckheere-Terpstra p = 0.010), where higher VHS was associated with lower hematocrit (Figure 3(a)), indicating that participants with VHS = 2 may be driving this association. In the subgroup of adults with SCA and overt stroke (n = 12), there was no significant relationship observed between hematocrit and degree of venous hyperintense signal (Jonckheere-Terpstra p = 0.211) (Figure 4(a)). Similarly, no relationship was observed between hematocrit and venous hyperintense signal degree in adults with SCA without overt stroke but with SCI and/or WMH (n = 32; Jonckheere-Terpstra p = 0.716) (Figure 4(b)). However, a significant inverse relationship was observed between hematocrit and venous hyperintense signal degree in adults with SCA without overt stroke or other lesions (n = 25; Jonckheere-Terpstra p = 0.001), where higher VHS was associated with lower hematocrit (Figure 4(c)).
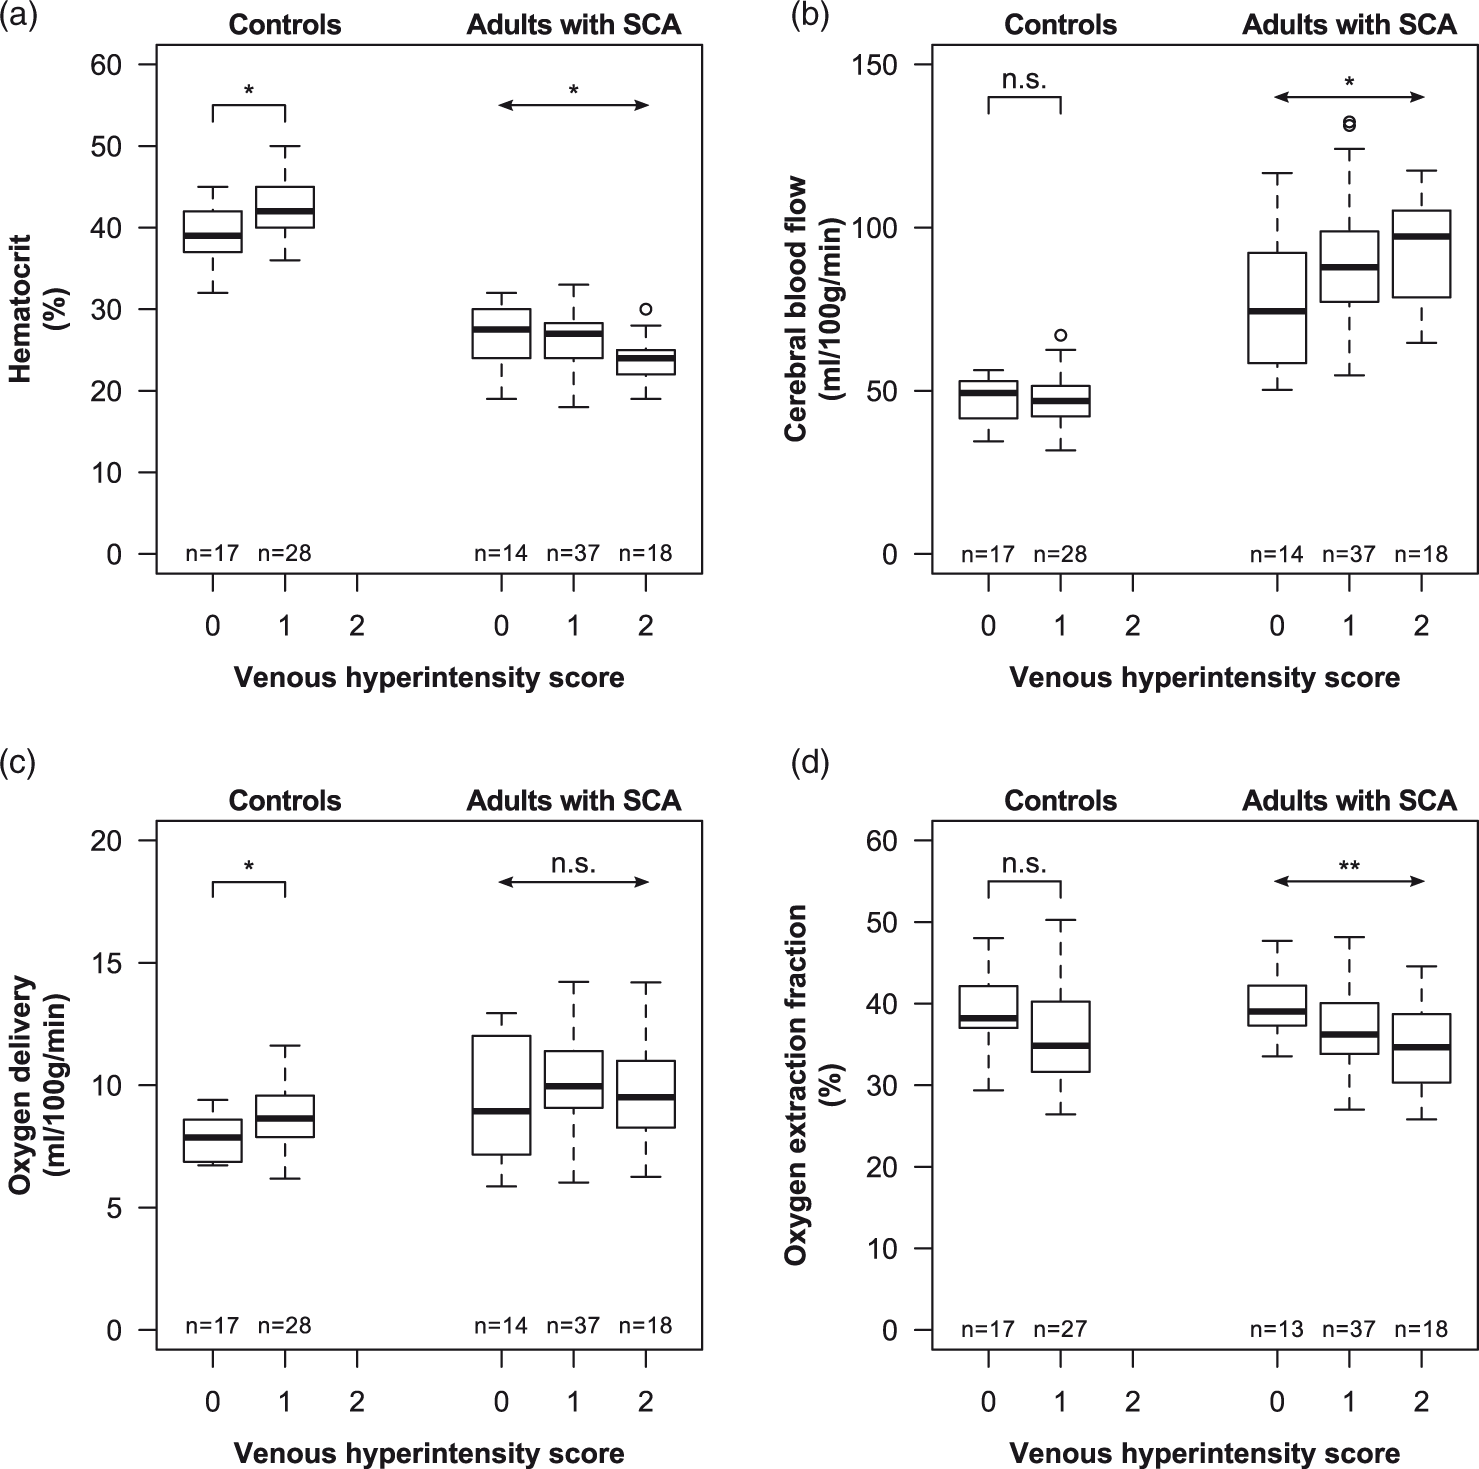
Overall group-level results: Box-and-whisker plots display the association between hematocrit (a), cerebral blood flow (CBF; b), oxygen delivery (c), oxygen extraction fraction (OEF; d) and venous hyperintensity scores (VHS) for controls (left) and adults with SCA (right) with VHS = 0, VHS = 1, and VHS = 2. OEF results shown were calculated using the human HbA calibration model, and one OEF data point each in the SCA VHS = 0 and control VHS = 1 groups were unavailable due to insufficient data quality. Statistical results in controls are presented from Wilcoxon rank-sum tests (notched lines), while results in SCA participants are presented from Jonckheere-Terpstra trend tests (arrows). *p ≤ 0.05, **p ≤ 0.01, and n.s. p > 0.05.
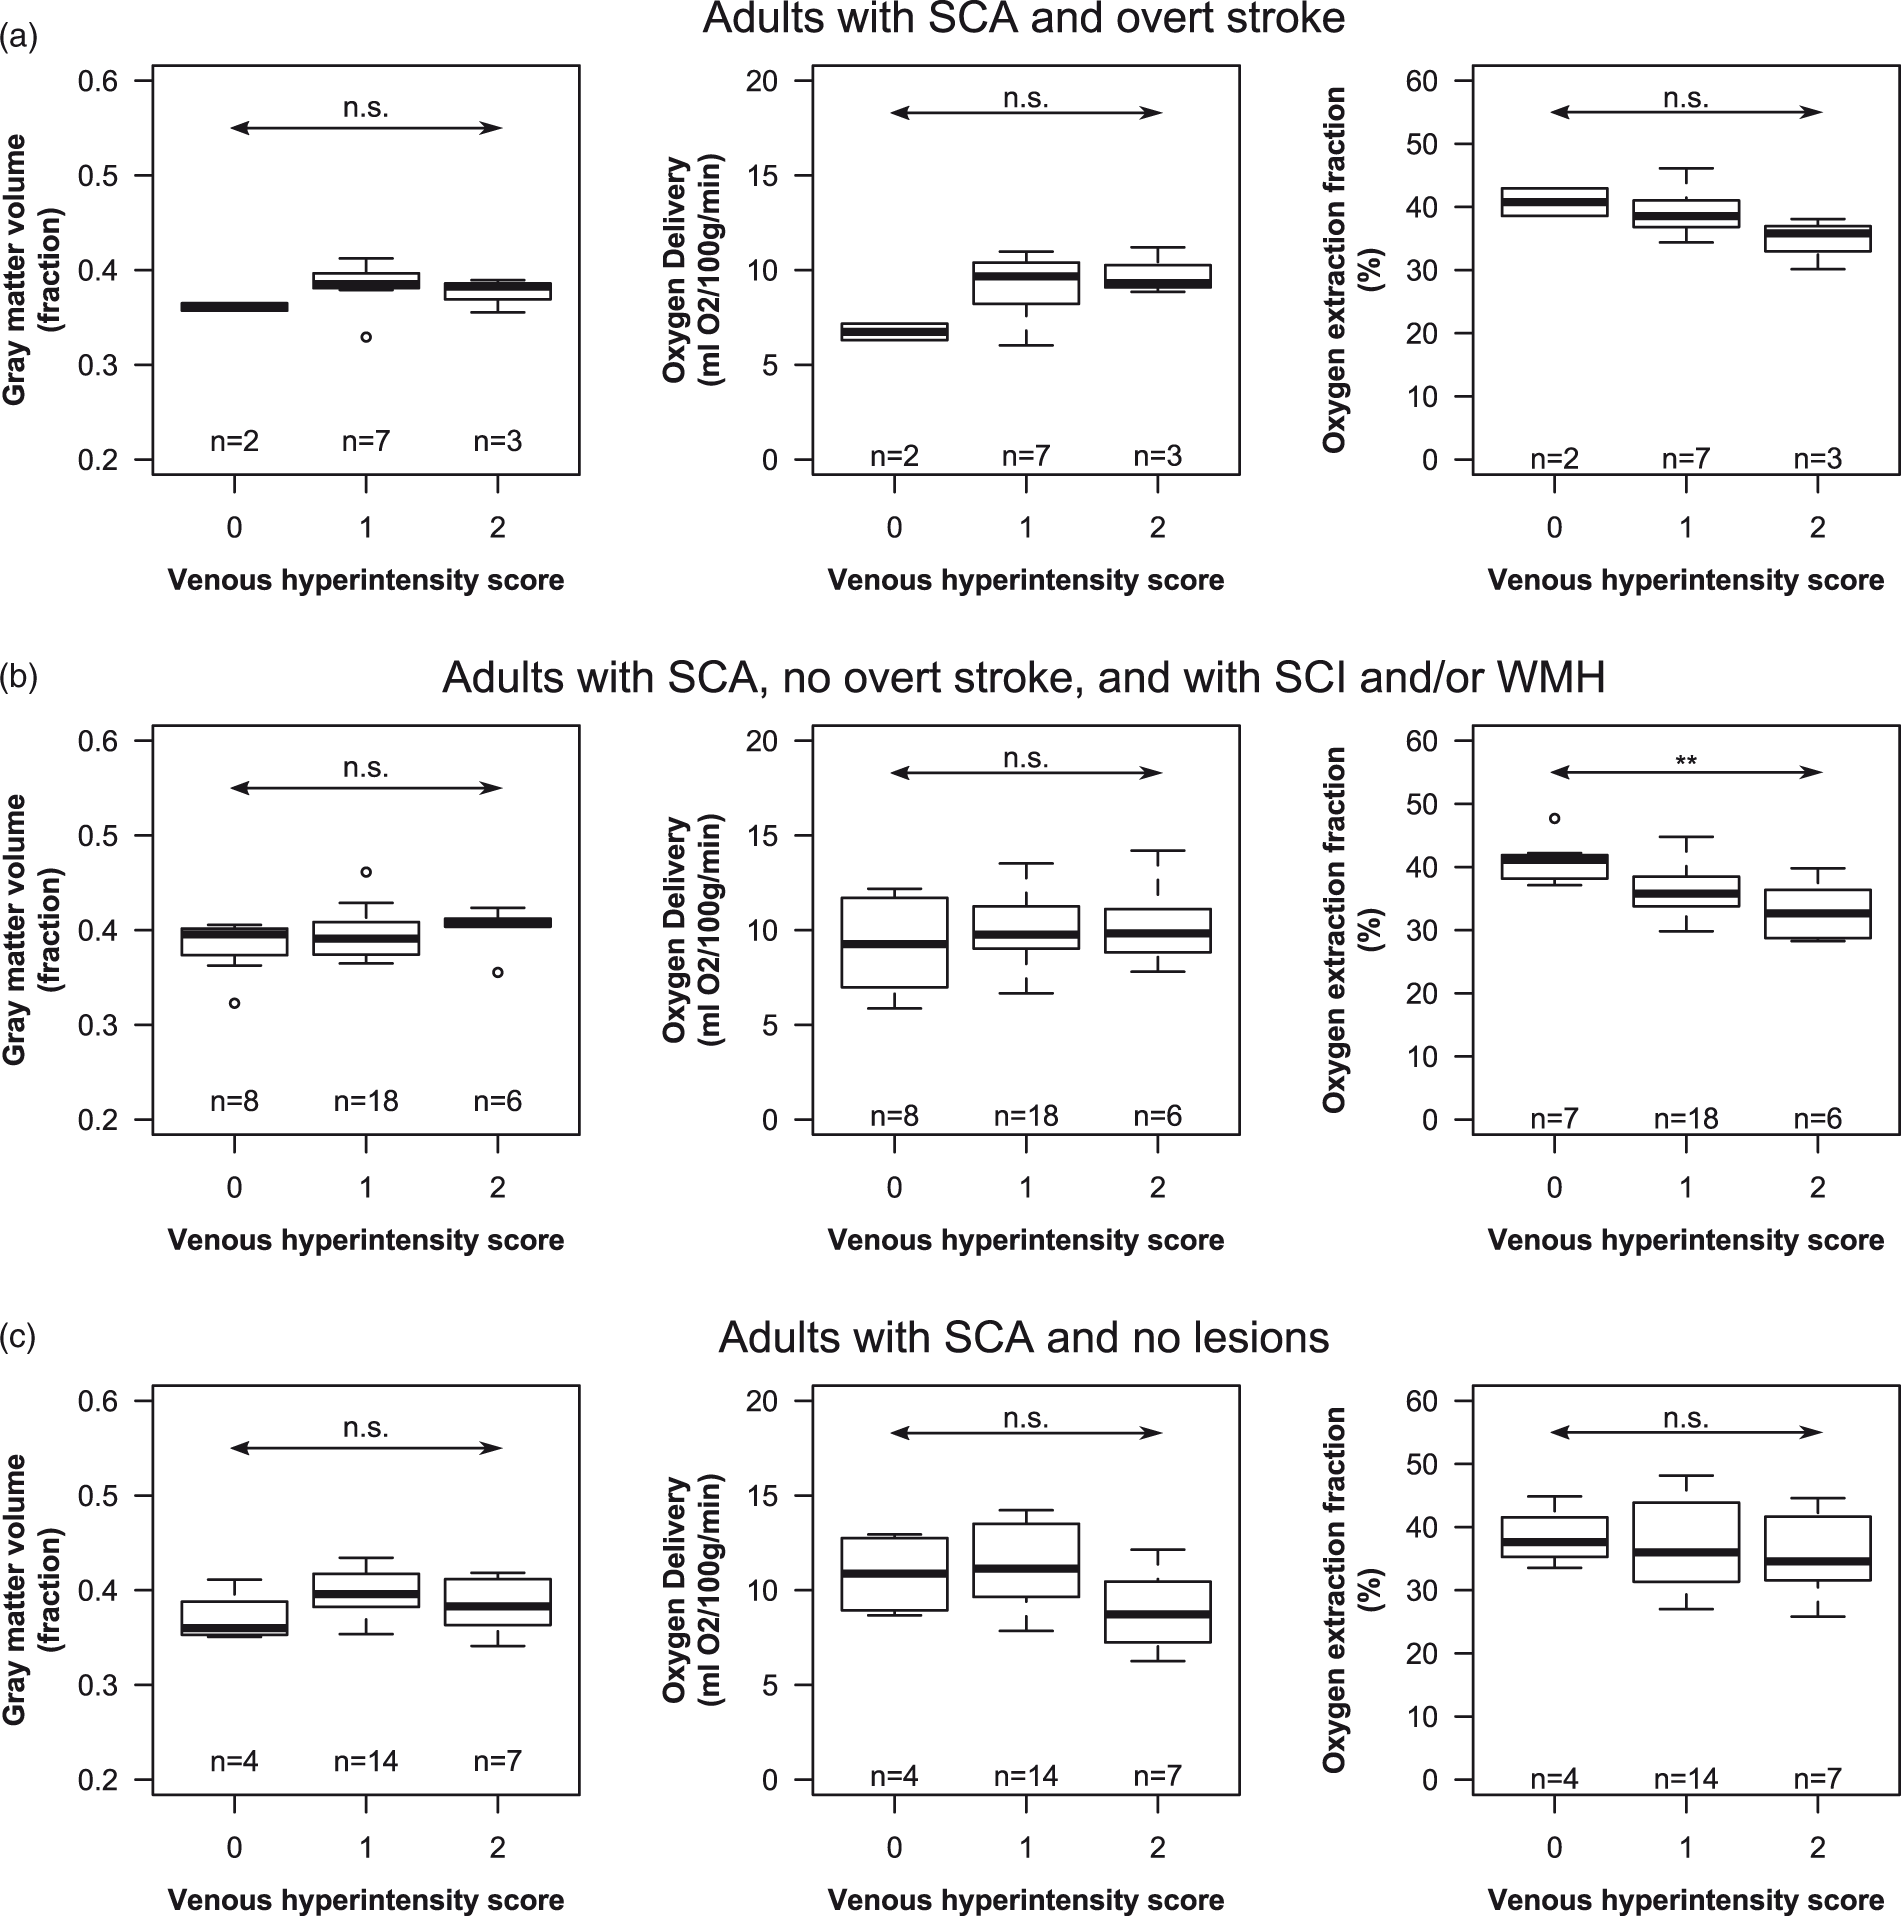
Sickle cell anemia (SCA) results: Box-and-whisker plots of normalized gray matter volume (left), oxygen delivery (middle), and oxygen extraction fraction (OEF; right) are shown as a function venous hyperintensity scores (VHS) for adults with SCA with overt stroke (n = 12; a), without overt stroke but with silent cerebral infarcts and/or white matter hyperintensities (n = 32; b), and without any lesions (n = 25; c). Statistical results are presented from Jonckheere-Terpstra trend tests (arrows). *p ≤ 0.05, **p ≤ 0.01, and n.s. p > 0.05. OEF results shown were calculated using the human HbA calibration model, and one OEF data point in the VHS = 0 group in B was unavailable due to insufficient data quality.
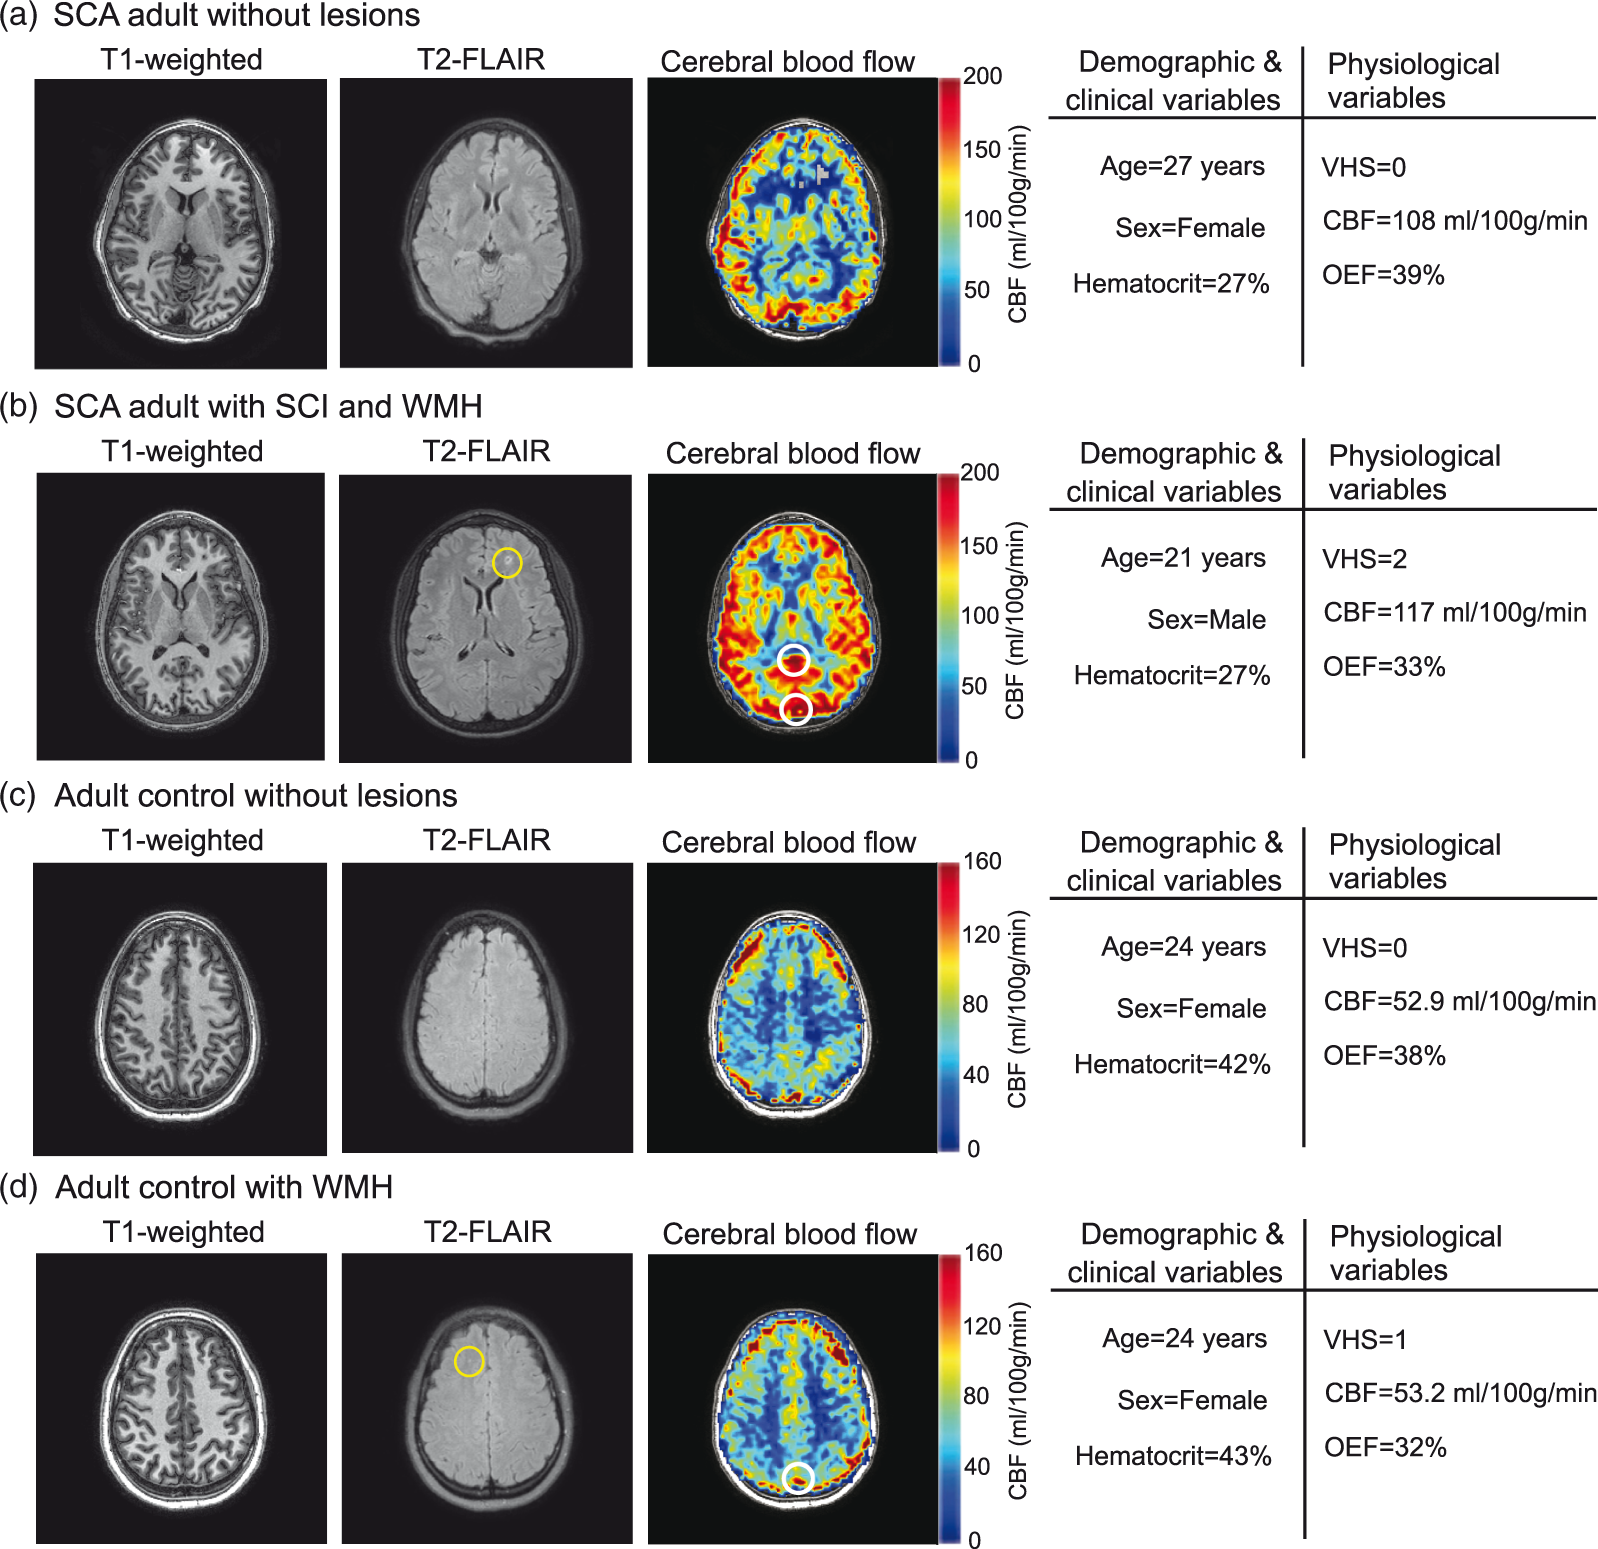
Case examples. T1-weighted, T2-FLAIR, and cerebral blood flow (CBF) images are shown for representative sickle cell anemia (SCA) patients without overt stroke and without silent cerebral infarcts (SCI) or white matter hyperintensities (WMH) (a) and with SCI and WMH (b). The patients have been matched for hematocrit, and both exhibit high CBF. The patient with venous hyperintensity score (VHS)=2 (b) exhibited low oxygen extraction fraction (OEF) and lesions, while the patient with VHS = 0 (a) exhibited normal OEF and no lesions. Representative images are also shown for adult controls without (c) and with (d) lesions. These subjects have been matched for age, sex, CBF and hematocrit. The subject with VHS = 1 displayed low OEF and exhibited WMH, while the subject with VHS = 0 exhibited normal OEF and no lesions. Locations of venous hyperintense signal in the CBF images are illustrated with white circles.
In adults with SCA, gray matter CBF was not significantly higher for VHS > 0 (CBF = 88.7 [77.3, 100.5] ml/100 g/min) versus VHS = 0 (CBF = 74.4 [59.7, 92.1] ml/100 g/min) (Wilcoxon rank-sum p = 0.057); however, the relatively low p-value suggests that this may meet criteria for significance with a larger sample size. In addition, a significant positive association between CBF and venous hyperintense signal degree was observed (Jonckheere-Terpstra p = 0.050), with higher CBF corresponding to higher VHS (Figure 3(b)), consistent with a prior report. 23 A relationship between CBF and degree of venous hyperintense signal in adults with SCA and overt stroke was not observed at the stated significance level (Jonckheere-Terpstra p = 0.059). In adults with SCA without overt stroke but with SCI or WMH, there was no significant effect between VHS and CBF (Jonckheere-Terpstra p = 0.080). Similar to the results from the SCA cohort overall, these relatively low p-values suggest that these associations may meet criteria for significance with a larger sample size. No relationship was observed between CBF and venous hyperintense signal degree in adults with SCA without overt stroke or other lesions (Jonckheere-Terpstra p = 0.979).
In all adults with SCA, oxygen delivery to gray matter was not associated with venous hyperintense signal degree (Figure 3(c); Joncheere-Terpstra p = 0.949), and no associations between oxygen delivery and venous hyperintensities were observed in SCA participants with overt stroke (Figure 4(a), middle; Joncheere-Terpstra p = 0.121), without overt stroke but with SCI and/or WMH (Figure 4(b), middle; Joncheere-Terpstra p = 0.552), or without any lesions (Figure 4(c), middle; Joncheere-Terpstra p = 0.166).
When using the HbA calibration model, OEF was lower in adults with SCA and VHS > 0 (OEF = 0.36 [0.33, 0.39]) compared to adults with SCA and VHS = 0 (OEF = 0.39 [0.37, 0.42]) (Wilcoxon rank-sum p = 0.013). In addition, a significant inverse association between OEF and venous hyperintense signal degree was observed (Jonckheere-Terpstra p = 0.006), with lower OEF corresponding to higher VHS (Figure 3(d)). When using the HbA calibration model, there was no significant relationship between OEF and degree of venous hyperintense signal in adults with SCA and overt stroke (Jonckheere-Terpstra p = 0.059), but the low p-value may indicate that this could be significant with a larger sample size (Figure 4(a), right). In addition, there was a significant relationship between OEF and venous hyperintense signal degree in adults with SCA with SCI and/or WMH but without overt stroke (Jonckheere-Terpstra p = 0.003), where higher VHS was associated with lower OEF (Figure 4(b), right). However, no relationship was observed between OEF and venous hyperintense signal degree in adults with SCA without overt stroke or other lesions (Jonckheere-Terpstra p = 0.551) (Figure 4(c), right).
When using the bovine calibration model, OEF was elevated in adults with SCA versus controls (Wilcoxon rank-sum p < 0.001). When using the HbA calibration model, OEF was not different between adults with SCA and controls (Wilcoxon rank-sum p = 0.88). When using the HbS calibration model, OEF was lower in adults with SCA than controls (Wilcoxon rank-sum p < 0.001). In terms of the above trends with VHS, the results from the HbS model were consistent with those obtained with the HbA model, while none of the above relationships were observed when using the bovine model. OEF from one adult with SCA and VHS = 0 was not available due to insufficient data quality.
Venous hyperintense signal in adult controls
OEF from one control with VHS = 1 was not available due to insufficient data quality. Hematocrit was lower in controls with VHS = 0 (hematocrit = 39.0 [37.0, 42.0] %) compared to controls with VHS = 1 (hematocrit = 42.0 [40.0, 45.0] %) (Wilcoxon rank-sum p = 0.026) (Figure 3(a)). Gray matter CBF was not different for VHS = 0 (CBF = 49.3 [41.5, 52.9] ml/100 g/min) versus VHS = 1 (CBF = 46.8 [42.4, 51.0] ml/100 g/min) (Wilcoxon rank-sum p = 0.685) (Figure 3(b)) controls. OEF was not lower in individuals with VHS = 1 (OEF = 0.35 [0.32, 0.40]) compared to controls with VHS = 0 (OEF = 0.38 [0.37, 0.42]) (Wilcoxon rank-sum p = 0.087) (Figure 3(d)); however, the low p-value suggests that this may become significant with a larger sample size. OEF results were consistent between the HbA and bovine calibration models in controls. The prevalence of WMH was not significantly different in controls with venous hyperintense signal (8/28; 29%) compared to controls without (1/16; 6%) venous hyperintense signal (Chi-squared p = 0.065). No differences were observed between prevalence of SCI in adult controls with and without venous hyperintense signal.
Discussion
We have previously reported findings that venous hyperintense signal in CBF-weighted ASL MRI may be a marker of cerebral capillary shunting and have shown this signal to be associated with elevated cervical arterial blood velocity and CBF in adults with SCA. 23 However, the implications for oxygen exchange efficiency and association with the presence of SCI or WMH were unclear. In this study, we evaluated potential associations between venous hyperintense signal in ASL MRI on tissue-level physiology, including CBF and OEF, as well as how these relationships may be different in the presence of infarcts and WMH. In adults with SCA overall, we found that a higher degree of VHS was associated with (i) lower hematocrit, (ii) higher CBF and (iii) lower OEF. On average, venous hyperintense signal was found in younger SCA participants, which is consistent with CBF being higher in younger versus older adults. 36 When examining adults with SCA and no overt stroke, we found that a higher degree of VHS was associated with lower hematocrit in those without SCI or WMH but not in those with these lesions. In the same subgroup of participants, we found that higher degree of VHS was associated with lower OEF in those with SCI and/or WMH but not in those without lesions. This finding is consistent with flow-related disturbances in oxygen exchange efficiency, indicated by degree of venous hyperintense signal, being more severe in adults with SCA with brain lesions.
Microvascular physiology in adults with sickle cell anemia
Adults with SCA experience a reduction in the oxygen-carrying capacity of blood due to increased hemolysis of erythrocytes with hemoglobin-S. As a result, CBF is generally upregulated through increases in vasodilation of the microvasculature.18,37–39 We and others have proposed that in some patients these increases in CBF could result in a paradoxical decrease in oxygen availability to brain tissue through capillary shunting.23,35,40 As oxygen offloading to tissue is dependent in part on the amount of time blood water spends in capillaries, shortened capillary transit times could cause lower oxygen extraction. Such effects could result in a state of chronic mild tissue hypoxia that leads to brain lesions.
Previous studies have disagreed on whether OEF is elevated or diminished in individuals with SCA,5,35 with evidence showing that oxygen extraction may be reduced,35,41 unaffected, 42 or elevated in patients with SCA. 5 These differences have been attributed to the calibration models used when calculating OEF (see below) or to limitations of the MRI method used. However, observed differences in OEF between studies may also be due to differences in patient populations, with OEF increases or decreases present in some but not all SCA patients as a function of level of impairment and the adequacy of corresponding hemodynamic compensatory mechanisms. Indeed, a prior study with positron emission tomography showed low OEF (approximately one standard deviation below the mean) in two of three SCA patients with structural abnormalities and normal or elevated OEF in remaining three patients without abnormal findings. 43 Interestingly, the subject with the highest CBF and lowest hemoglobin levels presented with the lowest OEF and the greatest level of impairment. This could potentially be explained by shunting effects and is in agreement with the physiology exhibited by neurologically impaired individuals with VHS = 2 in this present study.
Prior work has commented on potential consequences of capillary-level flow disturbances on oxygen exchange efficiency in brain tissue.22,25 Specifically, the level of heterogeneity in capillary transit times has been presented as a marker of capillary dysfunction that could lead to decreased oxygen exchange efficiency and chronic tissue hypoxia. 25 We have proposed that degree of venous hyperintense signal in CBF-weighted ASL could be a noninvasive imaging marker of such capillary-level flow disturbances in SCA patients susceptible to SCI or WMH. Our results show that OEF is not reduced in all SCA patients, but rather that OEF decreases as degree of venous hyperintense signal increases. However, the similar proportions of participants with VHS = 2 across the different subgroups of SCA adults indicate that venous hyperintense signal alone may not be a sensitive marker of existing neurological pathology. Meanwhile, when examining patients without overt stroke, OEF decreases with VHS degree only in patients with SCI or WMH; there is no such apparent relationship in patients without these lesions, and oxygen delivery was not observed to be associated with VHS degree in either group. In addition, there is an apparent association between CBF and VHS degree in SCA participants with prior lesions, while CBF is not associated with VHS degree in SCA participants without prior lesions. This discrepancy could potentially be explained in the context of changes in physiology to account for disturbances in capillary flow patterns. The Ostergaard model 25 predicts that increases in CBF are initially necessary to maintain oxygen extraction at a level necessary for normal oxygen metabolism (represented by VHS = 1). As capillary transit becomes more heterogeneous and accelerated (VHS = 2), suppression of CBF is required to reduce the high capillary transit times and maintain normal ranges of oxygen extraction. This pattern of normalizing CBF may be consistent with our data in adults with SCA without lesions, but higher CBF (and associated lower OEF) in those patients with lesions may indicate that flow disturbances are not adequately compensated for in these patients. Thus, it is likely that a holistic characterization of CBF, OEF, and VHS may be necessary to characterize risk for these lesions, but further work is needed to determine these effects.
Microvascular physiology in adult controls
There are well-described racial differences in the risk for vascular disease. 44 We conducted preliminary analyses examining the prevalence of venous hyperintense signal as well as implications for physiology and WMH in black adults without SCA or sickle trait. Our results showed that venous hyperintense signal was present in 62% of black adults without SCA. While this prevalence was much higher than expected, it is lower than the prevalence of venous hyperintense signal observed in adults with SCA (79%). In addition, the degree of venous hyperintense signal in adults without SCA was significantly lower than in adults with SCA, with no adult controls exhibiting VHS = 2. The discrepancy between the prevalence of controls with VHS = 1 in our current and previous study 23 is likely due to the expansion of the assessment scale to include venous sinuses other than the superior sagittal sinus here. It is likely that focal venous hyperintensity that results in a classification of VHS = 1 is not pathologic as it is present in such a high percentage of controls. While the prevalence of lesions in a cohort of young, otherwise healthy adults is higher than expected, it should be noted that large population studies in young cohorts are scant, and the prevalence of such clinically silent lesions is relatively unknown in young healthy adults. Ongoing work that involves utilization of multi-delay ASL approaches will allow us to more fully characterize this signal and understand these differences and thresholds for distinguishing cases from controls in a more quantitative manner.
Overall, these findings show that high venous hyperintense signal (VHS = 2) in adults with SCA is consistent with lower oxygen extraction efficiency and brain lesions.
Effects of TRUST calibration model
TRUST is a noninvasive spin labeling MRI approach for quantifying global OEF that converts T2 in the superior sagittal sinus to a measure of venous oxygen saturation using a calibration model. 27 However, the choice of this model in patients with SCA is not straightforward. The original model (bovine model) was derived using bovine blood, which is thought to exhibit similar magnetic properties to healthy human blood, 45 but was calibrated for healthy hematocrit ranges. 33 This model also provides very similar values as a hemoglobin-F model that is calibrated to include a moderately anemic hematocrit range. 46 When using this model, we did not find an association between venous hyperintense signal and OEF in our previous or present study. However, this model was not calibrated for most of the hematocrit range observed in patients with SCA, and this has generated some controversy as to whether this model may be appropriate for use in SCA patients. 47 More recently, a TRUST calibration models developed using healthy human blood with hemoglobin-A (HbA model) 34 and human blood with hemoglobin-S (Bush-HbS model 35 and Li-HbS model 42 ) have been presented. To understand effects of calibration model on the results, we studied OEF using the bovine, HbA, and Bush-HbS calibration models. In adults with SCA, we detected significant associations between OEF and VHS degree when using the HbA and Bush Hb-S models but not when using the bovine model. However, the Bush Hb-S model was calibrated over a smaller hematocrit range, produced consistently lower OEF values compared to the HbA model, and does not include a hematocrit-dependence on the blood T2. For this reason, we chose to present the results from the HbA model as the primary OEF results in this study. In adults without SCA, the results between the bovine and HbA models were consistent, as expected due to the hematocrit ranges in controls falling well within the range of both model calibrations.
Limitations and future directions
The findings of this study should be considered in the context of the following limitations. First, our characterization of venous hyperintense signal is a categorical and subjective assessment with each subject assigned one of three possible scores. We have previously found that agreement between three independent raters is substantial, 23 and this finding was repeated in a larger cohort of subjects in the current study as well. Future studies would benefit from developing an automated approach to classify and assessing venous hyperintense signal in a more continuous fashion, likely by directly quantifying capillary transit time. Second, while venous hyperintense signal was assessed in a number of venous sinuses, OEF was measured using venous oxygen saturation measurements from only the superior sagittal sinus. While the location of this measurement just above the confluence of the sinuses should provide an estimate of global OEF, there may be local differences in tissues drained by other venous sinuses that are not captured by this measure. Future studies will benefit from utilizing regional approaches for measuring OEF. Third, group-averaged bolus arrival times, which we have previously shown to be associated with arterial velocity, were used in lieu of individual participant-specific measurements for CBF computation. While this could introduce some error into the CBF computation, we have demonstrated that that the CBF derived from using a group-averaged transit time for SCA patients was well correlated to CBF when using a patient-specific transit time. 18 Similarly, we have previously demonstrated the effect of arterial velocity on labeling efficiency and utilizing a lower group-averaged labeling efficiency value in patients versus controls. 18 It is possible that individual variations in these values due to heterogeneous flow velocities, as in all pCASL studies, could result in some mis-estimation of CBF. However, SCD patients generally do not have cervical stenosis, which is the largest contributor to large variations in cervical flow velocities, and cardiac output and cervical flow velocity in SCD patients have not been found to be different on a sufficiently large scale to influence pCASL labeling efficiency between patients. Fourth, multi-delay ASL data were not available in enough subjects to thoroughly study the associations between transit times and the presence or degree of VHS. A shorter than typical labeling duration (1000 ms) was chosen as part of our initial multi-delay ASL approach in order to sensitize the acquisition to arterial arrival times at short post-labeling delay. Due to acquisition time limitations in some patients, we did not acquire this additional data in all patients. It should be noted, however, that the time since the start of labeling (2900 ms in our sequence) is comparable to other sequences which use common label durations (∼1500 ms) and post-labeling delays (∼1600 ms). Fifth, a relationship between hematocrit and arterial blood T1 derived from healthy human blood was used in the computation of CBF in this study. While a recent study has reported venous blood T1 in individuals with SCA, this approach was not incorporated here as arterial blood water is relevant to the ASL calculation. Finally, in our cross-sectional study, it is not possible to distinguish whether venous hyperintense signal may be a physiological marker that precedes an infarct or not.
This study also exhibits the following strengths. First, the final sample size (n = 114) of SCA patients (n = 69) and age- and race-matched controls (n = 45) all with multi-modal structural, hemodynamic, and metabolic neuroimaging, in addition to neurological assessment, is relatively large compared with recent studies in similar populations.16,48 In addition, the distribution of patients with different vascular lesions allowed for an analysis of how hemo-metabolic physiology may be differentially affected in individuals with different lesion loads. Second, a large number of participants in our sample of adults with SCA exhibited cerebrovascular impairment, including overt stroke (18%) and SCI and/or WMH (46%), which allowed us to study how microvascular hemodynamics may be differentially impaired in these groups versus patients who are more healthy and do not have a history of lesions (36%).
Concluding remarks
We have measured associations between venous hyperintense signal in CBF-weighted ASL MRI and brain tissue-level physiology in young adults with and without SCA. In both groups, we found that the presence of venous hyperintense signal, measured using ASL MRI, was associated with lower OEF, measured with TRUST MRI. In adults with SCA, we found that individuals with prior SCI and/or WMH, but not those without any lesions, exhibited an inverse relationship between OEF and degree of VHS. Longitudinal studies may be warranted to evaluate the relationship between venous hyperintense signal as a prospective marker of infarct occurrence.
Supplemental Material
JCB913123 Supplementary Material - Supplemental material for Reduced oxygen extraction efficiency in sickle cell anemia patients with evidence of cerebral capillary shunting
Supplemental material, JCB913123 Supplementary Material for Reduced oxygen extraction efficiency in sickle cell anemia patients with evidence of cerebral capillary shunting by Meher R Juttukonda, Manus J Donahue, Spencer L Waddle, Larry T Davis, Chelsea A Lee, Niral J Patel, Sumit Pruthi, Adetola A Kassim and Lori C Jordan in Journal of Cerebral Blood Flow & Metabolism
Footnotes
Funding
The author(s) disclosed receipt of the following financial support for the research, authorship, and/or publication of this article: This work was supported by the National Institutes of Health [NIH/NINDS grant number 5R01NS078828; NIH/NCATS grant number UL1 TR000445 to Vanderbilt University] and the American Heart Association [grant numbers 14CSA20380466, 19CDA34790002].
Declaration of conflicting interests
The author(s) declared the following potential conflicts of interest with respect to the research, authorship, and/or publication of this article: MR Juttukonda, SL Waddle, LT Davis, CA Lee, NJ Patel, S Pruthi, AA Kassim and LC Jordan declare that they have no conflicts of interest. MJ Donahue is a paid consultant for Global Blood Therapeutics, receives advisory board honoraria from bluebird bio, receives research-related support from Philips North America, and is the CEO of Biosight LLC, which provides healthcare technology consulting services. These agreements have been approved by Vanderbilt University Medical Center in accordance with its conflict of interest policy.
Authors’ contributions
Meher R Juttukonda: Involved in study conception and design, data acquisition, analysis and interpretation of data, and manuscript drafting and revision. Spencer L Waddle: Involved in data acquisition, analysis and interpretation of data, and manuscript revision. Larry T Davis, Adetola A Kassim, Sumit Pruthi: Involved in analysis and interpretation of data and manuscript revision. Chelsea A Lee, Niral J Patel: Involved in data acquisition and manuscript revision. Manus J Donahue, Lori C Jordan: Involved in study conception and design, analysis and interpretation of data, and manuscript revision.
Supplemental material
Supplemental material for this article is available online.
References
Supplementary Material
Please find the following supplemental material available below.
For Open Access articles published under a Creative Commons License, all supplemental material carries the same license as the article it is associated with.
For non-Open Access articles published, all supplemental material carries a non-exclusive license, and permission requests for re-use of supplemental material or any part of supplemental material shall be sent directly to the copyright owner as specified in the copyright notice associated with the article.