
Abstract
Deep medullary veins (DMVs) participate in the drainage of surrounding white matter. In cerebral small vessel disease (CSVD), disrupted DMVs were often observed together with damaged white matter, but the phenomenon lacked validation and explanation. We hypothesized that venous disruption might cause white matter damage through increased interstitial fluid resulting from hemodynamic alteration, and we designed a comprehensive multi-modality MRI study to testify our hypothesis. Susceptibility-weighted imaging was used to investigate the characteristics of DMVs and derive DMVs scores. Free water elimination diffusion tensor imaging model was used to analyze interstitial fluid fraction (fraction of free water, fFW) and white matter integrity (tissue fractional anisotropy, FAt). Totally, 104 CSVD patients were included. Total DMVs score was associated with FAt of DMVs drainage area. The effect of total DMVs score on FAt was mediated by fFW, after controlling for age, sex, hypertension, regional cerebral blood flow and lacune numbers. The relationships between DMVs score, fFW and FAt were also significant in most DMVs drainage subregions. Therefore, we discovered the DMVs disruption – increased interstitial fluid – white matter damage link in CSVD patients, which was independent of arterial perfusion variations.
Keywords
Introduction
White matter damage is a common feature of cerebral small vessel disease (CSVD) and is associated with cognitive impairment, 1 gait 2 and mood disorders. 3 Although previous studies demonstrated that disrupted blood–brain barrier and diminished cerebral blood flow (CBF) were closely related to white matter damage,4,5 it was also shown that cerebral venous disruption might play an important role. 6
Deep medullary veins (DMVs) lie within the white matter and drain into the deep venous system via subependymal veins. 7 Pathological studies discovered DMVs collagenosis in white matter hyperintensities (WMH) areas.8,9 Our previous imaging research in CSVD patients also found that DMVs disruption was associated with WMH volume, especially within the drainage region of DMVs. 10 These pathological and imaging findings indicated the relationship between DMVs disruption and white matter damage. However, the histopathology behind WMH is heterogeneous, ranging from increased water content, slight disentanglement of the matrix to varying degrees of demyelination and axonal loss. 11 Besides, CSVD-related white matter damage is not confined to WMH region but spread widely to normal appearing white matter.12,13 Thereby, WMH cannot accurately represent white matter damage. Analyzing the white matter in DMVs drainage area with imaging techniques that can reflect microstructural changes would provide more solid evidence for the DMVs disruption-related white matter damage in CSVD.
Moreover, the potential pathway of how DMVs disruption is related to white matter damage remains unclear. Previous studies assumed that venous collagenosis could alter the normal outflow of venous blood and lead to increased interstitial fluid, 14 which may further cause metabolic waste aggregation and inflammation, finally resulting in white matter damage. 15 However, these theories remained as hypotheses since they had never been evaluated in CSVD patients or animal models.
Recently, free water (FW) diffusion MRI model was proposed to study diffusion changes in white matter more precisely. 16 FW model consists of a FW compartment and a tissue compartment. FW compartment represents water molecules that are not restricted or directed, which can be used as an imaging marker for fraction of interstitial fluid. While the tissue compartment represents water molecules within or in close proximity to cellular structures, which reflects white matte fiber organization. Particularly, tissue fractional anisotropy (FAt) has been proved to be capable of characterizing the microstructural properties and integrity of white matter, and the decline of FAt was closely related to cognitive impairment. 17
Therefore, in this study, we would use the FW model to reflect fraction of interstitial fluid (fraction of free water, fFW) and white matter integrity (FAt) in CSVD patients. DMVs disruption would be evaluated by our formerly established DMVs scoring system on susceptibility-weighted imaging (SWI). We aimed to explore the relationship between DMVs score and white matter integrity, and to find out if this link is mediated by increased interstitial fluid. Additionally, to exclude the possible effect of arterial perfusion on white matter integrity, we also tested our hypothesis after controlling for hypertension, regional CBF and lacune numbers.
Materials and methods
Study subjects
We retrospectively reviewed the data of consecutive CSVD patients (defined as the presence of lacunes and/or WMH on MRI) admitted to the neurology department of our hospital from November 2013 to April 2019. The main reasons for referral to the hospital were acute (e.g. transient ischemic attack and stroke presenting with lacunar syndrome) or subacute symptoms of CSVD (e.g. cognitive and/or gait disturbances). The imaging data of patients with acute lacunar infarct were acquired at least six months after onset. We enrolled those who met all the following inclusion and none of the exclusion criteria into this study. Inclusion criteria were: (1) age above 40; (2) with complete multi-modality MRI data; (3) had written informed consent. Exclusion criteria were: (1) patients with secondary causes of white matter lesions, such as demyelinating, infectious, metabolic, immunological, toxic, and other causes; (2) patients with abnormal brain MRI findings such as head trauma, hemorrhage, infarction (except lacunes) and other space-occupying lesions; (3) patients with definitive peripheral neuropathy, spinal cord disease; (4) evidence of severe calcification on CT scans or encephalomalacia in the deep gray matter structures since it can influence the observation of DMVs. We retrieved the demographic, clinical, laboratory and imaging data of all patients.
Ethics statement
All subjects had been given written informed consent prior to the study, and the protocols had been approved by the medical ethics committee of the Second Affiliated Hospital, Zhejiang University School of Medicine. All clinical investigation has been conducted according to the principles expressed in the Declaration of Helsinki.
MRI protocol
All subjects underwent multi-model MRI by a 3.0 T MR (Discovery MR750, GE Healthcare, USA) scanner using an 8-channel brain phased array coil. The scanning sequences included 3D sagittal T1 (3D-T1)-weighted imaging, T2 fluid-attenuated inversion recovery (FLAIR) imaging, SWI, diffusion tensor imaging (DTI) and 3D arterial spin labeling (ASL) imaging. In order to minimize head motion, foam pads were inserted into the space between the subject’s head and the MRI head coil. The SWI sequence was acquired in an axial orientation parallel to the anterior commissure to posterior commissure line, using a three-dimension multi-echo gradient-echo sequence with eight equally spaced echoes: echo time = 4.5 ms (first echo), repetition time = 34 ms, FOV = 24 cm × 24 cm, matrix size = 416 × 384, flip angle = 20°, slice thickness = 2.0 mm with no gap between slices, and the in-plane spatial resolution interpolated into 0.4688 mm/pixel × 0.4688 mm/pixel. Magnitude and phase images were reconstructed and saved. DTI were acquired with a single-shot, spin–echo planar imaging (EPI) sequence with the following parameters: repetition time = 5000 ms, echo time = 95 ms, FOV =24 cm × 24 cm, matrix size = 128 × 128, inversion time = 2100 ms, slice thickness = 4.0 mm with no gap (continuous) between slices, and three diffusion weighting (b) values (0, 1000, and 2000 s/mm2), with diffusion encoding in 30 directions for every b-value. 3D ASL was acquired using spin-echo pulse sequence with TR/TE = 4611/10.5 ms, inversion time (TI) = 1525 ms, flip angle = 111°, slice thickness = 4 mm, matrix = 128 ×128, FOV = 24 cm. 3D-T1 was acquired using spoiled gradient echo sequence with repetition time = 7.3 ms, echo time = 3.0 ms, inversion time = 450 ms, flip angle = 8°, slice thickness = 1 mm, matrix = 250 × 250, FOV = 25 cm × 25 cm. T2 FLAIR acquisition parameters were: repetition time = 8400 ms, echo time =150 ms, flip angle = 90°, FOV = 24 cm × 24 cm, matrix size = 256 × 256, inversion time = 2100 ms, slice thickness = 4.0 mm with no gap between slices.
Measurement of DMVs
The raw data were transferred to a separate workstation (ADW4.4, GE), and a custom-built program was used to reconstruct the magnitude and phase images.
We assessed DMVs on SWI phase images from the level of the lateral ventricles first appeared (top level) to the level of caudate first appeared (bottom level), which were about five consecutive periventricular slices (10 mm thick), considering these slices cover a large portion of DMVs. According to medullary venous anatomy, six subregions including frontal region, parietal region and occipital region (bilateral, respectively) were separated on the above five slices and the characteristics of the DMVs were then evaluated in each subregion, respectively.
As described in our previous study, we used the four-point score to evaluate DWVs 10 : 0 score – each vein was continuous and had homogeneous signal; 1 score – each vein was continuous, but one or more than one vein had inhomogeneous signal; 2 score – one or more than one vein were not continuous; 3 score – no observed vein was found continuous. The total DWVs score is the sum of the six subregions’ score. Two neuroradiologists (RZ and PH, both with five years of neuroimaging review experience), who were completely blinded to the subjects’ clinical data and disease state, assessed the vascular changes.
Free water elimination DTI analysis
After visual quality control, raw diffusion images were first corrected for eddy current-induced distortions and head motion with the eddy command in FSL (https://www.fmrib.ox.ac.uk/fsl). The eddy command would generate eddy-corrected DTI data, along with corrected b values and b vectors, which were used in the following DTI analysis. The DTI analysis was performed in DIPY (http://nipy.org/dipy/index.html), which is an open source software project focused on DTI analysis. Briefly, in each voxel, the signal was fitted to a two-compartment model, including a FW compartment (isotropic tensor) and a tissue compartment (FW-corrected tensor). The estimated parameters were the fractional volume of the FW compartment (fFW) and the tensor of the tissue compartment. The fFW expresses the relative contribution of FW in each voxel, ranging from 0 to 1. The tensor of the tissue compartment reflects the tissue microstructure after removing the signal contributed by FW. FAt was calculated from the tensor of the tissue compartment.
Assessment of diffusion parameters in DMVs drainage region and subregions
Firstly, we segmented each subjects’ T1 images into gray/white matter and CSF components, and a group average CSF template from all our subjects using SPM’s DARTEL tools. Then the template was edited so that only the lateral ventricles were selected, after which a DMVs drainage area mask was created by dilating the ventricle mask out for 10 mm. Bilateral frontal, parietal and occipital subregion masks were separated according to our DMVs drainage templates.
To accurately extract regional fFW and FAt values, we transformed the DMVs drainage region and subregion masks back to each subject’s individual brain space, using the backward deformation field derived during brain template creation. Additionally, each subjects’ T1 image and DTI image were co-registered through a two-step (linear and non-linear) registration process. We adjusted co-registration parameters and visually assessed the results to ensure that the T1 and DTI images were well-aligned. The final DMVs drainage region and subregion masks in the subject’s individual space were then used to extract the mean fFW and FAt.
ASL and CBF analysis
The raw data of ASL were transferred to a separate workstation (ADW, GE), where the quantitative CBF maps were generated by a vendor-provided program. Briefly, each patient’s tag and control image pairs were subtracted, and averaged to form an individual whole-brain perfusion-weighted map. Quantitative CBF maps (in units of mL/100 g/min) were calculated based on a two-compartment ASL model. The CBF maps were then co-registered with T1 images using 3D rigid-body registration. We visually assessed the results to ensure that the T1 and CBF images were well-aligned. The final DMVs drainage region and subregion masks in the subject’s individual space were then used to extract the mean CBF.
Assessments of WMH
The axial T2 FLAIR images were processed for the quantification of WMH volume. T2 FLAIR images of each subject were used to automatically segment WMH lesions with the Lesion Segmentation Toolbox in SPM12. A threshold of 0.5 was applied to the probabilistic lesion map to derived binarized WMH image. Then the segmented lesions were visually checked and manually corrected by two experienced neuro-radiologists (RZ and PH) who were blinded to all other imaging and clinical data. The manual correction process included: (1) Correction of non-white matter area being labeled as WMH; (2) WMH area not properly labeled as WMH or normal appearing white matter falsely labeled as WMH. Then we extract the whole brain WMH volumes with Matlab scripts.
The Fazekas scale 18 visual grading scale was also used for rating WMHs. According to the Fazekas scale, the WMHs were divided into periventricular hyperintensities and deep white matter hyperintensities. Periventricular hyperintensities were graded as absent (grade 0), cap (grade 1), smooth halo (grade 2), or irregular and extending into the subcortical white matter (grade 3), and deep white matter hyperintensities were graded as absent (grade 0), punctate foci (grade 1), early-confluent (grade 2), or confluent (grade 3).
Evaluation of microbleeds
SWI magnitude images were used to identify microbleeds. Briefly, microbleeds should be small, rounded or circular, well-defined hypointense lesions within brain parenchyma with clear margins ranging from 2 to 10 mm in size. 19 Signal voids caused by sulcal vessels, calcifications, choroid plexus, and low-signal averaging from adjacent bone were excluded.
Evaluation of lacunes of presumed vascular origin (simplified as lacunes)
T2 FLAIR images were used to identify lacunes. A lacune was defined as a round or ovoid, subcortical, fluid-filled (similar signal as CSF) cavity on MRI and with a diameter of 3 to 15 mm, which was different from the enlarged Virchow–Robin spaces by the size, shape, and rim. 20 The T2FLAIR maps were co-registered with T1 images using 3D rigid-body registration. We visually assessed the results to ensure that the T1 and T2FLAIR images were well-aligned. The final DMVs drainage region and subregion masks in the subject’s individual space were then used to measure the regional lacune numbers.
Reliability and validity of the radiological measurements
All the raters were blinded to all other clinical and imaging data of the patients. A single-trained neuroradiologist (RZ) performed the quantitative assessments twice, at an interval of three months apart. Another neuroradiologist (PH) independently made the measurements on the same patients. The intraobserver intraclass correlation coefficients (ICCs) were 0.91 for grading of DMVs. The interobserver ICCs was 0.89 for grading of DMV. ICCs were described in detail elsewhere. 21
Statistical analysis
To analyze the correlation between FAt and DMVs scores, we performed linear regression test controlling for age, sex and hypertension. A one-way analysis of variance was used to investigate the difference of FAt between patients with different DMVs scores in each subregion. To examine the potential mediating role of fFW on the relationship between DMVs disruption and white matter integrity, mediation analyses were performed using PROCESS for SPSS 2.15.1 framework (Hayes, 2012). DMVs score, fFW and FAt functioned as predictor, mediator, and outcome, respectively (Figure 1). On an exploratory basis, we examined each of the DMVs drainage subregion separately. We first included age and sex in the model; and then we added hypertension in the second model; finally, we added CBF and lacune numbers of each region to the third model. All analyses were performed blinded to participant identifying information. A p value of <0.05 was considered to be statistically significant. All statistical analysis was performed with SPSS package (22.0 for Windows).
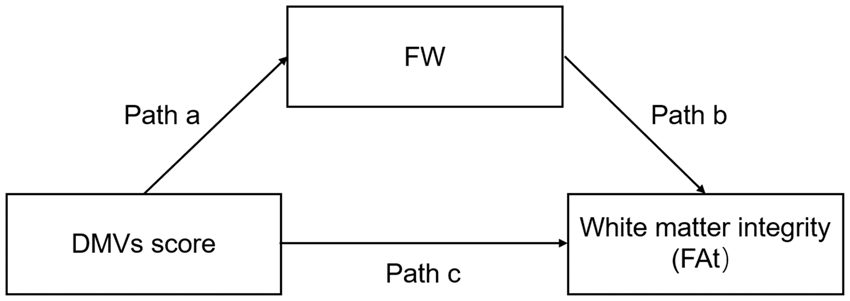
Mediation models to explore the relationship between deep medullary veins (DMVs) score, fraction of free water (fFW) and tissue fractional anisotropy (FAt). Path a explores whether variations in DMVs score account for variations in fFW. Path b explores whether variations in fFW account for variations in FAt. Path c explores the direct effect of DMVs on FAt. Path a, b, c and ab were corrected for age and sex (cerebral blood flow of each region was included in the second part of the mediation study).
Results
Subjects characteristics
Totally, 104 patients were enrolled in this study (53 females; mean age, 61.6 ± 11.0 years). Characteristics of the study samples are presented in Table 1. Briefly, patients’ median WMH volume was 32.9 mL (13.7 mL–52.7 mL). Median Fazekas periventricular WMH score was 2 (1–3), and median Fazekas deep WMH scores was 2 (1–3). Patients’ median total DMVs score was 9. Forty-one (39.2%) subjects presented with microbleeds, and 48 (46.2%) subjects presented with lacunes.
Patients characteristics.
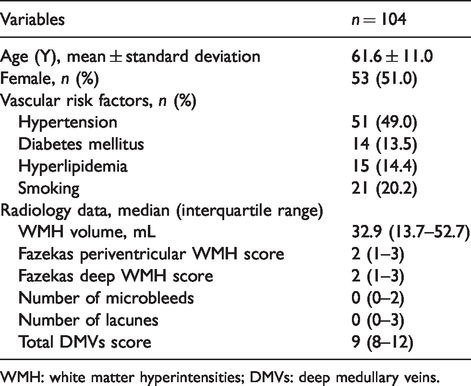
WMH: white matter hyperintensities; DMVs: deep medullary veins.
Relationship between DMVs and white matter integrity
As shown in Figure 2(a), total DMVs score was correlated with FAt (standardized β = −0.300, p = 0.002) in DMVs drainage area. After adjusting for age, sex and hypertension, the correlation remained significant (standardized β = −0.354, p < 0.001). Figure 2(b) shows the FAt in DMVs drainage subregions with different DMVs scores. Additionally, as shown in Figure 2(c), after adjusting for age, sex and hypertension, FAt of each subregion correlated with the DMVs score of the same subregion, respectively.
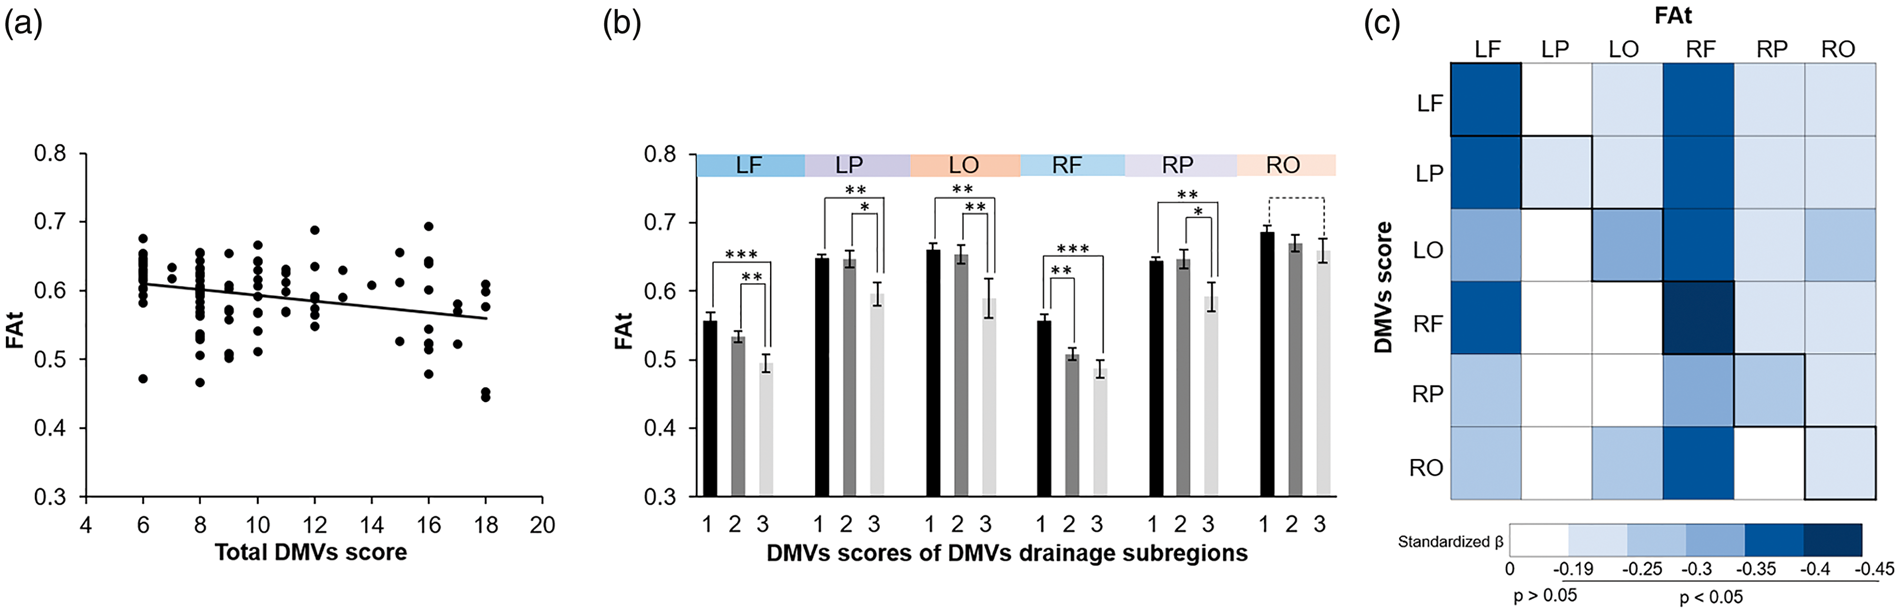
The relationship between deep medullary veins (DMVs) score and tissue fractional anisotropy (FAt). (a) Results from simple linear regression analyses between total DMVs score and FAt of the DMVs drainage area. (b) FAt in DMVs drainage subregions with different DMVs scores. (c) Correlation matrix illustrating the relationship between DMVs regional score and FAt of the DMVs drainage subregion. LF: left frontal; LP: left parietal; LO: left occipital; RF: right frontal; RP: right parietal; RO: right occipital. *p<0.05; **p<0.01; ***p<0.001.
Mediation analysis of fFW for the association between DMVs score and white matter integrity
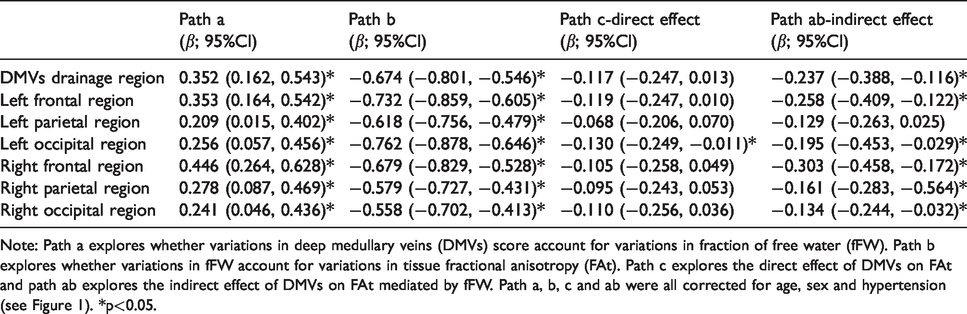
Tables 2 to 4 describe the relationship between DMVs score, fFW and FAt. After adjusted for age, sex, higher DMVs score was associated with lower FAt. The indirect effect of DMVs score on FAt was mediated by fFW (Table 2). To adjust the possible effect of hypertension on our results, we did another mediation test controlling for age, sex and hypertension, and the relationship between total DMVs score, fFW and FAt was still significant. The mediation effect also existed in DMVs drainage subregions except for the left parietal region (Table 3). Besides, to correct the effect of arterial blood flow and lacunes, we reinvestigate the relationship between DMVs scores, fFW and FAt controlling for age, sex, hypertension, regional CBF and regional lacunes. Our findings remained significant except for the left parietal region (Table 4). Figure 3 is an example figure illustrating the relationship between DMVs, fFW and FAt.
Results of the mediation analysis on DMVs score, fFW and FAt.
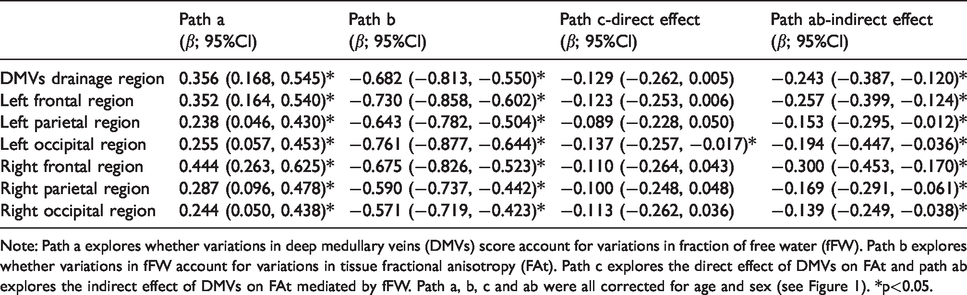
Note: Path a explores whether variations in deep medullary veins (DMVs) score account for variations in fraction of free water (fFW). Path b explores whether variations in fFW account for variations in tissue fractional anisotropy (FAt). Path c explores the direct effect of DMVs on FAt and path ab explores the indirect effect of DMVs on FAt mediated by fFW. Path a, b, c and ab were all corrected for age and sex (see Figure 1). *p<0.05.
Results of the mediation analysis on DMVs score, fFW and FAt controlling for age, sex and hypertension.
Note: Path a explores whether variations in deep medullary veins (DMVs) score account for variations in fraction of free water (fFW). Path b explores whether variations in fFW account for variations in tissue fractional anisotropy (FAt). Path c explores the direct effect of DMVs on FAt and path ab explores the indirect effect of DMVs on FAt mediated by fFW. Path a, b, c and ab were all corrected for age, sex and hypertension (see Figure 1). *p<0.05.
Results of the mediation analysis on DMVs score, fFW and FAt controlling for age, sex, hypertension, lacunes and CBF.
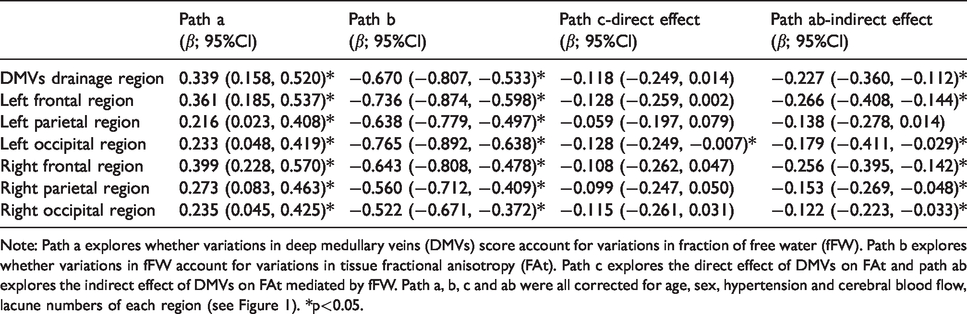
Note: Path a explores whether variations in deep medullary veins (DMVs) score account for variations in fraction of free water (fFW). Path b explores whether variations in fFW account for variations in tissue fractional anisotropy (FAt). Path c explores the direct effect of DMVs on FAt and path ab explores the indirect effect of DMVs on FAt mediated by fFW. Path a, b, c and ab were all corrected for age, sex, hypertension and cerebral blood flow, lacune numbers of each region (see Figure 1). *p<0.05.
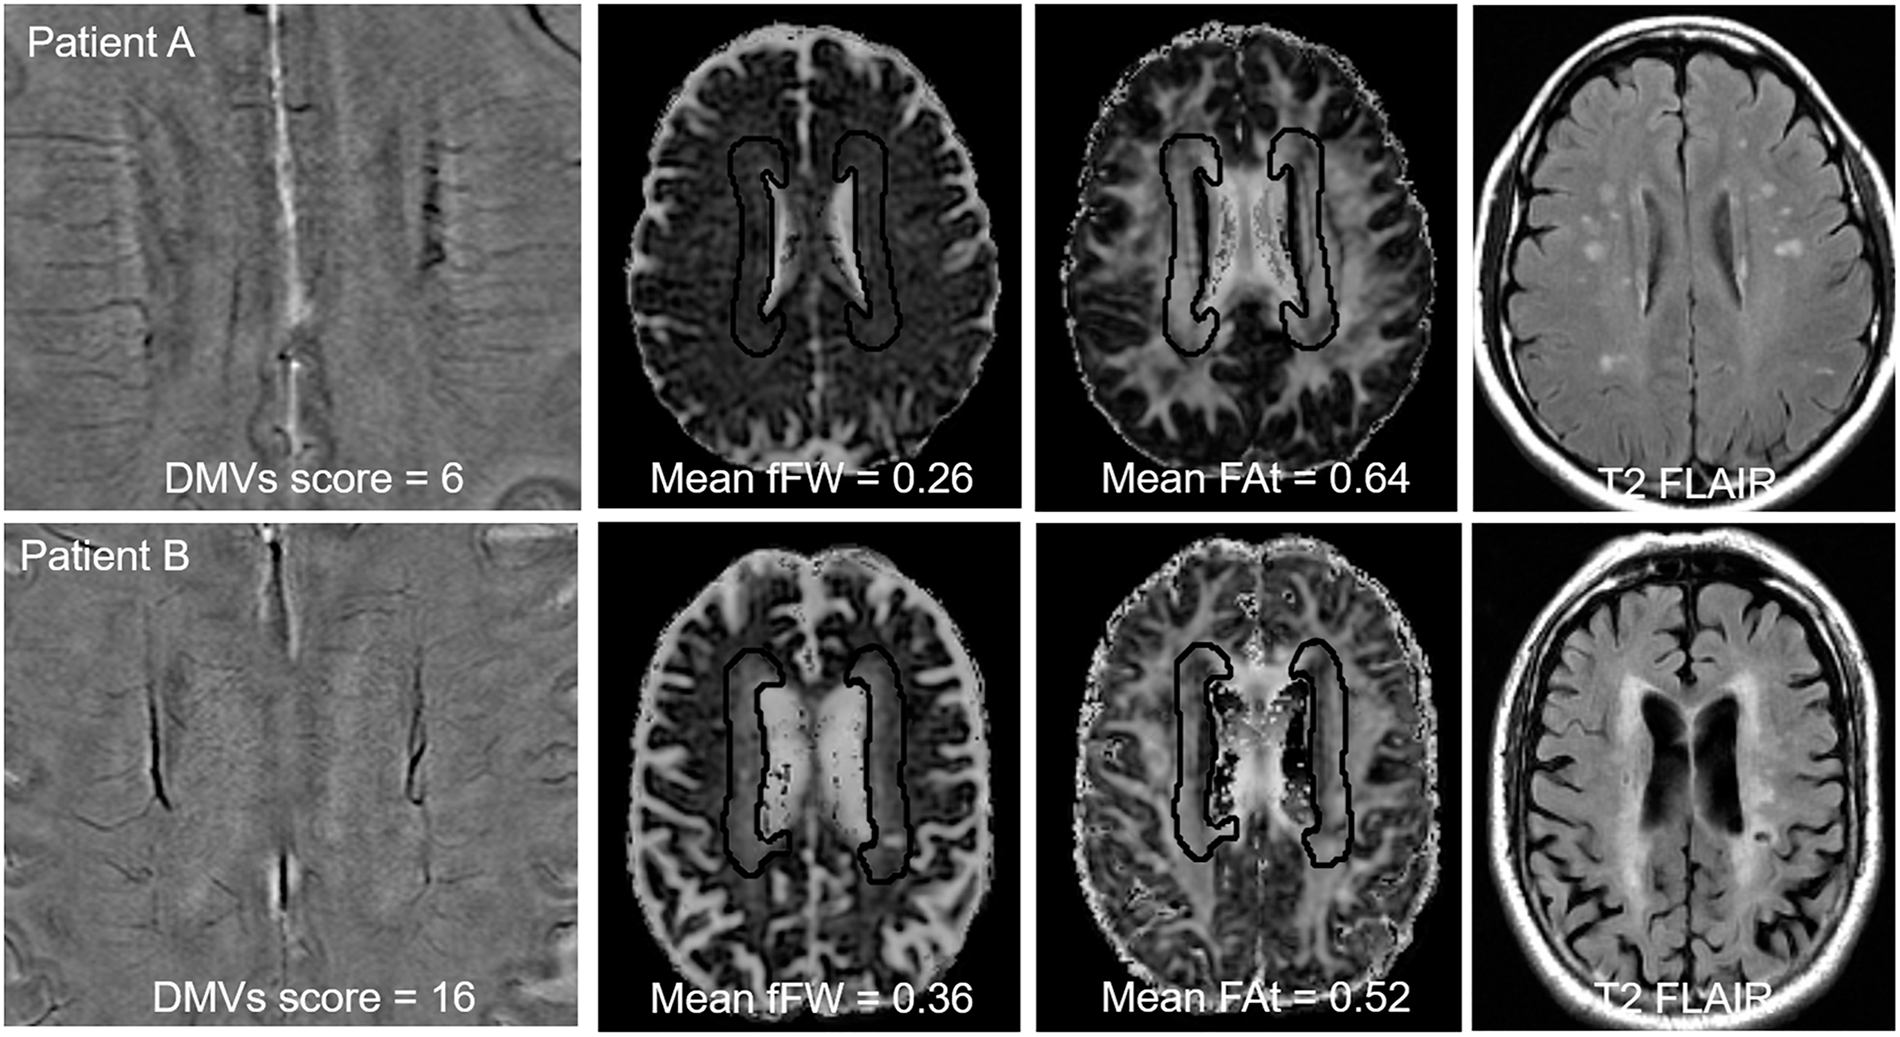
Representative images indicating the correlation between deep medullary veins (DMVs), fraction of free water (fFW) and white matter damage. Patient A presented with low DMVs score on susceptibility-weighted imaging (SWI) phase image (left), low fFW (middle left), high tissue fractional anisotropy (FAt) (middle right) and mild WMH (right) in the DMVs drainage area. While patient B presented with high DMVs score on SWI phase image (left), high fFW (middle left), low FAt (middle right) and extensive WMH in the DMVs drainage area.
Discussion
In the current study, we found that DMVs score was associated with FAt in CSVD patients, and this effect was mediated by fFW. The relationship between DMVs score, fFW and FAt was significant in DMVs drainage regions and subregions except for left parietal region. The mediation effect was independent of hypertension, CBF and lacune numbers, demonstrating the existence of DMVs disruption – increased interstitial fluid – white matter damage link in CSVD patients.
Venous disruption-related white matter damage in CSVD patients had been proposed since Moody et al. 8 discovered venous collagenosis in WMH areas in 1995. Venous collagenosis could lead to intramural thickening, stenosis and ultimately luminal occlusion, resulting in the elevation of venous pressure. 6 Animal study discovered that venous hypertension could lead to neuronal degeneration and loss of white matter integrity. In venous hypertension animal models, oligodendrocytes showed necrosis and nuclear shrinkage, while the lamellar structure of the myelin sheath was loose and damaged under electron microscope. 22 Consistently, our imaging study found that DMVs score was associated with FAt, demonstrating the connection between venous disruption and loss of white matter integrity in CSVD patients.
Notably, our study demonstrated the mediation role of fFW between DMVs score and white matter integrity. Previous studies demonstrated that elevation of fFW was associated with vasogenic edema within the brain parenchyma in the extracellular space due to processes such as ischemic stroke 23 and tumors. 16 In CSVD patients, DMVs disruption could result in the resistance to cerebrospinal fluid absorption and increased fluid leakage into the perivascular space, leading to interstitial edema. Previous studies on cerebral venous thrombosis also found that venous occlusion could lead to brain edema, 24 providing evidence for our hypothesis. Moreover, recent studies using FW model revealed that fFW elevation was more extensive than the alterations of FAt in CSVD patients, suggesting that fFW elevation might be an earlier event than the loss of white matter integrity.17,25 These evidences support the DMVs disruption – increased interstitial fluid – white matter damage link in CSVD patients.
In addition, our study found that the relationship between DMVs score, fFW and FAt was independent of hypertension, CBF and lacune numbers. A recent study demonstrated that hypertension was related to elevated fFW and decreased FAt, and the relationship was mediated by arterial stiffness. 25 Low CBF has been demonstrated to be related with atherosclerosis 26 and could lead to white matter damage.5,27 Lacune numbers also reflected the disruption of perforator arteries and could affect regional FAt and fFW. While previous studies focused on the arterial side mechanism of white matter damage, our study demonstrated the venous side of hemodynamic alteration related extracellular water increase and white matter damage.
Recently, Houck et al. 28 discovered that increased diameters of the internal cerebral veins and the basal veins of Rosenthal were associated with WMH volume in elderly people, indicating the drainage relationship between cortical venous and white matter. However, due to lack of histologic evidence, the association between cortical venous disruption and white matter damage still needs further investigation.
Previous studies found that DMVs disruption was associated with cognitive decline and dementia. 29 Our study discovered the relationship between DMVs disruption and white matter damage. Considering the close connection between white matter damage and cognitive decline, 30 our study might discover the potential pathway of how DMVs disruption led to cognitive decline and open new avenues for venous-related therapies.
Our study had limitations. First, it was a cross-sectional study. Causality of the conclusions above was difficult to prove, and follow-up studies are required to clarify the causal relationship between DMVs disruption, interstitial edema and white matter damage. Second, our cohort only included Chinese patients at a single institution who had distinct imaging changes or symptoms, and the exclusion criteria were strict. Therefore, it may not represent the full spectrum of CSVD patients, and the generalizability of our results needs confirmation and extension in larger and multicenter cohorts. Third, we lacked histopathology data, making it difficult to correlate DTI changes with histopathology. However, quantifying water distribution in postmortem tissue is very challenging due to fixation and influences from postmortem interval. Fourth, as DMVs score was developed by our own group and has not been used by other groups, reproducibility and validity of DMV score need verification from peer researchers. Fifth, in the present study, we focus on the periventricular region along the body of the lateral ventricle and did not assess the lower frontal and occipital horns of the lateral ventricles, which were also common regions for CSVD-related white matter damage. Future studies regarding these regions are expected.
In summary, our findings elucidated the venous side of pathogenic mechanisms of white matter damage in CSVD patients. The DMVs disruption – increased interstitial fluid – white matter damage link might provide insights in new therapies for CSVD-related white matter damage.
Footnotes
Funding
The author(s) disclosed receipt of the following financial support for the research, authorship, and/or publication of this article: This study was funded by the 13th Five-year Plan for National Key Research and Development Program of China (Grant No. 2016YFC1306600 and 2016YFC1300504), Zhejiang Provincial Natural Science Foundation of China (grant number: LSZ19H180001 and LQ20H180015), National Natural Science Foundation of China (grant number: 81271530 & 81771820), Health and Family Planning Commission of Zhejiang Province (grant number: 2016KYA099), the China Postdoctoral Science Foundation (Grant No. 2019M662083) and the Zhejiang province Postdoctoral Science Foundation.
Declaration of conflicting interests
The author(s) declared no potential conflicts of interest with respect to the research, authorship, and/or publication of this article.
Authors’ contributions
RZ and PH drafted the manuscript, participated in study design and data collection, conducted the statistical analyses, analyzed, and interpreted the data. MZ and ML participated in study design and data collection, data interpretation and made a major contribution in revising the manuscript. YJ, SW, HH and XY participated in the data collection and made contribution in revising the manuscript. XL and XX assisted in designing the MRI sequences, data collection and imaging analysis. KL, QZ and XW participated in the data collection and assisted in imaging analysis.