
Abstract
In order to evaluate the capability of 2-tert-butyl-4-chloro-5-{6-[2-(2-[18F]fluoroethoxy)-ethoxy]-pyridin-3-ylmethoxy}-2H-pyridazin-3-one ([18F]BCPP-EF), a novel positron emission tomography (PET) probe for mitochondrial complex I (MC-I) activity, to assess neuronal activation, an activation PET study was conducted in the conscious monkey brain with a continuous unilateral vibrotactile stimulation. PET scans with [15O]H2O, [18F]BCPP-EF, or 2-deoxy-2-[18F]fluoroglucose ([18F]FDG) were conducted under: (1) resting conditions; (2) a continuous vibration stimulation; (3) a continuous vibration stimulation after 15-min pre-vibration; and (4) a continuous vibration stimulation after 30-min pre-vibration. The contralateral/ipsilateral ratio (CIR) in the somatosensory cortex showed significant increases in the uptake of [15O]H2O, [18F]BCPP-EF, and [18F]FDG with the vibration stimulation. The longer pre-vibration duration induced significantly lower CIR in regional cerebral blood flow (rCBF) measured using [15O]H2O, whereas it did not affect the CIR in [18F]BCPP-EF or the regional cerebral metabolic rate of glucose (rCMRglc) measured using [18F]FDG 30–60 min after the injection. These results suggest that the [18F]BCPP-EF response in the later phase of scans was not influenced by the increase in rCBF, indicating the capability of [18F]BCPP-EF to detect acute changes in MC-I activity induced by neuronal activation. However, the metabolic shift from glycolysis to oxidation was not observed under the stimulation used here.
Keywords
Introduction
Mitochondria are crucial organelles for oxidative metabolism in eukaryotic cells. The electron transport chain (ETC), which is located on the inner membrane of mitochondria and consists of mitochondria complexes I to V, is the site for oxidative phosphorylation (OXPHOS) and aerobic adenosine triphosphate (ATP) production. Mitochondrial complex I (MC-I; NADH-ubiquinone oxidoreductase, EC 1.6.5.3) is the first and largest enzyme in the ETC, catalyzing electron transfer from NADH to ubiquinone. 1 Dysfunctions in MC-I in brain cells lead to neurodegenerative diseases such as stroke and Alzheimer’s and Parkinson’s diseases. To obtain a better understanding of the metabolic role of MC-I in the pathology of these diseases using positron emission tomography (PET), we developed a novel PET probe, 2-tert-butyl-4-chloro-5-{6-[2-(2-[18F]fluoroethoxy)-ethoxy]-pyridin-3-ylmethoxy}-2H-pyridazin-3-one ([18F]BCPP-EF), to image MC-I activity. 2 Previous in vitro and in vivo studies validated its specificity for MC-I.2–5 It has been successfully applied to the imaging of chronic changes in MC-I activity related to physiological brain aging 5 and neurodegenerative diseases, such as ischemic stroke4,6 and Alzheimer’s 7 and Parkinson’s diseases,8,9 in disease models of rats 4 and non-human primates.5–9 PET imaging of MC-I activity with [18F]BCPP-EF has also been used to evaluate the therapeutic effects of a neuroprotectant for cerebral ischemia/reperfusion (I/R) injury in the rat brain. 10
Despite its potential for imaging chronic MC-I impairments, it currently remains unclear whether [18F]BCPP-EF has the ability to detect acute changes in MC-I activity under neuronal activation induced by certain physiological stimulations. Regional cerebral blood flow (rCBF), the regional cerebral metabolic rate of glucose (rCMRglc), and the regional cerebral metabolic rate of O2 (rCMRO2) were found to couple well under resting conditions, indicating that the majority of glucose is metabolized through the oxidative pathway. 11 However, it has not yet been established whether the relationship between blood flow and oxidative metabolism is dynamically maintained during neuronal activation. Fox and Raichle reported uncoupling between marked rCBF increases (29% on average) and insignificant rCMRO2 increases (5% on average) in the human somatosensory cortex with a vibrotactile stimulation. 12 A similar mismatch was present in the human visual cortex between rCBF and rCMRO2 with a visual stimulation; however, rCBF and rCMRglc coupled to each other. 13 These findings suggested a preference for aerobic glycolysis (i.e. the Warburg effect) under activation conditions and the metabolism of the majority of glucose into lactate despite an adequate oxygen supply. 14 While these findings were supported by investigations that extended to other types of stimulations or imaging techniques,15–18 previous studies reported a significant increase in rCMRO2 when the stimulation was prolonged 19 or more complex.20–22 As described above, [18F]BCPP-EF specifically binds to MC-I, which is exclusively involved in OXPHOS. In contrast to 2-deoxy-2-[18F]fluoroglucose ([18F]FDG), a traditional PET probe that measures rCMRglc but cannot discriminate between the glycolytic and OXPHOS pathways, [18F]BCPP-EF uniquely probes the OXPHOS pathway by imaging MC-I activity, thereby providing a better insight into energy metabolism. Since local oxidative metabolism indexed by CMRO2 remains controversial, the introduction of [18F]BCPP-EF to measure the intensity of OXPHOS under activation conditions may contribute to clarifying the underlying mechanisms.
Although previous studies demonstrated that [18F]BCPP-EF uptake was less dependent on rCBF changes under resting conditions,5,6 the rCBF effect on [18F]BCPP-EF uptake needs to be re-evaluated before applying [18F]BCPP-EF to monitor neuronal activation. Under focal brain activation, rCBF may be acutely increased to meet the oxygen and glucose demands of neurons. Based on rapidly increased rCBF and the diffusibility of [18F]BCPP-EF, neuronal activation-related changes in [18F]BCPP-EF uptake may merely reflect rCBF changes, leading to the overestimation of MC-I activation.
The present study had two purposes: (1) to evaluate whether [18F]BCPP-EF is capable of detecting acute changes in MC-I activity under brain activation without being affected by rCBF changes; and, if so, (2) to examine if there is a metabolic pathway shift from aerobic glycolysis to OXPHOS during continuous neuronal activation. The uptake of [15O]H2O, [18F]BCPP-EF, and [18F]FDG was assessed in the brains of conscious monkeys receiving a vibrotactile stimulation using high-resolution PET. A previous study reported that the degrees of rCBF responses decreased proportionately to the duration of the continuous stimulation in the human somatosensory cortex. 23 Therefore, to investigate the effects of the rCBF response on [18F]BCPP-EF uptake in the somatosensory cortex, PET measurements were initiated from 0, 15, or 30 min after the onset of the vibrotactile stimulation in order to reduce the increased degree of rCBF by the stimulation, and changing patterns of rCBF and [18F]BCPP-EF responses were compared. To further investigate the existence of a pathway shift, PET measurements with [18F]FDG were initiated from 0 or 30 min after the onset of the vibrotactile stimulation, and changing patterns of rCMRglc and [18F]BCPP-EF responses were also compared.
Materials and methods
Animals and drugs
Experiments in this study were reported in compliance with the ARRIVE guidelines (Animal Research: Reporting in Vivo Experiments). Animals were maintained and handled in accordance with the recommendations of the US National Institutes of Health and the guidelines of the Central Research Laboratory, Hamamatsu Photonics. The following experiments were approved by the Ethical Committee of the Central Research Laboratory, Hamamatsu Photonics (Approved number. HPK-2017-02). Five young male rhesus monkeys (Macaca mulatta) weighing 4.7–8.7 kg were used for PET measurements. Before the attachment of an acrylic head holder for fixation, magnetic resonance (MR) images (MRIs) of monkeys were obtained with a 3.0-T MR scanner (Signa Excite HDxt 3.0 T; GE Healthcare Japan, Tokyo, Japan) using a 3D-Spoiled Gradient Echo sequence (176 slices with a 256 × 256 image matrix, slice thickness/spacing of 1.4/0.7 mm, echo time: 3.4 to 3.6 ms, repetition time: 7.7 to 8.0 ms, inversion time: 400 ms, and flip angle: 15°) under pentobarbital anesthesia. Then, at least three months before the PET study, an acrylic plate for head fixation was attached to the skull under pentobarbital anesthesia. Prior to PET experiments, monkeys underwent sit training on a chair under conscious condition twice a week for one month to acclimatize to the study conditions.
The precursor of [18F]BCPP-EF and its corresponding non-radioactive compounds were purchased from the NARD Institute (Amagasaki, Japan). Kryptofix222® (K[2,2,2]) and mannose triflate was obtained from ABX (Radeberg, Germany).
PET ligand syntheses
[18F]BCPP-EF was radiolabeled as reported previously. 2 Radiochemical purity was more than 99% and molar activity was 43.1 ± 11.8 GBq/μmol. Oxygen-15 was produced by the reaction 14 N(d,n) 15 O, and the [15O]O2 obtained was converted into [15O]H2O by reduction under a high temperature. [18F]FDG was produced by the nucleophilic 18F-fluorination of mannose triflate following the basic hydrolysis of 2-deoxy-2-[18F]fluoro-1,3,4,6-tetra-O-acetyl-glucose. 24
PET measurements
Regarding measurements under conscious conditions, PET scans were performed as reported previously.5,7,9 After overnight fasting, a venous cannula for the PET ligand injection was inserted into the right inferior limb of monkeys. During PET scans, monkeys were seated on the restraining chair with their limbs fixed by bandages. Their head was rigidly immobilized by an acrylic head holder previously attached to achieve the stereotaxic coordination aligned parallel to the orbitomeatal (OM) line. Monkeys were left alone in quiet PET room during PET measurements to avoid the unnecessary stresses from humans, and scans were performed under dim light. PET probes were administered using an automated injector (Hamamatsu Photonics K.K.) controlled from the next control room.
To activate the hand area of the somatosensory cortex in the left hemisphere, monkeys were given a vibrotactile stimulation of 93 ± 2 Hz on their right forepaw using a vibrator (mini MASSAGER G-2; Kawasaki-Seiji Co., Ltd, Tokyo, Japan). The vibrator was fixed to the finger tips using tape. It was controlled by a remote switch from the next control room. Data were collected on a high-resolution animal PET scanner (SHR-38000; Hamamatsu Photonics K.K., Hamamatsu, Japan). Each monkey underwent 10 scan days totally; four days were for [18F]BCPP-EF measurements (experimental duration; from 90 to 120 min including a transmission scan), three days for [18F]FDG measurements (from 90 to 120 min), and three days for [15O]H2O measurements (from 158 to 308 min). On a single scan day, a transmission scan was firstly performed for 30 min, then the emission scan was performed with [15O]H2O, [18F]BCPP-EF, or [18F]FDG. At least one-week recovery period was taken between scans.
In the [18F]BCPP-EF measurement, the scan was started immediately after a bolus injection of [18F]BCPP-EF (ca. 240 MBq) and continued for 60 min. The vibrotactile stimulation on the monkey’s right forepaw was initiated 0, 15, or 30 min prior to the onset of the emission scan and was stopped at the end of data acquisition (Figure 1(d)). These three conditions were thereafter abbreviated as ‘Vib0’, ‘Vib15’, and ‘Vib30’. Under the ‘Rest’ condition, the vibrator was kept off during the whole scan (Figure 1(c)). [18F]FDG measurements were conducted under the ‘Rest’, ‘Vib0’, and ‘Vib30’ conditions, in which scans were started immediately after a bolus injection of [18F]FDG (ca. 150 MBq) and continued for 60 min (Figure 1(c) and (d)).
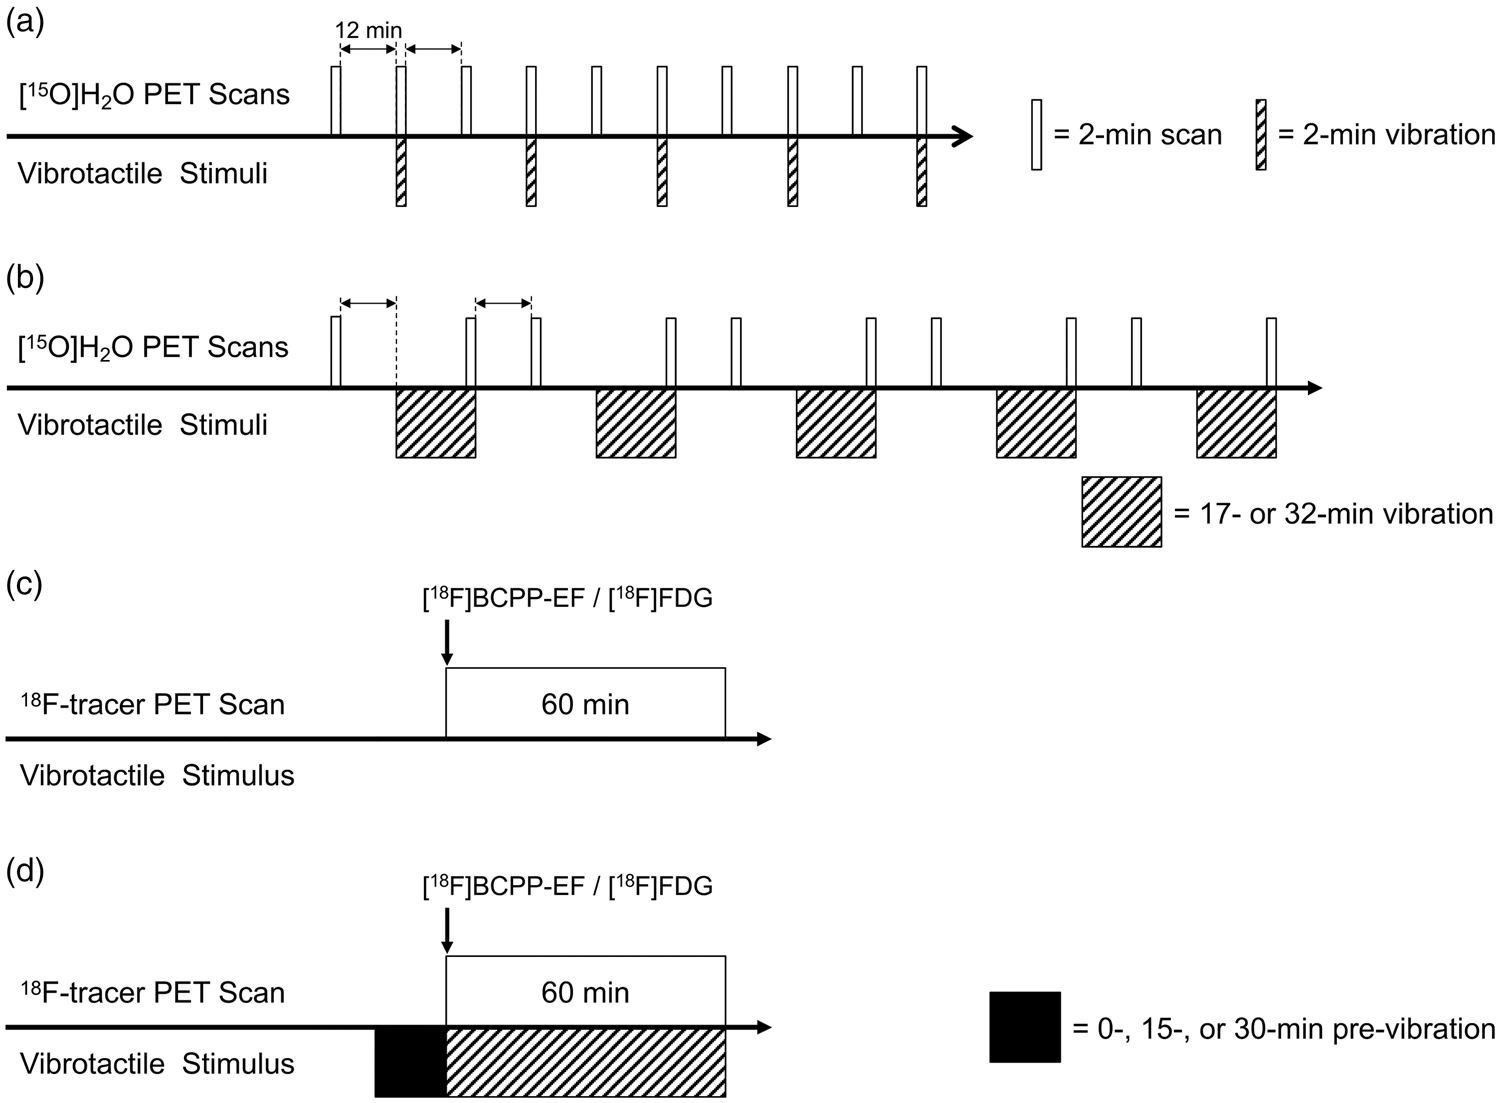
Positron emission tomography (PET) imaging protocol of [15O]H2O measurements under ‘Rest’ and ‘Vib0’ conditions (a), ‘Rest’ and ‘Vib15’ or ‘Vib30’ conditions (b); and [18F]BCPP-EF or [18F]FDG measurements under the ‘Rest’ condition (c), ‘Vib0’, ‘Vib15’, or ‘Vib30’ condition (d). ‘Rest’, resting condition without the vibration stimulation; ‘Vib0’, continuous vibration stimulation without pre-vibration; ‘Vib15’, continuous vibration stimulation after 15-min pre-vibration; ‘Vib30’, continuous vibration stimulation after 30-min pre-vibration.
In [15O]H2O measurements, a bolus injection of [15O]H2O (ca. 580 MBq) was conducted. An emission scan was started 10 s after the start of the [15O]H2O injection and lasted for 2 min. Each monkey had rCBF measured under the same four conditions with [18F]BCPP-EF measurements as described above, and 10 [15O]H2O scans (5 scans/condition × 2 conditions) were performed at 12-min intervals on a single scan day (Figure 1(a) and (b)).
PET data analyses
Original data acquisition was in the list-mode format. PET images were reconstructed by an iterative 3D dynamic raw-action maximum likelihood algorithm (3D-DRAMA) 25 with a Gaussian filter of 1.0 mm in full width at half maximum (FWHM), yielding a voxel size of 0.65 × 0.65 × 1.0167 mm3 for reconstructed images. Transmission data on the same scan day were used for attenuation corrections. In each [18F]BCPP-EF or [18F]FDG scan, summation images of the entire scan (0–60 min) as well as the early phase (0–30 min) and late phase (30–60 min) of the scan were reconstructed. Dynamic images with frame durations of 6 × 10 s, 2 × 30 s, 8 × 60 s, and 10 × 300 s were also generated. A summation image of 0–1 min was generated for each [15O]H2O scan.
Reconstructed PET images were scaled to standardized uptake value (SUV) images by multiplying the ratio of body weight and total injected activity. All SUV images were then pre-processed using SPM (https://www.fil.ion.ucl.ac.uk/spm/) with the following steps: (1) the realignment of SUV images from the same scan; (2) co-registration between individual MRI and average realigned SUV images; (3) normalization of co-registered MRI and SUV images to the standard template of the monkey brain, 26 ensuring all images were in the same atlas space; and (4) smoothing with a 3.0-mm filter.
To identify the region of interest (ROI), pre-processed [15O]H2O images were compared between the ‘Rest’ and ‘Vib0’ conditions using voxel-wise statistical tests in SPM. Each condition had 25 (5 scans ×5 monkeys) images. The threshold was set at p < 0.05 with the FWE correction. The most activated region was defined as ROI, covering a volume of 0.172 cm3. A symmetrical ROI was then created in the ipsilateral hemisphere by reflection about the midsagittal plane. These ROIs were placed on pre-processed images from all monkeys in this study. The SUVs of ROIs were obtained using PMOD software (PMOD Technologies Ltd, Zurich, Switzerland) and ROI SUVs derived from dynamic images were plotted as time-activity curves (TACs).
Prior to further analyses, two manipulations were operated on ROI SUVs for each monkey. Regarding [15O]H2O, the average ROI SUV of five scans was calculated for each condition. Concerning [18F]BCPP-EF and [18F]FDG, ROI SUVs of 0–15 min, 15–30 min, 30–45 min, and 45–60 min after the onset of the scan were computed from TAC, dividing the area under the curve (AUC) in a certain time period by the duration of that period. The contralateral/ipsilateral ratio (CIR) of the ROI SUV was subsequently calculated. Responses to the stimulation (i.e. increase rates in CIR from resting conditions) were calculated by normalizing CIR under stimulated conditions to CIR within the same scan period under the corresponding resting conditions. The rCBF responses of five monkeys were statistically analyzed. [18F]BCPP-EF responses and rCMRglc responses were statistically analyzed using four out of five monkeys because one monkey showed an abnormal somatosensory response. Strange to say, this monkey responded significantly to the vibrotactile stimulation when assessed using [15O]H2O (rCBF response), however did not do at all when assessed using either [18F]FDG (rCMRglc response) or [18F]BCPP-EF (MC-I response).
Statistical analyses
Results are expressed as means ± SD. To investigate the changing pattern with the pre-vibration duration of each type of response, comparisons between conditions were performed using the paired, one-tailed Student’s t-test. Changing patterns of rCBF responses and [18F]BCPP-EF responses were compared to evaluate whether [18F]BCPP-EF detects stimulation-induced MC-I activation without being influenced by rCBF changes. If it did, changing patterns of [18F]BCPP-EF responses and rCMRglc responses were compared to examine the existence of a pathway shift. A probability level of less than 5% (p < 0.05) was considered to indicate significance.
Results
Figure 2(a) shows the activated region derived from [15O]H2O images. Voxel-wise statistical tests of differences between the ‘Rest’ and ‘Vib0’ conditions were conducted in SPM. The generated T map was then superimposed on the standard template of the monkey brain. 26 The greatest difference was located in the upper somatosensory cortex in the contralateral hemisphere (pcorrected < 0.05). This activated area was defined as the common ROI for all scans. To compare uptake by the ipsilateral and contralateral hemispheres, a symmetric position in the ipsilateral somatosensory cortex was also defined as ROI. According to paired t-tests, the CIR of [15O]H2O uptake in the first minute of vibration acutely increased by 15.50 ± 2.13% from the baseline (p < 0.001; Figure 6(a)).
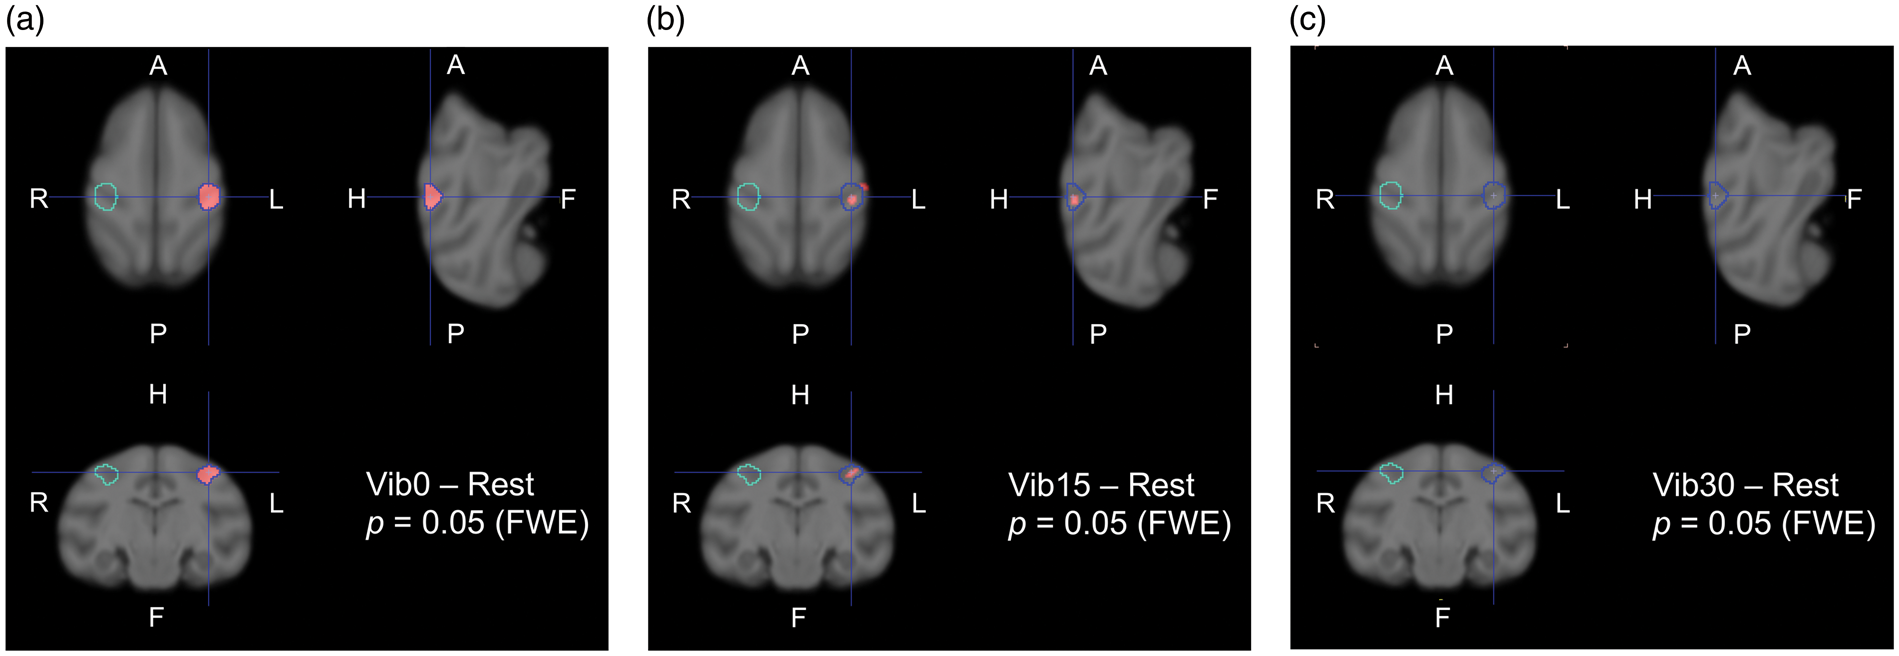
Activated region in the contralateral (left hemisphere) hand area immediately after the onset of the vibration stimulation (a), 15-min continuous vibration (b), and 30-min continuous vibration (c). Activation was computed from [15O]H2O images. Under the same threshold of p < 0.05 with the FWE correction, the activated region in (b) was markedly smaller than that in (a). The latter was defined as the region of interest (ROI). This is a representative image.
ROIs defined from rCBF responses perfectly fit the sensorimotor area in MRI (Figure 3(a)) and the activated area in PET images (Figure 3(b) and (c)) from the same monkey. A typical [18F]BCPP-EF SUV image of 30–60 min after the injection under the ‘Vib0’ condition showed higher uptake in the contralateral somatosensory cortex (Figure 3(b)).
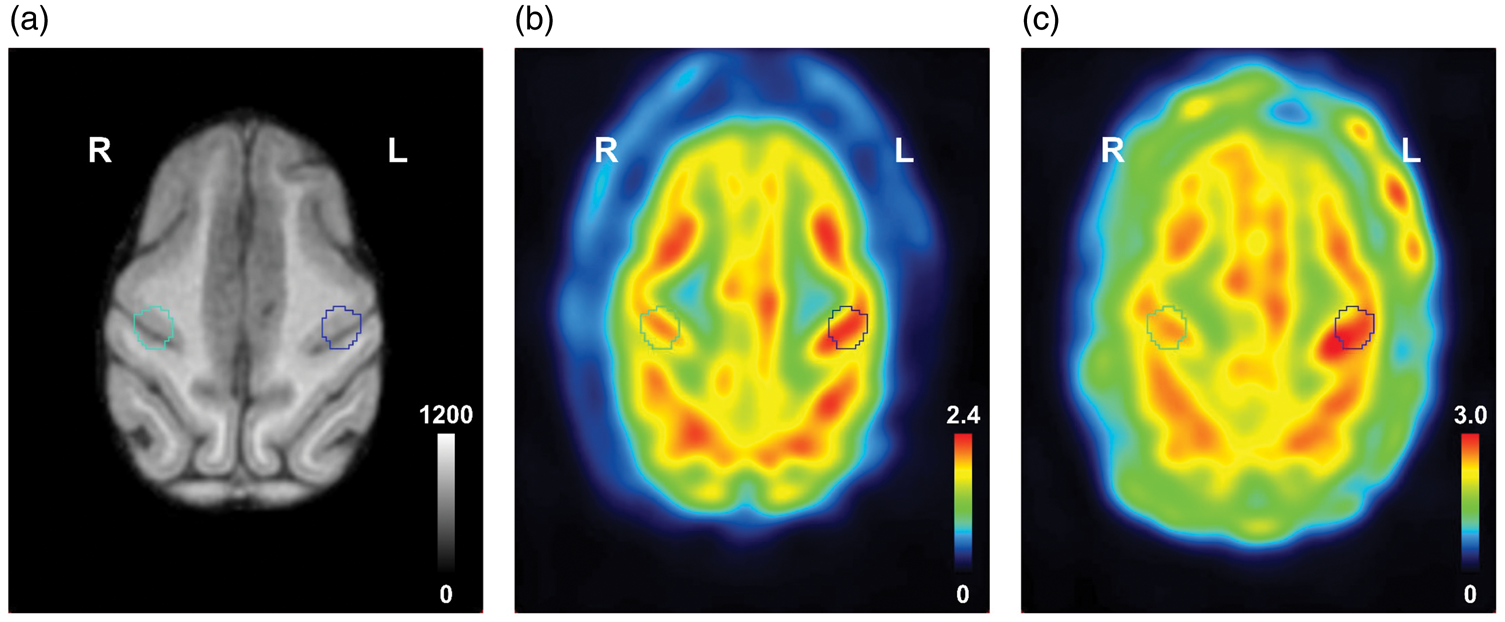
Typical MRI (a) and PET SUV images of [18F]BCPP-EF (b) and [18F]FDG (c) in the brain of a conscious monkey (Macaca Mulatta). PET images were obtained under the ‘Vib0’ condition and summed from 30 to 60 min after the injection. All images displayed the same slice from the same monkey. ‘Vib0’, continuous vibration stimulation without pre-vibration.
In Figure 4(a), average TACs showed that [18F]BCPP-EF was rapidly taken up into the brain under resting conditions, peaked within 10 min, and gradually declined over time. Furthermore, no significant difference was observed between contralateral and ipsilateral SUVs during the whole scan. Under the ‘Vib0’ condition, TACs displayed a similar pattern to resting-state TACs, except for higher activities in contralateral ROI (Figure 4(b)). The difference reached a maximum immediately after the onset of the scan and then gradually decreased until 60 min after the injection. The CIR of [18F]BCPP-EF uptake increased from baseline by 16.67 ± 6.91% (p = 0.008), 11.34 ± 9.49% (p =0.048), 11.40 ± 8.30% (p = 0.035), and 11.13 ± 6.27% (p = 0.019) 0–15 min, 15–30 min, 30–45 min, and 45–60 min after the injection, respectively (Figure 6(b)).
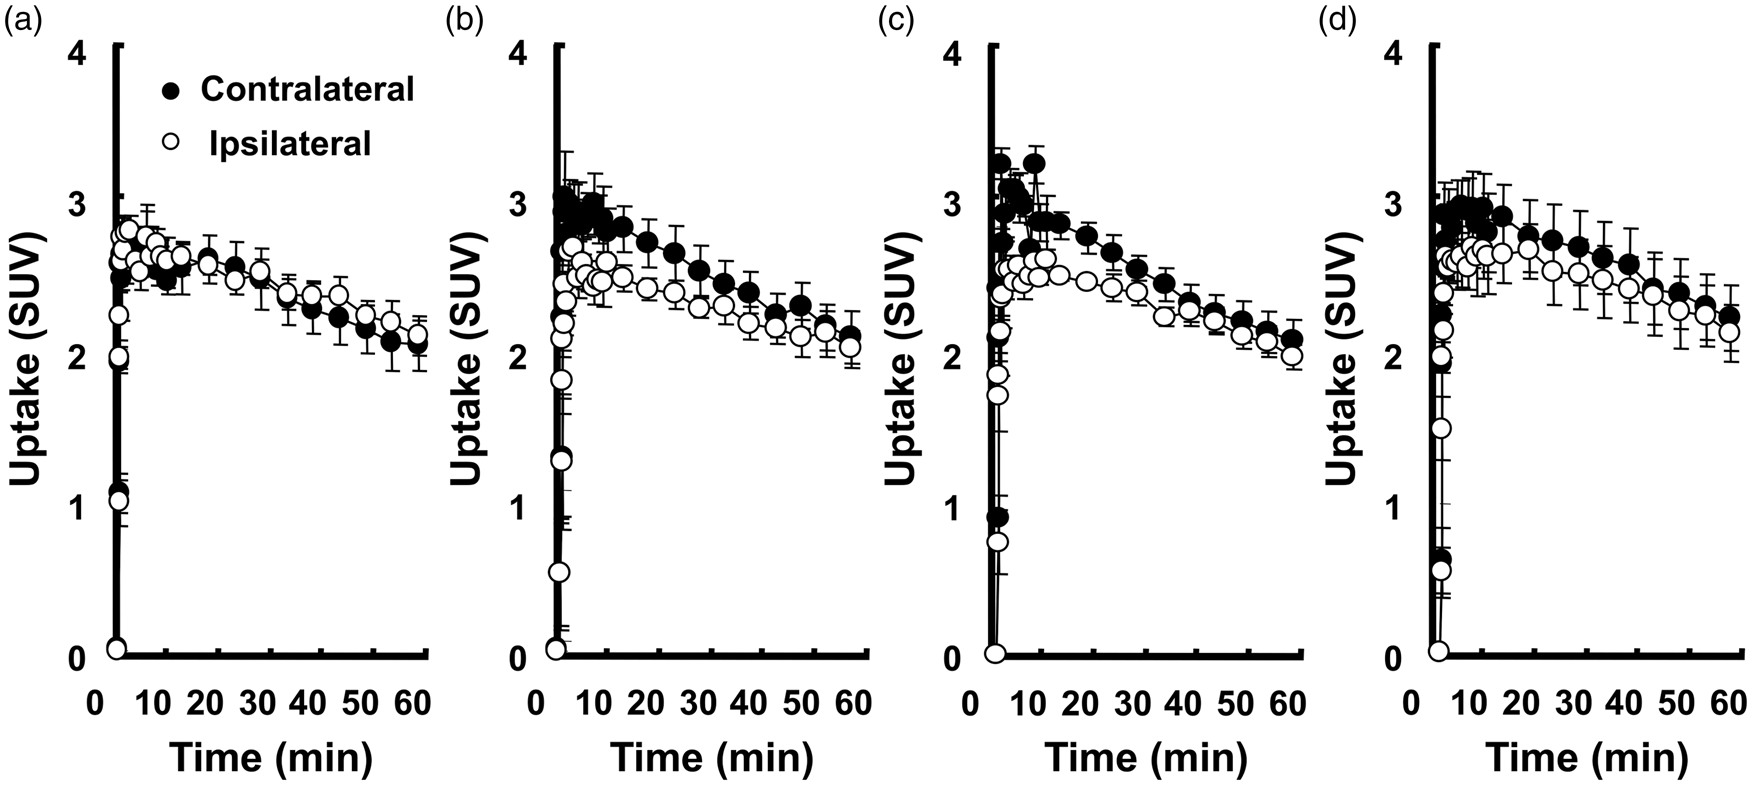
TACs of [18F]BCPP-EF under the ‘Rest’ condition (a), ‘Vib0’ condition (b), ‘Vib15’ condition (c), and ‘Vib30’ condition (d) in ROIs of the hand area. Activities were expressed as mean ± SD (n = 4). ‘Rest’, resting condition without the vibration stimulation; ‘Vib0’, continuous vibration stimulation without pre-vibration; ‘Vib15’, continuous vibration stimulation after 15-min pre-vibration; ‘Vib30’, continuous vibration stimulation after 30-min pre-vibration.
A typical [18F]FDG SUV image of 30–60 min after the injection under the ‘Vib0’ condition also exhibited higher uptake in the contralateral somatosensory cortex (Figure 3(c)). Under the ‘Rest’ and ‘Vib0’ conditions, average [18F]FDG TACs increased slowly and plateaued 30–60 min after the injection (Figure 5(a) and (b)). Uptake in the contralateral ROI was the same as that in the ipsilateral ROI under resting conditions (Figure 5(a)), but higher with the vibrotactile stimulation (Figure 5(b)). A difference was noted approximately 10 min after the injection and continued until the end of the scan. The CIR of [18F]FDG uptake increased from baseline by 6.37 ± 8.33% (p = 0.112), 5.73 ± 6.37% (p = 0.085), 7.15 ± 6.75% (p = 0.062), and 6.09 ± 9.27% (p = 0.140) 0–15 min, 15–30 min, 30–45 min, and 45–60 min after the injection, respectively (Figure 6(c)).
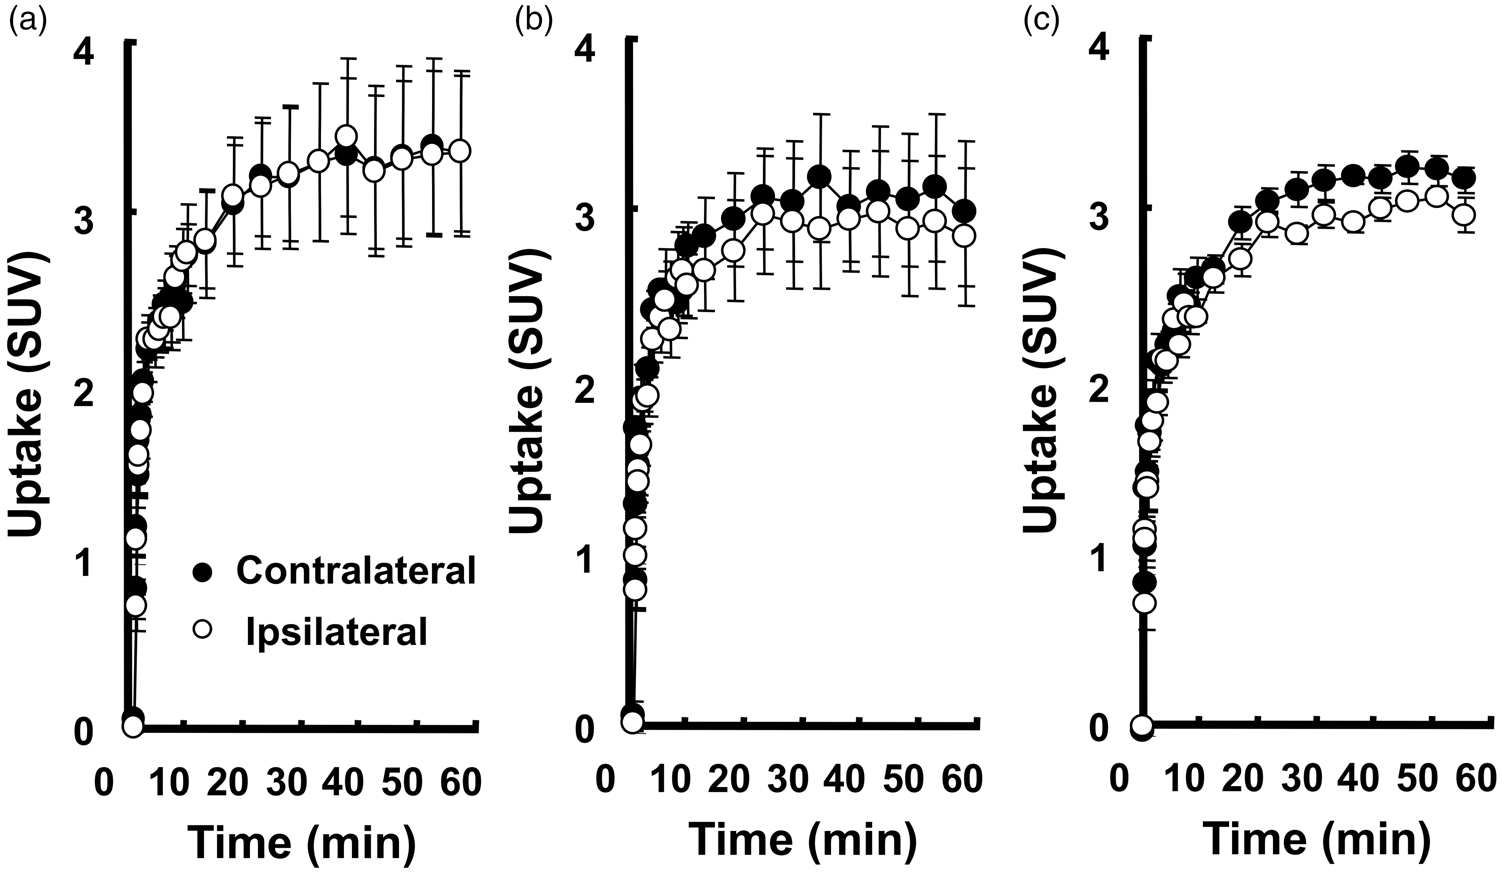
TACs of [18F]FDG under the ‘Rest’ condition (a), ‘Vib0’ condition (b), and ‘Vib30’ condition (c) in ROIs of the hand area. Activities were expressed as mean ± SD (n = 4). ‘Rest’, resting condition without the vibration stimulation; ‘Vib0’, continuous vibration stimulation without pre-vibration; ‘Vib30’, continuous vibration stimulation after 30-min pre-vibration.
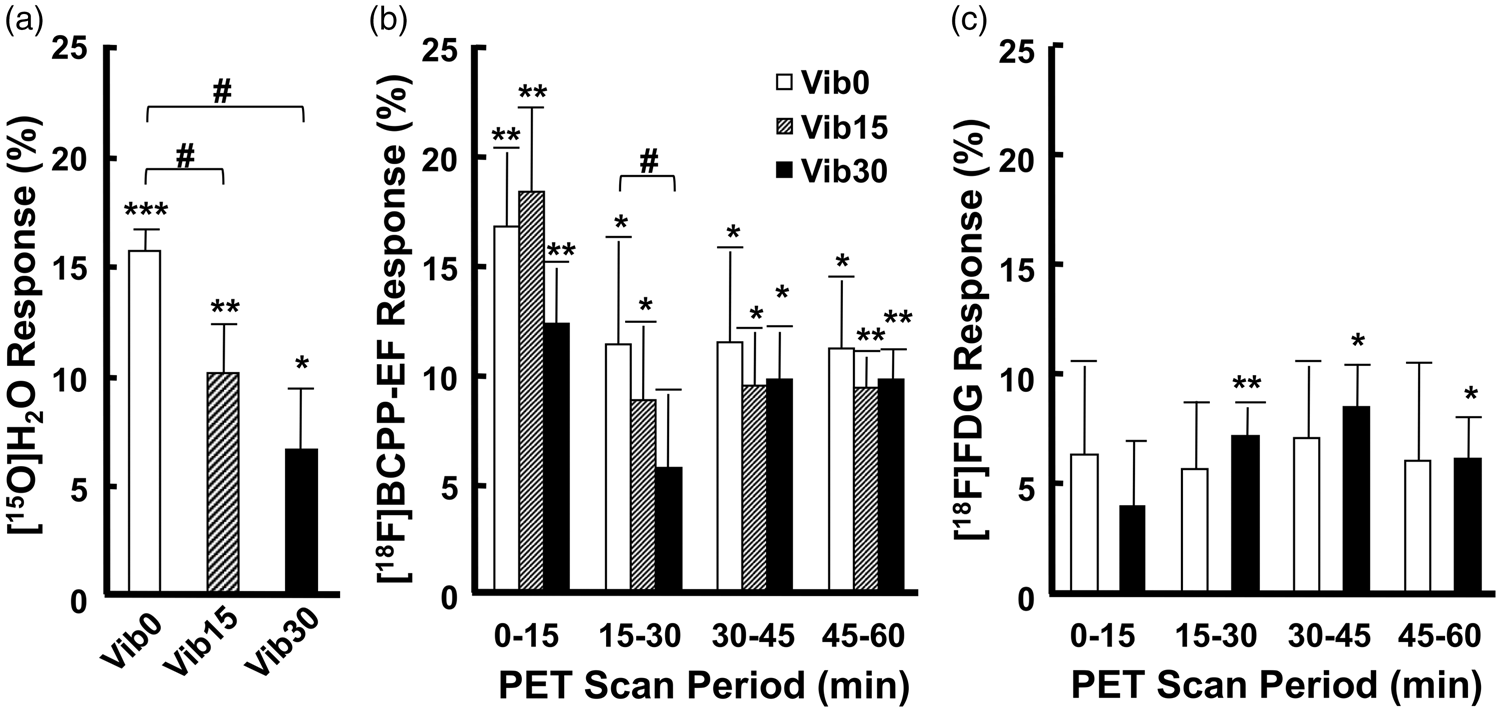
Effects of the pre-vibration duration on [15O]H2O responses (a), [18F]BCPP-EF responses (b), and [18F]FDG responses (c) to stimulation-induced neuronal activation in the contralateral hand area. Results were expressed as the mean ± SD (n = 5 for [15O]H2O; n = 4 for [18F]BCPP-EF and [18F]FDG). *p < 0.05, **p < 0.01, ***p < 0.001 vs. ‘Rest’ (response = 0); #p < 0.05 vs. ‘Vib0’ in the same phase after the injection. ‘Rest’, resting condition without the vibration stimulation; ‘Vib0’, continuous vibration stimulation without pre-vibration.
rCBF was measured after 15- and 30-min pre-vibration. The activated area after 15-min pre-vibration computed by SPM was located within the contralateral ROI previously defined (Figure 2(b)). However, the area became markedly smaller under the same threshold (pcorrected < 0.05). An activation spot was not found after 30-min pre-vibration (puncorrected < 0.001; Figure 2(c)). The CIR of [15O]H2O uptake after 15- and 30-min pre-vibration increased from baseline by 10.02 ± 4.87% (p = 0.005) and 6.49 ± 6.43% (p = 0.044), respectively, and both appeared to be lower than rCBF responses without pre-vibration (p = 0.041 and p = 0.023, respectively; Figure 6(a)). No significant differences were observed between rCBF responses after 15- and 30-min pre-vibration (p = 0.104).
The average [18F]BCPP-EF TACs of the ‘Vib15’ and ‘Vib30’ conditions showed the same pattern as the TACs of the ‘Vib0’ condition, with higher activities being observed in the contralateral ROI until 60 min after the injection (Figure 4(c) and (d)). The difference between the two ROIs under the ‘Vib15’ condition (Figure 4(c)) was similar to that under the ‘Vib0’ condition, but larger than that under the ‘Vib30’ condition (Figure 4(d)). During measurements initiated after 15-min pre-vibration, the CIR of [18F]BCPP-EF uptake was elevated by 18.33 ± 7.59% (p = 0.008), 8.74 ± 6.91% (p = 0.043), 9.39 ± 4.96% (p = 0.016), and 9.37 ± 2.71% (p = 0.003) 0–15 min, 15–30 min, 30–45 min, and 45–60 min after the injection, respectively, and were not significantly lower than [18F]BCPP-EF responses under the ‘Vib0’ condition during the corresponding scan periods (p = 0.346, p = 0.290, p = 0.308, and p = 0.352, respectively; Figure 6(b)). Under the ‘Vib30’ condition, the CIR of [18F]BCPP-EF uptake increased by 12.24 ± 5.10% (p = 0.009), 5.64 ± 6.90% (p = 0.100), 9.73 ± 4.30% (p = 0.010), and 9.76 ± 2.69% (p = 0.003) 0–15 min, 15–30 min, 30–45 min, and 45–60 min after the injection, respectively. The [18F]BCPP-EF response within 15–30 min was markedly reduced by 30-min pre-vibration (p = 0.022), while responses within 0–15 min, 30–45 min, and 45-60 min were not significantly lower than those under the ‘Vib0’ condition (p = 0.070, p = 0.309, and p = 0.254 respectively; Figure 6(b)).
According to the results described above, [18F]BCPP-EF responses 30–45 min and 45–60 min after the injection had different changing patterns from rCBF responses, showing a negligible dependence on the latter. Thus, we plotted the [18F]BCPP-EF responses of four monkeys during these periods against their rCBF responses (Figure 7(a) to (c)). A positive linear correlation was not observed between the [18F]BCPP-EF and rCBF responses under any of the vibration conditions examined. More specifically, rCBF responses were high and concentrated under the ‘Vib0’ condition, whereas [18F]BCPP-EF responses had a wide range (Figure 7(a)). Under the ‘Vib15’ (Figure 7(b)) or ‘Vib30’ (Figure 7(c)) condition, rCBF responses were reduced and became more varied, while [18F]BCPP-EF responses were maintained with relatively small variations.
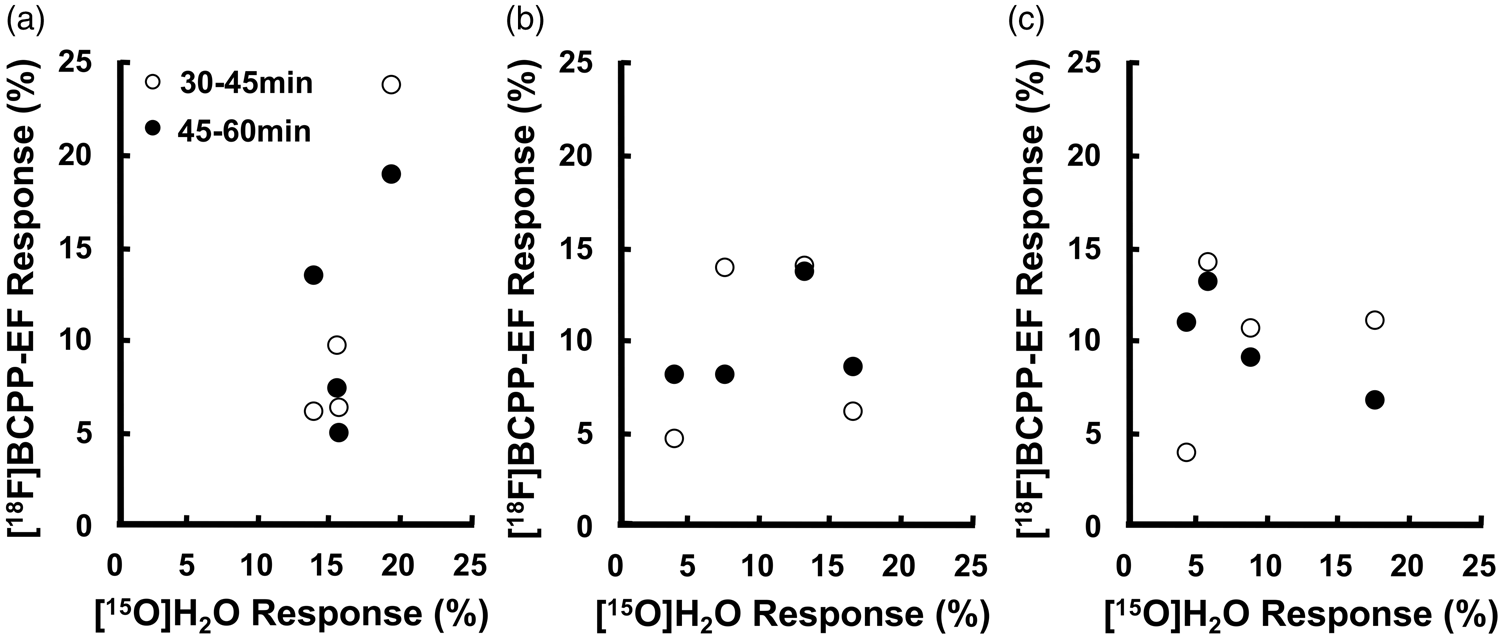
Relationships between the [15O]H2O response and [18F]BCPP-EF response (n = 4) 30–45 min and 45–60 min after the injection under the ‘Vib0’ condition (a), ‘Vib15’ condition (b), and ‘Vib30’ condition (c). ‘Vib0’, continuous vibration stimulation without pre-vibration; ‘Vib15’, continuous vibration stimulation after 15-min pre-vibration; ‘Vib30’, continuous vibration stimulation after 30-min pre-vibration.
PET measurements with [18F]FDG were also conducted in the ‘Vib30’ condition, under which average TACs displayed the same pattern as the ‘Vib0’ condition, with higher activities in the contralateral ROI from 10 min after the injection (Figure 5(c)). The differences between the two ROIs under the ‘Vib30’ condition were similar to those under the ‘Vib0’ condition. After 30-min pre-vibration, the CIR of [18F]FDG uptake increased from baseline by 4.03 ± 6.14% (p = 0.140), 7.28 ± 2.63% (p = 0.006), 8.57 ± 3.96% (p = 0.011), and 6.24 ± 3.75% (p = 0.022) 0–15 min, 15–30 min, 30–45 min, and 45–60 min after the injection, respectively, with no significant differences from [18F]FDG responses under the ‘Vib0’ condition being observed during the corresponding scan periods (p = 0.202, p = 0.325, p = 0.223, and p = 0.480 respectively; Figure 6(c)).
Discussion
The oxidative metabolic pathway is the predominant pathway of energy metabolism in the brain of adult mammals under resting conditions.11,27,28 Studies on the utilization of energy metabolic pathways under brain activation will contribute to a better understanding of the metabolic changes and responses to activation. rCBF, rCMRglc, and rCMRO2 have frequently been examined and compared in PET activation studies. However, the findings obtained on activation-state oxygen consumption have been controversial from two aspects. It currently remains unclear whether oxygen consumption increases during activation. Previous studies reported a mismatch between rCBF or rCMRglc increases and rCMRO2 increases during activation induced by a vibrotactile stimulation 12 and visual stimulation. 13 On the other hand, other studies found significant rCMRO2 increases using a complex visual task 22 and visual imagery task. 20 Based on greater increments in rCMRglc over rCMRO2 implying the predominance of aerobic glycolysis in activated brain regions, studies were performed to assess the duration of the preference for aerobic glycolysis over oxidation. While Fujita et al. 15 indicated that oxygen consumption did not increase when a vibration stimulation was prolonged to 30 min, other studies demonstrated a delayed increase in oxygen consumption 19 or decrease in lactate generation in the later phase of a stimulation, 17 suggesting a metabolic pathway shift from aerobic glycolysis back to oxidation.
The present study is the first application of [18F]BCPP-EF to MC-I assessments in conscious monkey brains being activated by a passive stimulation. [18F]BCPP-EF is a novel PET probe developed for the imaging of MC-I activity and confirmed the binding specificity for MC-I in in vitro biochemical assays using brain slices, 2 mitochondria isolated from porcine hearts, 3 and in the living brain.2,4,5 As one of the components of respiratory ETC in mitochondria, MC-I plays a critical role in the process of OXPHOS, representing the intensity of OXPHOS. Impaired MC-I activity leads to dysfunctions in mitochondria, which ultimately results in certain neurodegenerative diseases. [18F]BCPP-EF has been confirmed to detect these impairments in MC-I activity in animal models of normal brain aging 5 and neurodegenerative diseases.4,6–10 In the present study, changes in MC-I activity were examined using [18F]BCPP-EF under stimulation-induced neuronal activation in the conscious monkey brain. The use of [18F]BCPP-EF to probe MC-I activity may provide a new perspective on this topic.
In the present study, rCBF measured using [15O]H2O was significantly up-regulated in the first minute during focal brain activation. Statistical tests at the voxel and ROI levels showed acute rCBF responses to the vibration stimulation (Figures 2(a) and 6(a)). The hand area in the contralateral somatosensory cortex is too small a region to be depicted manually. The common ROI identified by voxel-wise tests was objective and able to accurately locate the hand area of the somatosensory cortex. It fit the template well (Figure 2(a)), which was in line with the hand area previously identified. 29 Under the ‘Vib0’ condition, the CIR of [18F]FDG uptake was increased by the vibration stimulation (Figure 6(c)), which was also implied by the difference in TACs of the activated and non-activated regions in Figure 5(b), indicating an increase in rCMRglc accompanying neuronal activation. [18F]BCPP-EF uptake also showed a significant response to the stimulation 0–60 min after the injection (Figures 4(b) and 6(b)). Based on the chemical properties of [18F]BCPP-EF, we inferred that the [18F]BCPP-EF response in the early phase after the injection was caused by increased rCBF, and not merely by changes in MC-I activity during neuronal activation. Insensitivity to rCBF changes under resting conditions has already been demonstrated due to the reversible type of [18F]BCPP-EF kinetics,5,6 as shown in Figure 4(a). It is of great importance to evaluate the extent to which rCBF changes influence the uptake of [18F]BCPP-EF into activated neurons because rCBF rapidly increases during focal activation. Based on decreases in the rCBF response over time during a continuous stimulation, 23 the present study investigated whether [18F]BCPP-EF had the potential to detect MC-I activity under the activation condition despite confounding rCBF responses.
rCBF responses in the human somatosensory cortex were found to decrease over time under a similar continuous vibration stimulation. 23 These findings were reproduced in the present study; rCBF responses after pre-vibration were significantly weaker than that without pre-vibration. By 15-min pre-vibration, the activated area became markedly smaller (Figure 2(b)) and responses decreased from 16 to 10% (Figure 6(a)). By 30-min pre-vibration, the rCBF response was reduced to 6% (Figure 6(a)). The [18F]BCPP-EF scan started simultaneously with the start of the vibrotactile stimulation and showed high uptake at areas with an intense rCBF response. To avoid the overestimation of MC-I activity by increased rCBF, [18F]BCPP-EF scans were started with 15-min or 30-min pre-vibration, in which the degrees of rCBF increases were significantly smaller than that without pre-vibration. By 15-min pre-vibration, the [18F]BCPP-EF response was marked within 0–60 min of the scan (Figure 6(b)). Furthermore, by 30-min pre-vibration, the response was significant within 0–15 min and 30–60 min (Figure 6(b)). While rCBF significantly declined by 15- and 30-min pre-vibration (Figure 6(a)), no significant decreases in the degrees of [18F]BCPP-EF responses were observed 30–45 min and 45–60 min after the [18F]BCPP-EF injection with 15-min and 30-min pre-vibration (Figure 6(b)). These results suggest that [18F]BCPP-EF responses in the later phase after the injection reflected increased MC-I activity, which was further supported by the absence of a positive linear correlation between rCBF responses and [18F]BCPP-EF responses 30–45 min or 45–60 min after the injection under all vibration conditions (Figure 7(a) to 7(c)).
The enzymatic capacity of glucose oxidation may be near saturation under resting conditions; therefore, glucose oxidation only slightly increased even with neuronal activation. 30 Ueki et al.31 found no significant changes in local ATP levels in the primary somatosensory cortex of rats by the stimulation, suggesting a minimal energy requirement for neuronal activation. Based on these observations and previous findings of only a slight increase in rCMRO2 under neuronal activation, 13 we assumed the increase in MC-I activity to also be at this level. These small changes may be hard to detect if the [18F]BCPP-EF scan is started simultaneously with the vibration stimulation because of a mixture of increases in rCBF and MC-I responses in the early phase of the stimulation onset. In order to accurately detect changes in MC-I activity by the stimulation, the rCBF response needs to be controlled within an appropriate range to avoid the effects of increased initial influxes of [18F]BCPP-EF into neuronal cells and ensure an adequate oxygen supply for glucose oxidation. Therefore, PET scans using [18F]BCPP-EF in the present study were started after a pre-vibration for 15 and 30 min. rCBF responses after 15- and 30-min vibration were 10 and 6%, respectively, and both were lower than the rCBF response without pre-vibration, but significantly higher than under the resting state (Figure 6(a)).
Aerobic glycolysis is a less efficient pathway than OXPHOS for the generation of ATP, 14 namely, the glycolytic pathway consumes higher levels of glucose than OXPHOS to produce the same quantity of ATP. However, it is utilized with priority in the early phase of brain activation because it yields and supplies ATP faster. 32 Based on the assumption of constant ATP requirements during continuous brain activation, if there is a pathway shift from aerobic glycolysis to OXPHOS after 30-min pre-vibration, rCMRglc is expected to decrease and MC-I activity increase. As discussed above, [18F]BCPP-EF responses 30–60 min after the injection mainly reflected MC-I activation rather than rCBF responses. Accordingly, to confirm a pathway shift, [18F]FDG and [18F]BCPP-EF responses 30–45 min or 45–60 min after the injection were compared between the ‘Vib0’ and ‘Vib30’ conditions. The present results showed no significant changes in the [18F]BCPP-EF response (Figure 6(b)) or [18F]FDG response (Figure 6(c)) after 30-min pre-vibration. The absence of a pathway shift may be due to many reasons. Under the influence of other probable factors such as habituation, ATP requirements after 30-min pre-vibration may differ from those without pre-vibration, which did not satisfy our assumption. Apart from this, the metabolic shift from aerobic glycolysis to OXPHOS may have occurred in an earlier phase of brain activation when [18F]BCPP-EF or [18F]FDG had not reached equilibrium to reflect MC-I activity or rCMRglc.
As the first application of [18F]BCPP-EF to detect stimulation-induced neuronal activation using PET, arterial blood sampling was not performed to avoid excessive stress and a stimulation other than vibration on animals. Comparisons of the changes induced in [18F]BCPP-EF or [18F]FDG responses by pre-vibration also failed to show a shift between energy metabolic pathways. Since the bolus method has its inherent limitation of lacking dynamic information, PET scans conducted with the infusion method, referred to as functional PET (fPET),33–35 may be more suitable for future activation studies to track changes in MC-I activity or rCMRglc.
One of the limitations of this study might be the small number of subjects. The study was originally planned to subject five monkeys; however, due to the much less correlation between rCBF response and metabolic responses of rCMRglc/MC-I, one monkey had to be omitted from data analyses. Although the reasons remain unclear, one possible explanation may be dysfunction of the tight coupling between neuronal activity, rCBF, and metabolism. We previously reported that the tight coupling was abolished by pre-administration of scopolamine, a muscarinic cholinergic receptor inhibitor, suggesting that the coupling mechanism is partly regulated by the intrinsic local cholinergic neuronal system. 36 Furthermore, the coupling mechanism was disturbed in the brain of aged monkey, 37 whose activity of muscarinic cholinergic receptor was lowered than that in young monkey. 38 Further assessments including cholinergic neuronal function should be needed for the explanation for the uncoupling between rCBF and metabolic responses.
In conclusion, the present study demonstrated that [18F]BCPP-EF has potential as a potent PET probe for imaging MC-I activity during neuronal activation in the conscious monkey brains, particularly in the later phase after the injection when the effects of rCBF responses become negligible. However, the pathway shift from aerobic glycolysis to OXPHOS was not observed with the combined use of [18F]FDG and [18F]BCPP-EF in this study protocol.
Footnotes
Funding
The author(s) disclosed receipt of the following financial support for the research, authorship, and publication of this article: This work was supported in part by the National Natural Science Foundation of China [No. U1809204, 61525106, 61427807, 61701436]; the National Key Technology Research and Development Program of China [No. 2017YFE0104000, 2016YFC1300302]; and the Shenzhen Innovation Funding [No. JCYJ20170818164343304, JCYJ20170816172431715].
Declaration of conflicting interests
The author(s) declared the following potential conflicts of interest with respect to the research, authorship, and/or publication of this article: HO, FH, and HT are employees of Hamamatsu Photonics K.K. The authors declare that they have no conflicts of interest.
Authors’ contributions
JF performed the PET experiments, analyzed the data, and wrote the manuscript. HO designed the study, performed the PET experiments, and analyzed the data. FH performed the PET experiments and analyzed the data. HT designed the study and wrote the manuscript. FC and HL gave the valuable suggestions throughout the study and financially supported the study.
Acknowledgements
We gratefully acknowledge A. Hiruma and T. Hara for their support and encouragement throughout this study, and also T. Kakiuchi, S. Nishiyama, M. Kanazawa, D. Fukumoto, and S. Yamamoto for their technical assistance. J. Fang thanks the exchange program between Hamamatsu Photonics K.K. and Zhejiang University.