
Abstract
Blood oxygen level dependent (BOLD) fMRI is a common technique for measuring brain activation that could be affected by low-level carbon monoxide (CO) exposure from, e.g. smoking. This study aimed to probe the vulnerability of BOLD fMRI to CO and determine whether it may constitute a significant neuroimaging confound. Low-level (6 ppm exhaled) CO effects on BOLD response were assessed in 12 healthy never-smokers on two separate experimental days (CO and air control). fMRI tasks were breath-holds (hypercapnia), visual stimulation and fingertapping. BOLD fMRI response was lower during breath holds, visual stimulation and fingertapping in the CO protocol compared to the air control protocol. Behavioural and physiological measures remained unchanged. We conclude that BOLD fMRI might be vulnerable to changes in baseline CO, and suggest exercising caution when imaging populations exposed to elevated CO levels. Further work is required to fully elucidate the impact on CO on fMRI and its underlying mechanisms.
Introduction
One of the most common methods used to measure brain function in humans is fMRI, of which blood oxygen level dependent (BOLD) fMRI is arguably the most mainstream technique. BOLD fMRI is an indirect measure of brain activation, based on changes in the ratio of oxygenated to deoxygenated blood in the brain, which depends on cerebral metabolic rate (CMRO2), cerebral blood volume (CBV) and cerebral blood flow (CBF). 1 These factors may be altered as part of the experimental design or as unintended confounds, potentially affecting BOLD response.
Carbon monoxide (CO) is a toxic gas that can act as a cerebral vasodilator.2,3 Increases in CBF with elevations in CO have been shown in animal models3–7 as well as in humans.8,9 Low-level CO exposure is common, through inhalation of cigarette smoke or air pollution. Due to its high affinity for haemoglobin, CO immediately enters and can linger in the bloodstream for several hours after inhalation. Smokers typically have persisting elevated levels of CO bound to haemoglobin in their blood (carboxyhaemoglobin, COHb), which is reflected in higher exhaled levels of CO (6 ppm in exhaled air or above 10 ) compared to non-smokers (1–5 ppm). As smoking behaviour is associated with, e.g., socioeconomic status and disease status, elevated COHb may significantly influence neuroimaging results on the group level in certain demographic groups. For example, if low-level CO causes a baseline increase in CBF, this might affect fMRI outcome as the BOLD response for any given task is assessed by comparing task-related signal to baseline signal. An increased baseline could artificially dampen or alter the time course of the observed task-specific BOLD response.11–13 To our knowledge, the effect of CO on fMRI signal has not been investigated in previous studies, except as part of cigarette smoking, where its impact is confounded by other (vasoactive) tobacco components. The rationale for this study was to test if CO could alter BOLD fMRI response in response to three different fMRI tasks.
One method to test cerebral vascular function is carbon dioxide (CO2) exposure. Hypercapnia induces a strong CBF increase, 14 and has often been used as a cerebrovascular challenge in fMRI studies11,15–17 due to its global and reproducible effect on BOLD response.16,18 Raising baseline CBF by CO2 inhalation can furthermore reduce or cause delays or non-linearity in the vascular responsiveness to subsequent hypercapnia.11,12 In this study, we therefore used hypercapnia derived through breath holds as a tool to investigate the effect of CO on BOLD response, as it is a robust, reproducible stimulus, and susceptible to changes in baseline CBF. We hypothesised that low-level CO inhalation would significantly reduce global BOLD response during hypercapnia. To determine whether the effect of CO extended to common fMRI paradigms, we also included a simple visual stimulation and motor task, hypothesising that CO would dampen BOLD response in brain regions associated with these tasks.
Materials and methods
Participants
We recruited 12 (8 F, age 25.3 ± 4.3 years) healthy never-smokers to the study. Never-smokers were chosen to ensure a uniform sample group as smokers typically have varying levels of COHb and may exhibit variation in, e.g., craving. Exclusion criteria were MRI contraindications, smoking history, history of cardiorespiratory or neurological disease, and pregnancy. Female participants were on hormonal contraceptives. All participants gave written, informed consent. The study was approved by Oxford Brookes University Research Ethics Committee (approval number 140840) and carried out in accordance with the Declaration of Helsinki. The sample size was determined by a formal statistical power calculation (fMRIpower software package, www.fmripower.org 19 ). At alpha level 0.05, 11 subjects were found to provide at least 80% power to detect an effect. Twelve were recruited to ensure that the study was powered in case of any unforeseen events (e.g. subject dropout).
Protocol
Participants were asked to attend a preliminary laboratory visit. During this visit, medical history and state and trait anxiety inventory (STAI) questionnaires were completed. 20 A CO inhalation test was conducted to let the participant familiarise themselves with the breathing system and the CO exposure. Participants were asked to breathe on a custom-made breathing system through a mouthpiece with their nose occluded, and were given time for their breathing to stabilise before commencing the experiment. A full description of the breathing system can be found in the supplement. After stable breathing had been recorded for 5 min, CO was added to the inspired air over 5 min, out of sight of the participant. Following CO administration, five more minutes of stable breathing was recorded. During the experiment, ECG, pulse pressure and saturation were continuously measured. Expired CO was measured before, immediately after, and 10 min after the breathing test (Micro+ Smokelyzer, Intermedical Ltd, Kent). The Smokelyzer kit is suitable for non-invasive, repeated assessments of expired CO in humans, and its output was compared with COHb values (blood samples) prior to the study to ensure correct readings.
MRI scans were conducted on two separate days (Figure 1). Participants were asked to complete the state anxiety part of STAI on arrival and no more than 15 min after the end of the experiment on each day. Whilst in the scanner, participants were asked to undertake the following tasks: breath holds, a visual stimulation task, a motor task and a simple reaction time task. Breath holds were conducted end-expiration, signalled by visual cues and lasting 15 s. Participants were instructed to follow each breath-hold with an expiration (rather than inspiration) to obtain accurate end-tidal PCO2 values. The visual stimulation was a flashing checkerboard (8 Hz, lasting 10 s). The motor task was tapping of the right index finger, signalled by visual cues and lasted 15 s. The reaction time task required participants to immediately press a button upon the appearance of a red dot on the screen (24 appearances, random intervals). These tasks were conducted twice, once before the breathing intervention (baseline) and once after (post-intervention). The participants received the gas mixtures in the scanner, and their head was kept in the same position for the intervention and subsequent scan. On one day, the intervention was air, and on the other day, the intervention was CO. Participants were not aware of which intervention would be given on any of the days and the order of the interventions was randomised and balanced. Participants were asked verbally after each protocol if they felt any change in their breathing, and if they could guess which protocol they had undertaken. Training in all fMRI tasks was given by an experimenter prior to the first scan on each day, to ensure that the participant could reliably complete these on their own in the scanner. Expired CO measurements were made before the first scan, immediately after the second scan (∼20 min after the breathing intervention) and 10 min after the second scan (∼30 min after the breathing intervention). An extended protocol section can be found in the supplement.
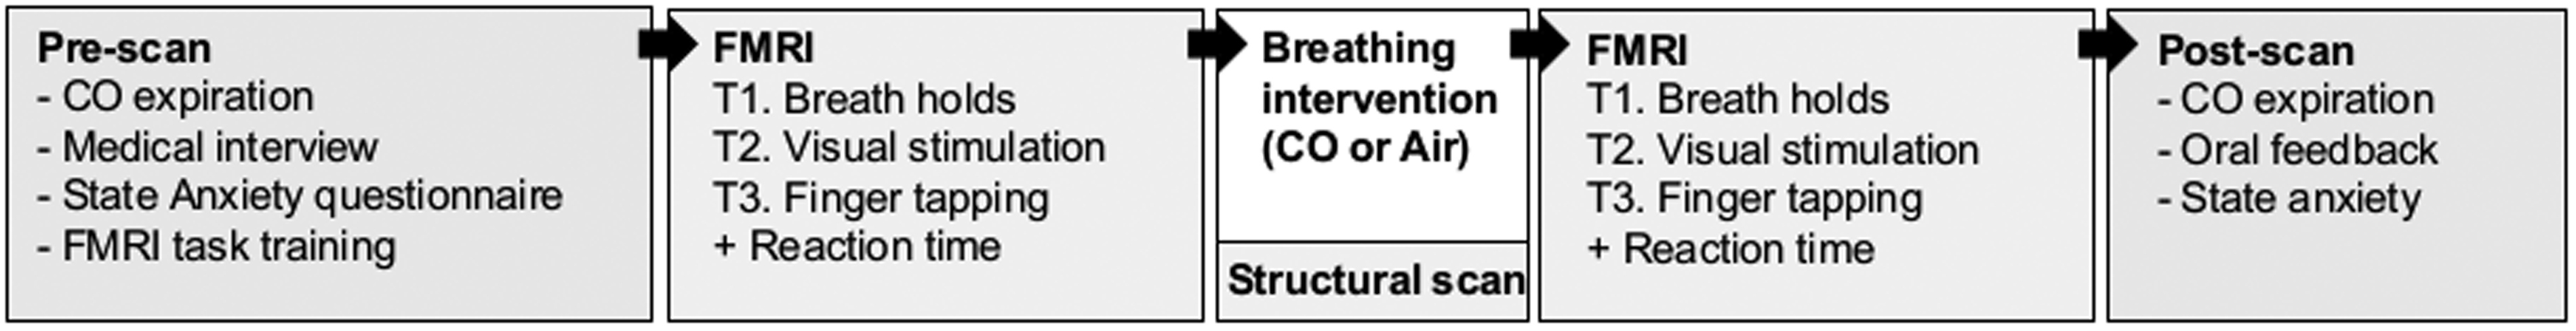
Schematic of protocol. fMRI tasks included breath holds (T1), visual stimulation (8 Hz flashing checkerboard, T2) and a (right hand) finger tapping task (T3). Two sets of BOLD scans (each 10 min 6 s) were obtained on each experimental day, separated by a 5 min breathing intervention (air or CO, order randomized and counterbalanced) during which a structural scan was acquired.
MRI data acquisition
Imaging was performed at the University of Oxford Centre for Clinical Magnetic Resonance Research with a Siemens 3 Tesla TIM-Trio scanner, using a 12-channel head coil. Participants were given two fMRI scans (BOLD echo-planar image acquisition, time repetition (TR) = 3000 ms, time echo (TE) = 30 ms, field-of-view = 192 × 192 mm, voxel-size = 3 ×3×3 mm, 45 slices) on each day, separated by the intervention period (air or CO). A structural T1-weighted, whole-brain scan (MPRAGE, TR = 2040 ms, TE =4.7 ms, flip angle = 8°, voxel-size = 1 × 1×1 mm) was collected and used for image registration.
Heart rate (HR) and pulse oximetry (SaO2, multigas monitor, 9500, MR Equipment), ECG, respiration (respiratory bellows around the chest) and end-tidal partial pressures of oxygen (PETO2) and CO2 (PETCO2; Datex, Normocap) were continuously measured throughout the scans. ECG data were observed throughout. All physiological data were sampled at 50 Hz and recorded along with scan volume triggers via PowerLab 16/35 using LabChart (ADinstruments).
Data analysis
fMRI data processing was carried out within FSL (Oxford Centre for Functional Magnetic Resonance Imaging of the Brain (FMRIB) Software Library), using FEAT (FMRI Expert Analysis Tool) Version 6.0. The cluster Z threshold was set to 3.1 and a corrected cluster significance threshold to p = 0.05.
Prestatistic processing of the data included MCFLIRT motion correction, 21 spatial smoothing with a full-width-half-maximum Gaussian kernel of 5 mm and high-pass temporal filtering (Gaussian-weighted least-squares straight line fitting, high-pass filter cut-off of 60 s). FSL motion outliers (https://fsl.fmrib.ox.ac.uk/fsl/fslwiki/FSLMotionOutliers) were used to detect and regress out large motion artifacts. Data were modelled using FMRIB’s Improved Linear Model (FILM) with local autocorrelation correction. 22 Images were registered to the MNI152 standard space using an affine registration between the EPI and T1-weighted scan and a nonlinear registration between the T1-weighted scan and the MNI standard brain.
General linear models (GLMs) with multiple explanatory variables (EVs) incorporating timing values for the different events were designed to describe the data. The haemodynamic response function (HRF) was modelled using a standard gamma waveform. A physiological noise modelling tool was used to regress out the effects of physiological noise. 23 A 6-s haemodynamic delay was assumed and contrast images were used for higher level analyses as appropriate. An end-tidal CO2 regressor was used to analyse the BOLD response change associated with the breath-hold challenge. This was done by extracting the breath by breath PETCO2 data and convolving this with an HRF (e.g. see Bright and Murphy 24 ). This approach models the breath hold challenge response with the recorded PETCO2 values and thus makes no assumption about breath hold length. This analysis fits the signal to the PETCO2 data and returns statistical maps of significant changes in BOLD response (thresholded zstats). These statistical maps were also converted to %BOLD/mmHg CO2 in a second, separate analysis of cerebrovascular reactivity (CVR).
A fixed-effects model was used to generate contrast of parameter estimate (COPE) images of the mean signal for all scans as well as the difference between the baseline and post-intervention scans for each participant on each experimental day. The baseline versus post-intervention difference COPE images were calculated to compensate for any variation in baseline between days and account for potential test–retest variability. This was done by forcing random effects variance to zero in FLAME (FMRIB’s Local Analysis of Mixed Effects).25,26
Voxelwise statistical analysis was extended to a group level, in a mixed-effects analysis using FLAME 26 with automatic outlier de-weighting, and Z statistic images were thresholded using clusters determined by Z > 3.1 and a p < 0.05 (corrected) cluster significance threshold. Means of COPE images were calculated for all conditions. Group analyses compared COPE images between protocols for each task using a whole-brain approach, and with the following contrasts of interest: PETCO2 values with breath holds, presentation of flashing checkerboards (visual task) and finger-tapping. An analysis using the older standard of a 2.3 cluster-forming threshold was also conducted, and is included in the Supplement.
STAI questionnaires were scored according to their respective manuals and compared using paired nonparametric t-tests (Mann–Whitney U test). Reaction times were averaged for each participant and compared using Student’s t-test (paired). Physiological data were analysed using custom-written MATLAB scripts and compared using Student’s t-tests (paired). Data obtained during the motor task were used for the comparison of end-tidal gases between protocols.
Results
Psychological and physiological data
There were no significant differences between protocols in anxiety scores (t(11)=0.61, p = 0.55) or reaction times (t(23)=1.1, p = 0.29). None of the participants was able to discern between CO and air inhalations, nor did they report any change in breathing. PETO2 was reduced between baseline and post-intervention scans in both protocols, but no significant difference was found between protocols (t(11)=−0.58, p = 0.57). There was no change in PETCO2 or HR between scans or protocols. CO values increased significantly in the CO protocol (p < 0.0001, Figure 2), but not air (p = 0.10). COHb values (estimated from exhaled CO) also showed a significant increase in the CO protocol (p < 0.0001, Table 2), but not air. The modest rise in COHb (from 1.1% ± 0.1 to 1.5% ± 0.2) highlights the low level of CO used in the study. Participant details are shown in Table 1, and physiological data in Table 2. Extended participant demographics and physiological data, including PETCO2 and PETO2 averages and CO2 traces for all tasks, can be found in the supplement.
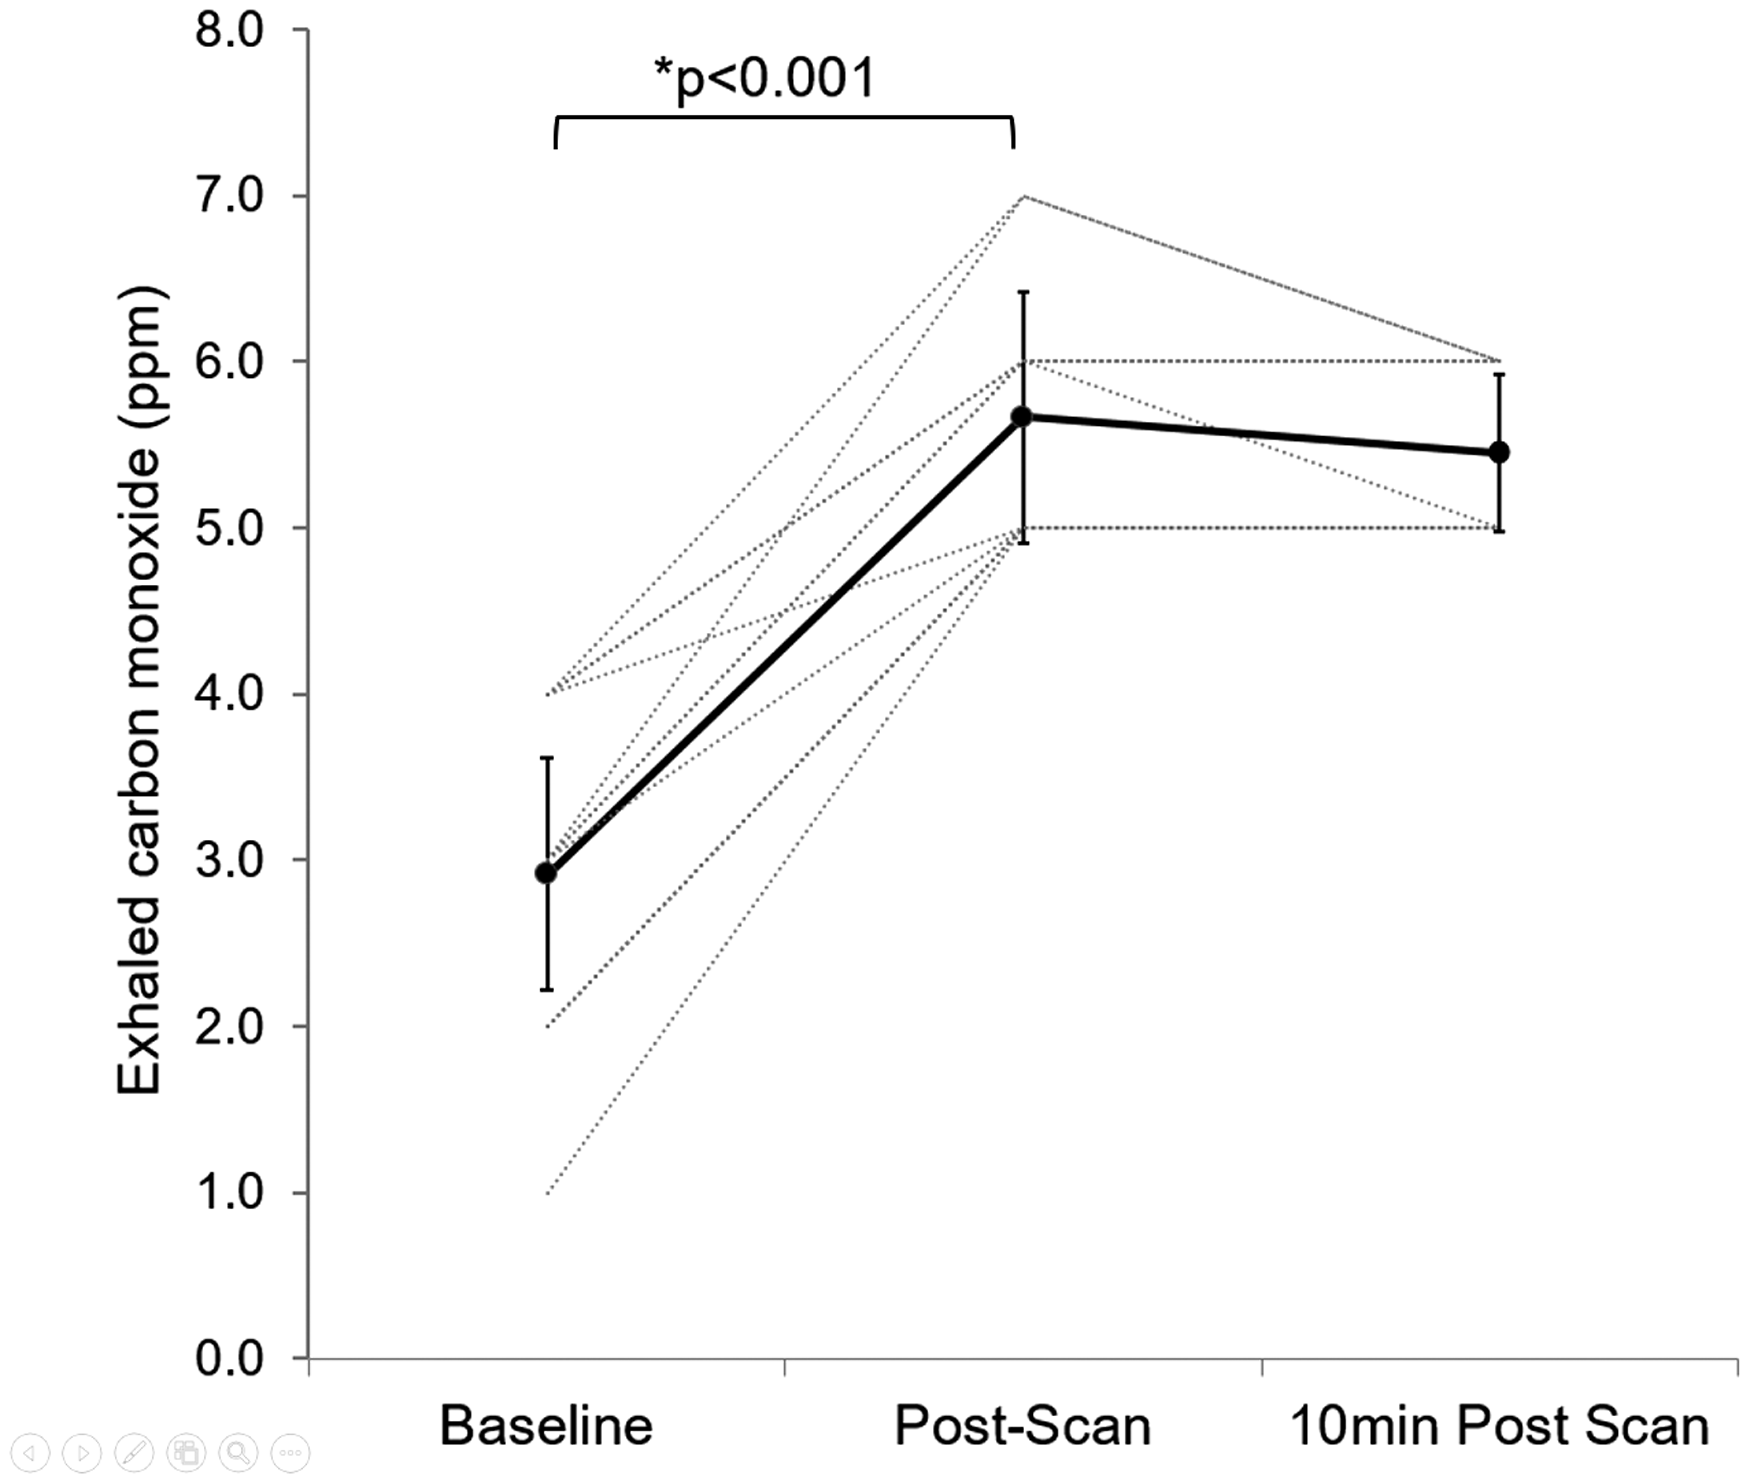
Exhaled CO (ppm). Baseline, post-scan (∼20 min after end-inhalation) and 10 min post-scan (∼30 min after end-intervention). Individual values plus average and standard deviation (bold line).
Participant details and behavioural data.
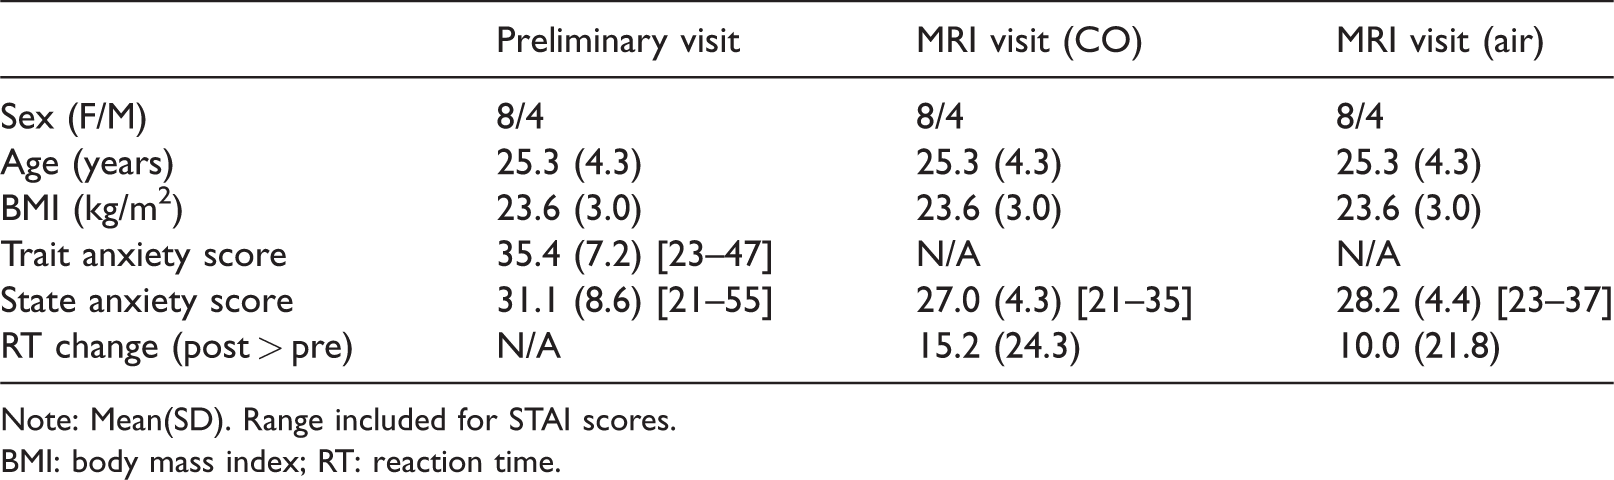
Note: Mean(SD). Range included for STAI scores.
BMI: body mass index; RT: reaction time.
Physiological data.
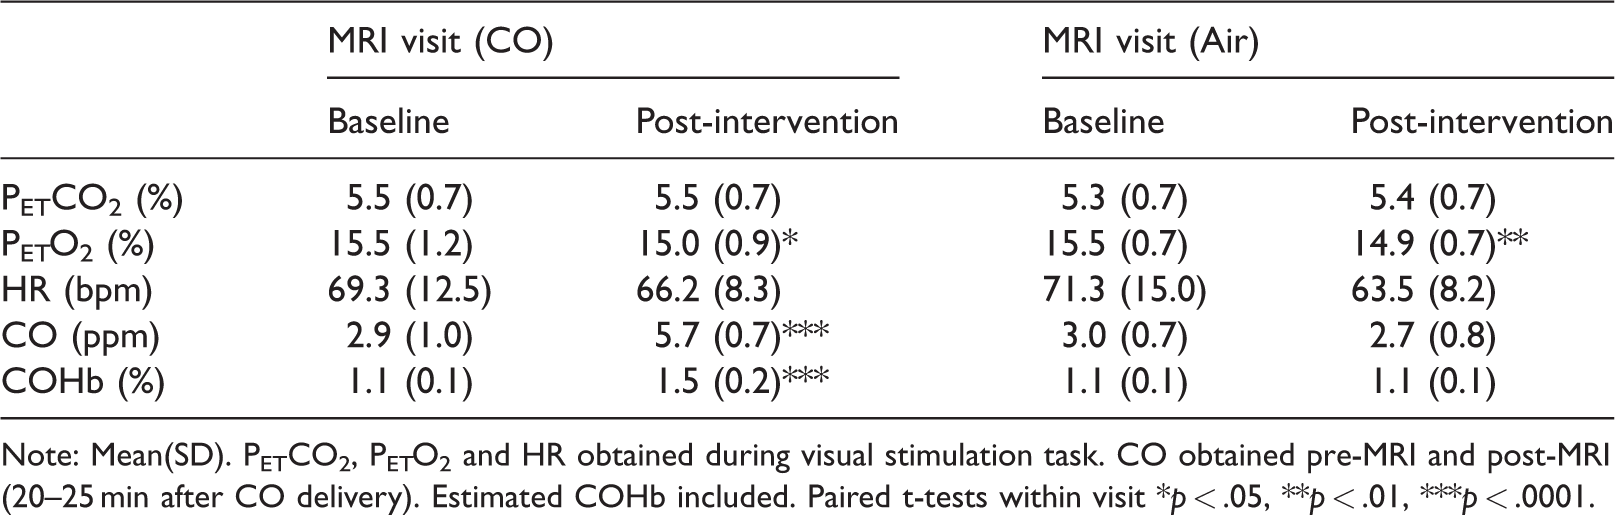
Note: Mean(SD). PETCO2, PETO2 and HR obtained during visual stimulation task. CO obtained pre-MRI and post-MRI (20–25 min after CO delivery). Estimated COHb included. Paired t-tests within visit *p < .05, **p < .01, ***p < .0001.
fMRI data
For fMRI results, significance denotes thresholded, cluster corrected, signal (cluster-forming threshold of 3.1, p < 0.05). 27
Breath hold task (Figure 3)
The rise in CO2 with breath holds caused BOLD response change (increase) throughout the grey matter during all scans. Figure 3 shows pre-intervention and post-intervention BOLD response for both air and CO protocols, and group (protocol) contrasts between the pre- versus post-intervention difference maps. These Z score maps indicate a significant linear regression of the end-tidal CO2 and BOLD response, as expected with rises in PETCO2. This was seen for the control protocol and the baseline scan (pre) for the CO protocol, but not after CO inhalation. Following CO inhalation, activation was significantly reduced in the left insula, premotor cortex, left secondary somatosensory cortex and in the brain stem (see Supplement Figure S6). Group comparisons showed lower significant BOLD response change in the CO protocol compared to air in the left operculum and insula.
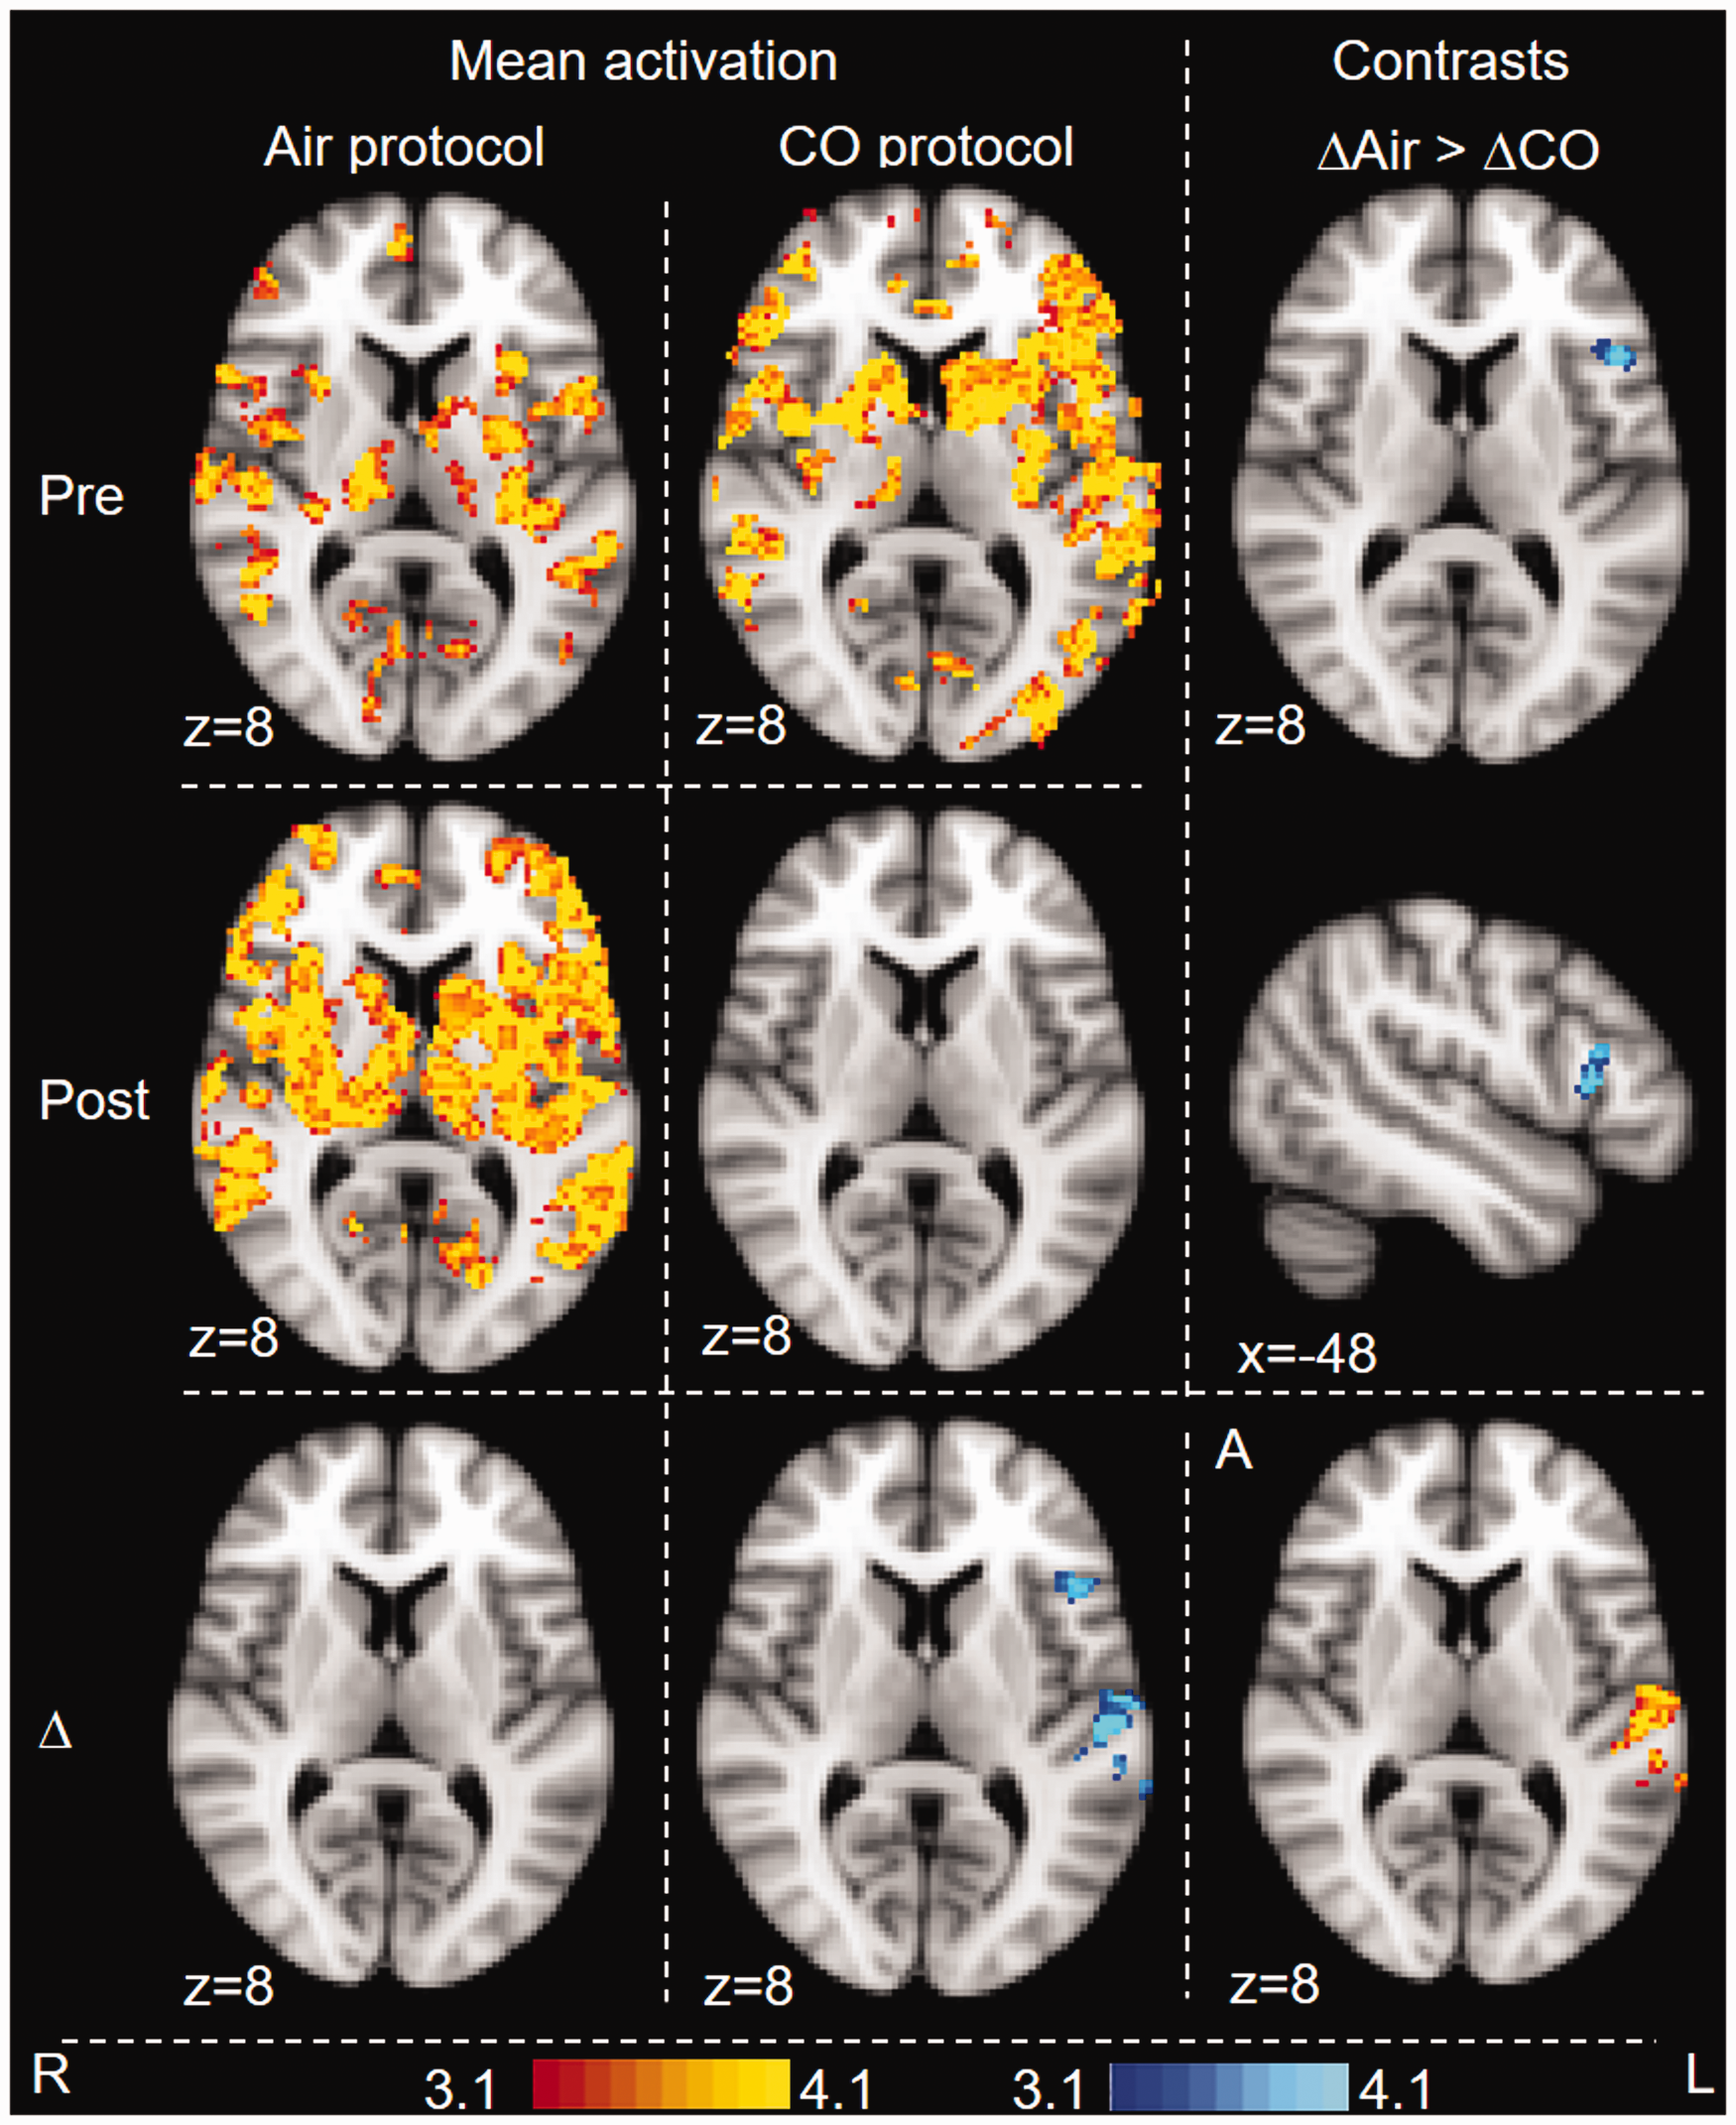
BOLD fMRI response associated with breath-by-breath end-tidal CO2 during the breath hold task. Whole-brain analysis. Images are colour-rendered statistical maps (Z scores) superimposed on a standard (MNI) brain. Significant regions are displayed with a threshold of Z > 3.1 with a cluster probability threshold of p < 0.05 (corrected for multiple comparisons). Maps are BOLD response associated with air and CO inhalation (pre- and post-intervention), pre versus post-intervention difference maps for each protocol (Δ), and contrasts between protocols (contrast between the pre- vs. post-intervention difference maps). For contrasts, blue-lightblue indicates where BOLD response following CO (i.e. CO(post>pre)) was lower than BOLD response following air – i.e. on the day the participants inhaled CO, the BOLD response was reduced in the post-inhalation scan, but this did not occur on the day the participants inhaled air. This difference between protocols was significant. In no area was BOLD response following CO increased compared to BOLD response following Air.
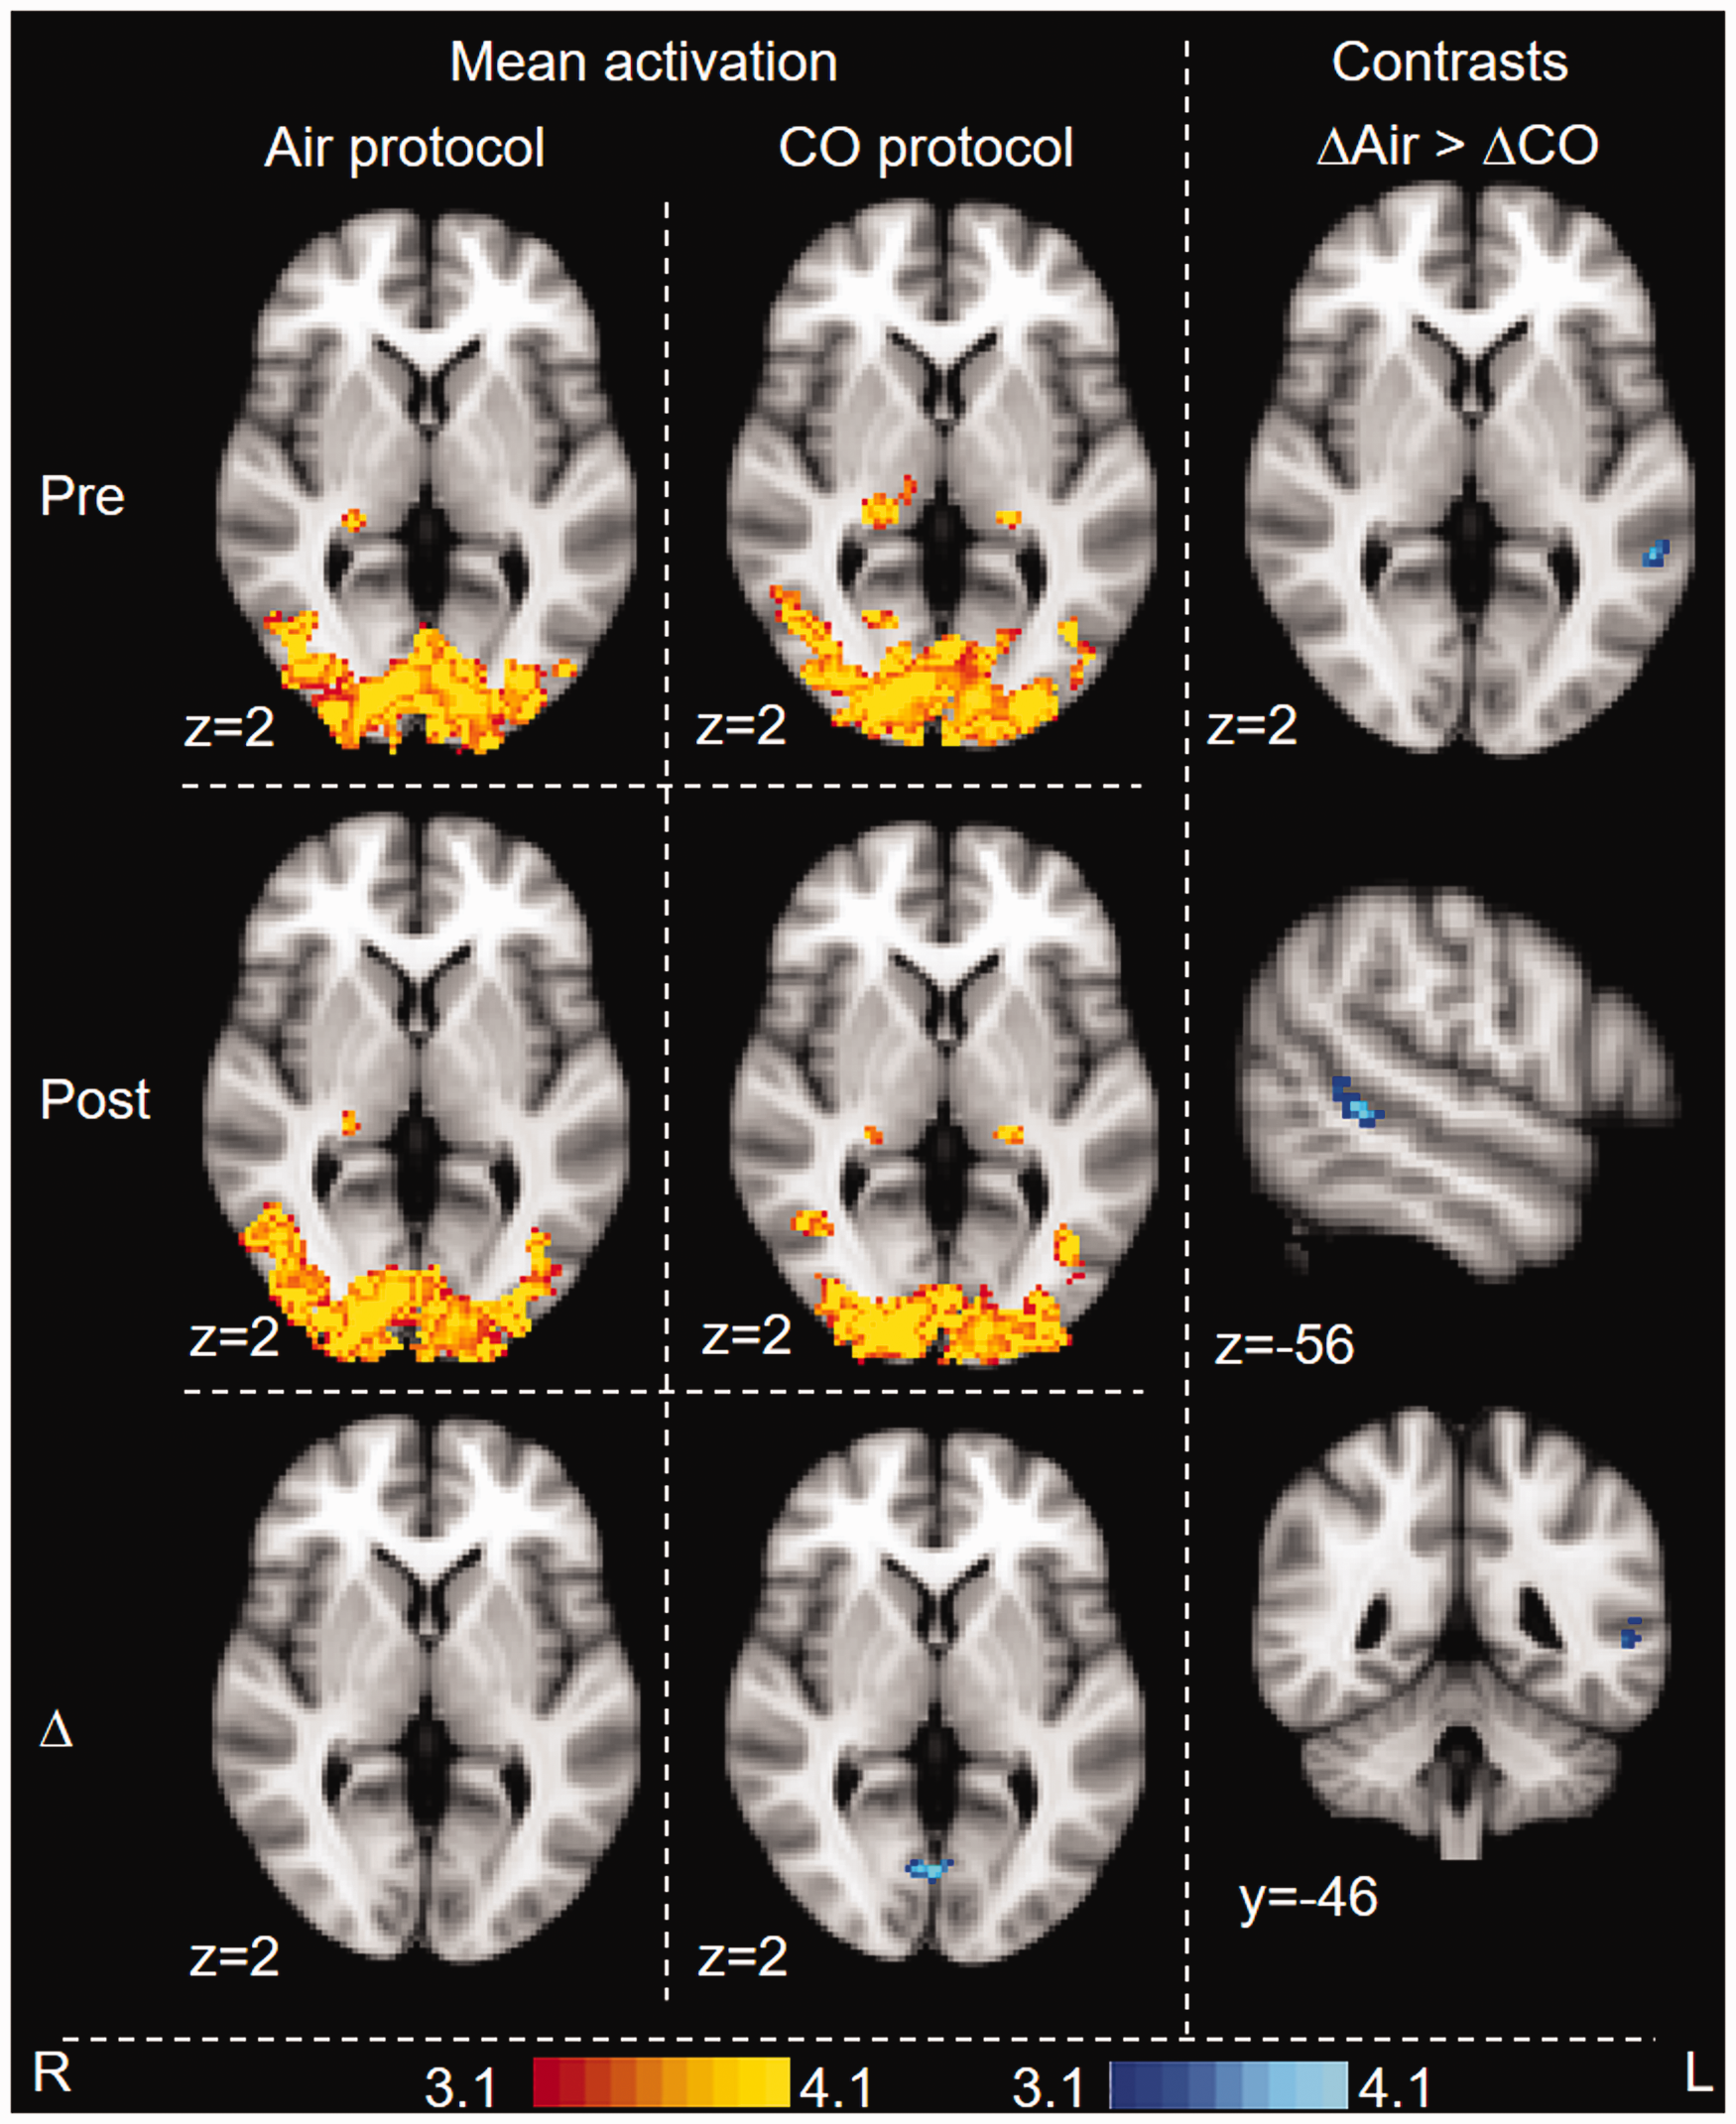
BOLD fMRI response during visual stimulus. Whole-brain analysis. Images are colour-rendered statistical maps superimposed on a standard (MNI) brain. Significant regions are displayed with a threshold of Z > 3.1 with a cluster probability threshold of p < 0.05 (corrected for multiple comparisons). Maps are BOLD response associated with air and CO inhalation (pre- and post-intervention), pre versus post-intervention difference maps for each protocol (Δ), and contrasts between protocols (contrast between the pre- vs. post-intervention difference maps). For contrasts, blue-lightblue indicates where BOLD response following CO (i.e. CO(post>pre)) was lower than BOLD response following air – i.e. on the day the participants inhaled CO, the BOLD response was reduced in the post-inhalation scan, but this did not occur on the day the participants inhaled Air. This difference between protocols was significant. In no area was (CO(post>pre)) greater than (Air(post>pre).
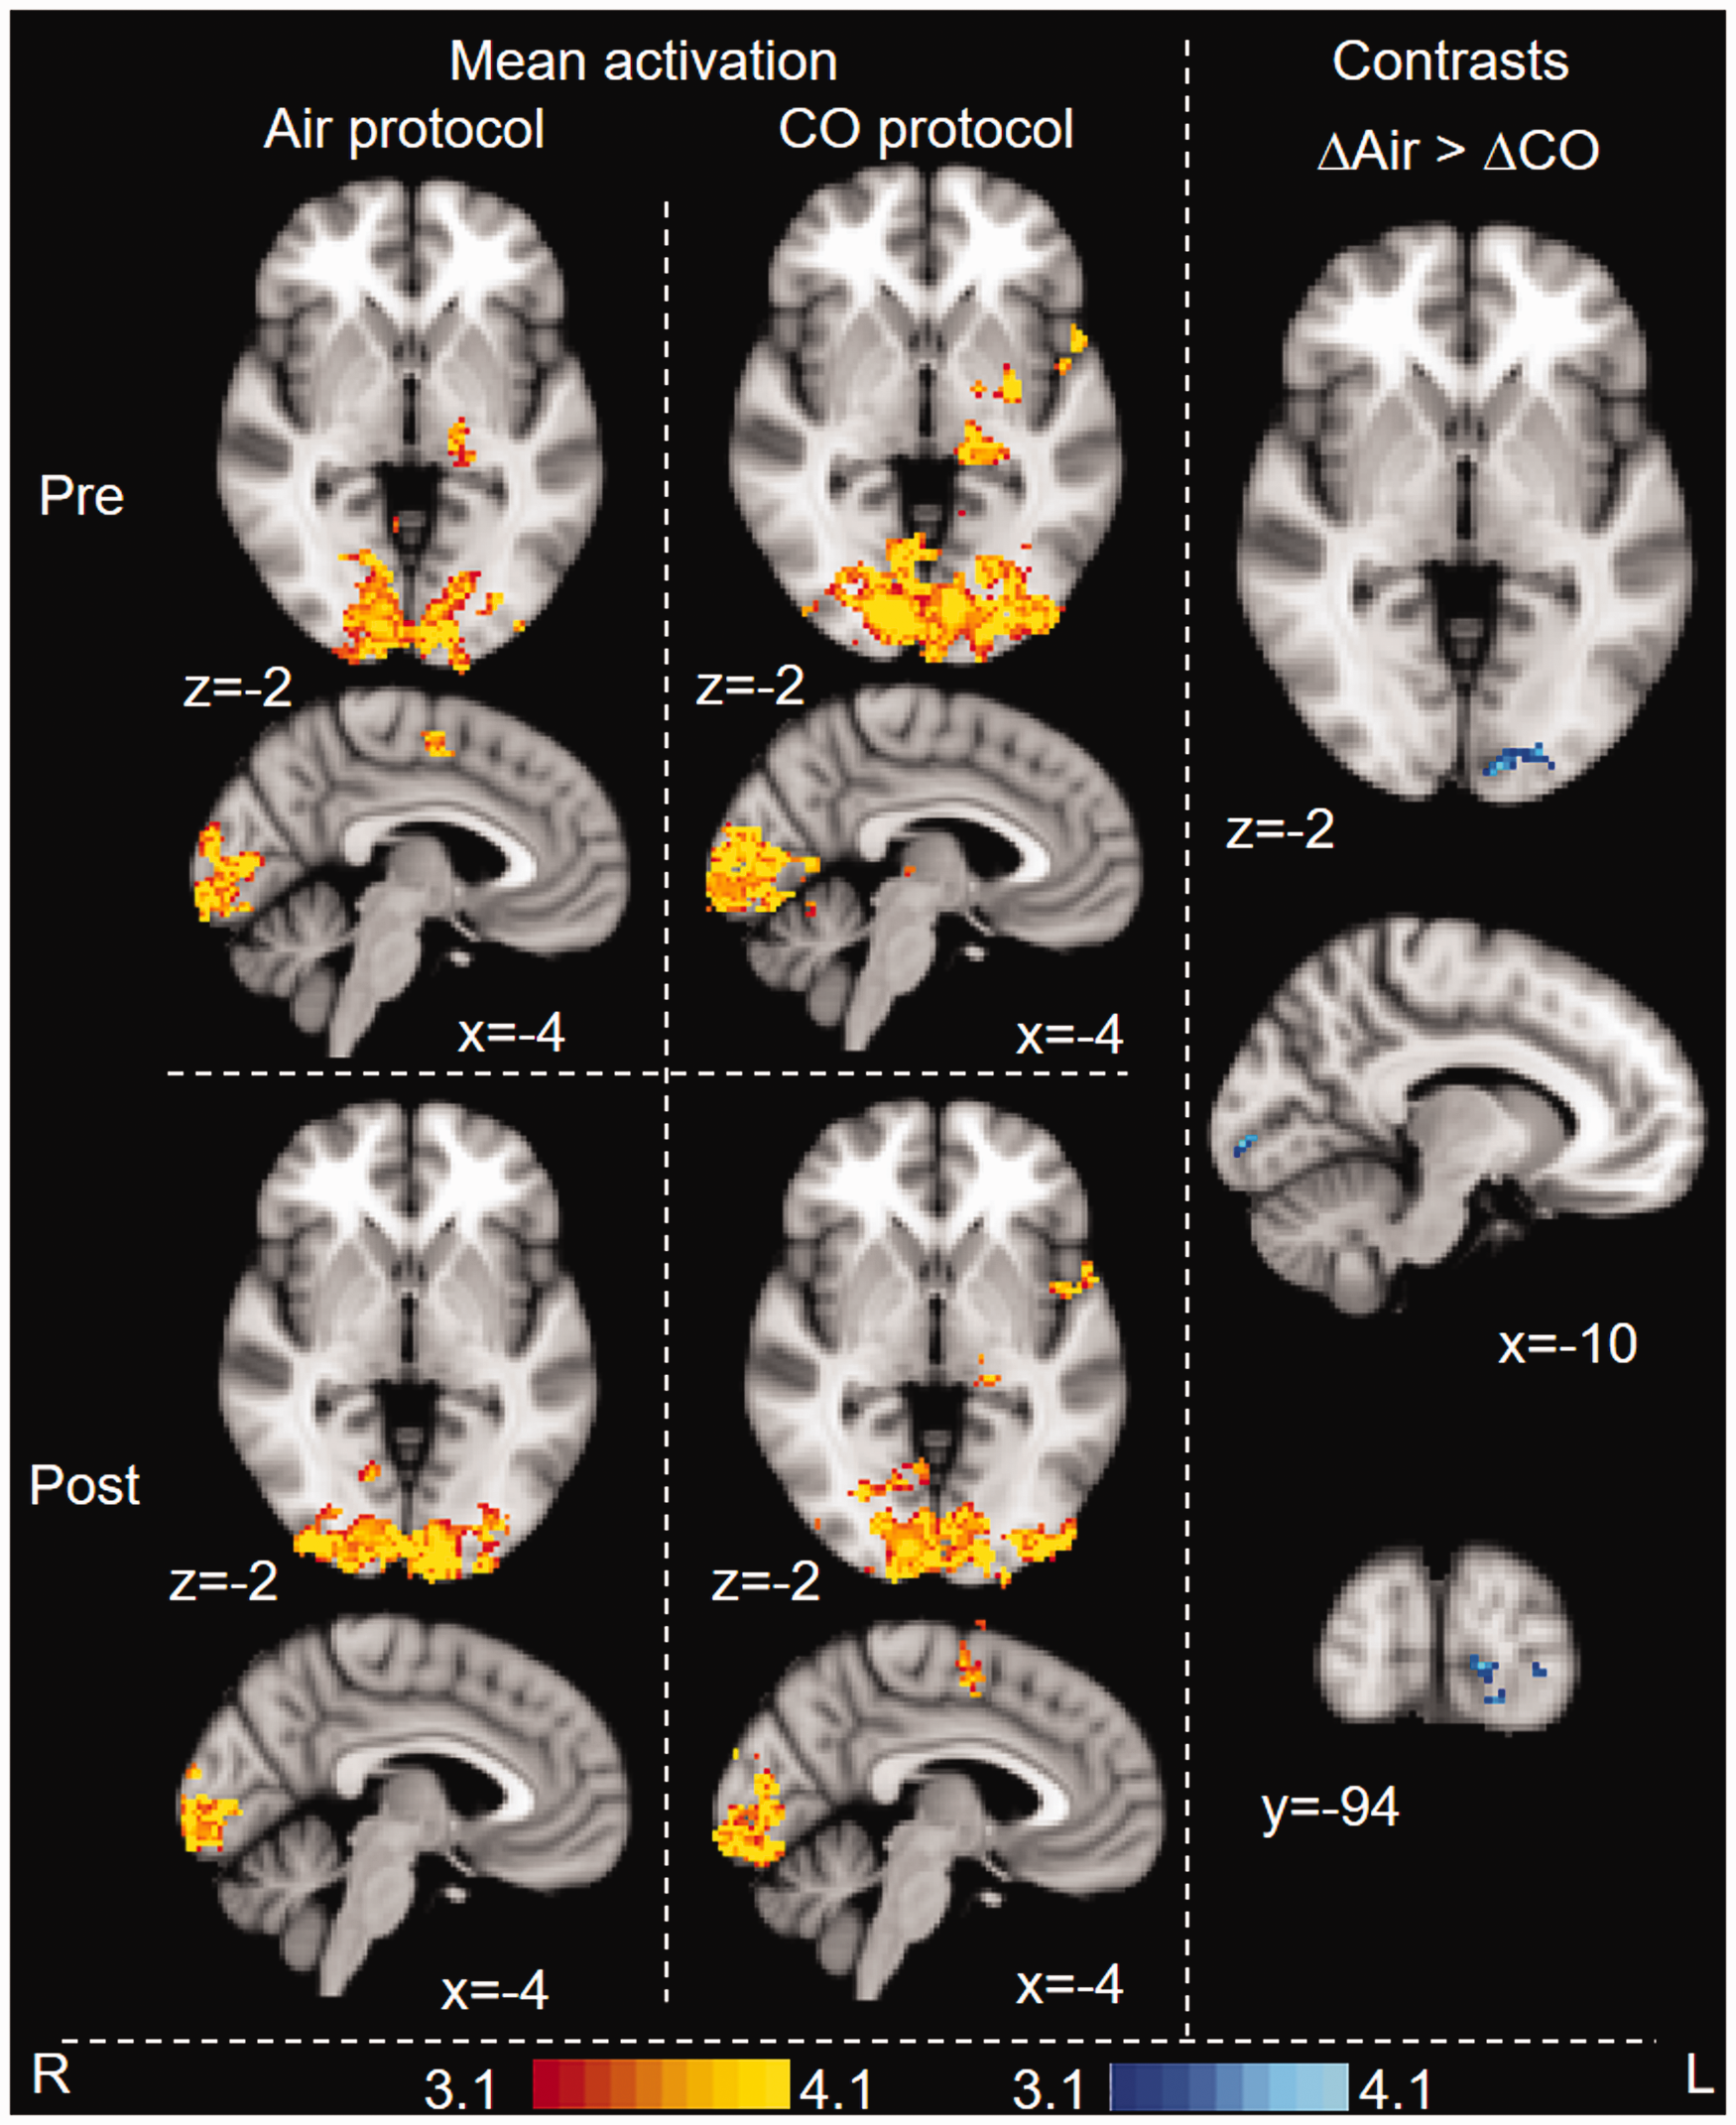
BOLD fMRI response during motor task. Whole-brain analysis. Images are colour-rendered statistical maps superimposed on a standard (MNI) brain. Significant regions are displayed with a threshold of Z > 3.1 with a cluster probability threshold of p < 0.05 (corrected for multiple comparisons). Maps are BOLD response associated with air and CO inhalation (pre- and post-intervention), and contrasts between protocols (contrast between the pre- vs. post-intervention difference maps). For contrasts, blue-lightblue indicates where the BOLD response following CO (i.e. CO(post>pre)) was lower than the BOLD response following air.
CVR maps for the breath hold task can be found in the supplement (Figure S5). Statistical comparisons showed no difference in mean %BOLD/mmHg between baseline (pre-intervention) scans, but a statistically significant difference in post-intervention scans (CVR lower in the CO protocol, p = 0.048).
Visual task ( Figure 4 )
The flashing checkerboard generated significant BOLD activation in the visual cortex for all scans. Group comparisons showed lower activation in response to the task in the CO protocol compared to air. This was observed in the visual cortex.
Motor task ( Figure 5 )
The finger-tapping task generated significant task-related BOLD activation in the left primary and secondary somatosensory cortices, the left premotor and primary motor cortices, the left thalamus and the visual cortex for all scans. Group comparisons showed lower activation in response to the task in the CO protocol compared to air in the visual cortex. The group analysis at a lower cluster-forming threshold also showed higher activation in the CO protocol compared to air in the premotor cortex (Figure S10).
Discussion
Key findings
In this study, we show that a small amount of inhaled CO, raising expired levels from ∼3ppm to ∼6 ppm, significantly alters BOLD response in never-smokers. This suggests that CO, even in low doses, might be a confound in BOLD fMRI. Systematic differences in COHb between, e.g., a patient group consisting of a greater proportion of smokers and a control group of predominantly non-smokers could generate group differences that are CO-related rather than associated with the specific research outcome. This could affect the results of clinical trials and patient-oriented neuroscience research. Given that absolute measures of CBF were not obtained in this study, the mechanism underlying the observed impact remains unknown (although potential mechanisms are discussed below). Future studies should incorporate flow measurements using techniques such as arterial spin labelling to further elucidate the effect of CO on BOLD fMRI.
Discussion of findings
Studies have shown that global baseline increases in CBF can reduce or alter task-related BOLD response. For example, Cohen et al. 28 used experimentally induced hypercapnia to reduce visual activation, and Brown et al. 29 showed that the cerebral vasodilator acetazolamide can dampen motor activation. Similarly, Halani et al. 11 showed that BOLD response could be modulated by changes in baseline CBF (induced by hypercapnia) as this altered the time course of cerebrovascular responses. Yet this effect has not yet been linked to CO exposure.
To probe the vulnerability of the BOLD response to COHb elevation, we employed a low-level increase in inhaled CO, raising exhaled levels to the lowest associated with tobacco smoking. Using this minimal level, we observed significant effects on BOLD response during a hypercapnic challenge and during commonly used visual and motor tasks. The large impact of low-level CO exposure on common fMRI paradigms such as a simple flashing checkerboard and finger-tapping tasks highlights the relevance of the present findings.
The effect of CO on BOLD response was not uniform. BOLD response changes associated with visual and motor tasks were impacted by CO exposure. Compared to air, the BOLD response changes were lower for the visual task and lower in the visual cortex during the motor task, but analysis using a lower cluster-forming threshold of 2.3 also showed an area of activation in the motor cortex that was higher compared to air during the motor task (see Figure S10). The reduction in visual cortex signal mirrors that for the visual task, and may be associated with the visual instructions on screen throughout tapping intervals. The agreement in CO-impact on BOLD response in the visual cortex between these two separate and different tasks is encouraging. However, the higher BOLD response in the motor cortex after CO exposure compared to after air, despite only surviving at a lower cluster-forming threshold (Figure S10, S11), could indicate that the impact of CO on global fMRI signal might be complex. Studies have shown that hypercapnia may affect BOLD response differently depending on the type of task and activated brain regions. For example, Kastrup et al. 30 reported that BOLD response changes with hypercapnia were greater in the visual cortex than in the sensorimotor cortex, possibly due to the location of large veins and/or neural activity associated with respiratory stimuli. 31 Bright et al. 12 have shown that there are regional differences in optimal haemodynamic delay under hypercapnic conditions, with the visual cortex trending towards lower optimal delay than, e.g., the parietal lobe. It is possible that the regional variations observed in our study is, in part, due to variations in optimal haemodynamic delay although further studies are required to fully elucidate the underlying mechanism.
Potential mechanisms
At present, we cannot be certain of the mechanism(s) underlying CO mediation of BOLD response. Acute CO exposure can cause cerebral vasodilation both directly 32 and indirectly through nitric oxide, 33 and changes in CBF can impact BOLD response in a variety of ways. 34 Increases in baseline CBF can create ceiling effects, thus reducing task-related signal. 34 For example, hypercapnia has been shown to increase baseline CBF, reduce BOLD activation28,34 and alter the time course of the BOLD response11,12 in a potentially region-specific manner. 12 While it is difficult to draw direct comparisons between hypercapnia and CO exposure, particularly during breath holds as CO and CO2 may interact, 35 it is possible that similar mechanisms underlie our findings. Hypercapnia has also been shown to reduce CVR 13 (but see also 12 ). Indeed, we observed that CVR following CO inhalation was significantly reduced compared to CVR following air inhalation, suggesting that CO may affect BOLD response at least partly through changes in CVR. In summary, both alteration of the BOLD response time course and changes in CVR may explain the impact of CO on BOLD response in our study.
Other mechanisms that may contribute to the observed BOLD response change include the formation of COHb at the expense of oxyhaemoglobin. This may cause increased CBF through the development of hypoxia, 36 and may be augmented by the presence of hypercapnia. 35 While we observed reduced PETO2 during the second scan on each experimental day, this was similar for both protocols, and may thus rather be due to altered breathing patterns during the experimental protocol despite pre-scan acclimatization to the breathing system. Furthermore, PETO2 remained within normal range throughout the experiment. It is therefore unlikely that hypoxia is the cause of the observed group differences. Hypoxia may, however, contribute to BOLD response changes at higher doses of CO. Another way in which CO could reduce BOLD response is by shifting the oxygen dissociation curve to the left, reducing oxygen availability. While this is unlikely to be the mechanism in the present study, given the low levels of COHb observed, the impact of CO on physiology is complex and should not be ignored.
CO may also slightly inhibit cell respiration even under normoxic conditions 37 and it remains unknown whether the observed effect on BOLD response is linked in part to metabolic modulation. Similarly, we cannot rule out the possibility that CO altered BOLD response through its role as an endogenous neurotransmitter. 38
Participants showed no change in reaction times with CO compared to air, no difference in anxiety scores, and were not able to tell which protocol they were undertaking when prompted. It is thus unlikely that the effect on BOLD response observed in our study is driven by behavioural factors.
While further work is required to elucidate the precise mechanism underlying our findings, it is clear that CO can alter BOLD response, and should be considered a non-negligible neuroimaging confound. Further work should include formal comparisons between smokers and non-smokers to determine the impact of CO on BOLD response in a wider population beyond our tightly-controlled sample.
Brain regions
As the purpose of the study was to assess whether there is an overall, global effect of CO on BOLD response rather than interrogating specific neural responses, tasks were not linked to behavioural measures. Consequently, the following interpretation of BOLD response change patterns is speculative in nature as it relies upon reverse inference, and will be kept short. We observed BOLD response reductions after CO for the visual task in the visual cortex (as expected for this task), although this was not found in the contrast between protocols. The BOLD response change outside of the visual cortex was not significant in either mean analysis, suggesting that protocol differences were driven by small variations in signal between protocols (see e.g. Herigstad et al. 39 ). Similarly, group analysis showed reduced BOLD response change in response to the breath hold task in the left insula, which is associated with breathing challenges and anticipation of the same.39–42 Mean contrasts also highlighted differences in the premotor cortex, left secondary somatosensory cortex, left supramarginal gyrus39,40 and in the brain stem.40,43 The reason for the lateralisation remains unknown, but may be due to left-lateralisation associated with reading. 44 It is thus possible that there are effects of CO on BOLD response that are specific to respiratory processing centres, and that tasks probing such regions could be particularly susceptible to CO effects, although further studies incorporating appropriate behavioural measures are required to determine if this is the case.
Implications for neuroimaging and clinical trials
In this study, we show that low-level CO exposure may significantly alter BOLD response. Due to its affinity for haemoglobin, CO is not readily removed and therefore its effects on signal could persist for some time following inhalation. Here, CO assessments made following the scan (approximately 20 and 30 min after the intervention) show steady, elevated levels of exhaled CO (Figure 2). This level of CO exhalation is at the lower end of that associated with smokers, with mean exhaled values being more than 20 ppm in outpatient groups. 10 It remains unknown if higher levels of CO exposure will have a greater effect (i.e. a dose-dependent effect similar to that observed in rat aortas 45 ). Furthermore, the findings observed in this paper suggest that the effect may be region- and/or task-dependent, which could complicate any potential adjustments for COHb during analysis.
Smoking is associated with a range of diseases, including cardiorespiratory diseases, cancers, dementia and cognitive decline 46 and several mental disorders, 47 as well as demographic factors such as socioeconomic status, education and income level. 48 CO exposure through cigarette smoking could therefore constitute a significant confound in neuroimaging research. Differences in COHb may occur both longitudinally (e.g. if smoking participants or patients are encouraged to stop smoking) and whenever participants or patients are compared with controls that are not precisely matched for smoking behaviour. Furthermore, the possibility for dose-dependent effects means that it may not be sufficient to match simply for ‘smoker’ and ‘non-smoker’, but rather the amount of COHb present in the blood stream. Given that only a small increase in COHb might affect BOLD response, this confound should be monitored carefully, particularly in clinical trials.
Conclusions
We conclude that even small amounts of inhaled CO might significantly alter BOLD response during simple tasks such as breath hold, visual stimulation and finger-tapping. Further research is required to assess the precise underlying mechanism of this effect as well as generalisability to a wider population including smokers. We suggest that care should be taken to include CO as a potential confound in neuroimaging research when appropriate, for example in studies on clinical populations with greater/lower prevalence of smokers.
Supplemental Material
JCB887358 Supplementary material - Supplemental material for Low-level carbon monoxide exposure affects BOLD fMRI response
Supplemental material, JCB887358 Supplementary material for Low-level carbon monoxide exposure affects BOLD fMRI response by Caroline Bendell, Shakeeb H Moosavi and Mari Herigstad in Journal of Cerebral Blood Flow & Metabolism
Footnotes
Funding
The author(s) received no financial support for the research, authorship, and/or publication of this article.
Acknowledgements
We would like to thank Steve Knight for his generous assistance with data collection, and Dr Olivia Faull, Dr Anja Hayen and Dr Kyle Pattinson for their invaluable feedback on the analysis and manuscript. This study was funded by the Oxford Brookes University Central Research Fund.
Declaration of conflicting interests
The author(s) declared no potential conflicts of interest with respect to the research, authorship, and/or publication of this article.
Authors’ contributions
CB contributed to the data acquisition, manuscript draft and approval. SM contributed to the concept and design, manuscript revision and approval. MH contributed to the concept and design, data acquisition, analysis, interpretation of data, manuscript draft and approval.
Supplemental material
Supplemental material for this article is available online.
References
Supplementary Material
Please find the following supplemental material available below.
For Open Access articles published under a Creative Commons License, all supplemental material carries the same license as the article it is associated with.
For non-Open Access articles published, all supplemental material carries a non-exclusive license, and permission requests for re-use of supplemental material or any part of supplemental material shall be sent directly to the copyright owner as specified in the copyright notice associated with the article.