
Abstract
Obstructive sleep apnea (OSA) is characterized by intermittent obstruction of the airways during sleep. Cerebrovascular reactivity (CVR) is an index of cerebral vessels' ability to respond to a vasoactive stimulus, such as increased CO2. We hypothesized that OSA alters CVR, expressed as a breath-hold index (BHI) defined as the rate of change in CBF or BOLD signal during a controlled breath-hold stimulus mimicking spontaneous apneas by being both hypercapnic and hypoxic. In 37 OSA and 23 matched non sleep apnea (NSA) subjects, we obtained high temporal resolution CBF and BOLD MRI data before, during, and between five consecutive BH stimuli of 24 s, each averaged to yield a single BHI value. Greater BHI was observed in OSA relative to NSA as derived from whole-brain CBF (78.6 ± 29.6 vs. 60.0 ± 20.0 mL/min2/100 g, P = 0.010) as well as from flow velocity in the superior sagittal sinus (0.48 ± 0.18 vs. 0.36 ± 0.10 cm/s2, P = 0.014). Similarly, BOLD-based BHI was greater in OSA in whole brain (0.19 ± 0.08 vs. 0.15 ± 0.03%/s, P = 0.009), gray matter (0.22 ± 0.09 vs. 0.17 ± 0.03%/s, P = 0.011), and white matter (0.14 ± 0.06 vs. 0.10 ± 0.02%/s, P = 0.010). The greater CVR is not currently understood but may represent a compensatory mechanism of the brain to maintain oxygen supply during intermittent apneas.
Keywords
Introduction
Obstructive sleep apnea (OSA) is a chronic disorder that affects up to a quarter of the adult Western population in the age range of 30–70 years. 1 The key hallmark of OSA is recurrent obstruction of the upper airway during sleep from a mechanical dysfunction of the throat's musculature, resulting in a periodic cessation or reduction in breathing with subsequent cyclic desaturations of arterial blood. Obesity is the primary risk factor linked to the development and progression of OSA due to elevated upper airway mechanical loads. 2 In patients with severe OSA, interrupted breathing raises both blood pressure and heart rate following transient blood oxygen desaturation.3,4 The intermittent nocturnal hypoxemia and hypercapnia, and the resulting periodic episodes of oxygen desaturation and reoxygenation, have been causally associated with a greater propensity of stroke, hypertension, cardiovascular diseases and type-2 diabetes.4–7
Cerebral blood flow (CBF) is tightly regulated (cerebral autoregulation) to maintain constancy of cerebral perfusion in response to variations in systemic blood pressure (mechanoregulation) and carbon dioxide (CO2) concentration (chemoregulation). 8 In healthy subjects performing voluntary breath holding, the normal mechanism in response to hypercapnia is dilation of the brain's blood vessels, resulting in increased CBF.9,10 In patients with OSA, chronic cyclical hypoxia is thought to result in impaired vascular reactivity due to oxidative stress6,11,12 causing depletion of vasodilatory nitric oxide. 13
Cerebrovascular reactivity (CVR), the temporal change in CBF in response to a vasoactive stimulus, is an index of the capacity of cerebral vessels to respond to a vasoactive stimulus. Quantification of CVR, therefore, allows evaluation of brain blood flow regulation. It is well known that reduced CVR is predictive of future stroke and transient ischemic attack in patients with carotid artery occlusion.14,15
Most prior CVR studies have measured blood flow velocity in the middle cerebral artery by means of transcranial Doppler (TCD) sonography 16 during a CO2 challenge.17,18 More recently, CVR has been evaluated by MRI from the blood oxygenation level dependent (BOLD) signal in response to a hypercapnic stimulus, either in the form of exogenously administered CO219 or a breath-hold (BH) challenge. 20 It has been shown that CVR measurements derived from the two different stimuli correlate. 21
Prior investigation into the effect of OSA on measures of CVR has resulted in disparate conclusions, showing either a significant reduction,22,23 no effect or, 18 in very recent work, greater CVR in OSA subjects. 24 However, these studies used methods based on carotid artery or middle cerebral artery Doppler ultrasound flow velocity.22,23 In the work by Placidi et al., 23 a breath-hold index (BHI) was defined as the change in flow velocity in response to a BH challenge. In recent work by Ryan et al., 24 the BOLD MRI response to a hypercapnic gas challenge was measured by means of computer-controlled administration of CO2 via a face mask, yielding maps of CVR throughout the brain.
Here, we quantified whole-brain CBF by phase-contrast MRI25,26 in a draining vein and supplying arteries27,28 during a series of temporally cued BH stimuli (also referred to as ‘volitional apnea’), performed while scanning continuously. The response to the same stimulus protocol was further evaluated regionally in the form of temporal changes to the BOLD signal. CVR was then expressed in terms of a BHI defined as the slope of the CBF or BOLD signal versus time curve during stimulation. We regard BH as a more appropriate stimulus than exogenously administered CO2 in that BH is both hypercapnic and hypoxic, thus more closely matching the physiology underlying spontaneous apneas.
Materials and methods
Study subjects
Demographics of OSA patients and NSA subjects, matched for age, height, weight, and BMI.
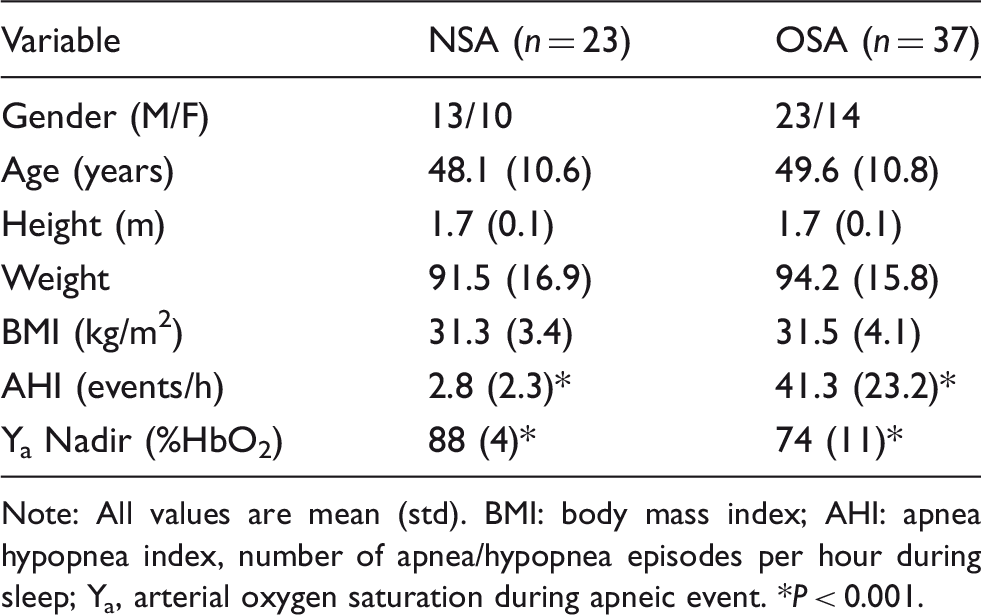
Note: All values are mean (std).
BMI: body mass index; AHI: apnea hypopnea index, number of apnea/hypopnea episodes per hour during sleep; Ya, arterial oxygen saturation during apneic event.
P < 0.001.
The severity of OSA was assessed per polysomnography in terms of the mean number of apnea and hypopnea events per hour of sleep (AHI). Obstructive apneas were scored as events comprising a ≥ 90% drop in peak signal excursion of pre-event baseline for ≥ 10 s as determined by an oronasal thermal sensor. Hypopneas were scored as a 30% reduction in the peak airflow of pre-event baseline for ≥ 10 s using a nasal air pressure transducer in association with either an arousal or ≥3% oxygen desaturation. 30 Twenty-three and 37 study subjects were grouped into NSA (AHI < 10 events/h) and OSA (AHI > 15 events/h), respectively. Subject demographics are summarized in Table 1.
Imaging procedures
Volitional apnea paradigm
The purpose of the paradigm is to elicit a dynamic vasodilatory response analogous to nocturnal apneas experienced in OSA. The paradigm is initiated with normal breathing for 100 s, followed by five successive 24-s BH periods, each separated by 66 s of normal breathing (Figure 1(a)). In order to ensure intra- and inter-subject repeatability and consistency of the volitional apneas, subjects were cued to “breathe in”, “breathe out”, and “hold” at 7 s, 3 s, and 0 s, respectively, before each apnea period, and to “breathe normally” at the end of each BH. Instructions were given visually by projecting commands onto a screen (visible to the subject via a mirror mounted on the head coil) concurrently with pre-recorded verbal instructions supplied via MRI-compatible headphones. Identical instructions were used for the two practice BHs.
Volitional apneic paradigm and MR protocol. (a) The apnea paradigm consisted of five BH periods and 66 s of normal breathing. Blue boxes indicate 24-s instructed breath-holds. (b) Time of flight MR projection angiogram, T1-weighted MPRAGE and interleaved PC-MRI were acquired for slice prescription, brain segmentation and calibration ratio, respectively. Reconstructed radial PC-MRI to generate time-course of SSS velocity, and BOLD images for evaluation of response to volitional apnea. Two 24-s practice apneas were included in the protocol prior to 10 min of continuous scanning.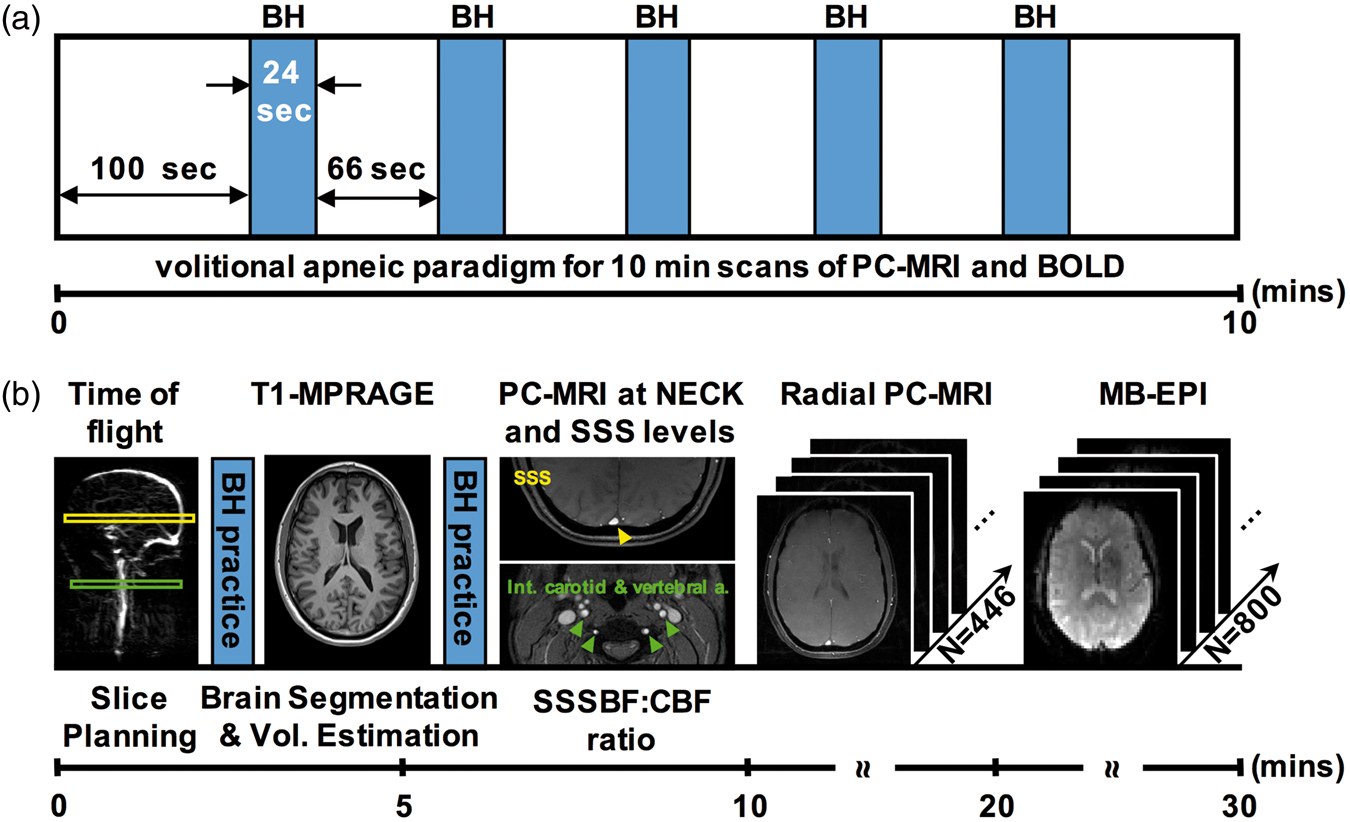
MR imaging protocol
All imaging was performed at 3 Tesla field strength (Siemens, Prisma, Siemens Healthineers, Erlangen, Germany), using a standard clinical 20-channel head coil. Subjects were fitted with a finger pulse oximeter (Expression, Invivo Research Inc., Orlando, FL, USA) to monitor oxygen saturation. The MRI protocol is summarized in Figure 1(b). A time-of-flight (TOF) angiogram was acquired to determine the two slices of interest for quantifying blood flow velocity in the superior sagittal sinus (SSS) and feeding arteries, the internal carotid and vertebral arteries. Between two practice breath holds, a 3D T1-weighted magnetization-prepared rapid gradient-echo (MPRAGE) dataset was acquired for the purpose of normalizing total CBF to 100 grams (g) of brain mass. The calibration scan was used to calculate the SSS blood flow to total CBF ratio (SSSBF:tCBF)cal at baseline by simultaneously quantifying blood flow velocity in the SSS (SSSBFcal) and neck arteries (tCBFcal) with a two-slice-interleaved version of PC-MRI. During the first time series of volitional apneas, only SSSBF was quantified using a radial PC-MRI sequence
28
(see below) and tCBF was obtained via equation (1) by means of the upscaling ratio (SSSBF:tCBF)cal determined from the calibration scan (for details see Rodgers et al.
27
).

Sequence parameters.
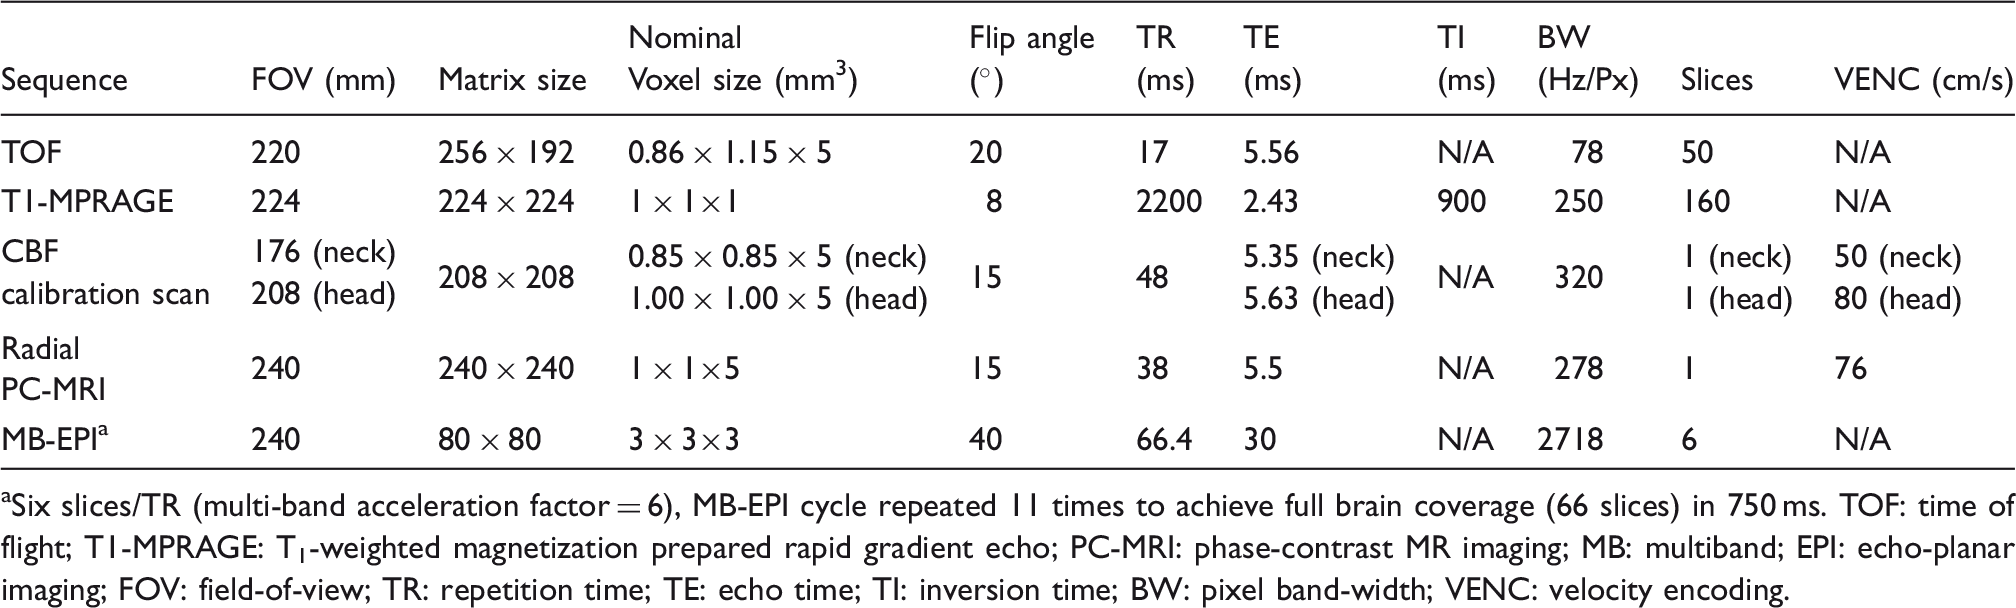
Six slices/TR (multi-band acceleration factor = 6), MB-EPI cycle repeated 11 times to achieve full brain coverage (66 slices) in 750 ms.
TOF: time of flight; T1-MPRAGE: T1-weighted magnetization prepared rapid gradient echo; PC-MRI: phase-contrast MR imaging; MB: multiband; EPI: echo-planar imaging; FOV: field-of-view; TR: repetition time; TE: echo time; TI: inversion time; BW: pixel band-width; VENC: velocity encoding.
Radial phase-contrast MRI
A non-gated velocity-encoded MRI technique with golden-angle radial sampling was used for quantifying SSSBF throughout the entire duration of the apneic paradigm. Successive views were incremented by 111.246 ° (180 ° divided by the golden ratio). 32 The pulse sequence consisted of two interleaves differing in the first moment of the z-gradient as a means to quantify blood flow velocity. 28
Data processing
Image reconstruction and all imaging analysis were performed with in-house scripts written in MATLAB (The MathWorks, Inc., Natick, MA).
Brain volume calculation
Subject-specific T1-weighted MPRAGE 3D volume images were segmented into gray matter (GM) and white matter (WM) using SPM12 (Wellcome Trust Centre for Neuroimaging, Institute of Neurology, University College London, UK) and used for quantification of brain volume. The brain volume was converted to mass based on an average brain density of 1.05 g/mL. 33
Total CBF estimation with radial PC-MRI
To fulfill Nyquist criterion in the outermost region of k-space for a 240 × 240 matrix size, 610 views were used for image reconstruction. A sliding-window reconstruction scheme with 34 views was implemented to yield 446 total dynamic images for the entire duration of the paradigm, with an effective temporal resolution of 1.29 s. 28 The reconstructed images were employed to calculate velocity maps from the phase difference between flow-encoded and flow-compensated images. The time-series velocity images were subsequently corrected for motion to the first image in the series using a rigid-body volume registration. The lumen areas of the carotid and vertebral arteries and the SSS were isolated by applying a segmentation threshold to the first magnitude image, and the obtained mask applied to all dynamic images. The optimal threshold was found by maximizing inter-class variance. 34 SSSBF was determined as the product of ROI-averaged velocity (vsss) and the area across the vessel lumen, and upscaled to tCBF using the (SSSBF:tCBF)cal ratio (eqn 1). Total CBF was then normalized to brain mass.
BOLD image preprocessing
BOLD data were spatially preprocessed using SPM12. Processing included time series realignment of all images to the first image, co-registration to the individual T1-MPRAGE images, normalization to Montreal Neurological Institute template, and spatial smoothing with an isotropic Gaussian kernel of 8 mm full-width-half-maximum. Further, temporal preprocessing was applied to remove slow varying changes and signal drift by a Butterworth high-pass filter. A Gaussian kernel was then used to reduce temporal noise. Subsequently, the preprocessed BOLD data were normalized by the mean signal during the first 90 s (119 time points) of the baseline period to obtain fractional functional contrast.
BHI
The five successive BH cycles of the tCBF and BOLD time series data were grouped into five 90 s blocks and averaged to remove physiological noise unrelated to the paradigm and improve overall signal-to-noise ratio. BHI was defined as the rate of change, ΔtCBF/Δt and ΔvSSS/Δt and, analogously, ΔBOLD/Δt, within the BH period. The local extrema of the time-series curve were identified from their second derivatives. The slope (i.e. the rate of change in response to the BH stimulus) was then obtained from the time interval Δt that involved a maximum number of temporal samples, while producing the highest possible value of averaged slope. Further, since the BH challenge increases CBF, BHI must be positive. BOLD BH indices were computed for GM and WM as well as averaged across the entire brain.
Statistical analysis
All 60 eligible subjects accomplished the first volitional acquisition, while 7 out of them failed to complete the BOLD acquisition, and therefore 53 study subjects in total were included for BOLD analysis. Group analysis was performed using Wilcoxon rank-sum test to determine the significance of differences between variables in OSA patients and NSA subjects. Further, Wilcoxon signed-rank was used to evaluate the significance of responses among segmented brain regions. Bonferroni correction (typically regarded as excessive) would require P < 0.025 and P < 0.017 as the thresholds for statistical significance involving global and regional comparisons, respectively.
Results
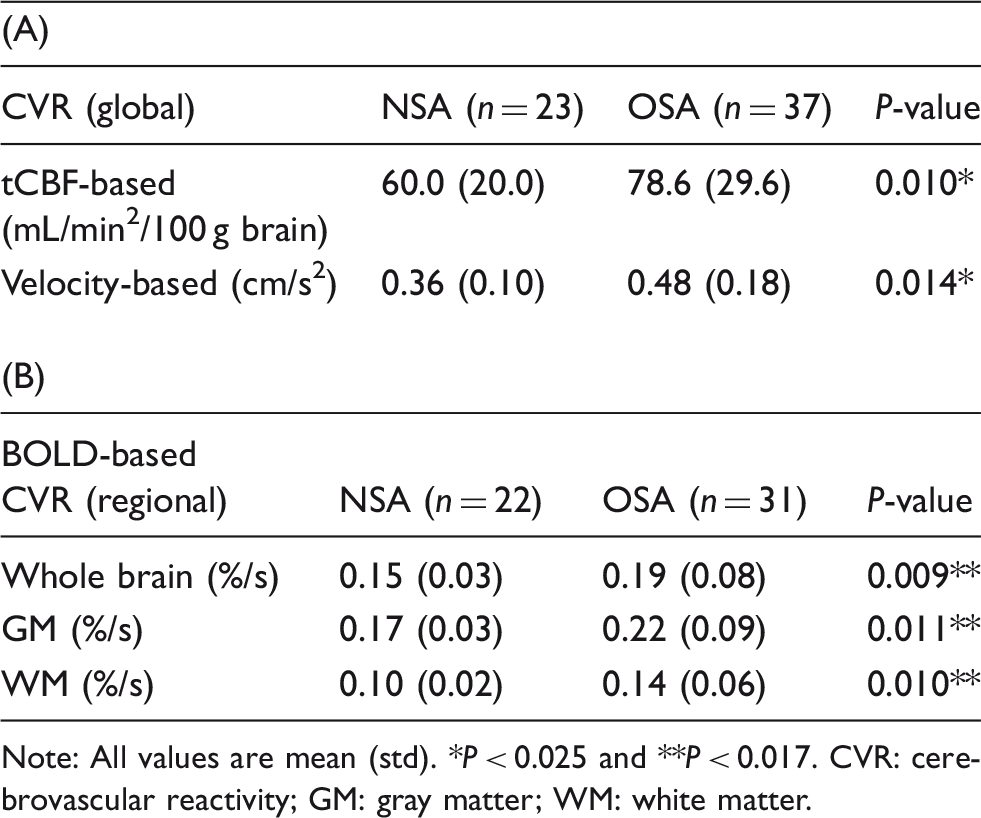
Compared to the NSA subjects, the OSA patients had significantly greater CVR when the BHI was expressed in terms of the temporal changes of tCBF (79 vs. 60 mL/min2/100 g, P = 0.010, Figure 2(a)). BHI derived from SSS flow velocity time-course was also significantly greater in OSA patients (0.48 vs. 0.36 cm/s2, P = 0.014, Figure 2(a)). To further investigate the potential confounders for tCBF calculation, the calibration ratio (SSSBF:tCBF)cal and brain mass were compared between OSA and NSA groups (Figure 2(b)). There was no significant difference between the groups in upscaling calibration ratio (0.53 vs. 0.54, P = 0.773) and the OSA group did not differ from the NSA group in brain mass (1215.8 vs. 1256.0 g, P = 0.533).
Whole-brain data: (a) BHI expressed as temporal change in tCBF (left) and SSS flow velocity (right), based on phase-contrast flow velocity measurements. Subjects with OSA (red) had a significantly greater BHI derived from tCBF (79 vs. 60 mL/min2/100 g, P = 0.010) and from flow velocity (0.48 vs. 0.36 cm/s2, P = 0.014). (b) Neither the flow upscaling calibration factor nor the brain mass were significantly different between groups.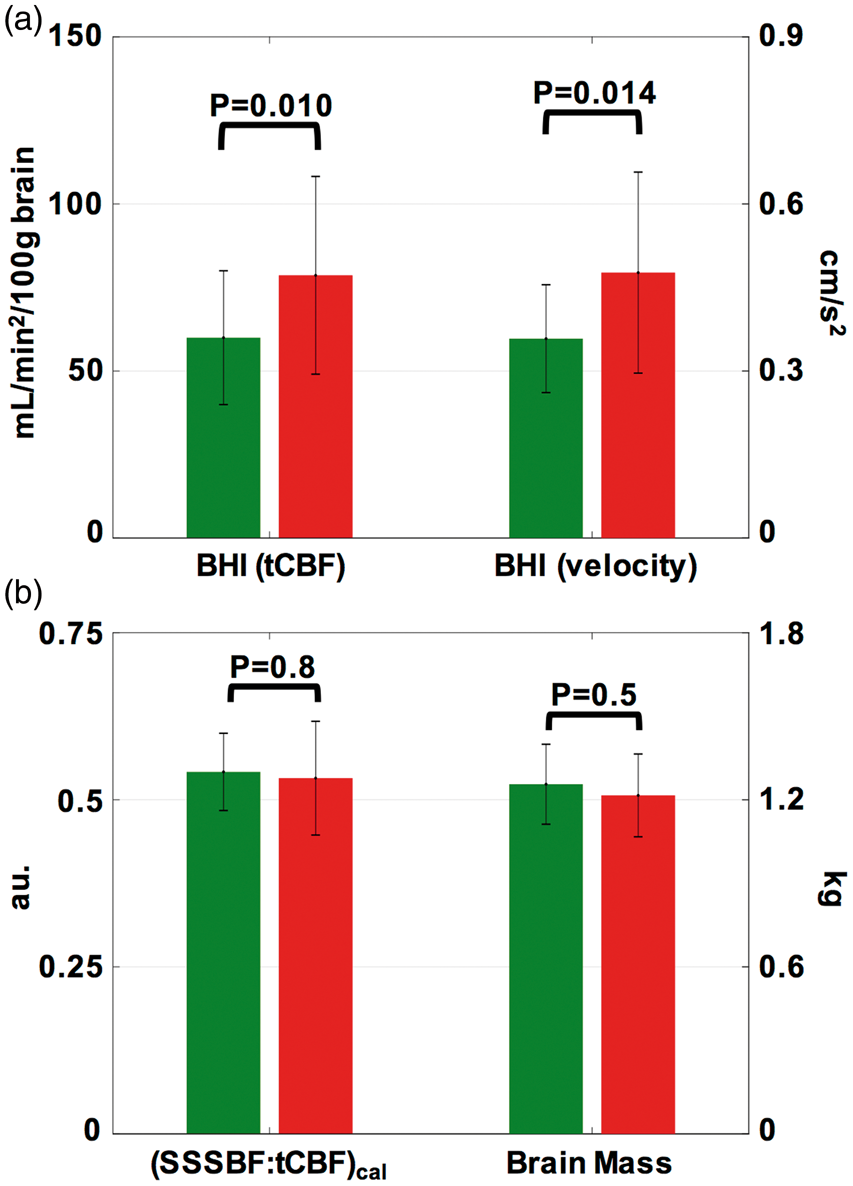
An example of a BOLD time-course from a representative OSA subject is provided in Figure 3(a) showing the response to the BH challenge averaged across the whole brain, GM, and WM, illustrating the expected increase in BOLD during the hypercapnic stimulus, most prominently in GM. Averaged BOLD time-courses over five BH cycles are illustrated in Figure 3(b). The time-courses of tCBF and velocity from the same subject are shown in Figure 3(c) and (d). Representative BHI maps in Figure 3(e) display the spatial distribution of this physiologic parameter, in which greater CVR in OSA was observed. Relative to the results in OSA, the response to BH was more homogeneous across the whole brain in NSA subjects. Figure 3(f) shows group comparisons in three brain regions, indicating that BH indices in the OSA group were significantly greater than those in the NSA group: 0.19 vs. 0.15%/s (P = 0.009), 0.22 vs. 0.17%/s (P = 0.011), and 0.14 vs. 0.10%/s (P = 0.010), for whole brain, GM and WM, respectively. In all subjects, the BHI indices were greater in GM than those measured for whole brain (P < 0.001), as well as for GM relative to WM (P < 0.001), which is also evident in the BHI parametric maps (Figure 3(e)). Full results of the CVR statistical analysis are given in Table 3.
Temporal response to intermittent 24-s BH challenges in a patient with OSA (AHI = 28) and BOLD-derived BH indices. (a) BOLD signal (%) averaged across the whole brain, gray matter and white matter; (c) tCBF (mL/min/100 g brain) and SSS flow velocity (cm/s). (b, d) Temporal averages of time-course data in (a, c), with dashed lines representing calculated slopes yielding BHI. Shaded area represents apneic period. (e) BHI maps derived from BOLD for three imaging slices from the same OSA patient and a representative NSA subject. (f) BHI for OSA subjects (red) and NSA reference subjects (green) pertaining to whole brain, GM, and WM. Greater BH indices in OSA were significant in all three brain regions. Summary of regional and global CVR between matched NSA subjects and OSA patients: (A) Global CVR derived from tCBF and SSS blood flow velocity and (B) regional CVR derived from BOLD. Note: All values are mean (std). *P < 0.025 and **P < 0.017. CVR: cerebrovascular reactivity; GM: gray matter; WM: white matter.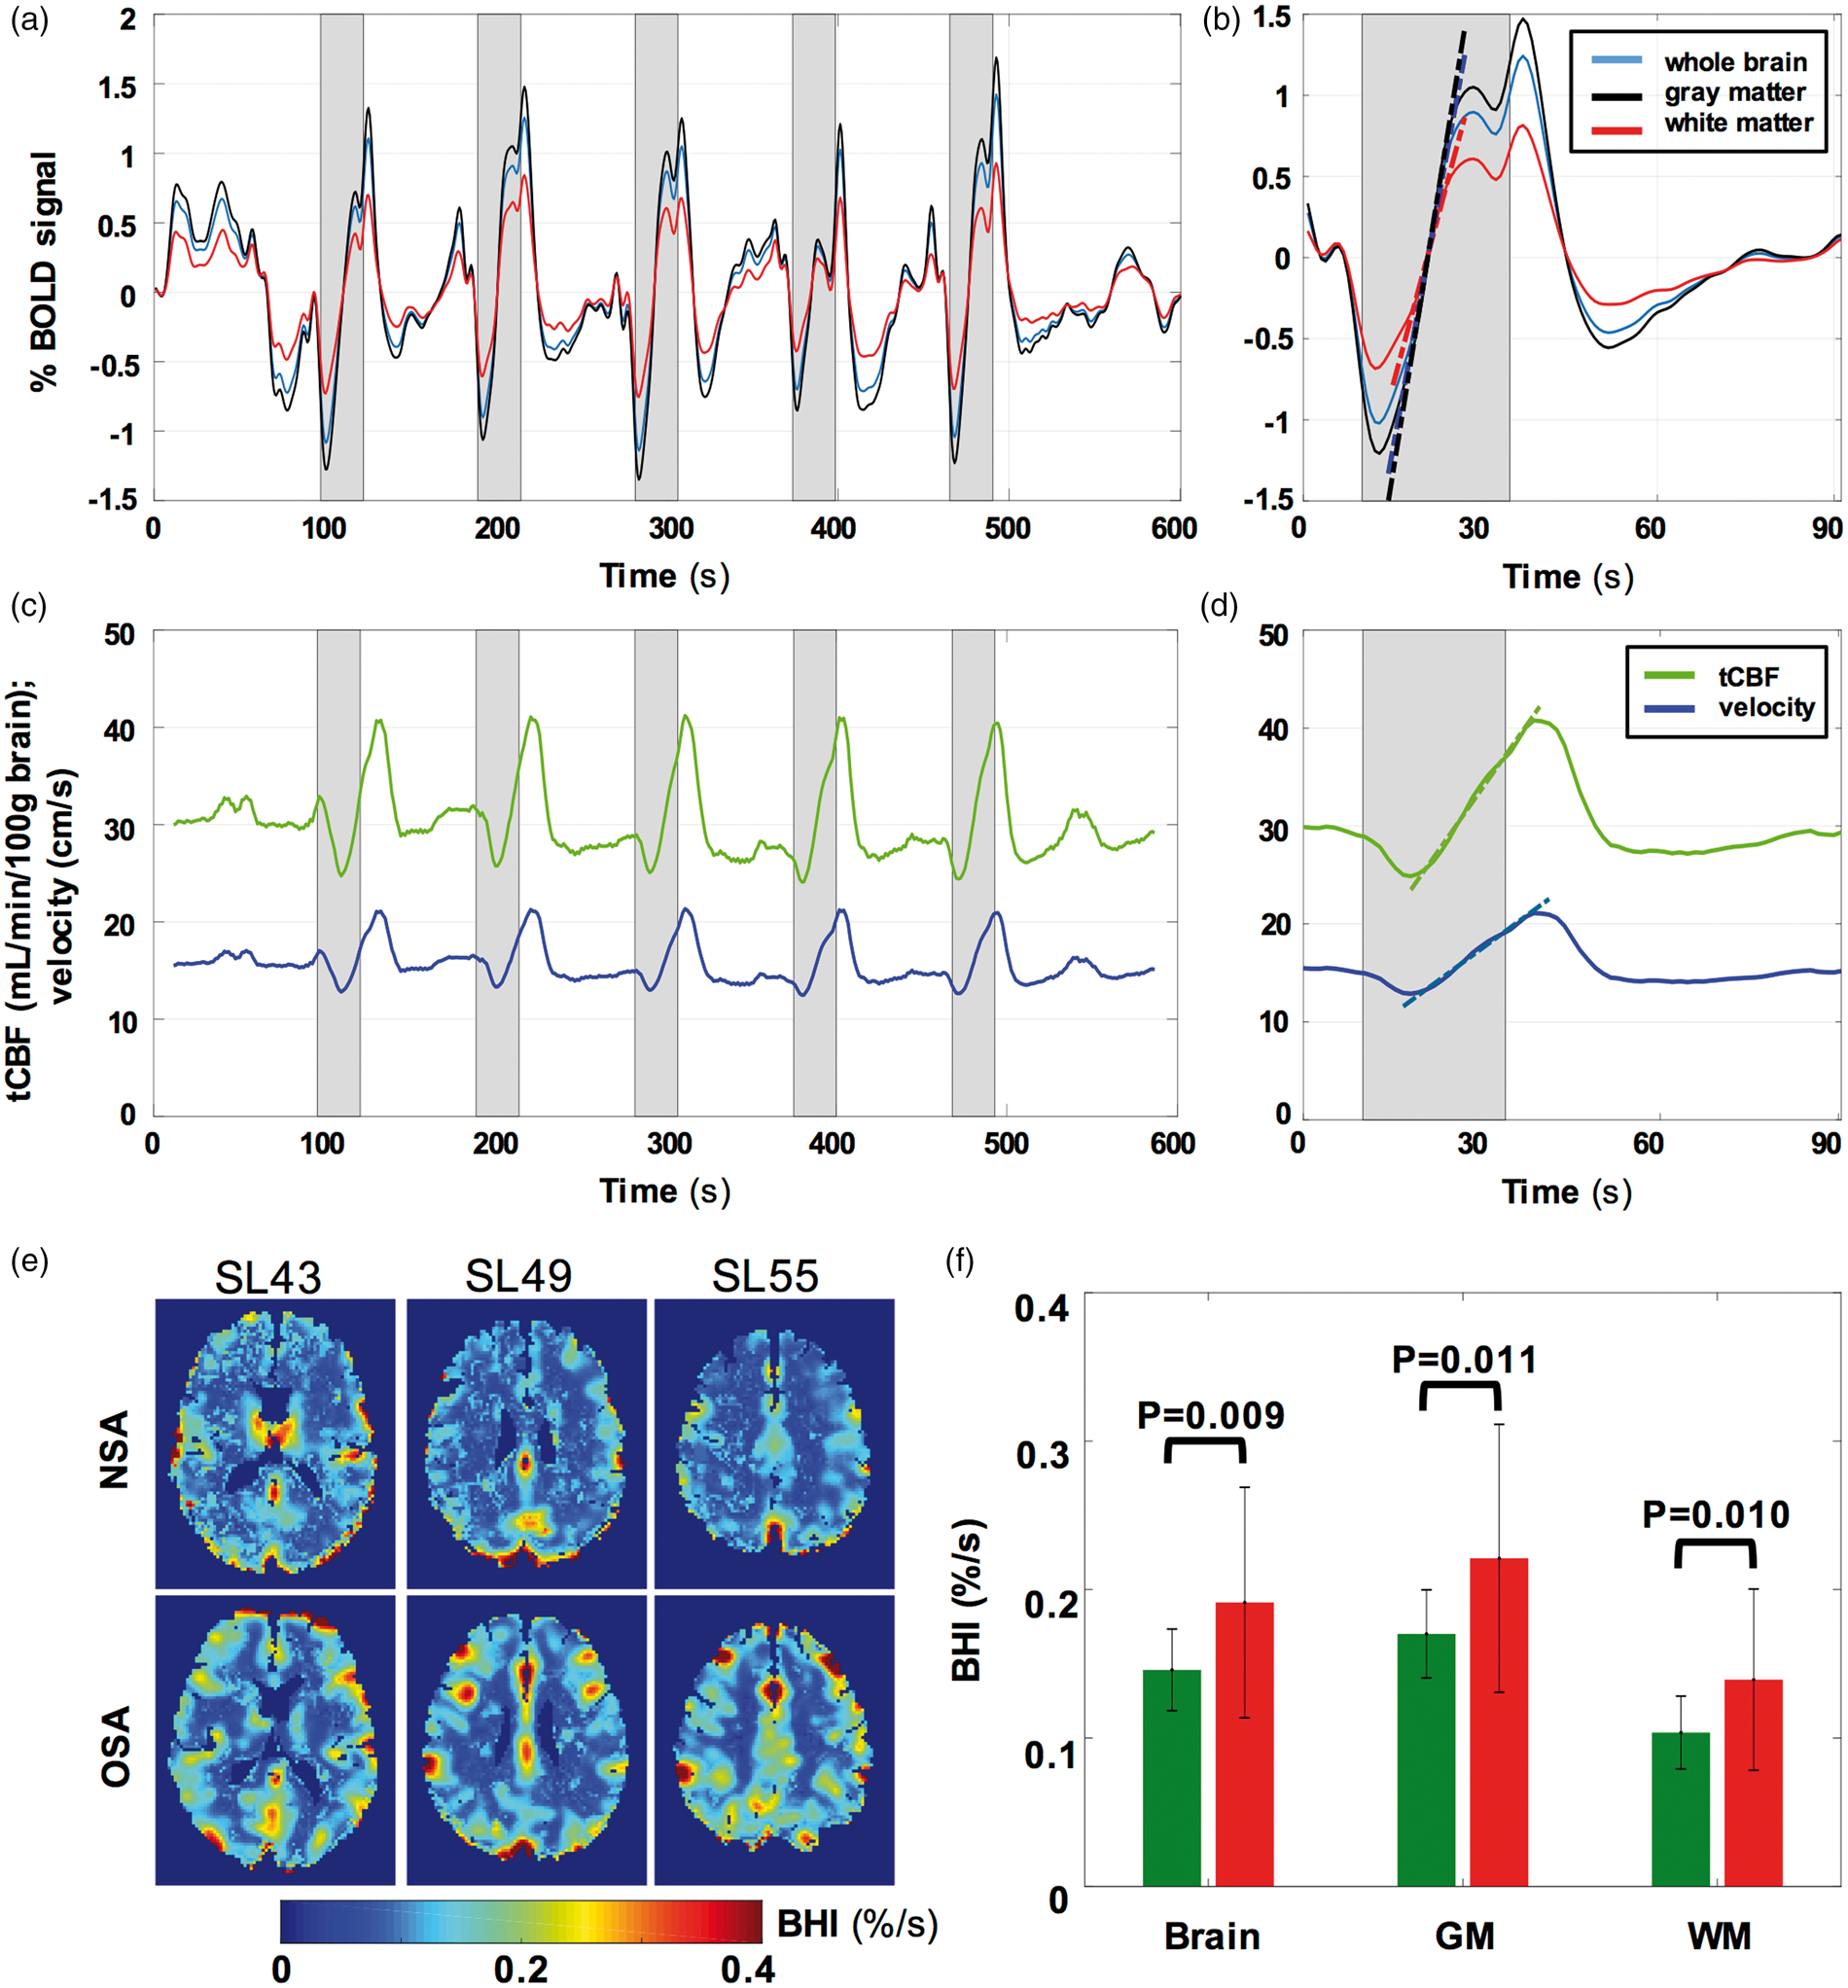
Neither regional nor global BHI were correlated with AHI (r2 = 0.006, P = 0.680 and r2 = 0.003, P = 0.742, respectively). When including all subjects (N = 53 for BOLD and N = 60 in PC-MRI-based analyses), AHI was weakly correlated with BHI in gray matter (r2 = 0.100, P = 0.022) or global tCBF-based BHI (r2 = 0.075, P = 0.036) but upon removal of outliers the associations were no longer significant. Further, there was no correlation of any of the CVR measures with subjects' BMI or weight. The variables of BMI and weight were matched between groups and not statistically different as per Table 1; thus, are not expected to have contributed to the differential CVR between OSA and NSA.
Four patients with severe OSA (mean AHI ± SD = 81.8 ± 30.1 events/h) failed to stay awake during the MRI procedures and experienced recurrent spontaneous apneas during the 10 min acquisition PC-MRI, resulting in quasi-periodic desaturations throughout the time-course as illustrated with the data from a severely apneic subject (AHI = 80.5 events/h, Figure 4(a)). Similar patterns were found for the three other OSA subjects with very high AHI. Figure 4(b) shows the averaged BOLD time-series across the whole brain, GM, and WM from the same representative subject. When extrapolating the number of spontaneous CBF responses in the subject of Figure 4, 90 such events per hour are evident, in good agreement with the somnographically determined AHI.
Spontaneous apneas in a patient with severe apnea (AHI=80.5 events/h). The patient was unable to stay awake and adhere to the breath-hold instructions, showing quasi-periodic fluctuations: (a) computed for total CBF and SSS velocity; (b) regional BOLD response.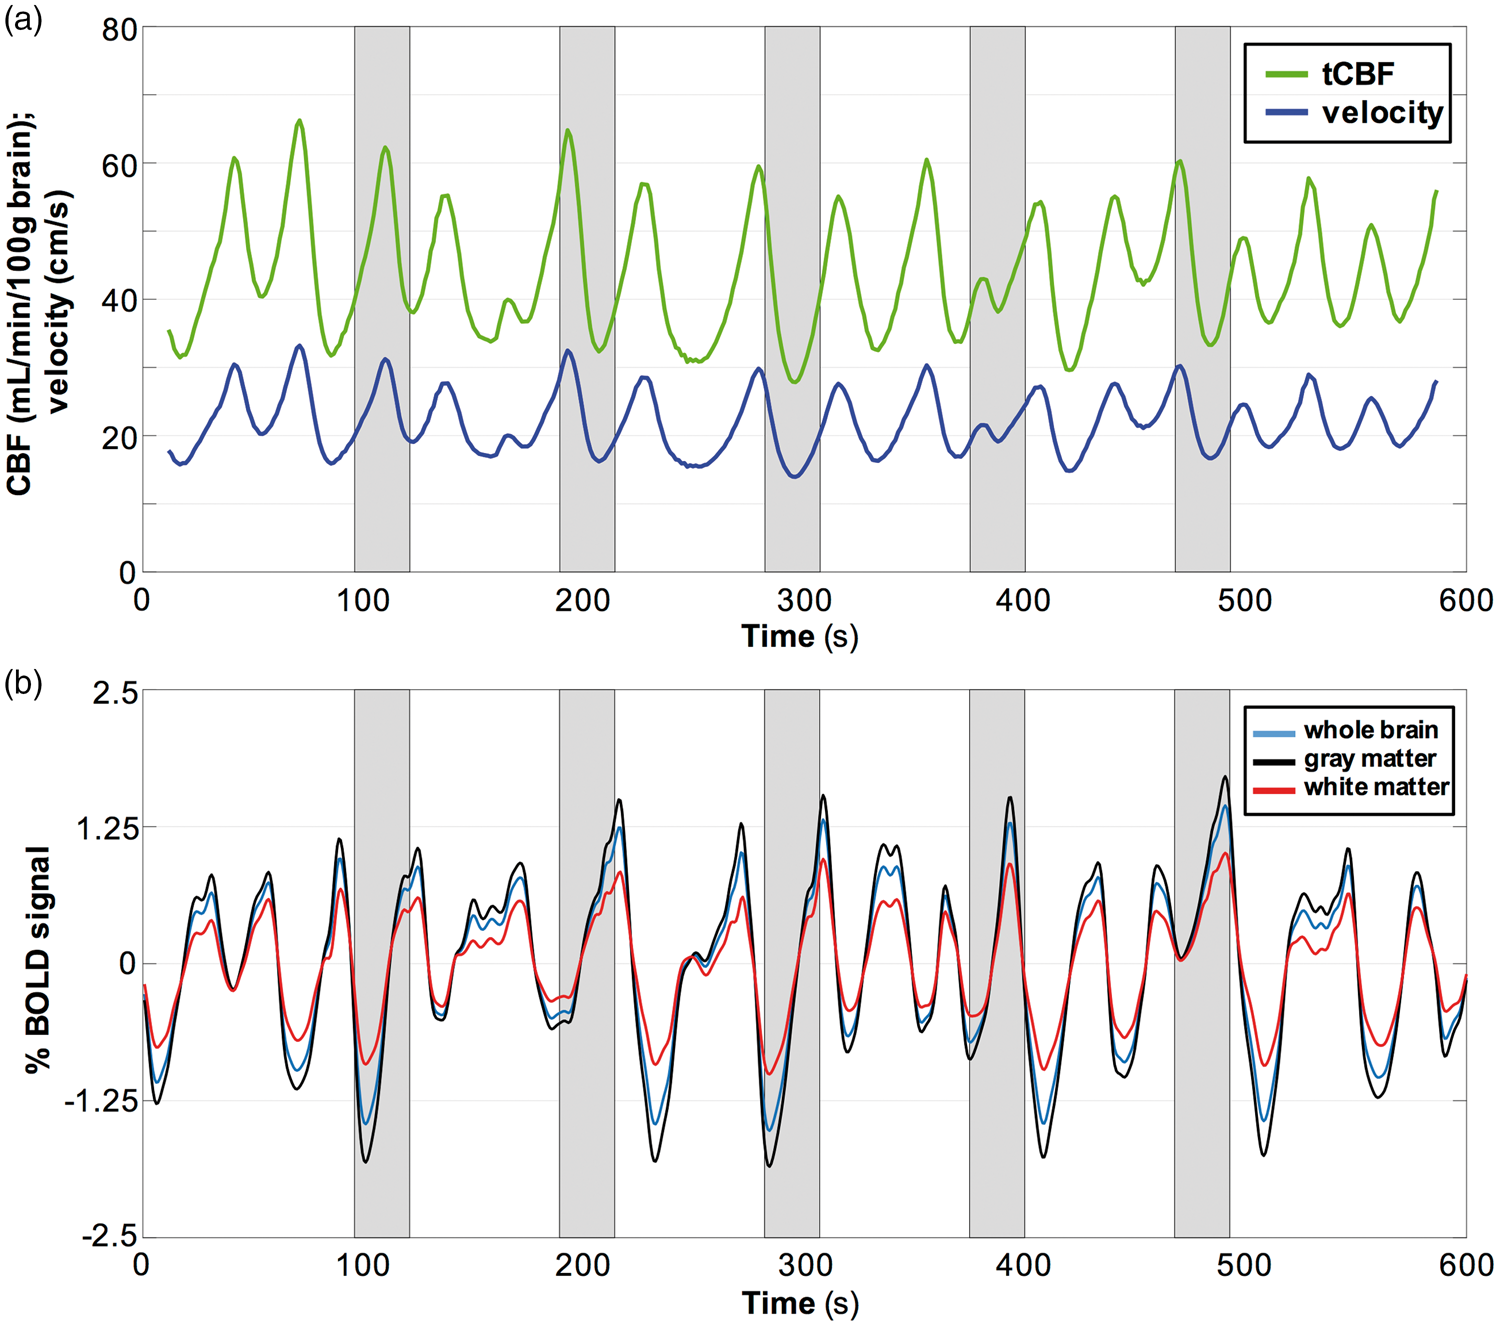
Discussion
In this study, BH as a vasodilatory stimulus mimicking sleep apnea was performed to assess CVR in patients with OSA compared to matched NSA subjects. The application of high temporal resolution imaging (1.29 and 0.75 s in radial PC-MRI and multi-band EPI, respectively) makes it possible to temporally resolve hemodynamic changes in response to challenges analogous to nocturnal apneas experienced in OSA. The BH challenge is a good model for spontaneous nocturnal apneas in that the stimulus is both hypercapnic and hypoxic. 27 We refer to the parameter evaluated as “breath-hold index”, representing a measure of CVR, but larger studies will be needed to determine the extent to which BHI parallels the more conventional method of quantifying CVR based on exogenous CO2 administration.
In the present study, greater CVR in OSA patients relative to matched NSA subjects was observed with both methods (i.e. for the BH response to global CBF measured by PC-MRI, as well as BOLD-based measurements, all P < 0.017). The strongest discriminator was BHI based on whole-brain CBF acceleration (i.e. the rate of change in CBF) during the stimulus, with CVR being greater by 30% in apneics (P = 0.010) than in the reference subjects. A pilot study previously conducted by some of the present authors, comprising 11 OSA and 10 NSA reference subjects, using a similar BH paradigm, did not show whole-brain CBF-based CVR to differ between groups, a result likely caused by different methods used in that CVR was derived as fractional changes between baseline and maximal blood flow response. 35 In distinction, the data in the present work parallel those reported recently in a similar cohort of OSA patients and NSA reference subjects where an exogenous gas breathing challenge was used in the form of two hypercapnia stimuli of a 45 and 120 s duration, each corresponding to an end-tidal CO2 level of 10 mmHg above resting baseline. 24
Earlier CVR measures reported on OSA patients relied on measurements of blood flow rate or velocity in a surrogate artery (typically the middle cerebral artery) by means of Doppler ultrasound, either in response to exogenously administered CO2 or a BH challenge.18,22,23 The signal difference between maximum and minimum (or baseline) over a BH duration was typically used to evaluate CVR. The latter was initially referred to as BHI. However, differences of a few seconds between the timing of the initiation of BH, or the time of resumption of ventilation at the end of BH period, can significantly affect the peak value of blood flow. In contrast, BHI utilized in this study was calculated by evaluating the temporal derivative of the signal (BOLD) that reflected regional changes, or the derived parameter (CBF or blood flow velocity) on a global scale. This approach obviates the need to determine baseline and peak signals, which are often ill-defined, and the subtraction adds to measurement uncertainty. Therefore, the proposed approach is relatively robust against such timing differences as long as the subjects fully suspend respiration during the paradigm.
The cerebral circulation adapts to chronic hypercapnia with autoregulation re-establishing CBF to normal levels. 9 This mechanism may explain the observation that neither velocity nor tCBF were significantly lower in OSA compared to NSA groups, either at baseline or in the fractional increase over the BH duration (data not shown). On the other hand, a greater slope of the BOLD signal during the BH challenge (i.e. greater CVR) was observed. Although the BOLD signal involves a complex interplay of CBF, cerebral blood volume (CBV), and cerebral metabolic rate of oxygen (CMRO2), it is widely accepted as an alternative CVR measurement 20 and was used in the study by Ryan et al. 24 The greater rate of change in tCBF or BOLD signal in response to BH challenges in OSA is not currently understood. It could be conjectured as a mechanism of the brain striving to maintain oxygen delivery during intermittently suspended breathing events as in our paradigm, and analogously in OSA, as described in Ryan et al. 24 Alternatively, compensatory vasodilation could occur in compromised vascular beds, resulting in exhausted vasodilatory reserve. In response to hypercapnia during intermittent disruptions of airflow to the lungs, redistribution of blood flow from the compromised vascular beds to healthier regions has been suggested. 36 This, in turn, may explain the observation of enhanced increase in CBF (i.e. greater “acceleration” in blood flow) in response to the BH challenge.
In the present work, a 24-s BH block was chosen to provide adequate response while generally being well tolerated even when applied repeatedly as used here. The stimulus duration is similar to prior work based on ultrasonic intracranial blood flow measurements23,37 and MRI-based CVR studies. 38 While BH-induced changes in CBF are often considered unreliable due to variations in subject adherence to the paradigm, it offers a practical alternative for clinical studies since, (1) it is more straightforward to implement (no need for a face mask for exogenous administration of CO2, (2) it can produce increases in arterial blood CO2 levels comparable to those achieved with gas-inhalation techniques, 21 and (3) it is, when properly administered, a better match to nocturnal spontaneous apneas as the stimulus is both hypercapnic and hypoxic, which is not the case for exogenously supplied CO2. A standardized volitional apnea protocol was used in this study via visual and acoustic cueing to ensure subject compliance.
The radial PC-MRI sequence was applied to the SSS at mid-skull level. To obtain tCBF, SSSBF was upscaled by application of a calibration factor (SSSBF:tCBF)cal and then normalized by brain mass, derived from brain volume. The mean calibration factors were consistent with those reported by Rodgers et al., 27 showing no significant difference between groups (0.53 in OSA vs. 0.54 in NSA). Further, brain mass was not significantly different between groups (1215.8 in OSA vs. 1256.0 g in NSA). These results indicate that the two parameters could not affect tCBF calculation and bias the results.
Neither regional nor global CVR were correlated with AHI. The observed BHI may reflect the cerebrovascular autoregulation in response to chronic intermittent nocturnal hypoxemia and hypercapnia, and therefore shows no association with OSA severity.
The lack of monitoring arterial blood CO2 during the course of the BOLD acquisition may be perceived as a limitation of this study. However, there is broad evidence of a strong correlation between global BOLD signal intensity changes during BH and CO2 inhalation, supporting the notion that a BH stimulus elicits a response analogous to an exogenously administered hypercapnia challenge. 21 Bright and Murphy 39 found a robust and reproducible end-tidal CO2 response for BHs as short as 10 s, with the magnitude of the induced hypercapnia scaling with BH duration.
A minor limitation is that T2-weighted FLAIR images were not acquired as part of our protocol, which precluded evaluation of possible cerebral lesions. However, in the study cohort, no obvious lesions were found from the T1-weighted MPRAGE images. Yet in future functional OSA imaging studies, inclusion of T2-FLAIR would be helpful as a means to evaluate possible microangiopathy and their correlation with CVR findings.
Finally, our current study reported findings with both male and female subjects combined. It is certainly conceivable that cerebrovascular autoregulation may be gender-dependent to some extent. When partitioning the study cohort by gender, OSA and NSA were not significantly different within each subgroup. This was the case for both measures of BHI (change in tCBF or SSS flow velocity): tCBF: 70 versus 57 mL/min2/100 g, P = 0.056 in males; 92 versus 64 mL/min2/100 g, P = 0.057 in females; SSS flow velocity: 0.43 versus 0.36 cm/s2, P = 0.081 in males; 0.55 versus 0.36 cm/s2, P = 0.043 in females. For BOLD-based CVR, female OSA did not differ from their reference NSA group (0.16 vs. 0.14%/s, P = 0.687 when averaged across the whole brain; 0.18 vs. 0.16%/s, P = 0.598 in GM; 0.12 vs. 0.10%/s, P = 0.278 in WM). On the other hand, male OSA subjects had significantly different BOLD-based CVR relative to their NSA peers (0.22 vs. 0.15%/s, P = 0.002 in whole brain, 0.25 vs. 0.18%/s, P = 0.004 in GM), but there was no significant difference in WM after correcting for multiple comparisons (0.15 vs. 0.11%/s, P = 0.017 in GM). The findings indicate that (a) for either gender, all CVR indices showed the same trend of OSA > NSA as those analyzed with both genders combined, and (b) the statistical significance for some of the CVR indices vanished, particularly for female subjects. Since our cohort contained fewer female (n = 14) than male (n = 23) OSA patients, the loss of statistical significance is more pronounced in females, while all showed the same trend of OSA > NSA. The present study was not intended to study gender differences in the mechanism of cerebrovascular autoregulation, and therefore a larger number of study subjects would have to be enrolled to achieve adequate power.
Conclusion
A measure of CVR – here referred to as BHI – in individuals with OSA has been found to be elevated relative to matched non-OSA reference subjects. This distinction, whose underlying physiology is not currently understood, was observed with two different MRI based methods; the response to a BH challenge evaluated regionally from the temporal change in the BOLD signal, and when measured globally from the change in CBF rate or velocity.
Footnotes
Funding
The author(s) disclosed receipt of the following financial support for the research, authorship, and/or publication of this article: This work was supported by the National Institutes of Health (R01 HL122754, T32 EB020087); and in part by the Institute for Translational Medicine and Therapeutics' Transdisciplinary Program in Translational Medicine and Therapeutics (UL1TR001878).
Declaration of conflicting interests
The author(s) declared no potential conflicts of interest with respect to the research, authorship, and/or publication of this article.
Authors' contributions
AE Rodríguez-Soto and P-H Wu performed the MRI procedures, optimized processing of the images and analyzed the data; P-H Wu drafted the manuscript; Zachary B Rodgers designed the imaging protocol; EK Englund participated in image data collection and processing; A Wiemken recruited study subjects; MC Langham, JA Detre and R Schwab reviewed and edited the manuscript; Wensheng Guo provided advice on statistical analysis; FW Wehrli designed the overall study and study methods, and reviewed and edited the manuscript.