
Abstract
The 18 kDa translocator protein (TSPO) is the main molecular target to image neuroinflammation by positron emission tomography (PET). However, TSPO-PET quantification is complex and none of the kinetic modelling approaches has been validated using a voxel-by-voxel comparison of TSPO-PET data with the actual TSPO levels of expression. Here, we present a single case study of binary classification of in vivo PET data to evaluate the statistical performance of different TSPO-PET quantification methods. To that end, we induced a localized and adjustable increase of TSPO levels in a non-human primate brain through a viral-vector strategy. We then performed a voxel-wise comparison of the different TSPO-PET quantification approaches providing parametric [18F]-DPA-714 PET images, with co-registered in vitro three-dimensional TSPO immunohistochemistry (3D-IHC) data. A data matrix was extracted from each brain hemisphere, containing the TSPO-IHC and TSPO-PET data for each voxel position. Each voxel was then classified as false or true, positive or negative after comparison of the TSPO-PET measure to the reference 3D-IHC method. Finally, receiver operating characteristic curves (ROC) were calculated for each TSPO-PET quantification method. Our results show that standard uptake value ratios using cerebellum as a reference region (SUVCBL) has the most optimal ROC score amongst all non-invasive approaches.
Keywords
Introduction
Positron emission tomography (PET) imaging is a promising tool to monitor neuroinflammation in many neurological disorders. The in vivo biomarker of activated microglia and astrocytes is the overexpression of the 18 kDa translocator protein (TSPO), which is still today’s most important molecular target to image neuroinflammation by PET. While [11C]-PK11195 has long been considered as the gold standard TSPO-radioligand, the need for radiotracers with a higher affinity and/or lower non-specific binding has led to the development of more than 50 second generation candidate TSPO-ligands. 1 Amongst those, 18 F-labeled N,N-diethyl-2-(2-[4-(2-fluoroethoxy)phenyl]-5,7-dimethylpyrazolo[1,5-a]pyrimidine-3-yl)acetamide, [18F]-DPA-714, displays a high specific binding, 2 a good bioavailability in both animal models and humans, 3 and has been used in different clinical applications.4–7
Because of the ubiquitous TSPO expression in the healthy brain, there is no reference region and thus absolute quantification of TSPO-PET data requires a metabolite-corrected arterial input function (mcAIF). Uptake and binding of [18F]-DPA-714 have been measured by the total volume of distribution, VT, estimated in the non-human primate (NHP) brain by a one-tissue-compartment model (1TCM), 8 and in humans by a two-tissue-compartment model (2TCM).4,5 Recent studies demonstrated that a more complex compartment model, taking into account endothelial binding, is required to quantify TSPO binding more precisely.9–11 Independent from compartments, VT has also been estimated by the more robust graphical method of Logan in both NHP and humans,4,8 and by spectral analysis in humans. 12
Semi-quantitative approaches that measure SUV 13 or SUV-ratio, 14 and other quantification methods using a reference region approach 12 have additionally been proposed to avoid arterial blood sampling. These non-invasive methods provide measures that positively correlate with VT. 15 However, to the best of our best knowledge, it has never been evaluated which of these approaches is statistically most relevant – in terms of specificity, sensitivity, accuracy and positive predictive value (PPV) 16 – to detect changes in TSPO expression. The gold-standard tools to validate the specific binding of a radioligand are within-subject comparison of in vivo imaging data with in vitro immunohistochemistry (IHC) and/or ex vivo autoradiography.17–19
We previously developed a method to non-linearly register three-dimensional (3D) reconstructed in vitro histological slices to in vivo imaging data,20,21 which we used to assess the binding specificity of [18F]-DPA-714.8,22 The present study is a single case report that uses this tool to define whether BPND issued from three different reference-based quantification methods, SUV or SUVCBL is the most accurate in comparison to VT to detect changes in TSPO expression through [18F]-DPA-714 binding. To explore this, we used a unique animal model of controlled and localized TSPO overexpression 23 in combination with a pipeline that allowed for binary classification of in vivo PET data using the in vitro TSPO-IHC density map as the reference method. This approach allowed methodological validation of TSPO PET analysis, based on statistical performances and on biological evidence.
Methods
Animal model
Animal housing
One adult male cynomolgus monkey (Macaca fascicularis, 5 kg) was used in this study in compliance with European legislation (EU Directive 2010/63/EU). The animal facility was approved by French regulations (authorization no. D 92-032-02) and complied with Standards for Humane Care and Use of Laboratory Animals of the Office of Laboratory Animal Welfare (OLAW, no. A5826-01), and with the ARRIVE guidelines. 24
Anesthesia and monitoring
The animal was anesthetized for all experimental manipulations (surgery and imaging) using a mixture of ketamine:xylazine (10:1 mg/kg) for induction, followed by intravenous infusion of propofol (1% Rapinovet; 0.05 to 0.25 mg/kg/min) in case the experimental handling lasted more than 30 min. Body temperature was kept constant at 37℃ using feed-back coupled heating blanket, and the respiration rate, pO2, pCO2 and cardiac rhythm were continuously monitored.
Surgery
Stereotactic injections of the lentiviral vector that encodes for the human CNTF gene (hCNTF) under the control of the mouse phosphoglycerate kinase 1 promoter, as described previously,
25
were performed at +4 mm, 0 mm, −2 mm and −5 mm of the anterior commissure, based on MRI-derived coordinates. A KDS injection micropump connected to a Hamilton syringe and a 26-gauge needle were used to perform two injections in the caudate and three injections in the putamen, each of 10 µl deposit/site. The high titer (134 ng) was injected in the left caudate-putamen complex and the low titer (64 ng) in the contralateral caudate-putamen complex (Figure 1).
Schematic representation of the lenti-CNTF construct and its stereotactic injection protocol in the NHP brain: the low titer dose (LD) was injected in the right caudate-putamen complex, the high titer dose (HD) was injected in the left caudate-putamen complex.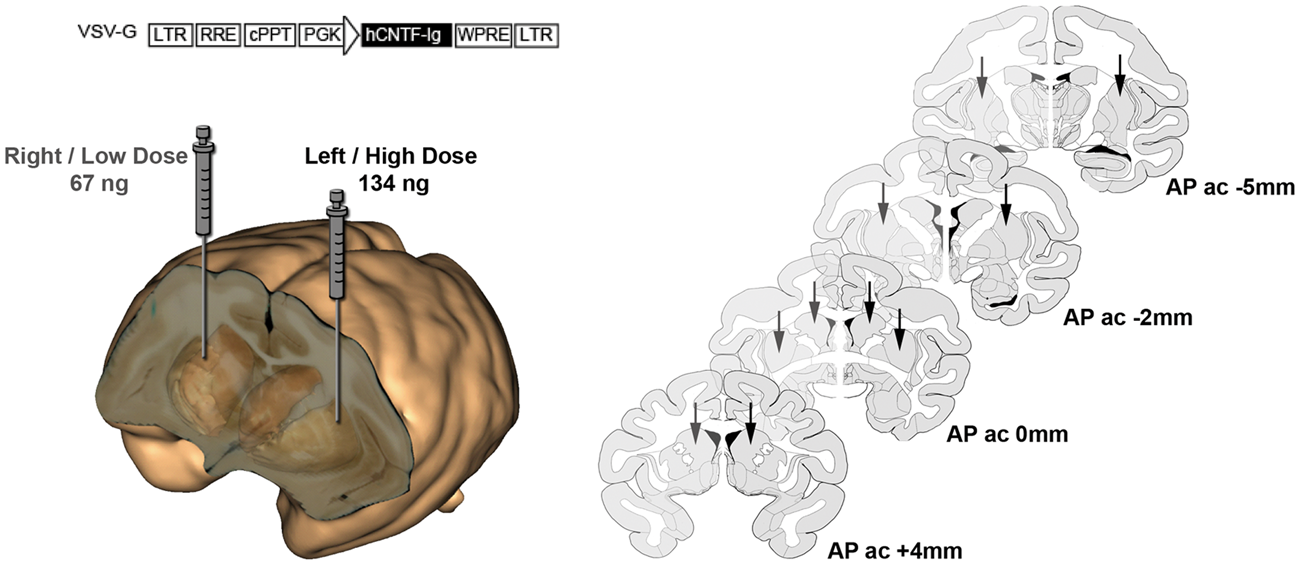
Magnetic resonance imaging
MRI was performed on a 7 Tesla horizontal system (Varian-Agilent Technologies, USA), equipped with a gradient coil reaching 100 mT/m (300 µs rise time) and a circular radiofrequency 1H coil (12 cm inner diameter) at baseline to define the stereotactic coordinates, and at six months post-injection (6MPI) to obtain high-resolution whole-brain images. To that end, the animal was placed in the magnet in a sphinx position, fixed by mouth and ear bars using a stereotactic MRI-compatible frame (M2E, France). High resolution whole-brain T2-weighted images were acquired using a fast spin-echo sequence (450 × 450 × 800 µm3).
Radiochemistry and PET
[18F]-DPA-714 radiosynthesis was performed as described previously 26 ; 90-min PET scans were acquired on the FOCUS 220 PET scanner (Siemens) at baseline and 6MPI. 8 Briefly, attenuation correction factors were measured prior to radiotracer injection using an external 57Co source. Data acquisition started with the intravenous bolus injection of [18F]-DPA-714 (165 MBq). Image data were acquired in 2D-mode using a time coincidence window of 6 ns and energy discrimination levels between 350 and 650 keV. Finally, list-mode data were sorted into 24 frames (15 s × 4, 30 s × 4, 60 s × 2, 120 s × 5, 300 s × 3, 600 s × 6). Emission sinograms were normalized, corrected for attenuation and radioactivity decay, using Fourier rebinning (FORE) and ordered subset expectation maximization (OSEM) 2D (16 subsets and 4 iterations) for image reconstruction.
Plasma input function and metabolites
Blood samples were collected from the femoral artery to establish the time-course of total radioactivity concentration in the arterial plasma over the entire 90 min acquisition period. In parallel, we measured the parental fraction from the plasma samples as previously described. 3 Briefly, in total, we collected 23 1 mL blood samples, of which 16 during the first 5 min followed by 7 samples every 10 min. Plasma was separated from whole blood by centrifugation and 50 µL plasma samples were counted with a PET cross-calibrated gamma counter (WIZARD, 2 PerkinElmer, FR). All data were corrected for radioactive decay from the injection time. Large samples (2–3 mL) were collected at 5, 10, 20, 30, 40, 50, 70 and 90 min to separate [18F]DPA-714 metabolites from the parent compound by radiochromatography as previously described. 3 Unchanged [18F]DPA-714 fraction was fitted by a three-exponential decay equation using a least squares method (PMOD).
Immunohistochemistry
Shortly after PET imaging, the brain was sectioned on a freezing microtome (40 µm slice thickness), and series of 640 µm-spaced sections were collected for further histological processing. Sections were immunostained for NeuN, vimentin and TSPO according to the procedures described below. Vimentine was chosen as astrocytic marker because it allows better 3D reconstruction and segmentation, due to extremely low background binding. Sections were first incubated in 0.3% H2O2 for 20 min and in phosphate-buffered saline (PBS) containing 4.5% normal serum or 0.2% gelatin and 0.2% Triton-X100 for 30 min. Sections were then incubated for 48 h in PBS containing 0.2% Triton-X100, 3% normal serum or 0.2% gelatin and one of the following antibodies: mouse anti-NeuN, dilution 1:5000 (Millipore, Billerica, MA), mouse anti-vimentin (later referred to as VIM-IHC), dilution 1:3000 (Calbiochem), rabbit anti-Iba1, dilution 1:1000 (Wako, Osaka, Japan), goat anti-TSPO (later referred to as TSPO-IHC), dilution 1:500 (Acris, Herford, Germany). Sections were then processed using the avidin-biotin peroxidase method (for TSPO staining, a tyramine amplification was necessary). The immunoreaction was visualized using 3,3′-diaminobenzidine tetrahydrochloride (DAB) as the chromogen. The sections were mounted onto slides, dehydrated, cleared in xylene, and coverslipped. The sections for double immunofluorescence labelling were incubated in PBS containing 0.2% gelatin and 0.2% Triton-X100 and the following antibodies: goat anti-TSPO, dilution 1:100, rabbit anti-Iba1, dilution 1:200 or mouse anti-vimentin, dilution 1:600. Sections were either incubated with a goat biotinylated antibody followed by incubation with streptavidine coupled with CY3 or with a mouse or a rabbit secondary antibody coupled with Alexa 488 for 1 h. After immunostaining, serial brain sections were mounted on glass slides and analyzed using a Leica SP8 confocal microscope (Leica Microsystems, Wetzlar, Germany).
Data processing
All image-processing operations were performed with in-house tools integrated to Brainvisa (http://www.brainvisa.info) and PMOD® 3.8 modelling software (PMOD Technologies Ltd, Zürich, Switzerland).
MRI
MRI intensity was homogenized using a bias correction tool 27 to enable multimodal co-registration.
PET
Parametric images of the total distribution volume (VT, units [ml/cm−3]) were obtained by the graphical method of Logan using a mcAIF (further referred to as LoganmcAIF). Six parametric images of non-displaceable binding potential (BPND) were generated with SRTM, 28 MRTM0, 27 and Logan 29 using the cerebellum as a pseudo-reference region, or using the supervised cluster analysis (SVCA) to extract a reference tissue curve of the animal at baseline and 6MPI. 30 This method assumes each time activity curve (TAC) to be a linear sum of four predefined classes associated with blood, non-specific grey matter, white matter and grey matter with specific binding. To build the classes, we used dynamic PET scans and MRI of five control NHPs acquired in the same conditions and with identical image reconstruction protocols. All frames of the PET images were normalized by the mean and standard deviation of the signal in the brain. A MRI scan of each animal was registered onto the corresponding PET space and used to define the grey matter, white matter and thalamus regions of each monkey. Classes were defined from these regions as an average over the five monkeys. An image-derived blood curve was created for each of the five monkeys by averaging the hottest 10 voxels showing highest uptake during the early acquisition, and used to create the blood class. Finally, the PET images of each monkey of this study were decomposed over the four classes, and the weight map of the non-specific grey matter was used to extract the reference curve. Finally, SUV images were obtained after normalization of summed PET images between 30′ and 90′ or 60′ and 90′ for injected dose and body weight. SUV ratio images (SUVCBL) were created after normalization of SUV images for cerebellar uptake at corresponding acquisition time windows.
Histology digitization, 3D reconstruction and segmentation
Three-dimensional IHC volumes were reconstructed with a procedure that we previously described.20,21,31 Briefly, during brain sectioning, photographs of the block-face were captured every 8th section using a camera (EOS5, Canon, Tokyo, Japan). Photographs were recorded in RGB colors and saved in the jpg format with an in-plane resolution of 57 × 57 µm2. Immuno-stained brain sections were digitized in bright-field mode with a slide scanner at a magnification of × 2.5 (Axio Scan Z.1, Carl Zeiss Microscopy GmbH, Jena, Germany), stored in Zeiss’ czi-format (in plane resolution of 1.76 µm/pixel), subsequently resized (10%, in plane resolution of 17.6 µm/pixel) and finally exported as jpg files.
The block-face volume created by 3D-stacking of the photographs was resampled to a resolution of 83 × 83 × 640 µm3 using median subsampling and served as a reference for the reconstruction of the histological volumes. In order to compensate for block-face lighting and histological staining inhomogeneity, inter-slice intensity normalization was performed on block-face and histology volumes by equalizing the mean and variance of RGB channels in all sections. To ease the registration of IHC sections with the block-face volume, whole brain and hemispheric masks were obtained from IHC sections and/or block-face volume through automatic segmentation using the K-means algorithm. Each section was registered towards its corresponding block-face photograph by piece-wise affine transform estimation with the block-matching algorithm. 29 The robustness of the process was insured by progressively freeing the transformation parameters (whole-brain rigid, hemisphere-wise rigid, hemisphere-wise affine).
Due to high specificity of the antibodies, TSPO-IHC-positive staining was readily segmented using the K-means algorithm performing an 8-class K-means and keeping two classes. Artefacts were automatically filtered by an extraction of connected components (first-order connectivity; 100 pixels/vimentin 100 pixels/TSPO); residual artefacts, resulting from e.g. folds in the histological slices, were manually removed. Segmentation and artefact correction of TSPO-IHC staining resulted in a binary TSPO-IHC map, corresponding to presence (1) or absence of TSPO-IHC (0).
Multimodal registration
In order to avoid bias caused by resampling PET data, all other modalities were registered towards the PET space. A rigid transformation (trm1, Figure 2) was computed by maximization of mutual information to co-register MRI (450 ×450 × 800 µm3) and PET volumes (634 × 634 ×796 µm3). A combination of linear (rigid-affine) and non-linear transformations
32
(trm2, Figure 2) was computed to register the block-face volume to the MRI after median sub-sampling to a resolution of 342 × 342 × 320 µm3. Successive application of trm2 and trm1 (Figure 2) to the histological volumes (VIM- and TSPO-IHC), allowed final multimodal co-registration of the immunohistochemical volumes to the PET referential.
Schematic representation of the multi-modal in vivo to in vitro coregistration and segmentation of the TSPO-IHC density data. Briefly, photographs and IHC were put in the same space by section to section bi-affine registration. 3D-stacking of the photographs (Block Photo) resulted in a volume that served as a reference for the 3D-reconstruction of the histological volumes. In parallel, TSPO-IHC was segmented by k-means segmentation and the binary maps were downsampled to the resolution of the PET images. Raw TSPO-PET data were analyzed through different quantification methods and coregistered to MR images by rigid registration. Then, the in vitro TSPO-IHC volume was coregistered to the in vivo TSPO-PET/MR volume using linear and non-linear registration methods.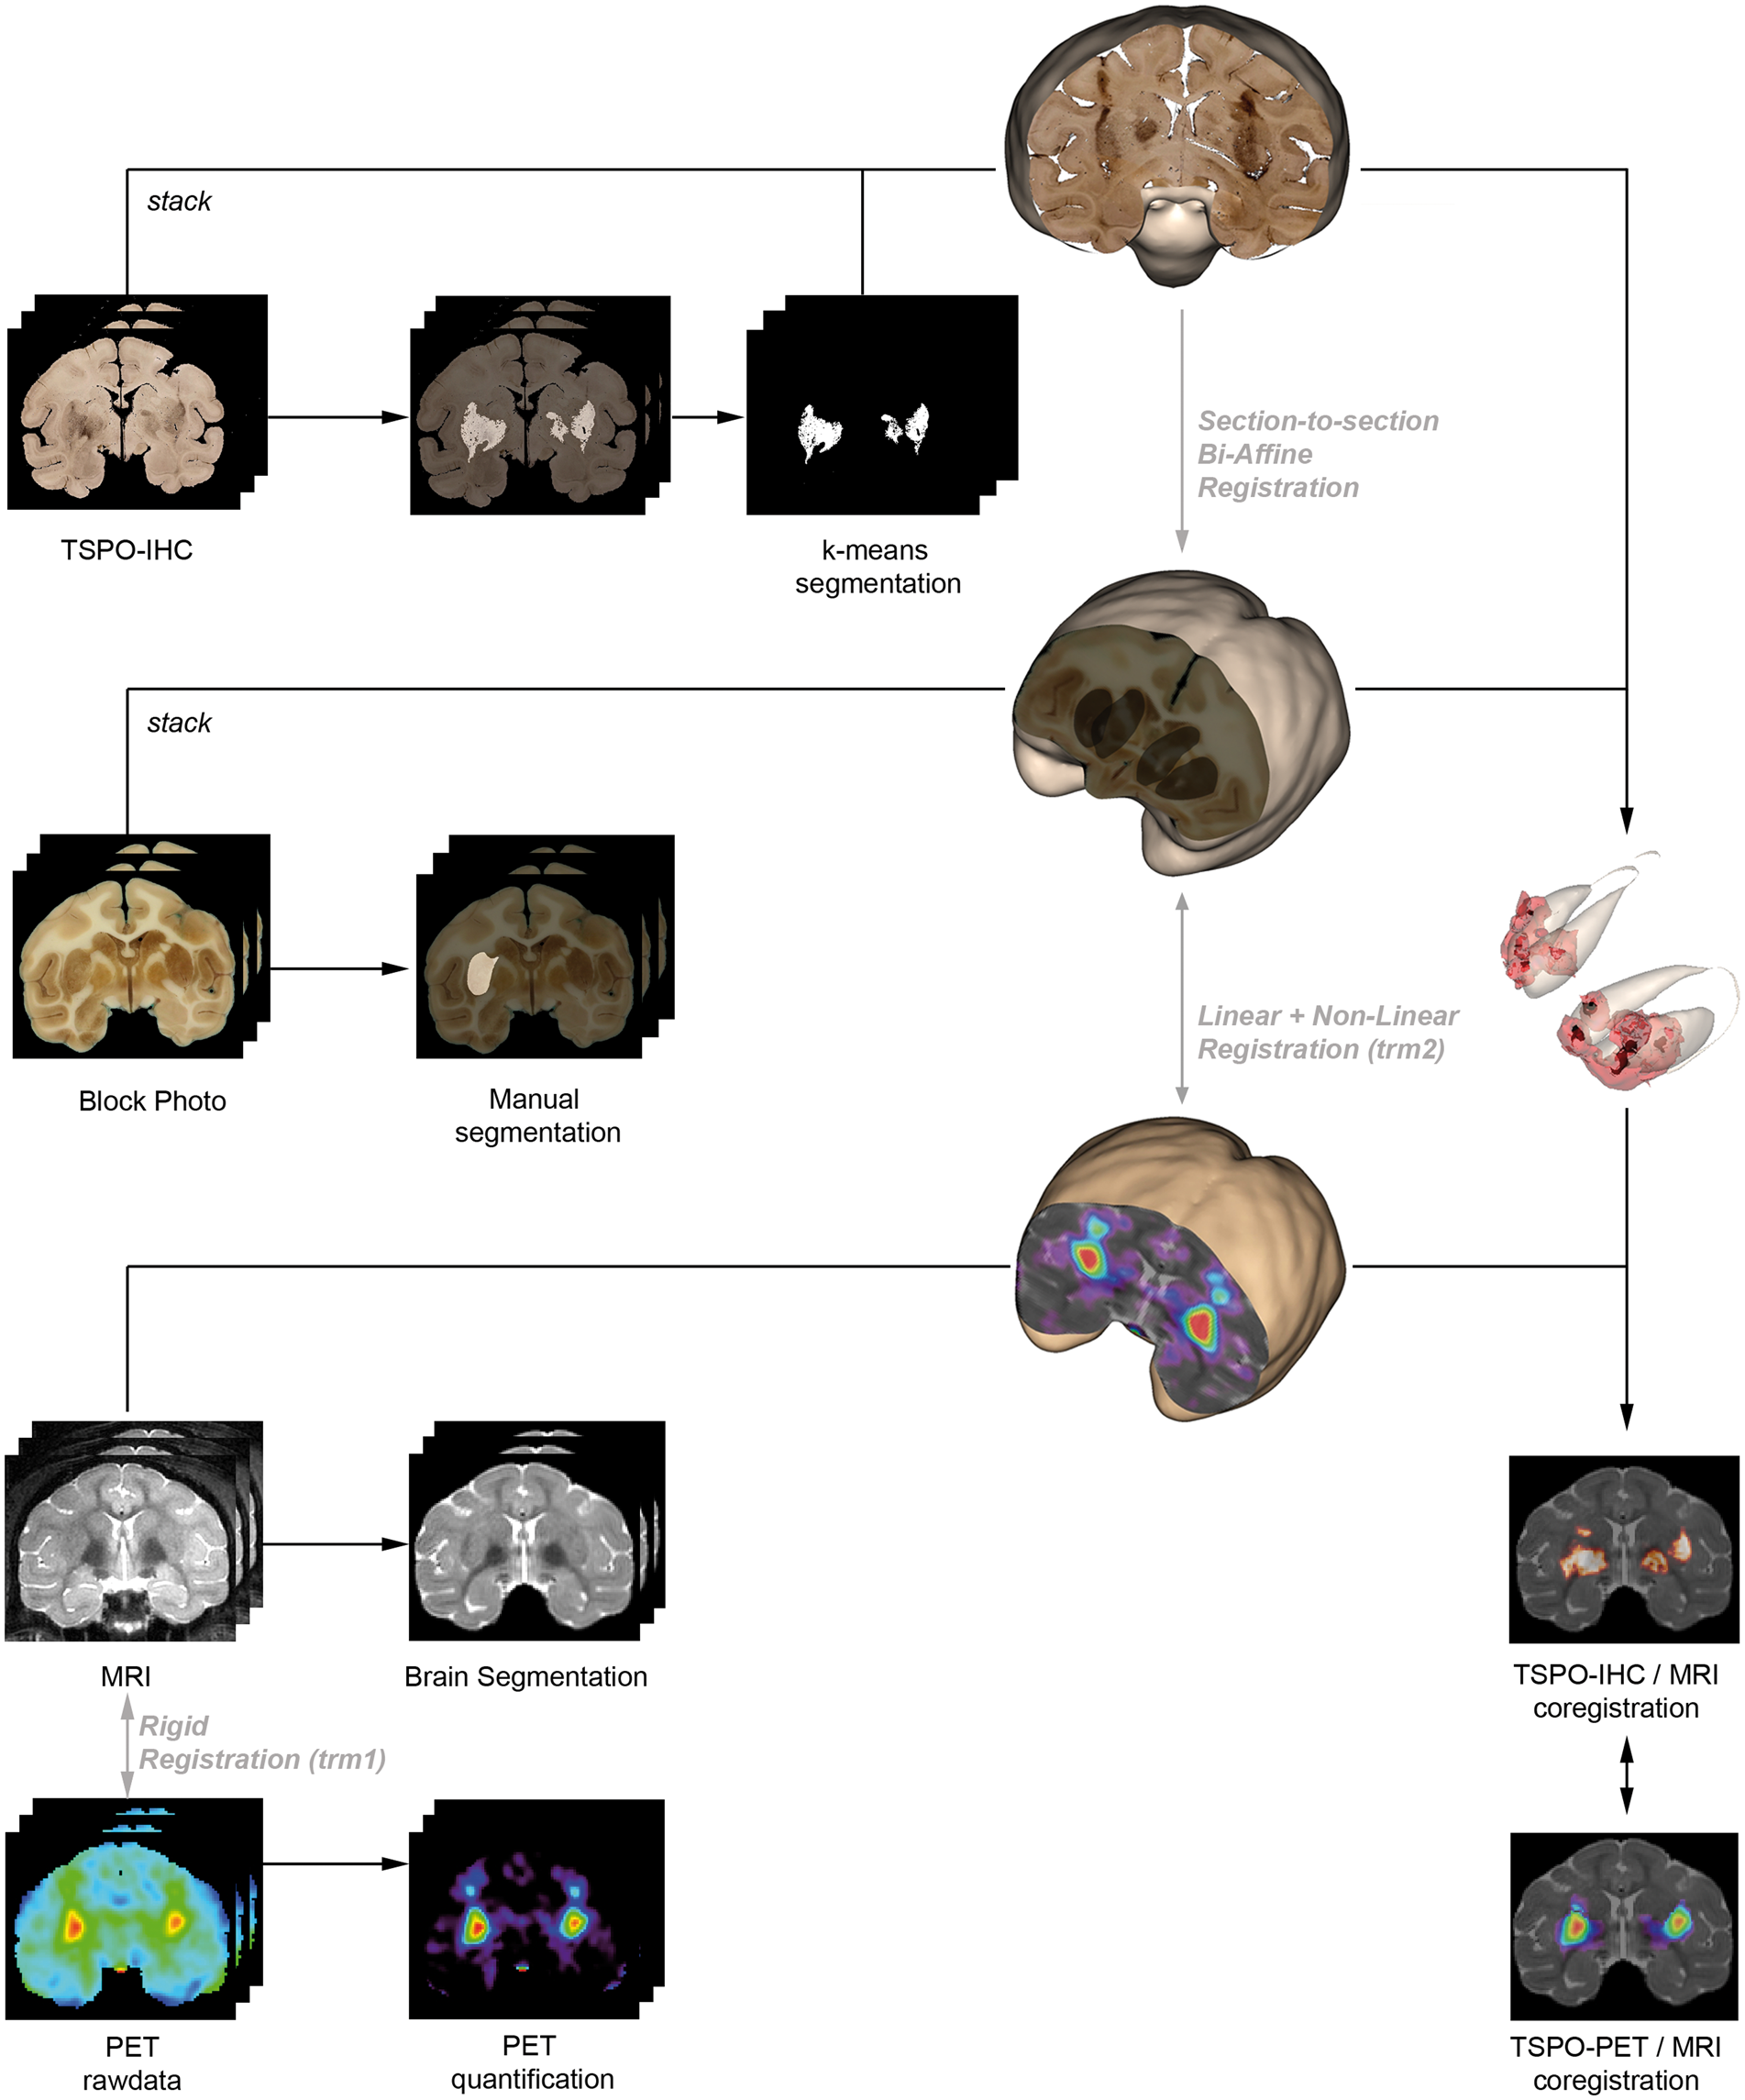
We down sampled the binary TSPO-IHC map to the same resolution as the PET images, to generate TSPO-IHC density maps, using conservative mapping. Briefly, the relative contribution of a high-resolution TSPO-IHC voxel was dispersed over the different low-resolution voxels it overlapped with. Therefore, each voxel of the TSPO-IHC density maps has a relative value between [0–1], and the sum of all values in the TSPO-IHC density map is equal to the sum of all values in the high-resolution TSPO-IHC map.
TSPO-PET and -IHC density map post-processing
After in vitro to in vivo co-registration, left and right hemispheric masks were applied on the TSPO-PET-and -IHC data creating two data matrices containing voxel information of respectively the left and right hemisphere (Figure 3). Each matrix is constructed by n rows – corresponding to the number of voxels in the hemispheric brain mask – times five columns. These columns contain the X-Y-Z-coordinates of each voxel, followed by two absolute measures corresponding to: the TSPO-IHC density and 1 of the 11 TSPO-PET values, i.e. VT, six different measures of BPND (by SRTMCBL/SVCA, LoganCBL/SVCA or MRTM0CBL/SVCA), SUV ([30′–90′] or [60′–90′]), or SUVCBL ([30′–90′] or [60′–90′]) (Figure 3).
Schematic representation of binary classification of TSPO-PET voxels. First, a data matrix was extracted from each brain hemisphere containing for each voxel position the TSPO-IHC density value and one of the different TSPO-PET quantification values. After the application of a threshold to each individual voxel for each individual TSPO-PET quantification method, every single voxel was classified as false or true (F, T), positive or negative (P, N), considering TSPO-IHC density maps as the reference method. After binary classification, ROC analysis was performed. The area under the ROC curve (AUC) is an indication of the performance of the method (from 0.5, a value of chance level up to 1, the maximum performance). The maximal Youden Index (YI) is used to define the optimal threshold of the method.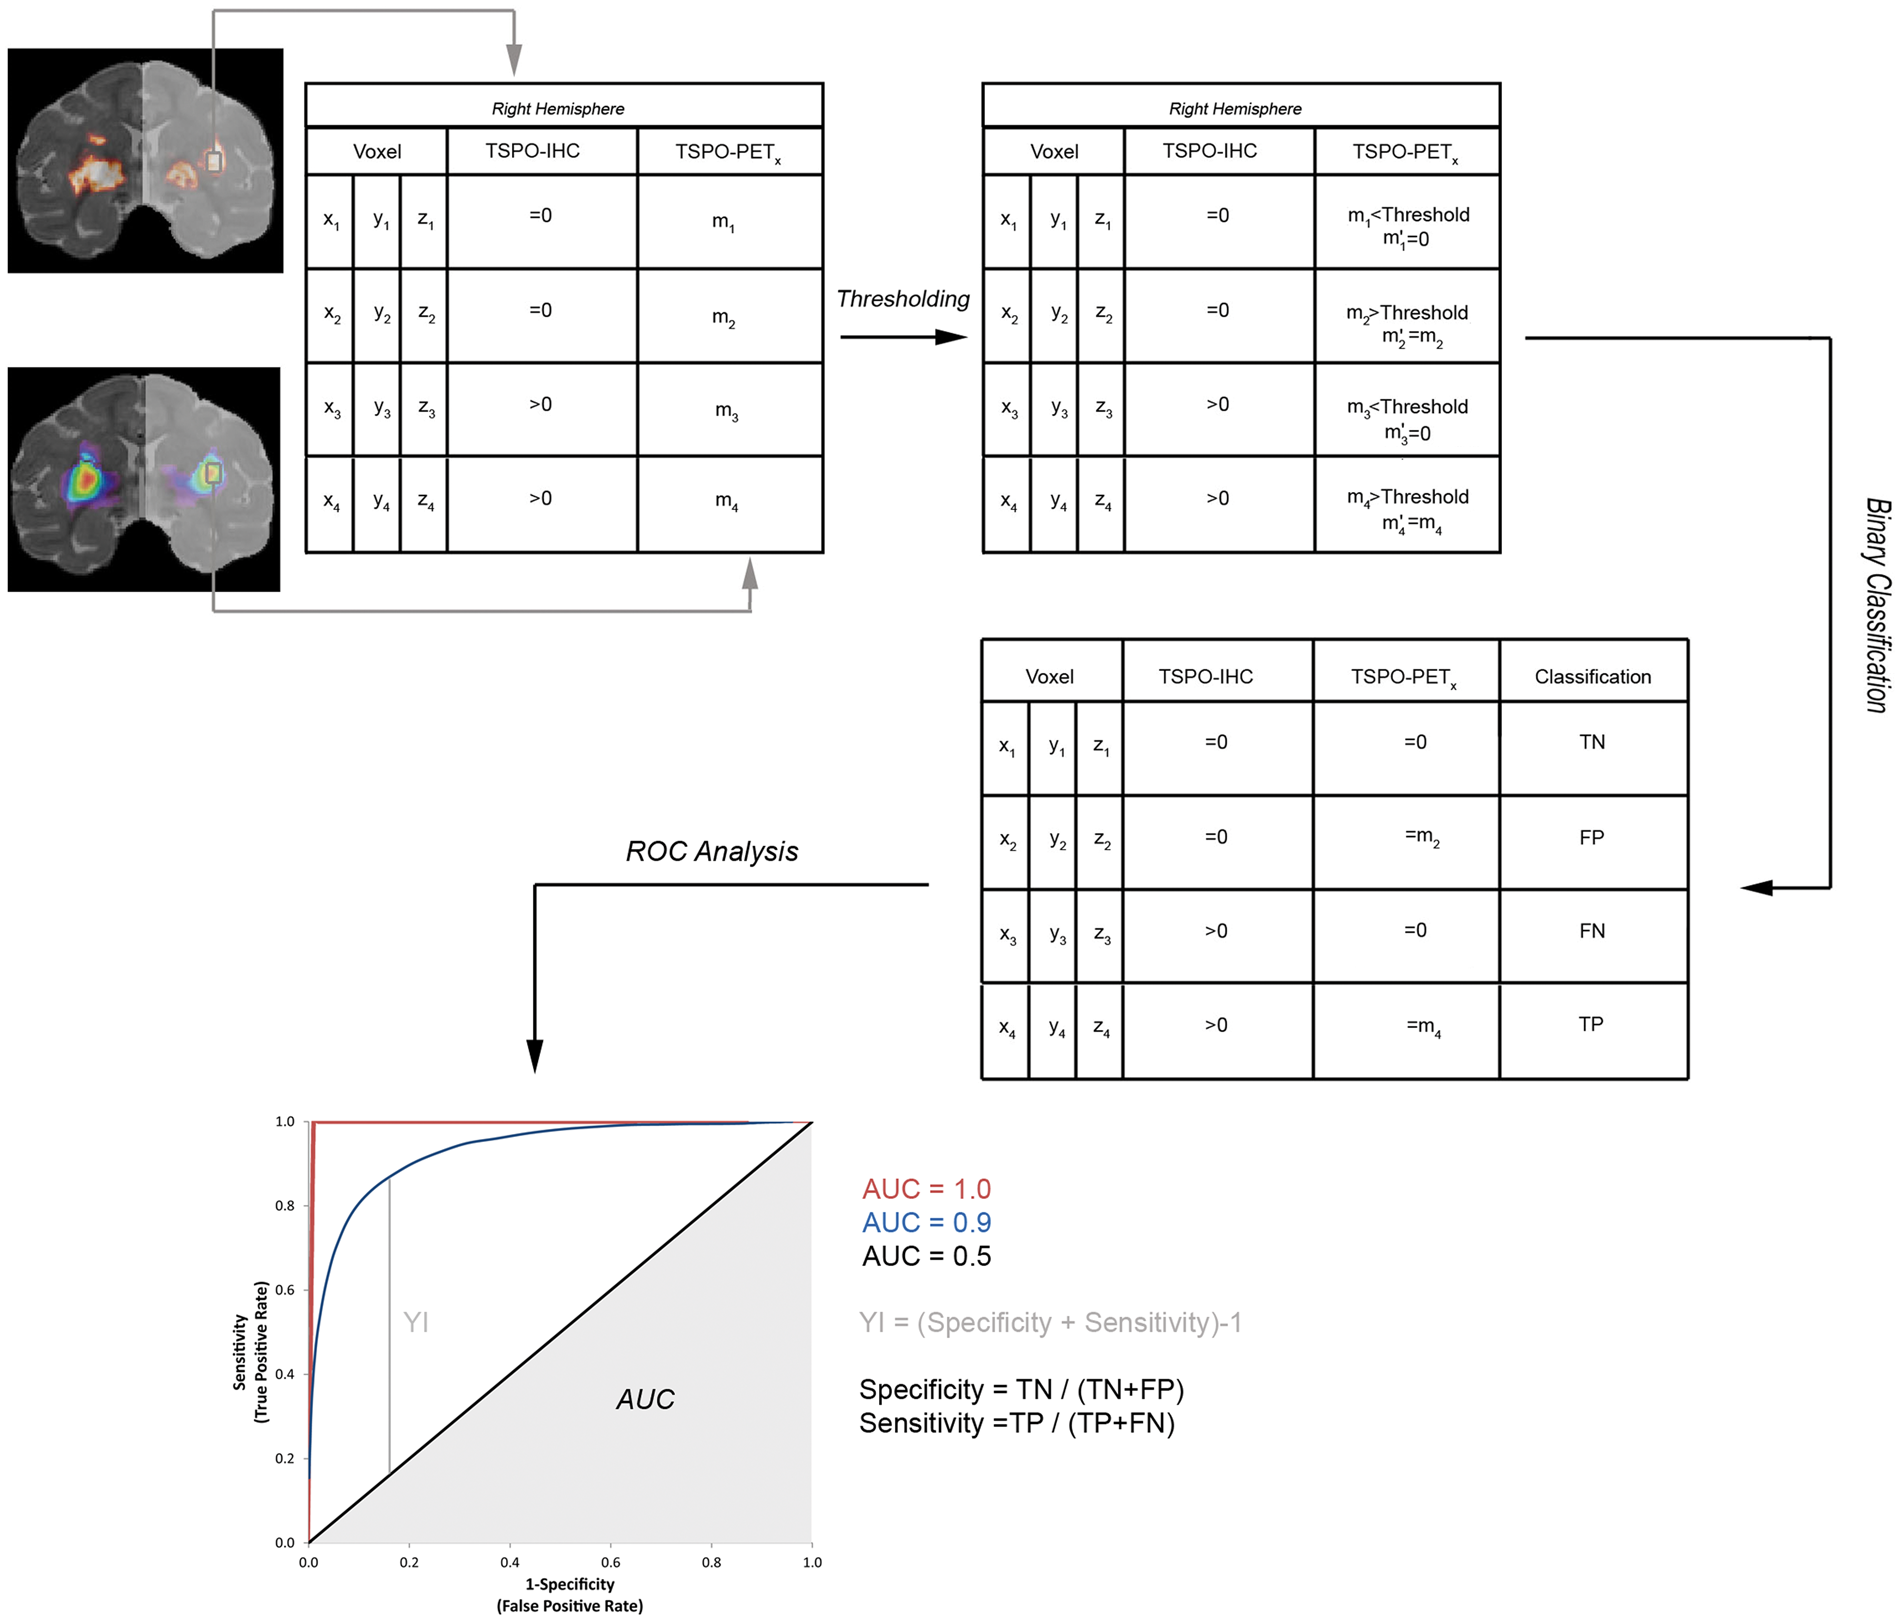
Thresholding and binary classification
To each TSPO-PET value, thresholding and subsequent binary classification was applied using a script generated in RStudio (Version 1.1.453). For VT, thresholding was performed between [7, 13] ml.cm−3 with an increment of 0.2; for BPND thresholding was performed between [0, 1] with an increment of 0.05; for SUV thresholding was performed between [0.8, 1.6] with an increment of 0.025. TSPO-PET voxels below the threshold were set at 0, and voxels above the threshold maintained the TSPO-PET value. Next, considering TSPO-IHC density data as ground truth, each voxel of the TSPO-PET was scored as true or false positives (TP or FP), or true or false negatives (TN or FN). A FP voxel is characterized by a TSPO-IHC density equal to 0 but a TSPO-PET value different from 0; a FN voxel is characterized by a TSPO-IHC density different from zero but a TSPO-PET value equal to 0; a TP voxel has a TSPO-IHC density and TSPO-PET value different from 0; and a TN has a TSPO-IHC density and TSPO-PET value equal to 0.
Statistics
For each TSPO-PET method, the number of TN, FN, TP and FP was counted. Sensitivity, PPV, specificity and accuracy were calculated as: “TP/(TP+FN),” “TP/(TP+FP),” “TN/(TN+FP),” “(TP+TN)/(TP+TN+FP+FN),” respectively. Receiver operating characteristic (ROC) curves were calculated by Rstudio using plotROC. Briefly, ROC curves plots sensitivity against “1-specificity” at various thresholds, and the area under the curve (AUC) was calculated. The Youden Index (YI) was calculated as the sum of sensitivity and specificity minus 1, and the optimal threshold of the TSPO-PET method was derived from the maximal YI. Figure 3 schematically summarizes these steps.
Results
Characterization of the CNTF-primate model
Bilateral injections of lenti-CNTF in the caudate and putamen induced a local increase in TSPO expression (Figure 4(a) and (b)). The brain areas immunopositive for TSPO also displayed an increased vimentin expression, a molecular marker of astrocytes (Figure 4(d) and (e)). Higher magnifications show that TSPO was indeed increased in activated astrocytes (Figure 4(g) to (i)) but not in microglia (Figure 4(j) to (i)). 3D rendering of the immunostainings shows a major overlap between VIM-IHC and TSPO-IHC (Figure 4(c) and (f)). Finally, injection of the lenti-CNTF at the high-dose resulted in a TSPO-positive volume that was 65% larger than the TSPO-positive volume in the contralateral side after injection of a low-dose titer (847 mm3 vs. 513 mm3).
Immunohistochemical analysis of the lenti-CNTF NHP model. Immunostainings for TSPO (a, b) and VIM (d, e) were rendered three-dimensional, which allowed to appreciate a major overlap between VIM-IHC (f) and TSPO-IHC (c). Higher magnifications confirmed that TSPO-IHC was only detected in activated astrocytes (g, h, i), and not in the microglia (j, k, l).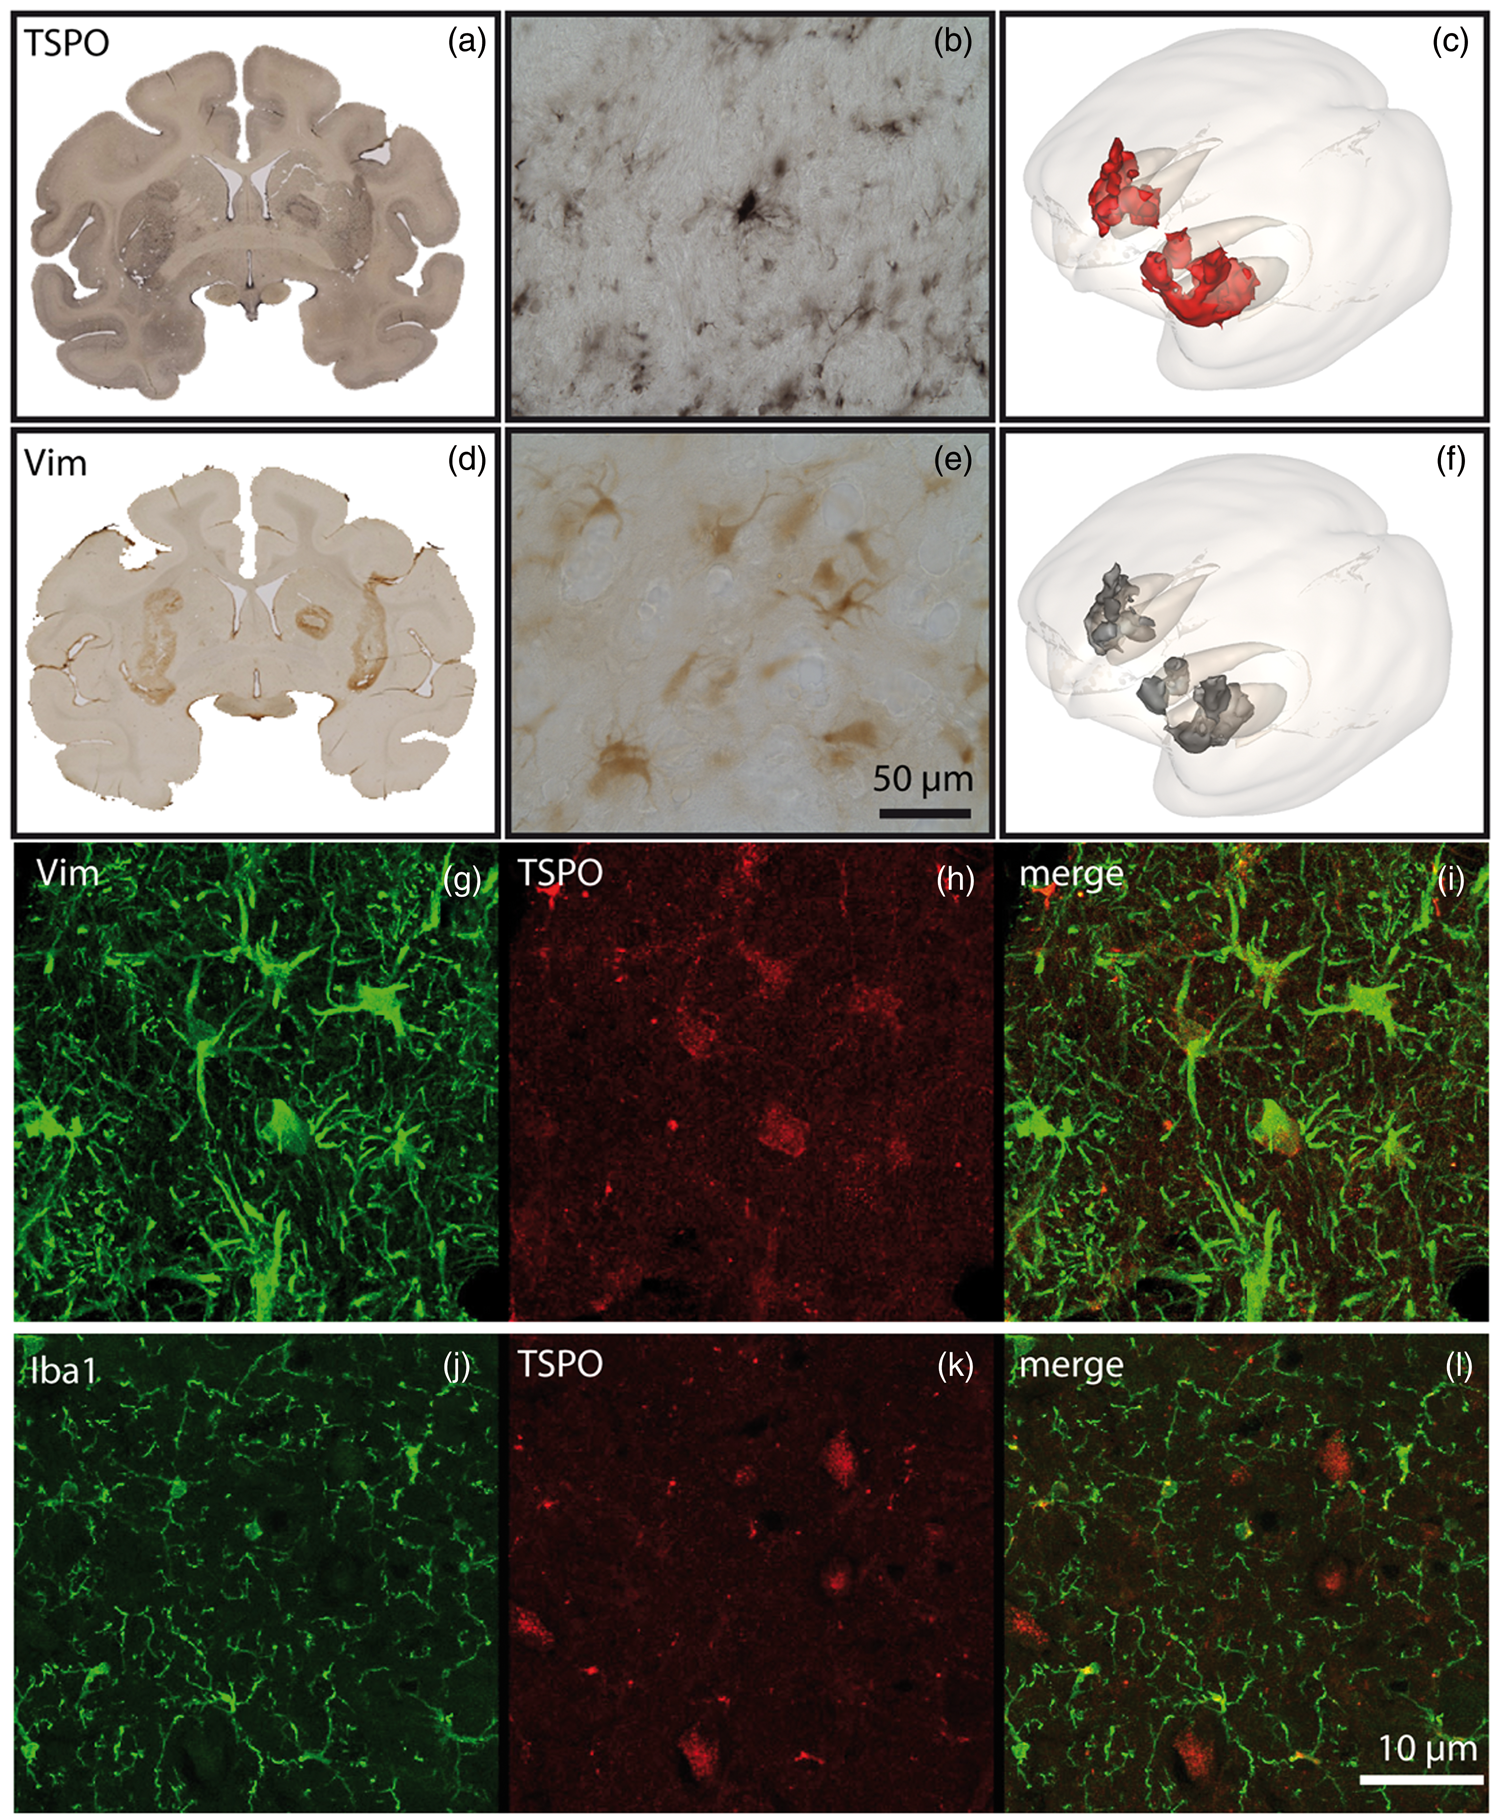
TSPO-PET quantification and binary classification
TSPO-PET images
At baseline, the BPND parametric images show [18F]-DPA-714 binding along the sulci and ventricles, in particular if BPND was issued from SRTM; independently on how the reference curve was obtained. The VT, SUV and SUVCBL images show a homogenous whole-brain uptake with limited regional differences (Figures 5 and 6, baseline). Table S1 lists the average TSPO-PET values in the entire brain and in the caudate-putamen complex at BL and 6MPI. At 6MPI, all quantification methods reveal higher [18F]-DPA-714 uptake in the caudate putamen complex (Figures 5 and 6, 6MPI), but the relative increase differs amongst quantification methods (Table S1). The higher vector dose resulted in increased TSPO-PET volume compared to low dose (Figures 5 and 6, 6MPI); however, the absolute TSPO-PET values were not different between the two doses (Table S1).
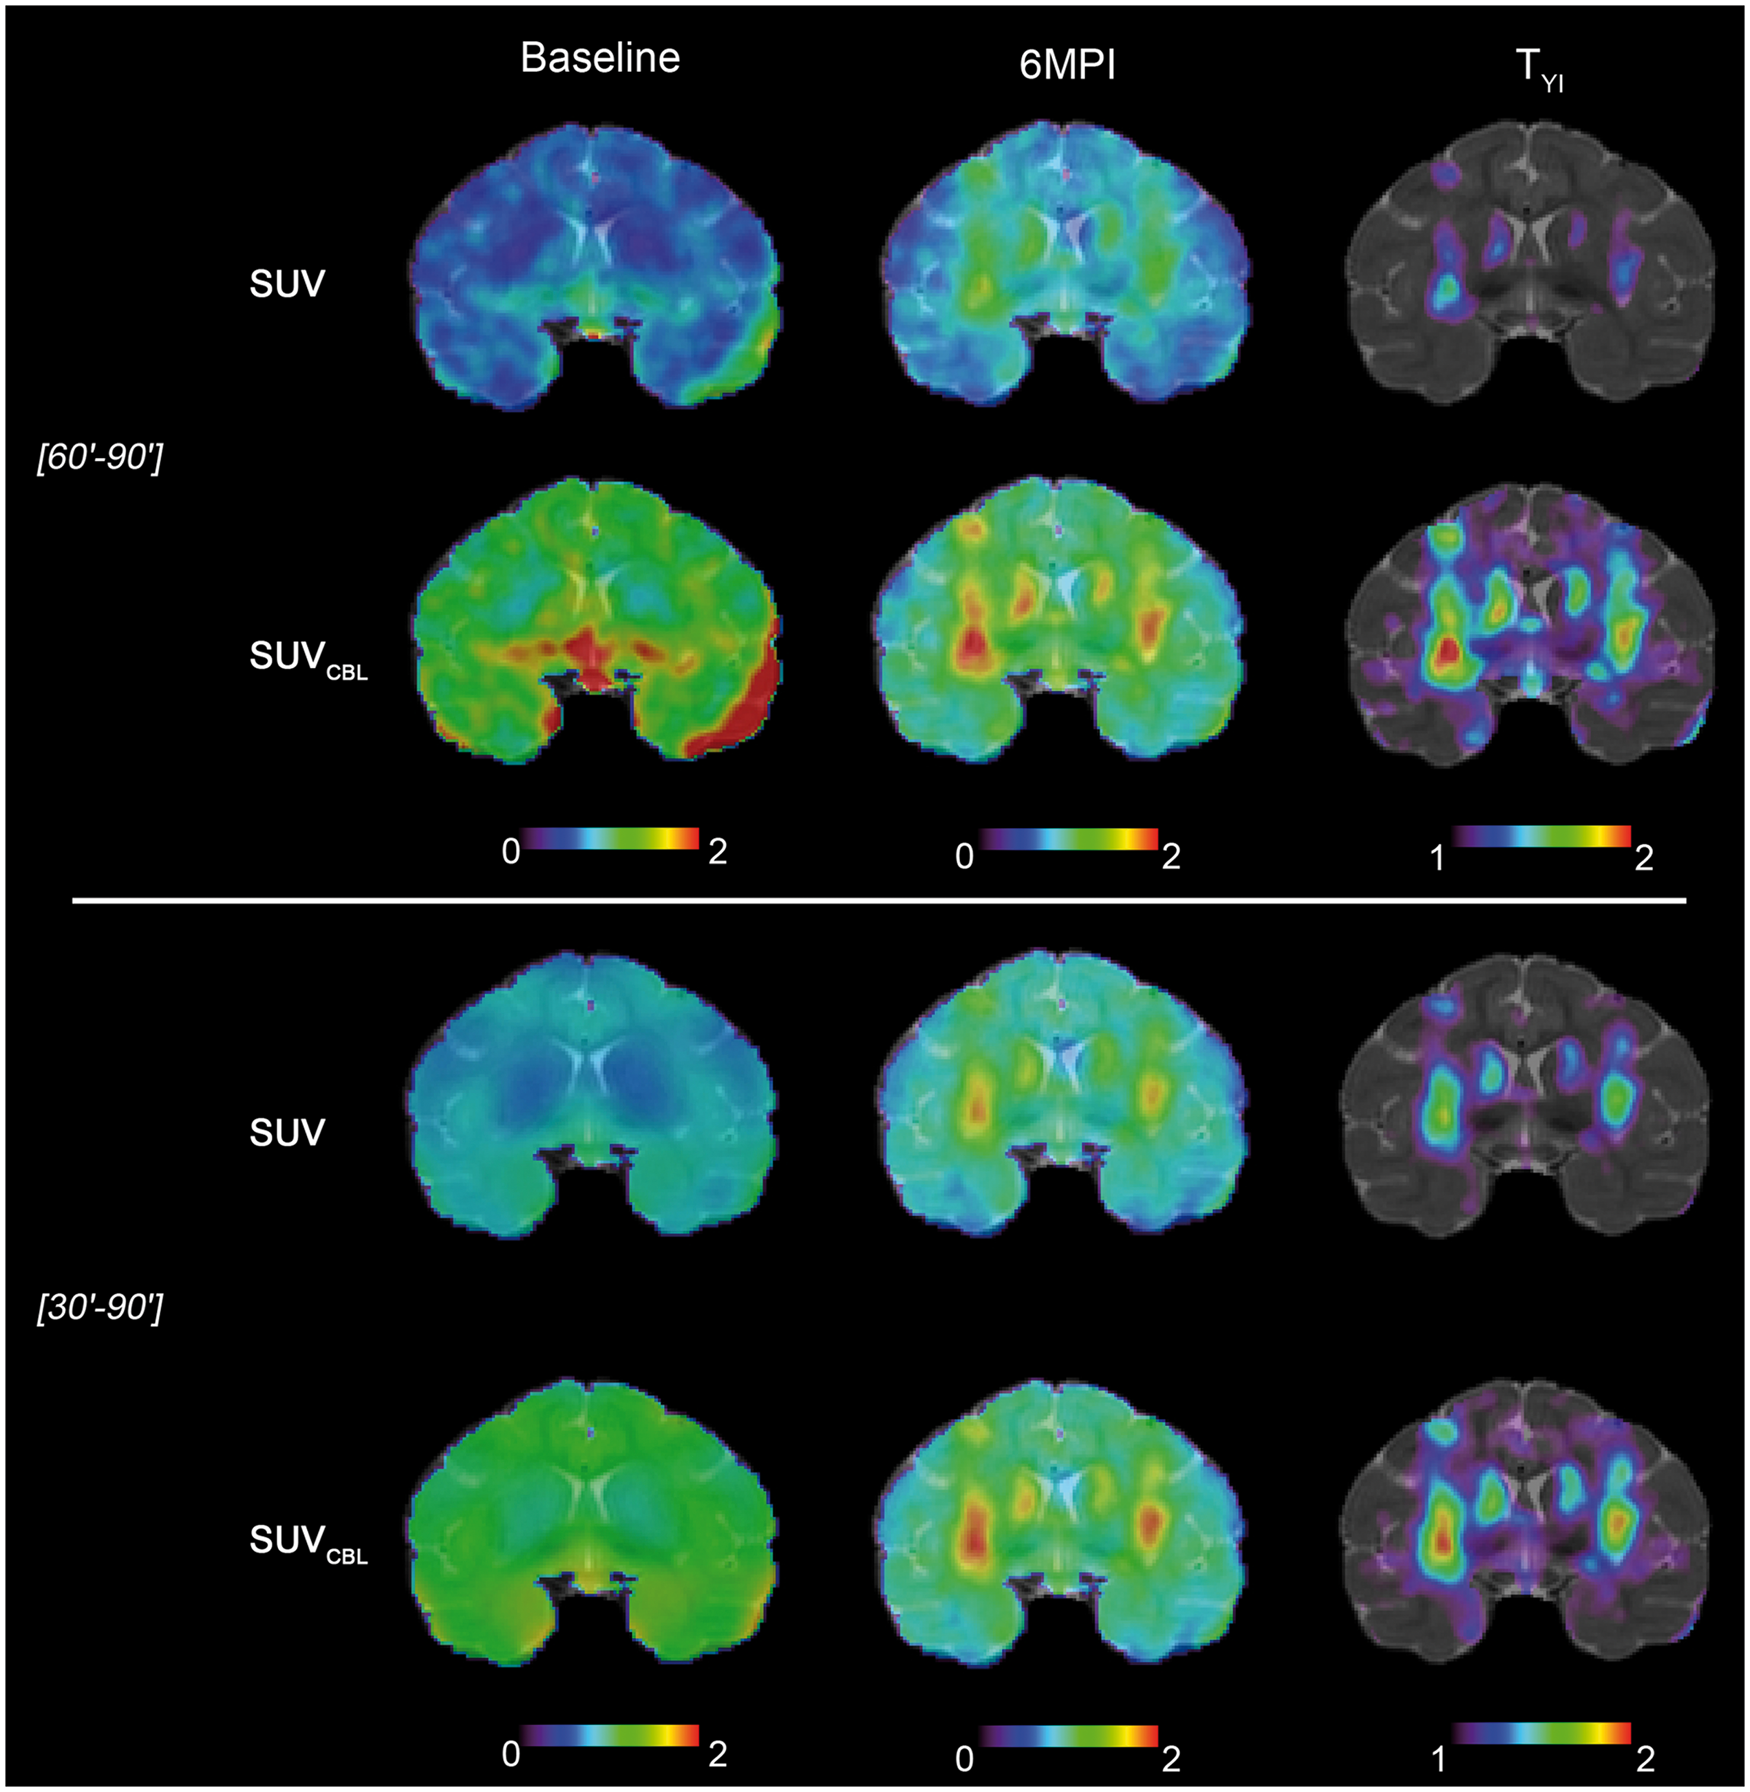
Parametric TSPO-PET images at baseline and at 6MPI, before and after image segmentation by thresholding at a threshold defined by the maximal YI (TYI). VT was clculated using LoganmcAIF and BPND were calculated by three different reference region methods (SRTM, MRTM0 and Logan) and two different reference curve measurements (CBL and SVCA). SUV and SUVCBL TSPO-PET images at baseline and at 6MPI, before and after image segmentation by thresholding at a threshold defined by the maximal YI (TYI). SUV images were obtained from summed PET images between [30′–90′] or [60′–90′] of acquisition. SUV ratio images (SUVCBL) were created after normalization of SUV images for cerebellar uptake at corresponding acquisition time windows.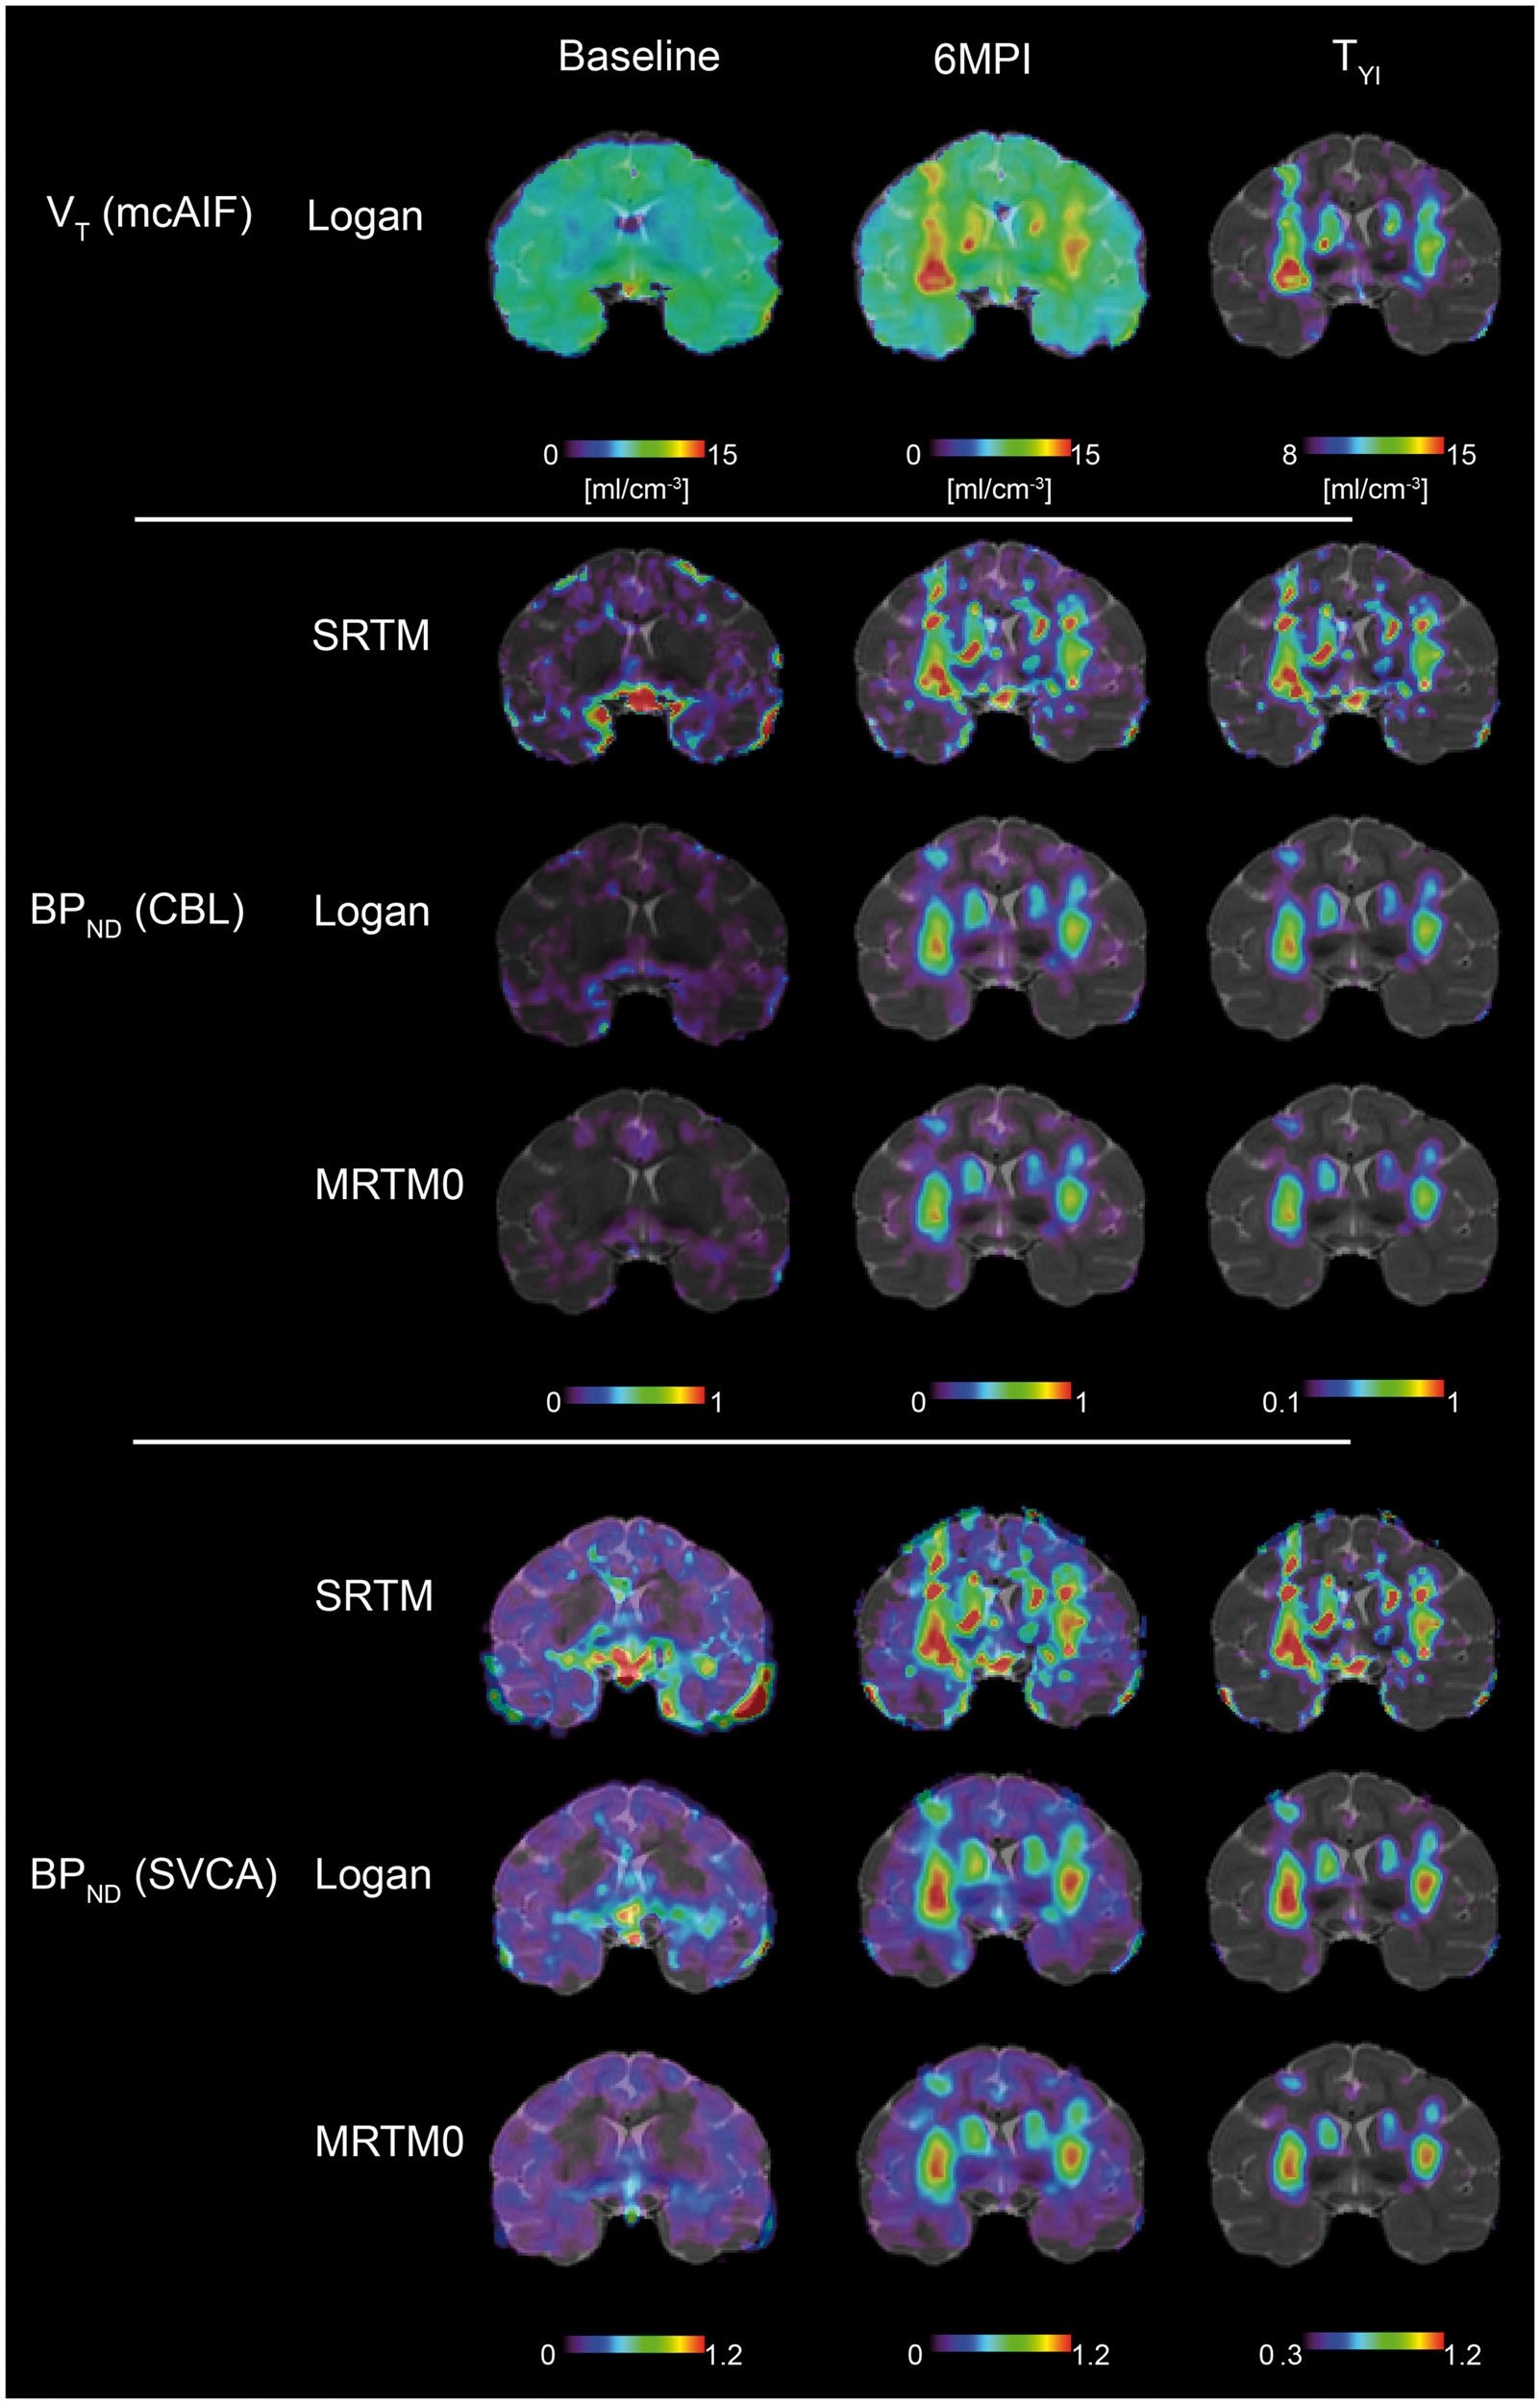
Receiver operating curve analysis
All AUC-ROC scores are larger than 0.8 and most quantification methods are above 0.9, values that are significantly higher than 0.5 (chance level). The lowest AUC-ROC values have been measured for SUV [30′–90′] and MRTM0CBL/SVCA. The optimal AUC-ROC score has equally been measured for SUVCBL [60′–90′] and SUV [60′–90′], followed by LoganmcAIF. For the BPND calculations, the approach to calculate the reference curve (SVCA or CBL) has little impact on the statistical performance of the reference-based quantification method in the NHP CNTF-model. The TSPO-expression volume has no influence on the AUC-ROC scores. The gain between the most optimal and worst AUC score (MRTM0SVCA, 0.85) is 20% for SUVCBL [60′–90′], 16% for LoganmcAIF and 13% for LoganSVCA, considering the value at chance level (0.5); the SVCA approach performing slightly better than the CBL reference TAC. The different ROCs and AUC-ROC scores are represented in Figure 7.
ROC curves obtained for the different modelling approaches. Note that SUV [60′–90′] and SUVCBL [60′–90′] have similar area under the curves (AUC) and that the ROC curves are completely superimposed. TSPO expression after injection of the high-dose (HD) or low-dose (LD) titer has little influence on the AUC. The table represents AUC and Youden Index (YI). The colors overlaying the table give a visual heat map representation: lowest values are green, the highest red.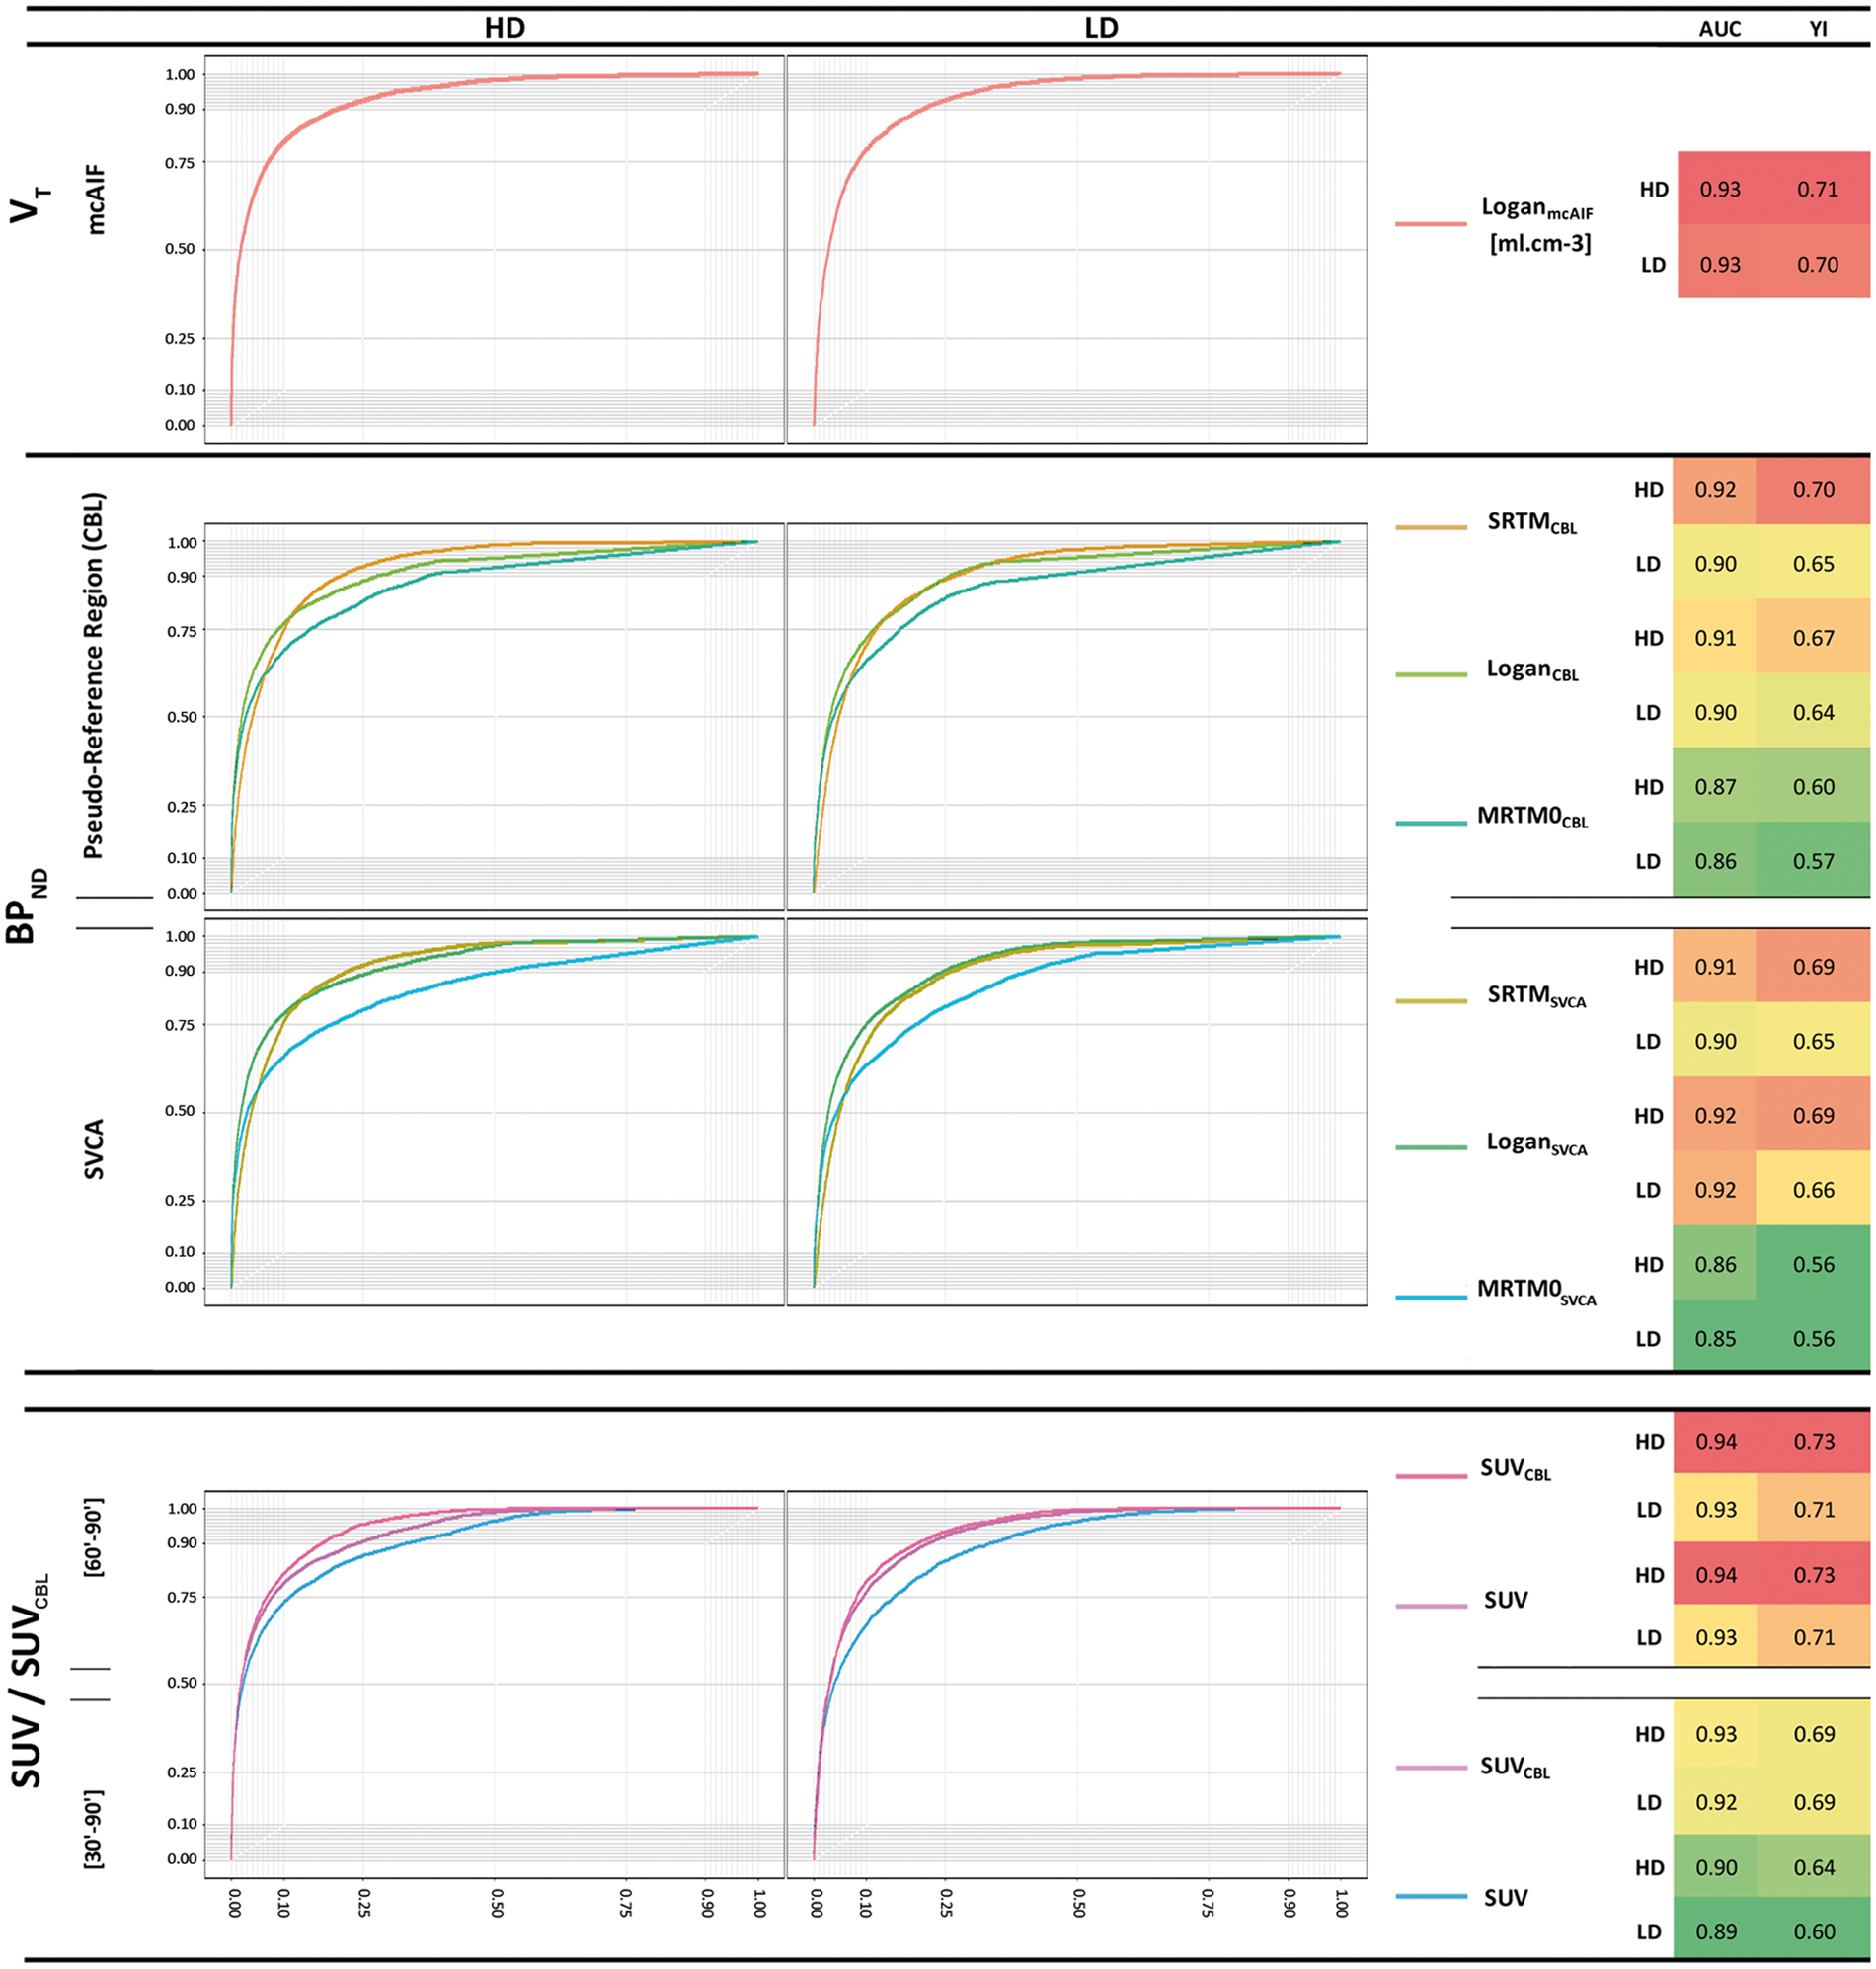
Comparison of quantification methods
The optimal YI was highest for SUV [60′–90′] and SUVCBL [60′–90′]; with SUV [60′–90′] having optimal sensitivity over all TSPO-methods (Figure 7, Table S2), but SUVCBL [60′–90′] displaying optimal specificity, PPV and accuracy (Figure 7, Table S2). Despite a lower YI, BPND by LoganCBL/SVCA has similar performances as SUVCBL [60′–90′] (Figure 7, Table S2). Next optimal YI was observed for BPND by SRTMCBL/SVCA and SUVR30′–60′ with competing performances on sensitivity, specificity, PPV and accuracy. Lowest YI and performances were noted for BPND by MRTM0 and SUV [30′–60′] (Figure 7, Table S2). Similarly to the ROC analysis, the approach used to calculate the reference curve (SVCA or CBL) had little impact on the individual statistical performances of the reference-based quantification method in our NHP CNTF-model.
Thresholding
Image segmentation by thresholding is a simple yet effective approach to differentiate increased binding from basal uptake. However, the choice of the threshold increases differently the number of – both false and true – negative voxels for all TSPO-PET methods; and inversely decreases – both the false and true – positive voxels. This results in a different evolution of the sensitivity, specificity, PPV and accuracy for each TSPO-PET method dependent of the segmentation threshold, as graphically represented in Figures S1 and S2 and Table S2. After binary classification, the optimal threshold can be defined by the optimal Youden Index (YI), which is derived from the ROC analysis (Figure 7). However, in practice, the choice of the threshold can be derived from TSPO-PET images, using the average value of the reference region after a challenge or the whole brain at baseline. The threshold at optimal YI is smaller than the threshold derived from the reference region or whole-brain values at baseline. As shown in Figure S1 and S2, increasing the threshold has an important impact on the statistical performances of the different quantification methods, especially on the sensitivity and PPV. Overall, statistical performances of VT by LoganmcAIF are less sensitive to higher thresholds compared to the other quantification methods. Table S2 summarizes the sensitivity, specificity, PPV and accuracy of each TSPO-PET quantification method at a given threshold.
Discussion
The 18 kDa TSPO was locally overexpressed in the NHP brain after stereotactic injection of a lenti-CNTF vector. Previously, we reported on the mechanisms by which CNTF induces TSPO expression in reactive astrocytes only, without engendering any immune response such as activation of microglia or blood brain barrier leakage, yet yielding significant and selective binding of TSPO radioligands.22,23 Similarly to what has been observed in the rodent model, local TSPO-overexpression in the NHP brain was associated with CNTF-induced activation of astrocytes. In the present study, two different vector doses were injected in the caudate-putamen complex of each brain hemisphere in order to evaluate the impact of the TSPO expression volume on the statistical performances of the quantification methods. Brain imaging studies in the NHP suffer less from partial volume artefacts compared to rodent studies, and thus are an added value in the validation of quantification methods, considering the use of simplified and non-invasive quantification methods in clinical studies.
Although inter-animal variability cannot be taken into account in a one-case study, [18F]-DPA714 uptake, measured by VT, increased up to 40–60%, which is at least twice the between-subject variability that was previously shown to be ∼20% in another NHP study. 8 The TSPO-PET binding in the lenti-CNTF model is half the maximal binding we observed in the chemically induced excitotoxic lesion model. 8 In the chemically induced excitotoxic lesion model, TSPO expression was matched to a mixture of activated microglia and infiltrating CD68 macrophages, and in a lesser extent to activated astrocytes. In another study of systemic Lipopolysaccharide (LPS) intoxication in the NHP33,34 and in healthy subjects, 35 VT was increased by 20–70% using [11C]-PBR28 TSPO-PET imaging. Post-mortem studies in the NHP, demonstrated that the LPS challenge resulted in TSPO immunoreactivity through activated microglia but rarely through astrocytes. This increased binding is in the same range as we observed in the lenti-CNTF model (40–60% increase) despite the implication of a different cell population. These data suggest that rather the density of TSPO contributes significantly to the overall TSPO-PET signal than the cell type.
Other sources of complexity of TSPO-PET quantification are the variability in the plasma-free fraction, 36 and the complex tracer kinetics due to the binding of TSPO-PET ligands to the endothelium and smooth muscle cells.36–38 Although the plasma-free fraction has not been measured in this study, we can consider that this fraction remains stable during time of acquisition, and would not be different from the baseline state as the Lenti-CNTF does not induce a general status of peripheral inflammation. With regard to complex tracer kinetics, recent studies demonstrated that accounting for endothelial TSPO binding in the kinetic model improved the fit of PET data.9,11 Nevertheless, though compartment modeling analysis has a better precision, it is prone to noise and less adapted for parametric image analysis. Spectral analysis 12 and the Logan graphical analysis are alternative quantification methods that are independent of the number of compartments. Previously, we validated VT quantification by LoganmcAIF in the chemically induced excitotoxicity NHP model and demonstrated a linear correlation with TSPO-IHC optical density measurements. 8 Our aim here was to evaluate the most commonly used simplified quantification tools: BPND calculated by three different reference region methods (SRTM, MRTM0 and Logan) and two different reference curve measurements (CBL and SVCA), SUV and SUVCBL, and to compare them with VT calculated by LoganmcAIF as previously validated in the chemically induced exitotoxicty NHP model. It is of note that in the Lenti-CNTF NHP model, VT by LoganmcAIF had suboptimal statistical performances compared to SUVCBL [60′–90′]. Similarly, Lyoo et al. 14 using [11C]-PBR28 demonstrated that a semi-quantitative approach by SUVCBL [60′–90′] can substitute for, and may even be more sensitive than absolute quantification of VT by compartment modeling. On the other hand, Fan et al. 39 demonstrated that spectral analysis, is much more sensitive than LoganmcAIF to detect neuroinflammation in a subset of mild cognitive impaired (MCI) patients. Golla et al. 12 exploring parametric binding images of [18F]-DPA714 study in healthy subjects and AD patients, did not report on a difference between VT obtained from spectral analysis or LoganmcAIF. For the simplified reference region approach, they propose SRTM 4 or Logan 12 using the cerebellum as a reference region, while MRTM0 did not provide parametric images with acceptable quality. Our results confirm that MRTM0 is the least performant of simplified reference methods. We showed that Logan and SRTM result in comparable statistics, but are less performant than SUVCBL [60′–90′]. In our model of controlled and localized TSPO expression, TSPO-PET quantification based on a reference curve provided by SVCA resulted in slightly better ROC score as compared to TSPO-PET quantification based on the reference curve extracted from the cerebellum. A recent study evaluating [18F]-DPA714 uptake in healthy subjects demonstrated lower variability of BPND measurement by Logan using the SCVA approach compared to cerebellum as reference. 40 Finally, we showed that SUV calculated over too long acquisition times degrades its statistical performance.
In conclusion, we generated localized astrocytic activation-induced TSPO overexpression in the NHP brain through stereotactic injection of a lenti-CNTF vector. We used this preclinical model to perform a voxelwise comparison between in vitro and in vivo data in order to define the statistical performances of non-invasive TSPO-PET quantification methods. We demonstrated that SUV, SUVCBL [60′–90′] has optimal YI with optimal sensitivity, specificity, accuracy and PPV, followed by VT issued from LoganmcAIF and BPND by LoganCBL/SVCA. Our data confirm previous findings in the literature which underline that our approach of binary classification of in vivo TSPO-PET data is a valuable tool to evaluate statistical performances of TSPO-PET quantification techniques.
Supplemental Material
Supplemental material for Assessment of simplified methods for quantification of [18F]-DPA-714 using 3D whole-brain TSPO immunohistochemistry in a non-human primate
Supplemental Material for Assessment of simplified methods for quantification of [18F]-DPA-714 using 3D whole-brain TSPO immunohistochemistry in a non-human primate by Nadja Van Camp, Yaël Balbastre, Anne-Sophie Herard, Sonia Lavisse, Clovis Tauber, Catriona Wimberley, Martine Guillermier, Aurélie Berniard, Pauline Gipchtein, Caroline Jan, Romina Aron Badin, Thierry Delzescaux, Philippe Hantraye and Gilles Bonvento in Journal of Cerebral Blood Flow & Metabolism
Footnotes
Funding
The author(s) disclosed receipt of the following financial support for the research, authorship, and/or publication of this article: This work was supported by NeurATRIS: A translational Research Infrastructure for Biotherapies in Translational Neurosciences (Investissement d’Avenir – ANR-11-INBS-0011, A.L.P.)
Acknowledgements
The contribution of Dr. Salma Bougacha to optimize the R-script to classify the voxels after thresholding was greatly appreciated. We thank Genethon-Bioprod for the production of the lenti-CNTF.
Declaration of conflicting interests
The author(s) declared no potential conflicts of interest with respect to the research, authorship, and/or publication of this article.
Authors’ contributions
• Animal experimentation: MG, RAB. • PET imaging and analysis: SL, CT, CW, NVC. • Immunohistochemistry and analysis : AB, CJ, PG, GB. • 3D-Multimodal co-registration and analysis: YB, TD, ASH. • Classification, ROC and other statistical analyses: YB. • Conceived, supervised all aspects of the project and wrote the manuscript: NVC, GB. • Secured funding: PH, GB.
Supplementary material
Supplemental material for this article is available online.
References
Supplementary Material
Please find the following supplemental material available below.
For Open Access articles published under a Creative Commons License, all supplemental material carries the same license as the article it is associated with.
For non-Open Access articles published, all supplemental material carries a non-exclusive license, and permission requests for re-use of supplemental material or any part of supplemental material shall be sent directly to the copyright owner as specified in the copyright notice associated with the article.