
Abstract
Intimate communication between neural and vascular structures is required to match neuronal metabolism to blood flow, a process termed neurovascular coupling. The number of laboratories assessing neurovascular coupling in humans is increasing due to clinical interest in disease states, and basic science interest in a non-anesthetized, non-craniotomized, unrestrained, in vivo model. However, there is a lack of knowledge regarding how best to characterize the neurovascular response. To address this knowledge gap, we have amassed a highly powered human neurovascular coupling dataset, and deployed a network-based approach to reveal the most powerful and consistent metrics for quantifying neurovascular coupling. Using dimensionality reduction, community-based clustering, and majority-voting of traditional metrics (e.g. peak response, time to peak) and non-traditional metrics (e.g. varying time windows, pulsatility), we have identified which of the existing metrics predominantly characterize the neurovascular coupling response, are stable within and across participants, and explain the vast majority of the variance within our dataset of over 300 trials. We then harnessed our empirical approach to generate powerful novel metrics of neurovascular coupling, termed iAmplitude, iRate, and iPulsatility, which increase sensitivity when capturing population differences. These metrics may be useful to optimally understand neurovascular coupling in health and disease.
Keywords
Introduction
Sophisticated communication between neural and vascular structures is required to rapidly and precisely match neuronal metabolism to blood flow within the central nervous system.1,2 Mosso, 3 Roy and Sherrington 4 first examined these interactions in the late 1800s; however, it was not until 2001 that the concept of this complex interplay involving neurons, astrocytes, and vascular contractile cells was formally introduced and termed the neurovascular unit (historical trajectory explained, 5 and elegantly reviewed 2 ). Since this time, interest in understanding these communication pathways and how they change with pathology has increased markedly (Figure S1).
Neurovascular coupling describes the functional responsiveness of the neurovascular unit, and has become increasingly used as a method to evaluate the health and function of the cerebrovascular system, and responsiveness of the neurovascular unit.6–9 Mechanistic insight into neurovascular coupling has primarily been provided by non-human models.1,6,10 However, these models most often necessitate anesthesia/sedation, craniotomy, or restraint, all of which are barriers to completely understanding neurovascular coupling.1,10–16 Interspecies differences may also preclude clear translation to humans, while isolated models lack important inputs to the neurovascular unit such as that of the autonomic nervous system. 17 Due to these technical obstacles, assessing neurovascular coupling in humans is advantageous as evaluations occur in a non-anesthetized, non-craniotomized, unrestrained, truly in vivo model. 6
The most common strategy for assessing neurovascular coupling in humans is to use ultrasound insonation of blood velocity in the posterior cerebral artery, which is responsible for perfusing the majority of the visual cortex, and assessing the responsiveness of blood flow in this brain region to visual stimulation. 6 This brain region may have distinct advantages over other regions as the blood flow response appears to have the greatest vascular responsiveness to regionally specific stimuli compared to other brain regions, such as that perfused by the middle cerebral or anterior cerebral arteries.8,18,19 This could be due to the visual cortex having the highest-neuronal density in the cortical area. 20 Deficits in components of the neurovascular unit have been linked to a wide range of conditions associated with deteriorating central nervous system structure and function.7,8,18,21–24 Neurovascular coupling is ideally placed to become a biomarker in the early detection and monitoring of most neurovascular complications observed in humans. However, a key remaining knowledge gap before widespread deployment is that we do not understand which of the more than 100 discrete metrics being utilized provides the most powerful and consistent insight into the function of the neurovascular cascade. 6
To address this gap and provide empirical evidence regarding what components of the neurovascular response should be utilized in human research, we have amassed a uniquely large human neurovascular coupling dataset. We computed commonly known neurovascular coupling outcome measures from this dataset, which collectively represent the blood flow response to a visual stimulus. In an effort to include a wide range of metrics being utilized from the various groups researching neurovascular coupling, 6 we not only included metrics recommended within the recent guidelines, 6 but also included published neurovascular coupling metrics such as those derived from model systems analysis, 25 area under the curve analysis, 26 discrete time windows, 6 and rapidity of response. 27
We employed a network-driven analysis pipeline to identify which metrics predominantly characterize the neurovascular response, are stable within and across participants, and explain the vast majority of the variance within the our data. We then validated our metrics by showing large-scale stability within and across individuals, and the capacity to sensitively detect differences between populations. Lastly, we harnessed our computational approach to generate novel summary metrics that in some cases are more powerful and stable than existing metrics, reduce the outcome measure complexity, and collectively represent the key aspects of the physiological response.
Material and methods
See Extended Supplementary Methods for a complete description. The final analysis comprised 130 individuals, with no documented history of cardiovascular disease or traumatic brain injury. Neurovascular coupling data from these participants have not been previously published. All participants provided written informed consent. Neurovascular coupling assessment protocols have been approved by three clinical research ethics boards (University of Calgary Research Ethics Board, School of Medicine, University of Split Ethics Committee, Mount Royal University Human Research Ethics Board) consistent with the Declaration of Helsinki. Beat-by-beat blood pressure and posterior cerebral artery blood velocity (transcranial Doppler; Spencer Technologies, Seattle, USA) were recorded during alternating cycles of 30 s of eyes closed followed by 30 s of eyes open. Neurovascular coupling was analyzed using custom software (i.e. “iNVC”), developed in R (R Core Team (2017), version 3.4.0). Data were preprocessed in order to remove aberrant data points, and to calibrate data to a standard time frame. Additionally, we calculated a second order linear model according to previously described methods.
25
Briefly, we generated this ‘control system’ using the built in matlab functionality to generate five model systems outcome measures including gain (K), which indicates the evoked flow velocity level above baseline under stabilized hemodynamics; rate time (Tz), which specifies the steepness of the initial increase in flow velocity; the undampened natural angular frequency (Tw), which describes the oscillatory features of the neurovascular coupling mechanism; and attenuation (ζ), which specifies the dampening of the vascular system.
25
Put together, this resulted in a total of 1672 parameters, for each of the independent human trials to be used in downstream analysis (see Supplementary Methods). Principal component (PC) analysis was used to compute a low dimensional representation of our data to be used in clustering analysis (visualized also using t-distributed stochastic neighbor embedding, Figure 1). We clustered these outcome measures using the Louvain community structure detection method, using a k-nearest neighbors graph constructed from the Jaccard index as input.
28
We then evaluated each cluster for the relative representation of specific phenotypic components of the neurovascular response (e.g. amplitude, rate, pulsatility) using an enrichment analysis (see Supplementary Methods). We determined which outcomes demonstrated the most consistent explanation of variance across trials, within an individual, by conducting principal component analysis on each included participant separately, with each trial representing the repeated-measures aspect within the analysis. These results were then fed into a majority-voting algorithm whereby outcome measures were considered for potential extraction if the loading (i.e. the correlation between the given variable and the first principal component) of that outcome measure exceeded 0.5 (i.e., indicating a high proportion of overall variability was explained by this variable) in at least half of the individuals included in this analysis. Next, variables meeting these criteria were ranked according to their mean loading value from the within-individual analysis, and the top three variables from each cluster were taken as “majority-voted outcome measures,” as these variables consistently explained a large amount of variability within the data across individuals. Lastly, summary metrics for each cluster were computed by taking the first principal component eigenvalue from the top three majority-voted metrics in each cluster. We used only the top three variables in an effort to conservatively select variables with the strongest within- and between-participant stability, and that clearly represented the phenotype of each cluster. To establish the biological validity of our majority-voted outcome measures, we examined potential differences in the neurovascular coupling response between able-bodied individuals (n = 13) versus individuals with severe cervical spinal cord injury (n = 14), and male versus females, and changes with ageing in otherwise healthy individuals. Additionally, we compared these metrics to traditional measures of the neurovascular coupling response (PCAv peak, time to peak, area under the curve (AUC), and pulsatility across the entire 30-s trial). This analysis was completed blinded to condition/group and only within individuals experiencing the same stimulation paradigm. Software calculating integrated summary neurovascular coupling metrics (i.e. iAmplitude, iRate, iPulsatility, see below for details) derived from the computational pipeline that identified them will be available by contacting the corresponding author (“iNVC”).
Experimental overview: All known published metrics of quantifying the neurovascular coupling response were computed in 130 individuals, and 383 trials, generating 1672 observations per trial. To reduce the dimensionality of this data, principal component analysis was applied and fed into a nearest neighbor voting algorithm (Step 1). Data were then clustered according to the Louvain-Jaccard method, and visualized using t-stochastic neighbor embedded (tSNE) dimensionality reduction (Step 2). The correlation of each outcome measure to the first principal component is then visualized using a heat map where each cell represents the Pearson correlation (r) between outcome measures, for each individual, to the first principal component. Outcome measures were identified that significantly correlated (r > 0.5) to the first principal component in the majority of individuals (Step 3), as they account for: (1) the majority of the variability within the data, and (2) are consistently correlated to the first principal component. These outcome measures, and their cluster summary statistics, were then validated by detecting differences in clinical populations, providing rationale for recommended use. Abbreviations: NVU: neurovascular unit; NVC: neurovascular coupling; tSNE: t-distributed stochastic neighbor embedding; NO: nitric oxide; nNOS: neuronal nitric oxide synthase; NE: norepinephrine.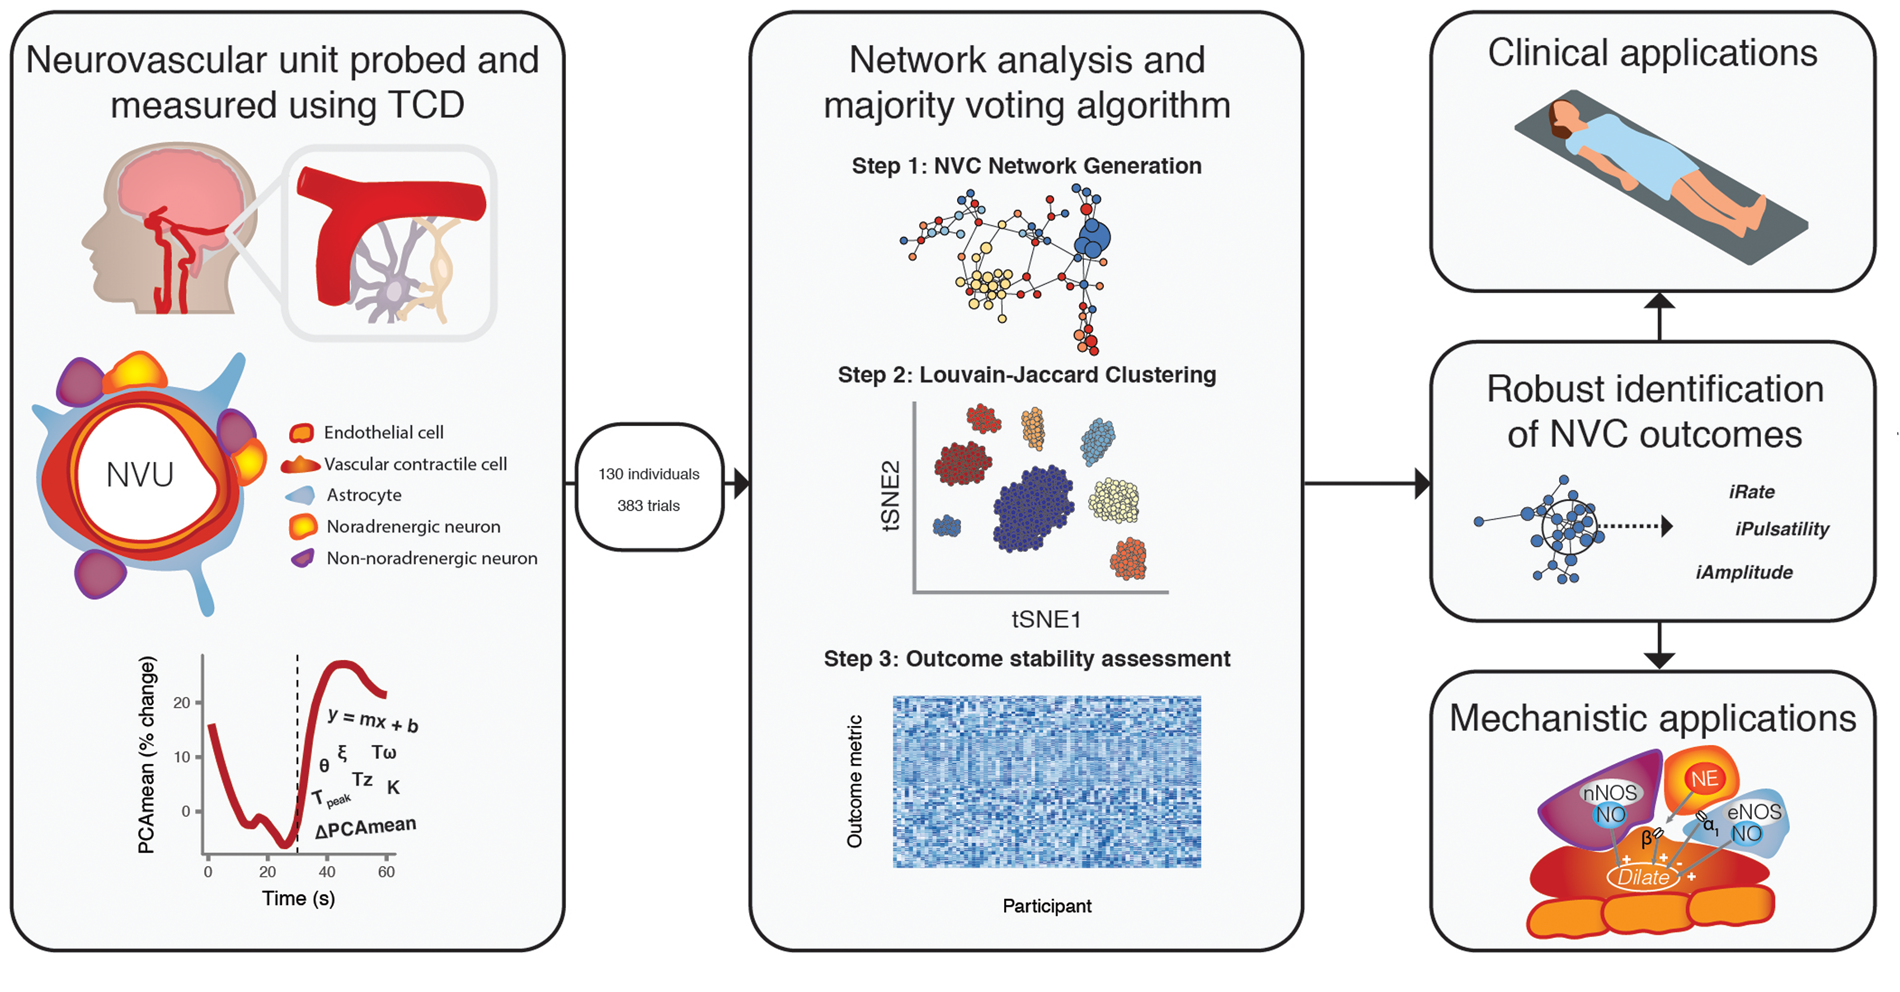
Results
Participants and descriptive statistics
We included 133 individuals in the initial analysis. Three individuals were excluded due to later described metabolic syndrome, bringing our total to 130 individuals for all downstream analyses. Each individual included underwent at least one neurovascular coupling stimulation trial, with a mean of 3 ± 1 trials per participant. As we performed our initial clustering analysis on individual trials from able-bodied individuals, the following samples were retained. Thirty-nine individuals had 2 trials, 75 individuals contributed 4 trials, and 1 individual completed 5 trials (total n = 383). No consistent differences in response variability were found relating to the number of trials included (Figure S3). We included different visual stimuli, in order to increase the heterogeneity of our dataset and therefore our ability to extrapolate our findings. Our data included the two primary modes of eliciting the neurovascular coupling response in humans: side to side hand motion (n = 28), and looking at a strobe light (n = 102).
Classical measures reveal differences across populations
Using four classical markers of neurovascular coupling, we investigated potential differences between able-bodied individuals and individuals with spinal cord injury, males and females, and across age groups. Examination of the raw posterior cerebral artery mean velocity traces (Figure 2(a) to (c)), and the posterior cerebral artery pulsatility traces (Figure 2(d) and (e)) revealed distinct responses between individuals with spinal cord injury compared to able-bodied individuals. However, statistical differences between groups were only observed for the amplitude of response, and not for the rate of response (for quantification see Figure S2). Using these traditional approaches, we did not observe differences in the neurovascular coupling response between males and females or between older and younger adults. We reasoned that parts of the phenotype of the neurovascular response may be missed by these four traditional markers and, as such, we aimed to increase the resolution of our analysis to reveal reliable outcome measures capable of characterizing the full heterogeneity within the response.
Traditional markers of neurovascular coupling were examined. First, the mean velocity of the posterior cerebral artery (PCA) was compared between able-bodied (AB) individuals and individuals with severe cervical spinal cord injury (SCI (a)). Comparisons were also drawn between males and females (b) and between older and young individuals (c). We also examined the pulsatility responses of the PCA, calculated as [(PCAmax – PCAmin) / PCAmean] (d–f). For further quantification, please see Figure S2. The first dotted line denotes the beginning of the visual stimulus, and the second line the end of the stimulus.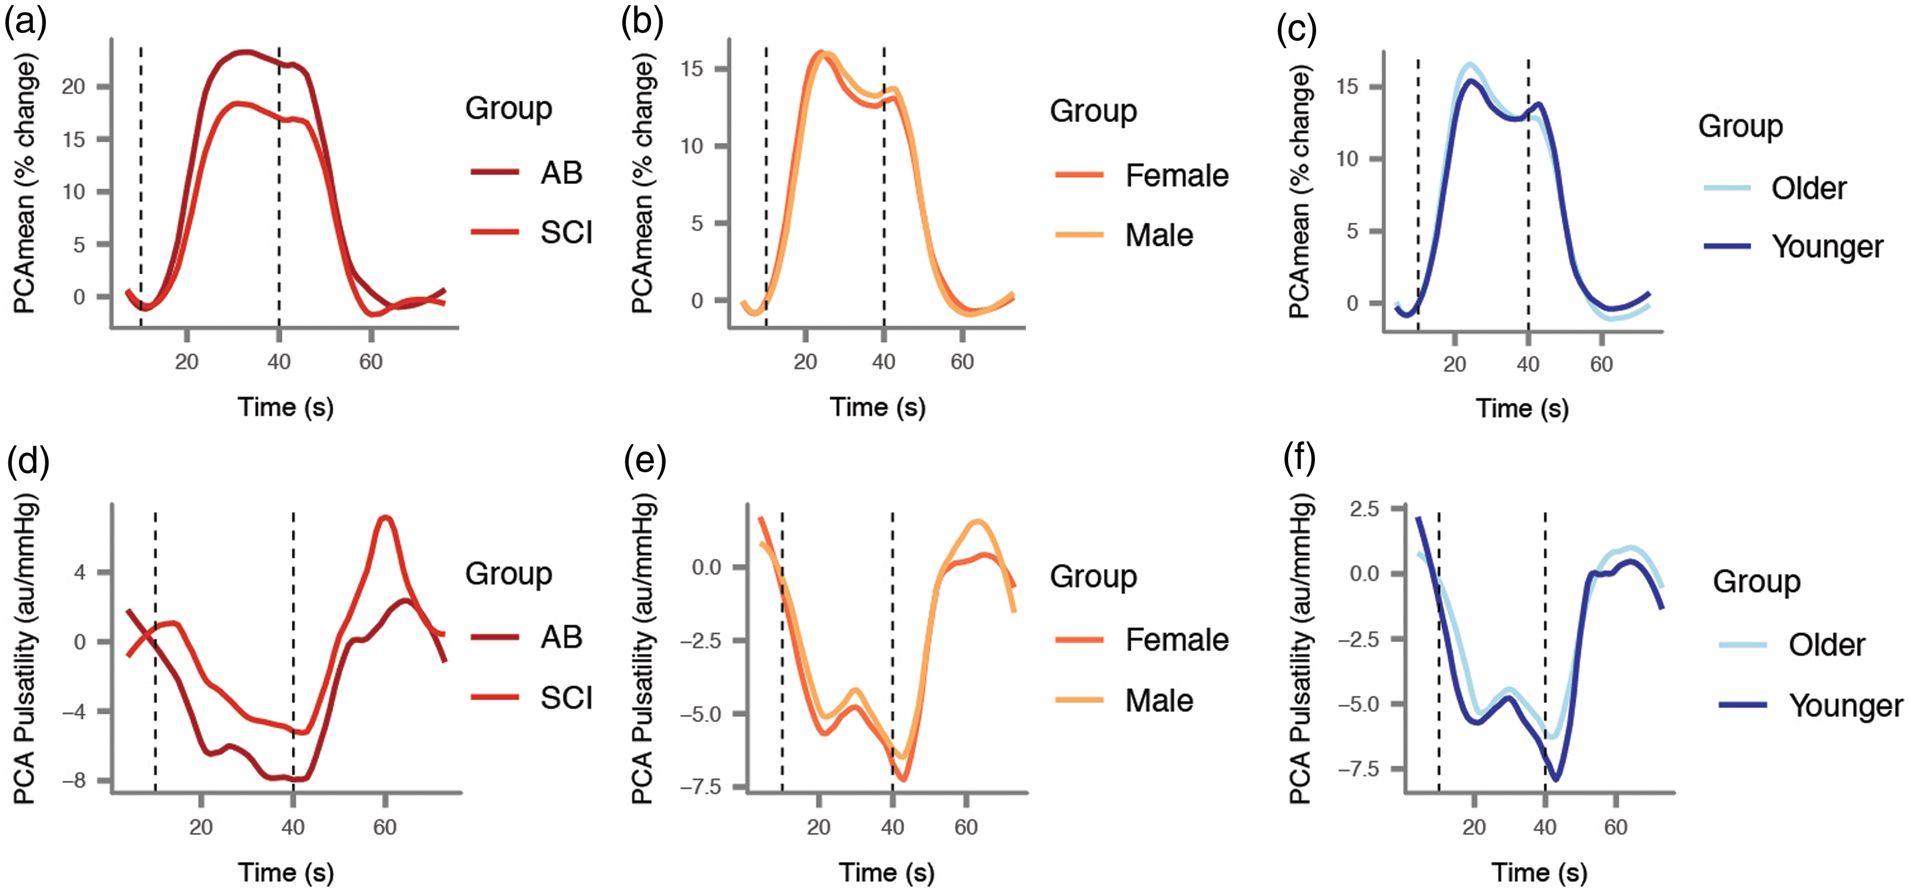
Neurovascular coupling response quantification
The methods used to identify ‘normal’ or ‘impaired’ neurovascular coupling are critically dependent on the method by which an experimenter calculates the magnitude, latency, or any other parameter of the neurovascular coupling response. Therefore, we included commonly known methods of measuring the neurovascular coupling response. We generated 1672 parameters. Based on the comprehensiveness of these outcome measures, we reasoned that the full spectrum of the neurovascular coupling response could be now captured within our data. To begin examining relevant clusters of outcome measures, we applied principal component analysis, and visualized the data in two dimensions using t-distributed stochastic neighborhood embedding (t-SNE) (Figure 3(a)).
Network analysis reveals distinct clusters of outcome measures related to the neurovascular coupling response. (a) Using t-distributed stochastic neighbor embedding, which does not take into account the clustering results, we observe separation of our clusters, indicating that individual clusters contain highly correlated metrics. (b) Cluster eigenvalue dendrogram reveals that clusters whose variables are highly enriched for key characteristics of the neurovascular coupling response tend to be highly correlated (i.e. close together on the dendrogram; shaded areas). (c) Cluster enrichment results for peak, time to peak, and pulsatility. The top enriched term (represented as −log(p)) for each cluster is shown. (d) Matrix with loading values from our within-participant principal component analysis, where red reflects a loading of > 0.5 or < −0.5. Variables whose correlation exceeded this threshold in more than 50% of individuals were considered “majority-voted metrics”, as they consistently explained a high amount of variability both within and across individuals. (e) The top three majority voted metrics from each of the four clusters that differed across spinal cord injury. Each of these was found to be significantly different (all p < 0.05). (f) The top three majority-voted metrics in the pulsatility cluster. Variables 2 and 3 were significantly different between older and younger individuals (p < 0.001).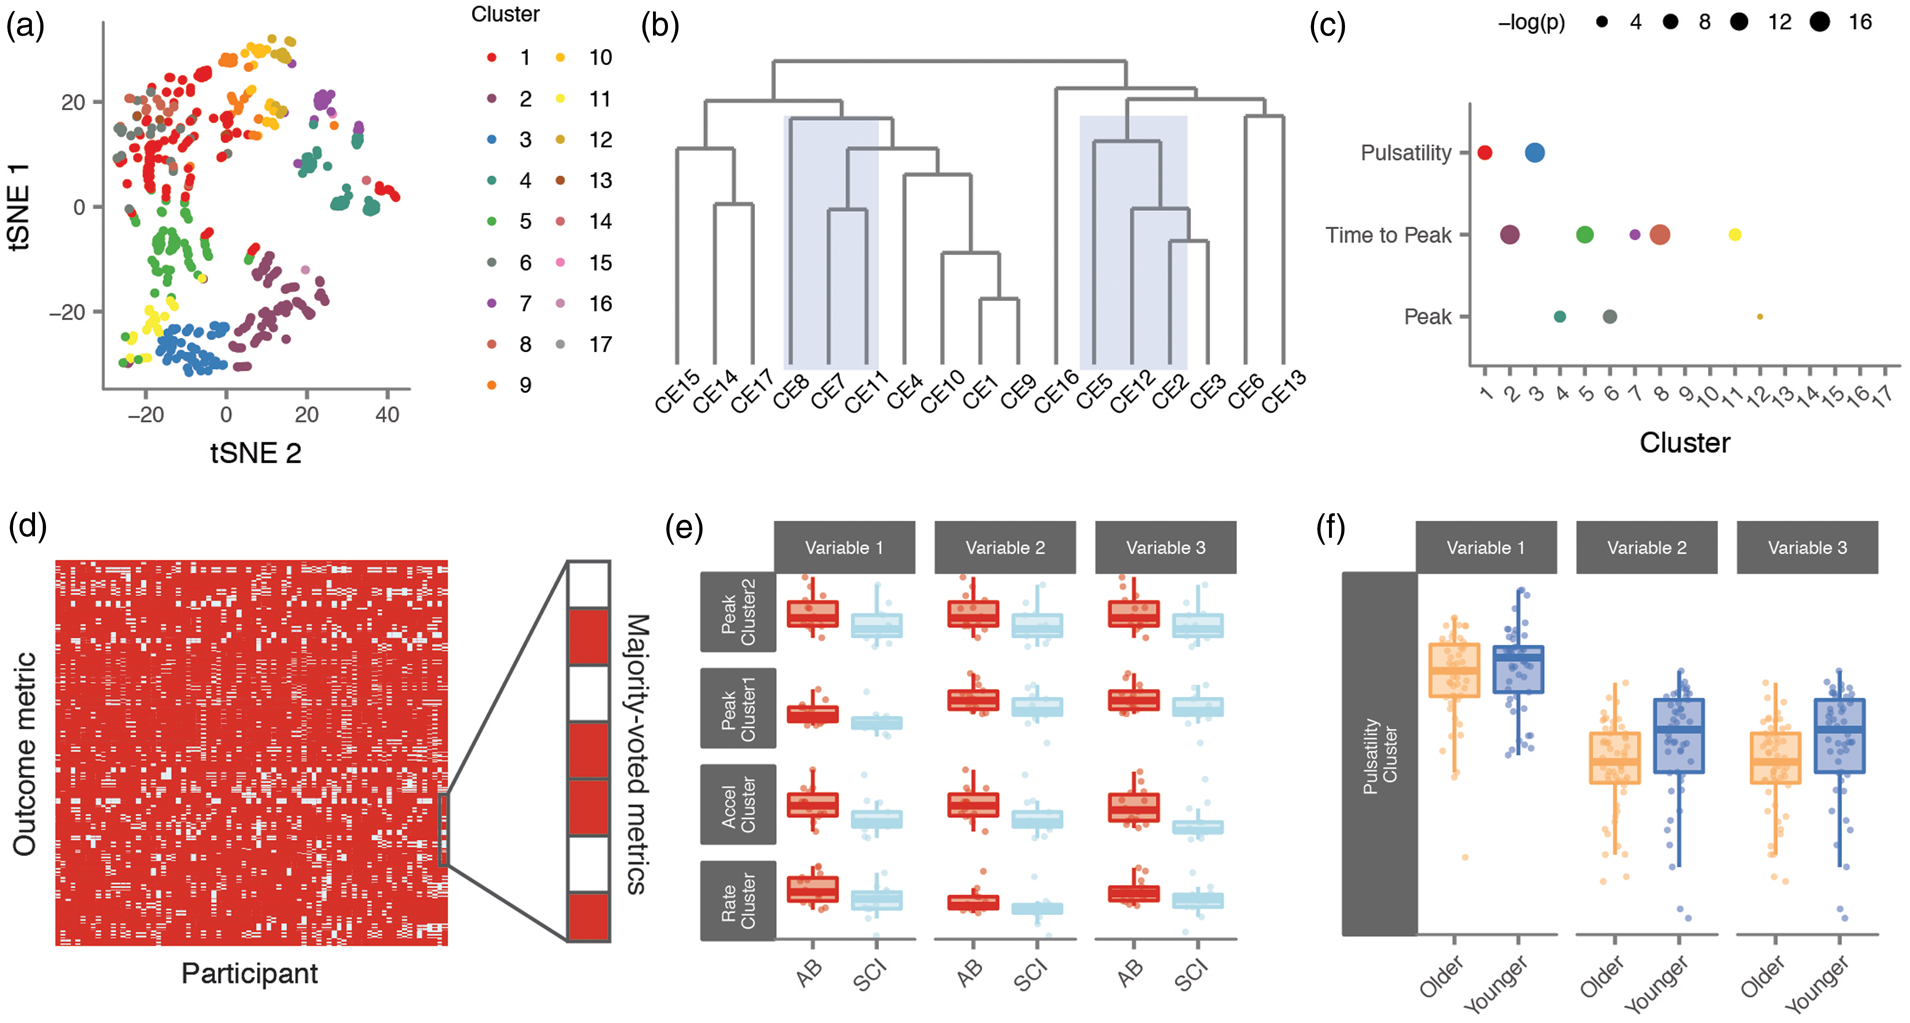
Unsupervised graph clustering reveals 17 distinct but complementary clusters
To find clusters containing highly correlated outcome measures, we performed ‘Jaccard-Louvain’ clustering, previously identified as a highly accurate clustering method. 29 Using the PC values from able-bodied individuals as an input, where we retained the first two PCs (p < 10−3), we calculated the Jaccard similarity index based on the Euclidean distance between each outcome, as calculated using the nearest neighbor approach (i.e. the straight-line distance between outcomes within the parameter space). To identify communities of outcomes that are capturing similar components of the neurovascular response, we then applied the Louvain clustering algorithm to this data, where we found 17 distinct clusters within the parameter space (Figure 3(a) and (b)). No clusters had less than 10 outcome measures within them. To examine the characteristics of these 17 clusters, we tested each cluster for the relative representation of specific components of the neurovascular response using an enrichment analysis (Figure 3(c)). There were three clusters preferentially enriched for peak metrics (p = 2.06e−07, 3.24e−05 and 1.28e−02). Five clusters were highly enriched for metrics related to time to peak (p = 2.47e−15, 4.78e−12, 3.09e−04, 4.71e−06, and p = 1.55e−17). Two further clusters were enriched for outcomes related to pulsatility (p = 2.88e−16 and 3.35e−08). The eight remaining clusters were enriched for each of the components of the model systems approach, 25 or non-discrete. Overall, the divergent but complementary nature of these outcomes supports our understanding of the heterogeneity within the response to neurovascular coupling. Motivated by these results, we sought to next determine the stability of these outcomes within individuals, and across individual datasets.
Within-participant principal component analysis reveals stable outcome measures
Principal component analysis applied within an individual provides an opportunity to examine the ability for a specific outcome measure to be highly correlated to the first principal component (i.e. identify the specific outcome measure explaining the greatest amount of variance of all the metrics of neurovascular coupling) across numerous trials. Using this approach, we applied a majority-voted algorithm to detect outcome measures that are stable both within an individual, and also across our entire dataset. Principal component analysis was applied to each individual and the loadings (i.e. the correlation of each individual outcome to the first principal component) extracted. We used a majority voting classifier to identify outcome measures that explained a large amount of variance of the first principal component in the majority of individuals. To be “majority voted”, outcome measures were required to correlate to the first PC ≥ 0.5 in > 50% of individuals. Majority voted outcome measures were then ranked according to their mean correlation to the first PC, across individuals (Figure 3(e)). This approach allowed us to identify a group of outcome measures that (1) together capture the variability within the neurovascular coupling response, and (2) are stable both within and across individuals. We found that traditional markers of the neurovascular response (i.e. peak, area under the curve, time to peak) were highly (mean loading 0.6–0.7) and similarly stable. The traditional marker of peak percent change in posterior cerebral artery mean velocity was found to be the top ranked metric, suggesting it is a highly consistent outcome within and between individuals. However, our approach also implies that peak change should be considered not just over the traditional 30 s, but also within the final 10 s of the response as a further method to ensure the robustness of results. Furthermore, our data indicated the maximum derivative during the first 10 s of stimulus is a highly consistent variable to characterize the rapidity of the response, in addition to traditional metrics such as “time to peak”.
Majority-voted outcome measures reveal further changes across experimental groups
We next determined if the outcome measures identified using our network analysis effectively detected differences in neurovascular coupling between people with and without spinal cord injury (who are known to have impairment in the neurovascular coupling response; See Supplementary Table 2 for demographics of included participants in this comparison).7,8 We further examined the outcome measures between sexes and across the life-span. When considering individuals with spinal cord injury, we found that they differed over four clusters (ID 5, 10, 11, 12) compared to able-bodied individuals. The top variables in two of these clusters (ID 10 and 12) captured the impaired peak response observed in individuals with spinal cord injury. Two additional clusters (ID 5, 11) captured the impaired rate of response, and were both found to be enriched for measures of time to peak (Figure 3(f)). No differences in the model systems clusters were noted. Focusing on our majority-voted outcome measures identified in the previous section, all top metrics from each of these four clusters (ID 5, 10, 11, 12) were significantly different between groups (top 3 metrics plotted; Figure 3(f)), indicating consensus differences in these cluster majority-voted outcome measures across clinical populations. Importantly, we observed group differences in the rate of the neurovascular response following a visual stimulus, which is apparent upon observation of the mean responses (Figure 2(a)), but missed by traditional metrics (Figure S2(b)). Similar to traditional metrics, we did not observe any differences between males and females in our large dataset. When considering older versus younger individuals, we found that top metrics within one cluster (ID 3) highly enriched for non-traditional metrics of pulsatility were significantly different (Figure 3(g)), indicating that our majority-voting metrics are able to reveal differences potentially missed by traditional metrics alone.
We next reduced the dimensionality further, and calculated an eigenvalue from only our majority-voted measures within each of the key clusters identified (IDs 3, 5, 10, 11, 12). Based on the variables highly enriched in each cluster and the integrated computational pipeline to identify these summary metrics, we have termed the variables (i.e. eigenvalues) from each cluster as iAmplitude
1
, iAmplitude
2
, iRate
1
, iRate
2
, and iPulsatility. These clusters provide rich information about the neurovascular coupling responses that are complementary between each other. For example, iAmplitude
1
is computed from traditional metrics such mean peak percent change, while iAmplitude
2
is computed from non-traditional metrics such as mean percent peak change 5 s following eyes closing. We tested whether these eigenvalues were different between groups (i.e. spinal cord injury, sex, and age) for each cluster (see Extended Supplementary Methods). We found that all four cluster summary statistics detected significant differences between able-bodied individuals and individuals with spinal cord injury (Figure 4). In terms of power, we found that iAmplitude
1
and iAmplitude
2
both exceeded the traditional measure of peak response (i.e. posterior cerebral artery mean peak percent change) in effect size (Cohen's D = 0.76 (iAmplitude
1
) and 0.88 (iAmplitude
2
) vs. 0.68 (traditional). Thus, we suggest these summary metrics quantify characteristic differences in the neurovascular coupling response by leveraging the reduced dimensionality across stable outcome measures. When considering younger and older adults, we found that iPulsatility detected significant differences (Figure 4), whereas traditional metrics of pulsatility did not (Figure S2). Put together, our majority-voted outcome measures capture the key features within the neurovascular coupling response identified through clustering, and are able to sensitively detect differences between cohorts. Therefore, we suggest that these cluster summary metrics provide a powerful complementary line of evidence, in addition to traditional measures, to richly characterize the neurovascular coupling response.
(a) Cluster summary statistics summarise outcome measures further, and (b) reveal differences between able-bodied (AB) individuals, and those with spinal cord injury (SCI) for iAmplitude
1
(p = 0.030, one-tailed t-test) and iAmplitude
2
(p = 0.021, one-tailed t-test), iRate
1
(p = 0.043, one-tailed t-test), and iRate
2
(p = 0.013, one-tailed t-test). (c) Furthermore, we found that iPulsatility was significantly different between older and younger individuals (p = 0.0001, one-tailed t-test). Abbreviations: PC: principal component.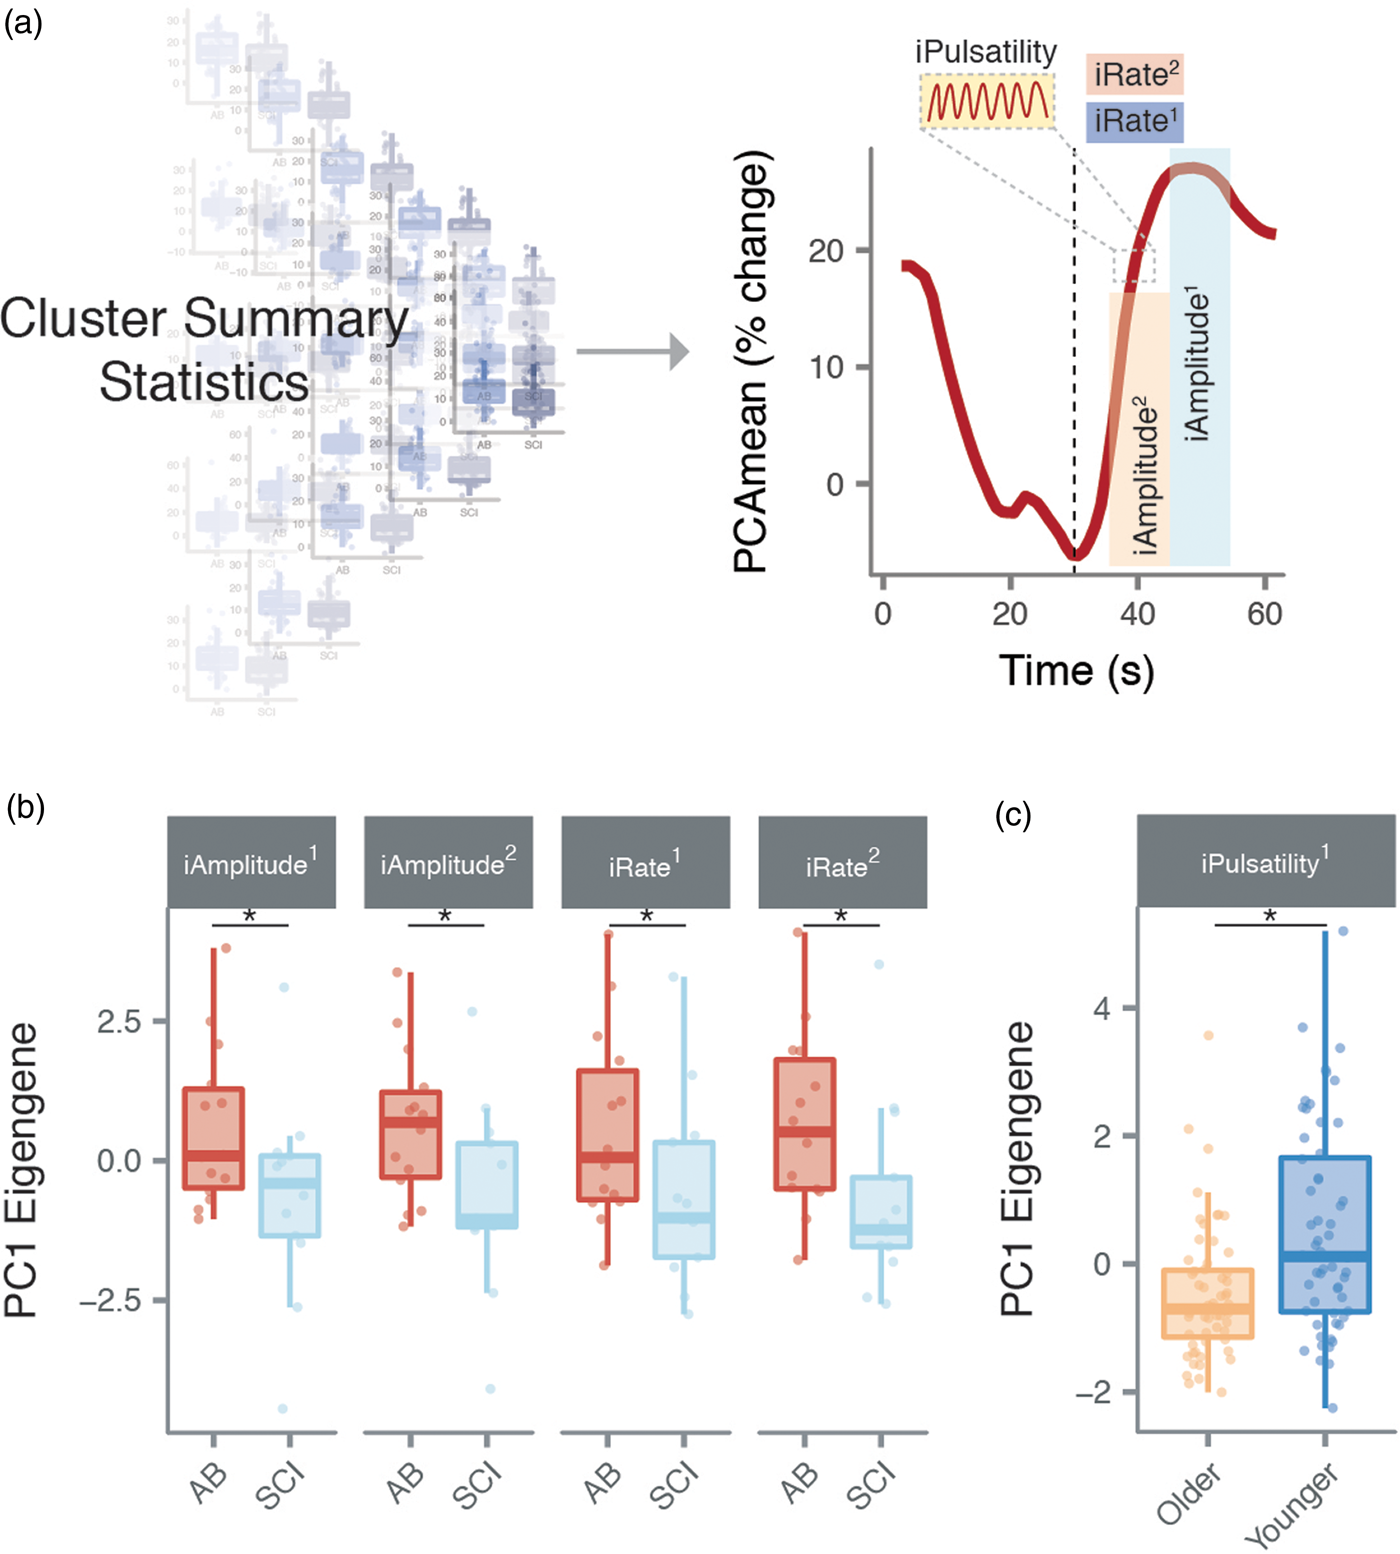
Discussion
Here we used a network-based approach including commonly known neurovascular coupling metrics to identify powerful and consistent outcome measures capable of characterizing the neurovascular coupling response in humans. We harnessed a combination of dimensionality reduction, community-based clustering, and majority-voting to identify stable metrics, that also explain the majority of variance within the largest-known neurovascular coupling data set, and detect differences across clinical populations. We also utilized this approach to generate powerful new metrics of neurovascular coupling that are largely representative of specific components of the response and increase our ability to capture differences between populations.
Since first being clearly described in the early 2000s, basic and clinical interest in the function of the neurovascular unit has increased dramatically. Widespread assessment of neurovascular coupling in humans is starting to occur; however, until now there has not been empirical evidence regarding which of the more than 100 metrics should be targeted to provide powerful and consistent insight into the neurovascular coupling response. It is our aim that the metrics we identified through our computational pipeline will allow widespread congruous investigation into human neurovascular coupling. Further work in human models is needed to understand the clinical utility of assessing neurovascular coupling, and understanding the underlying mechanisms. Our novel neurovascular coupling metrics may provide a key step towards these goals. The use of these identified metrics may obviate (1) uncertainty regarding which metrics of neurovascular coupling allow the most robust and informative analysis, (2) the need to calculate a large number of outcomes to characterize the response, and (3) variability between centres and labs assessing neurovascular coupling.
We have previously shown that neurovascular coupling is impaired in individuals with spinal cord injury.7,8 We first repeat this finding by showing that traditional metrics of the peak response are impaired after spinal cord injury. Further, we demonstrate that individuals with spinal cord injury significantly differ from able-bodied individuals in key clusters related to both the amplitude of the response and rate of response (i.e. iAmplitude, iRate). That we did not observe differences in traditional measures of rate may indicate that these metrics are inherently more variable or inconsistent (Figure S3), and thus perhaps statistically not powered to find a difference between groups. Future work should aim to determine the physiological underpinnings to these potential limitations of current outcome measures. It is of particular note that the spinal cord injury assessments (as well as the accompanying able-bodied assessments used for comparison (n = 13; Supplementary Table 1) were made in the supine position, obviating orthostatically induced hypotension, which is known to (1) be common in individuals with spinal cord injury,30,31 and (2) impair vascular responsiveness to neuronal activation7,8 and hypercapnia. 32 It is therefore likely that the impaired neurovascular coupling response observed in the present data is driven by other factors than perfusion pressure alone, such as disruption to the sympathetic input to the cerebral circulation,33–36 and/or chronic inflammation and oxidative stressors, which are expected to impair neurovascular coupling across a range of pathologies and clinical conditions. 6 The level of neurovascular coupling in spinal cord injured individuals in the present study is higher than that previously reported by our group when the spinal cord-injured participants were in the acute phase of injury and tested in an upright position when blood pressure is dramatically reduced. 8
Our dataset extends previous findings that neurovascular coupling is impaired with age. 37 An iNVC metric (i.e. iPulsatlity) was capable of detecting declining neurovascular coupling from 18 years of age into the sixth decade of life. We observed that aging is associated with reduced pulsatile neurovascular responses but not mean flow responses. This finding builds upon previous work where relying solely on mean flow responses did not detect impaired neurovascular coupling occurring from the teenage years to early 60s. 38 However, age-related reductions in neurovascular coupling as measured by mean flow changes may become apparent in older cohorts than studied presently. 37 The etiology of reduced neurovascular coupling over the lifespan is not known, but is almost certainly comprised of a combination of reduced neuronal metabolism, impaired cerebrovascular responsiveness to neuronal and astrocytic stimuli, and vascular rarefaction.39–43
Our analysis consistently indicates that the rate of the neurovascular coupling response and changes in flow pulsatility are powerful outcome measures. The finding that the rapidity of the neurovascular response was a key outcome measure is intriguing as the early onset of hyperemia may be the result of neuron-to-vascular contractile cell communication relays not directly dependent on astrocytes. 44 This communication may occur through neuronal sources of nitric oxide, prostaglandins, and vasoactive intestinal peptides.45,46,47 On the other hand the steady-state maintenance of the change in blood flow may rely predominantly on astrocytic inter-communication.48,49 The implications of this are that neuron-to-vascular contractile cell communication relays are unique and important components of the neurovascular response which may not being routinely characterized in human neurovascular coupling studies using traditional outcome measures. Our analysis also reveals that pulsatility, which decreases as microvessels dilate during neurovascular coupling,50,51 provides rich information not characterized by traditional metrics. As guided by our conservative majority-voting approach, the inclusion of pulsatility in our age comparison allowed us to detect impairments in neurovascular coupling that were not detected with measures of peak change or rate of change. Impaired pulsatile neurovascular responses may indicate that microvessel responsiveness is affected to a greater extent as compared to larger upstream vessels.52–55 Together, using computational approaches validated with between-group comparisons, we show that amplitudinal changes in velocity, rapidity of velocity change, and pulsatile changes provide largely mutually exclusive and crucial insight into the neurovascular cascade.
Our analysis provides another step towards standardizing the quantification of neurovascular coupling in humans. However, much work is still needed to increase our understanding of the underlying mechanisms governing this response, and the early and late phases of the response, particularly in a human model. The described iNVC summary metrics may be important to standardizing future work examining the neurovascular coupling response in humans in health and disease, while also increasing statistical power by ensuring the measures used to determine potential disease states are stable within and across participants. Our empirically identified metrics of neurovascular coupling were capable of sensitively detecting impaired responses in both spinal cord injury and aging, providing a powerful tool for neurovascular coupling investigations. Further validation of these metrics is warranted in a prospectively collected experiment, to further demonstrate their clinical and mechanistic utility. Additionally, whether these metrics are useful to quantify hemispheric differences as well as changes across intracranial vessels still needs to be determined. We conclude that to characterize the neurovascular coupling response, studies should measure both mean velocity and pulsatility changes. Both peak changes and rate of change in the initial response should be evaluated. It should be considered that peak change over the latter phase of the response, and the maximum derivative over the first 10 s of the response are the most consistent between and within subjects. iNVC metrics (i.e. iAmplitude, iRate, iPulsatility) appear to further enhance insight into the neurovascular coupling response beyond traditional metrics.
Supplemental Material
Supplemental Material1 - Supplemental material for Network analysis identifies consensus physiological measures of neurovascular coupling in humans
Supplemental material, Supplemental Material1 for Network analysis identifies consensus physiological measures of neurovascular coupling in humans by Jordan W Squair, Amanda HX Lee, Zoe K Sarafis, Franco Chan, Otto F Barak, Zeljko Dujic, Trevor Day and Aaron A Phillips in Journal of Cerebral Blood Flow & Metabolism
Supplemental Material
Supplemental Material2 - Supplemental material for Network analysis identifies consensus physiological measures of neurovascular coupling in humans
Supplemental material, Supplemental Material2 for Network analysis identifies consensus physiological measures of neurovascular coupling in humans by Jordan W Squair, Amanda HX Lee, Zoe K Sarafis, Franco Chan, Otto F Barak, Zeljko Dujic, Trevor Day and Aaron A Phillips in Journal of Cerebral Blood Flow & Metabolism
Footnotes
Authors' contributions
All authors contributed to the conception the work. JWS, AHXL, ZKS, FC, OFB, ZD, TD, and AAP collected the data JWS, AHXL, and AAP conducted the analysis. JWS, and AAP interpreted the data. JWS and AAP drafted the manuscript. All authors approved the final version and agree to be accountable for all aspects of the work.
Funding
The author(s) disclosed receipt of the following financial support for the research, authorship, and/or publication of this article: JW Squair is supported by a Frederick Banting and Charles Best Canada Graduate Scholarship from the Canadian Institutes of Health Research and a Four-Year Fellowship from the University of British Columbia. The Phillips Lab is supported by Compute Canada, Natural Sciences and Engineering Research Council (Canada; Discovery Grant), the Canadian Institutes for Health Research (Project Grant), the Libin Cardiovascular Institute of Alberta, Hotchkiss Brain Institute, and Rick Hansen Institute. The laboratory of T. Day is funded by Mount Royal University President's Executive Committee Research Reserve Fund, and an NSERC Discovery Grant.
Declaration of conflicting interests
The author(s) declared no potential conflicts of interest with respect to the research, authorship, and/or publication of this article.
References
Supplementary Material
Please find the following supplemental material available below.
For Open Access articles published under a Creative Commons License, all supplemental material carries the same license as the article it is associated with.
For non-Open Access articles published, all supplemental material carries a non-exclusive license, and permission requests for re-use of supplemental material or any part of supplemental material shall be sent directly to the copyright owner as specified in the copyright notice associated with the article.