
Abstract
The coupling of cerebral blood flow (CBF) to neuronal activity is well preserved during evolution. Upon changes in the neuronal activity, an incompletely understood coupling mechanism regulates diameter changes of supplying blood vessels, which adjust CBF within seconds. The physiologic brain tissue oxygen content would sustain unimpeded brain function for only 1 second if continuous oxygen supply would suddenly stop. This suggests that the CBF response has evolved to balance oxygen supply and demand. Surprisingly, CBF increases surpass the accompanying increases of cerebral metabolic rate of oxygen (CMRO2). However, a disproportionate CBF increase may be required to increase the concentration gradient from capillary to tissue that drives oxygen delivery. However, the brain tissue oxygen content is not zero, and tissue pO2 decreases could serve to increase oxygen delivery without a CBF increase. Experimental evidence suggests that CMRO2 can increase with constant CBF within limits and decreases of baseline CBF were observed with constant CMRO2. This conflicting evidence may be viewed as an oxygen paradox of neurovascular coupling. As a possible solution for this paradox, we hypothesize that the CBF response has evolved to safeguard brain function in situations of moderate pathophysiological interference with oxygen supply.
A quick glance at basic numbers of oxygen and glucose delivery to the brain and cerebral energy metabolism suggests that the most delicate function of cerebral blood flow (CBF) is the delivery of sufficient amounts of oxygen to the tissue where the oxygen reserve is so low that ATP production declines almost immediately once blood flow ceases. Therefore, the intuitive explanation for the rapid and large CBF response to neuronal activation is the supply of the additional oxygen needed. Experimental observations of large CBF responses accompanying small increases of cerebral metabolic rate of oxygen (CMRO2), however, have cast doubt on this intuitive assumption. A number of alternative hypotheses may reconcile the seemingly conflicting findings: (1) A small increase of CMRO2 may only be possible with a large increase in CBF due to physical limitations of oxygen delivery. (2) The large CBF response may be necessary to ensure oxygen delivery to the areas most distant from blood supply. (3) The large CBF response may not be necessary in its full extent but may have evolved as a safety mechanism ensuring sufficient oxygen supply in situations where oxygen delivery to the brain is impaired. (4) The large CBF response may be necessary for reasons other than oxygen delivery.
In this opinion paper, we discuss studies on brain energy metabolism and neurovascular coupling. Based on the available evidence, we hypothesize that the surprisingly large CBF response to neuronal activation has evolved as a safety mechanism for oxygen delivery. To support this hypothesis, we first review basic facts on oxygen and glucose delivery to the brain, which strongly suggest that the CBF response primarily serves oxygen delivery. We then take a look on the discrepancy between CBF and CMRO2 responses to neuronal activation and models of oxygen delivery, which may explain this discrepancy. Subsequently, we discuss pathophysiological limits of oxygen delivery and studies that observed an uncoupling of CBF and CMRO2, both suggesting in contradiction to some models of oxygen supply that CBF operates with a considerable safety factor in many conditions, likely including the physiologic CBF baseline and physiologic CBF increases during neuronal activation. As this ‘safety factor hypothesis' is not compatible with regulation of CMRO2 by oxygen availability as has been suggested by previous research, we then review studies on oxidative phosphorylation to find out whether regulation by other mechanisms is plausible. Finally, we describe the significance of the brain tissue pO2 heterogeneity, determined in recent studies, in relation to our main hypothesis.
Most of the evidence discussed here was derived from experiments in cerebral cortex of mice, rats, or humans. Although other parts of the brain that have developed earlier in the evolutionary process also exhibit functional hyperemia, the structure of neuronal circuitry and details of neurovascular coupling mechanism differ considerably from the cortex. For some brain regions, only few studies have investigated blood flow and oxygen metabolism. A detailed discussion of differences between brain regions is beyond the scope of our article; therefore, we note that some of the principles discussed here may apply only to cerebral cortex but not to other brain regions.
RELEVANT BASIC NUMBERS OF OXYGEN AND GLUCOSE DELIVERY TO THE BRAIN TISSUE
In this first section, we will discuss in detail the basic numbers and mechanisms of oxygen and glucose metabolism in the brain and delivery to the brain, as quantitative knowledge of solubilities, concentrations, metabolic rates, diffusion constants, diffusion distances, etc. form the basis for generating hypotheses on the function of neurovascular coupling. Our considerations will lead us to the main conclusion that the brain's supply with oxygen is much more delicate than its supply with glucose pointing to the fact that the rapid adjustment of CBF has evolved to adjust oxygen rather than glucose delivery.
Brain activity, especially synaptic transmission, is highly energy demanding and the brain generates the majority of its ATP via oxidative metabolism of glucose.1, 2 The oxygen–glucose index of the brain is close to six in the resting state,3, 4 thus the brain consumes, on average, six molecules of oxygen per molecule glucose. The high-energy demand generates the need for a large amount of oxygen delivered via the blood stream. As the oxygen solubility in water is very low, a transport molecule, hemoglobin, increases the oxygen content of arterial blood from 150 nmoL/mL dissolved in plasma to around 9,000 nmoL/mL at physiologic arterial oxygen saturation. Even with almost half of the blood volume devoted to oxygen transporting red blood cells (10% of the cardiac workload at rest required to pump oxygen transport molecules through the brain), the number of oxygen molecules in the arterial blood exceeds the number of glucose molecules by only a factor of 1.5 (physiologic glucose concentration around 6,000 nmoL/mL). As the brain extracts six molecules of oxygen per molecule glucose the proportion of oxygen extracted from the blood during capillary passage through the brain tissue (oxygen extraction fraction) largely exceeds the proportion of glucose extracted. Under physiologic conditions, oxygen extraction fraction is around 30% to 50%5, 6 whereas glucose extraction fraction is only around 10%. 6
Oxygen Diffusion to the Brain Tissue
Oxygen is transported from microvessels to the brain tissue by diffusion. The speed of this transport is determined by the oxygen conductivity of the brain tissue, the specific value of which is difficult to interpret intuitively. A simplified description of the diffusion process is provided by the Krogh–Erlang equation. 7 The Krogh–Erlang equation relates vascular geometry (radius of a central capillary and radius of the tissue cylinder supplied by this capillary), oxygen diffusion properties of the tissue, and oxygen metabolism to the oxygen gradient from capillary to tissue. Applied to the brain, it enables a simplified calculation of the oxygen gradients necessary to support a given CMRO2 (Figure 1). Krogh developed the model for tissue such as muscle, where the capillaries are organized as parallel tubes. In the brain, capillaries have a more disorderly orientation and the longitudinal pO2 gradient varies among capillaries due in part to capillary transit time heterogeneity (CTTH). 8 Hence, the Krogh model does not adequately describe oxygen delivery to the brain tissue. 9 The model assumes no diffusion of oxygen in and out of the tissue slice for which the equation describes oxygen supply and no diffusion across cylinder borders from adjacent cylinders within the slice. This likely occurs to a relevant degree in the brain tissue. However, no diffusion of oxygen out of slices with lowest oxygen occurs and sections through the brain suggest that intercapillary distances are not entirely random. Therefore, while underestimating the gradients present in high pO2 microregions with significant O2 flux out of the slice, the model still gives valuable rough information on the lower limit of oxygen gradients from capillary to tissue necessary to support a given CMRO2.
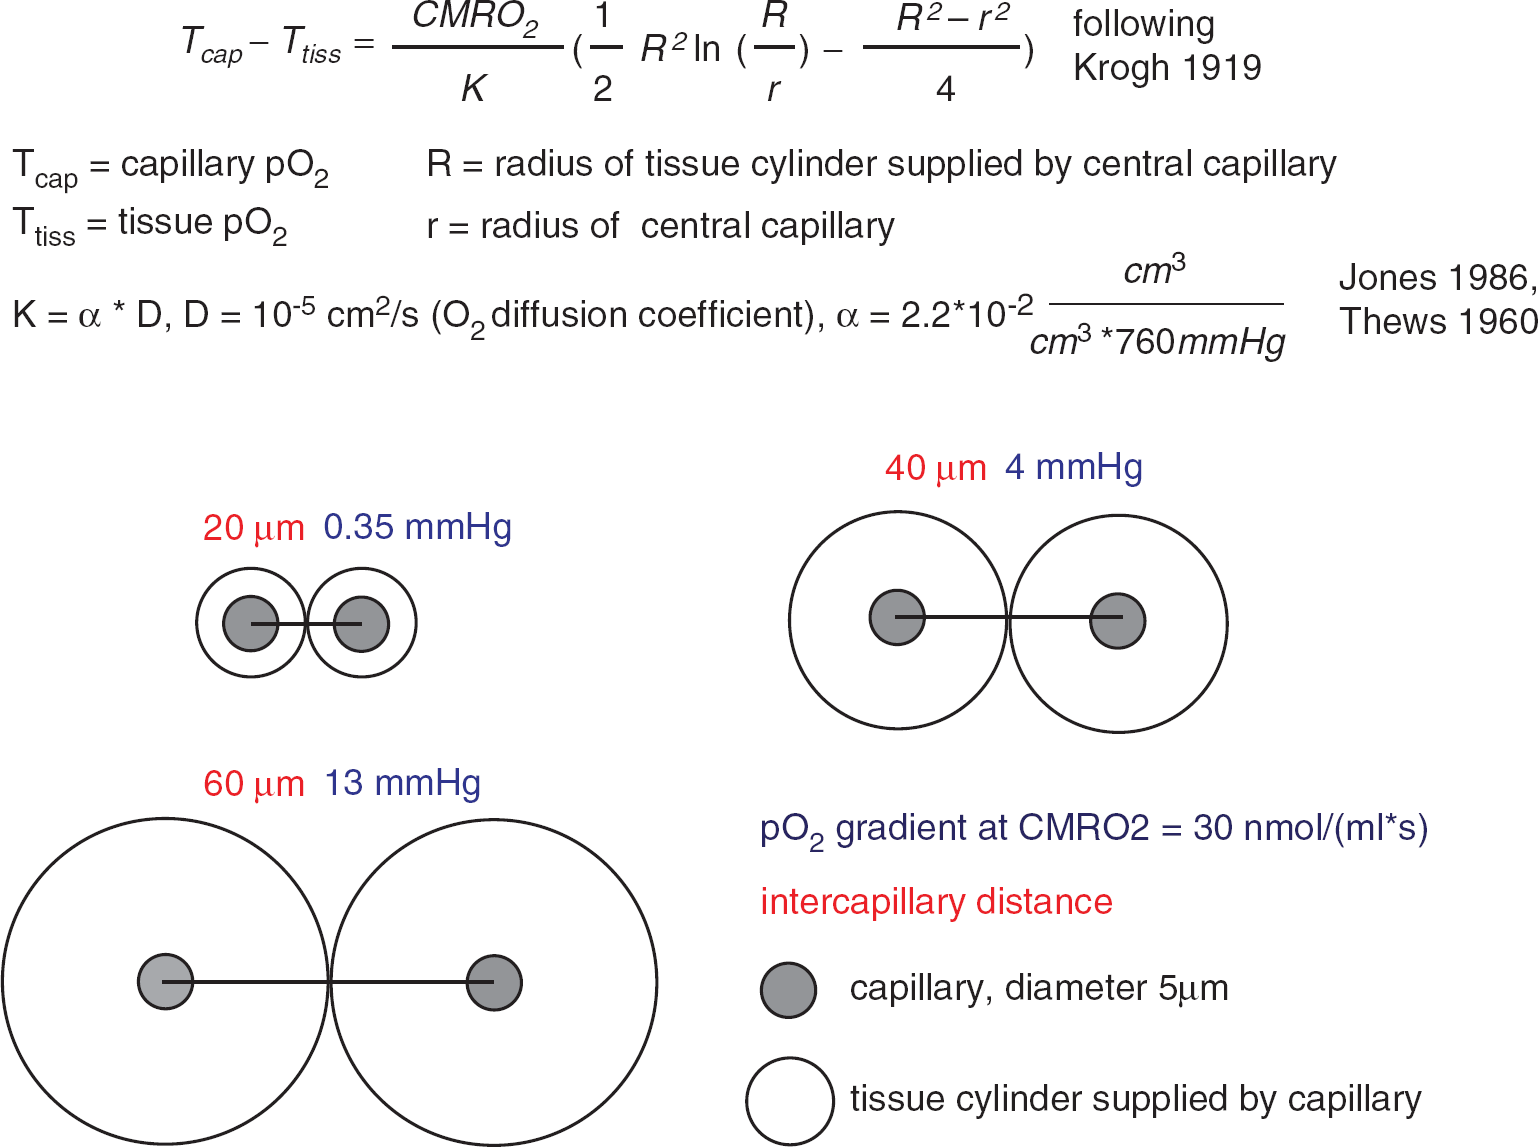
Calculation of pO2 gradients according to the Krogh model. Under the simplifying assumption of the Krogh–Erlang equation, 7 the pO2 gradients from the capillary surface to the border of the tissue cylinder are calculated, which would accompany a tissue oxygen consumption of 30 nmoL/(mL/second) at different intercapillary distances. Note that these gradients scale linearly with CMRO2. The cylindrical shape does not allow for perfect tissue coverage; therefore, the pO2 gradients into the ‘lethal corners' of the tissue will be a little larger. Diffusion of oxygen in and out of the tissue slice or across the border of the cylinder is not taken into account.
The average capillary oxygen tension in the brain is around 40 to 50 mm Hg.
10
The average brain tissue pO2 is around 20 to 30 mm Hg11, 12, 13, 14, 15 with little differences between species.
16
Tissue pO2 exhibits significant microregional variability, with considerably lower values in regions distant from microvessels with high pO2.12, 15 The extent of variability of tissue pO2 depends on the geometry of the vascular network, the density of capillaries, the metabolic rate of oxygen, and the capillary oxygen content. In the olfactory bulb, for example, where capillary density is high, intercapillary differences and ‘Krogh cylinders' are small. Parpaleix
Intracellular Oxygen Gradients, Critical Mitochondrial pO2
Tissue pO2 measurements are usually carried out with oxygen electrodes and sample average pO2 extracellularly within a considerably large sample volume. Thus, the question arises, whether there are significant oxygen gradients within the extracellular space and from there to the mitochondria, where oxygen is ultimately consumed. Mathematical modeling suggests that intracellular oxygen gradients depend on a number of factors such as the extent of mitochondrial clustering within cells but are probably small in the range of at most a few mm Hg.
21
Because of the lower fraction of free water within cells as compared with extracellular space, higher viscosity within the cells and diffusional barriers imposed by proteins, diffusion coefficients for small molecules such as oxygen are considerably smaller intracellularly
21
than extracellularly. In cardiomyocytes, an intracellular oxygen gradient of only 2 mm Hg has been determined over a wide range of extracellular pO2.
22
Vanderkooi
High-esolution
In summary, the oxygen gradient from the erythrocyte within the brain capillary to the mitochondrion in a nearby neuron or astrocyte enables oxygen delivery by diffusion with no relevant diffusion barriers for oxygen. The gradient depends on metabolic rate of oxygen and capillary density, which varies considerably between tissues. In the cerebral cortex, the minimum gradient required for the physiologic CMRO2 may be around 10 to 20 mm Hg.
Differences of Oxygen and Glucose Supply
In contrast to the muscle or heart, there are no significant amounts of oxygen storage molecules in the brain. Neuroglobin, a protein with oxygen-binding capacity with low P50 has been found in concentrations of less than 1 nmoL/mL in the cortex. 29 Significantly higher amounts (50 to 100 nmoL/mL), co-localized with mitochondria, have been detected in the retina, 30 which may indicate a role in oxygen supply in the retina.
At the average brain tissue pO2 of around 25 mm Hg11, 13, 15 and with no significant amounts of oxygen-binding proteins, the oxygen content of the brain is very low at around 30 nmoL/mL (oxygen solubility in brain tissue derived from reference 31 and references therein 31 ). In contrast, due to the high solubility in water, the glucose content of brain tissue under physiologic conditions is by far higher at around 1,000 to 4,000 nmoL/mL.32, 33, 34 The average CMRO2 is around 30 nmoL/(mL/s).4, 35, 36 Hence, the oxygen present in the brain tissue under physiologic conditions would sustain CMRO2 for only around 1 second, if supply from the blood stream would suddenly stop. 37 In contrast, the average brain metabolic rate of glucose (CMRGlu) is around one sixth of the CMRO2, 4 to 7 nmoL/mL per second.4, 36 Physiologic baseline CMRGlu could thus be sustained for several minutes, if the glucose supply would suddenly stop (but oxygen supply continue). 37
The physiologic blood flow response to increases in neuronal activity is very fast, initiated by an incompletely understood coupling mechanism involving several molecules, neurons, interneurons, 38 astrocytes, 39 endothelial cells, and possibly pericytes40, 41, 42 (the ‘neurovascular unit’), which signal changes in brain activity to nearby blood vessels in a feed-forward manner.43, 44, 45, 46 Cerebral blood flow increases within seconds after the onset of activation and a rapid decline follows the end of the stimulus. The CBF changes are paralleled by changes in oxygenation and blood volume.47, 48, 49, 50, 51, 52 The temporal dynamics of the CBF response thus suggest a close relation to oxygen rather than glucose availability.
Furthermore, the glucose extraction fraction of the brain is low, around 10%.6, 53 During neuronal activation as evoked by typical experimental paradigms, CMRGlu increases substantially, e.g. 30% to 50% in PET studies during visual stimulation.36, 54 With no concomitant CBF response, the extraction fraction would increase from 10% at baseline to 13% to 15% during stimulation and the average capillary glucose concentration would decrease by only 2% to 3%. When CBF increases match CMRGlu increases during neuronal activation, the extraction fraction of glucose and the average capillary glucose concentration remain constant. Because the transport of glucose depends on the concentration gradient between blood and tissue, even large increases in CBF do not relevantly change the delivery of glucose to the brain. Rather, in the physiologic CBF range with very low glucose extraction fraction, glucose delivery to the brain is largely determined by changes in the brain tissue glucose concentration and not by CBF changes. Based on a reversible Michaelis–Menten model of glucose transport, Choi
In contrast to the glucose concentration, CBF increases may relevantly increase the average capillary pO2 and thus oxygen availability for the brain, because the resting oxygen extraction fraction is around 30% to 50%. This fundamental difference for oxygen and glucose delivery is further enhanced by hemoglobin: A 30% oxygen extraction fraction corresponds to a 60% drop in the pO2 (from 100 mm Hg in arteries to around 40 mm Hg in veins, depending on the exact shape of the oxygen-binding curve). As discussed in more detail below, the situation may change during hypoxia, e.g. at high altitude: Within the steep part of the oxygen-binding curve and at high hematocrit, substantial amounts of oxygen may be delivered to the brain with only small accompanying changes of blood pO2 during the capillary passage.
Table 1 gives an overview of key numbers of oxygen and glucose delivery to the brain. We have converted some of the commonly used units (e.g. from mL/(100 g/minute) to nmoL/(mL/second)) to facilitate comparison of concentrations and metabolic rates. In a recent review article, Buxton 37 put forward similar numbers on oxygen and glucose delivery and metabolism to conclude that the blood flow response serves the supply of the brain with oxygen and not with glucose. Waste products of brain energy metabolism, such as lactate,57, 58 CO2, or heat59, 60 have a role in neurovascular coupling, but experimental data61, 62 and calculations of the quantitative effects 37 (as carried out for oxygen and glucose in detail above) argue against the assumption that the CBF response primarily serves to remove these waste products from brain tissue.
Key numbers of oxygen and glucose delivery to the brain
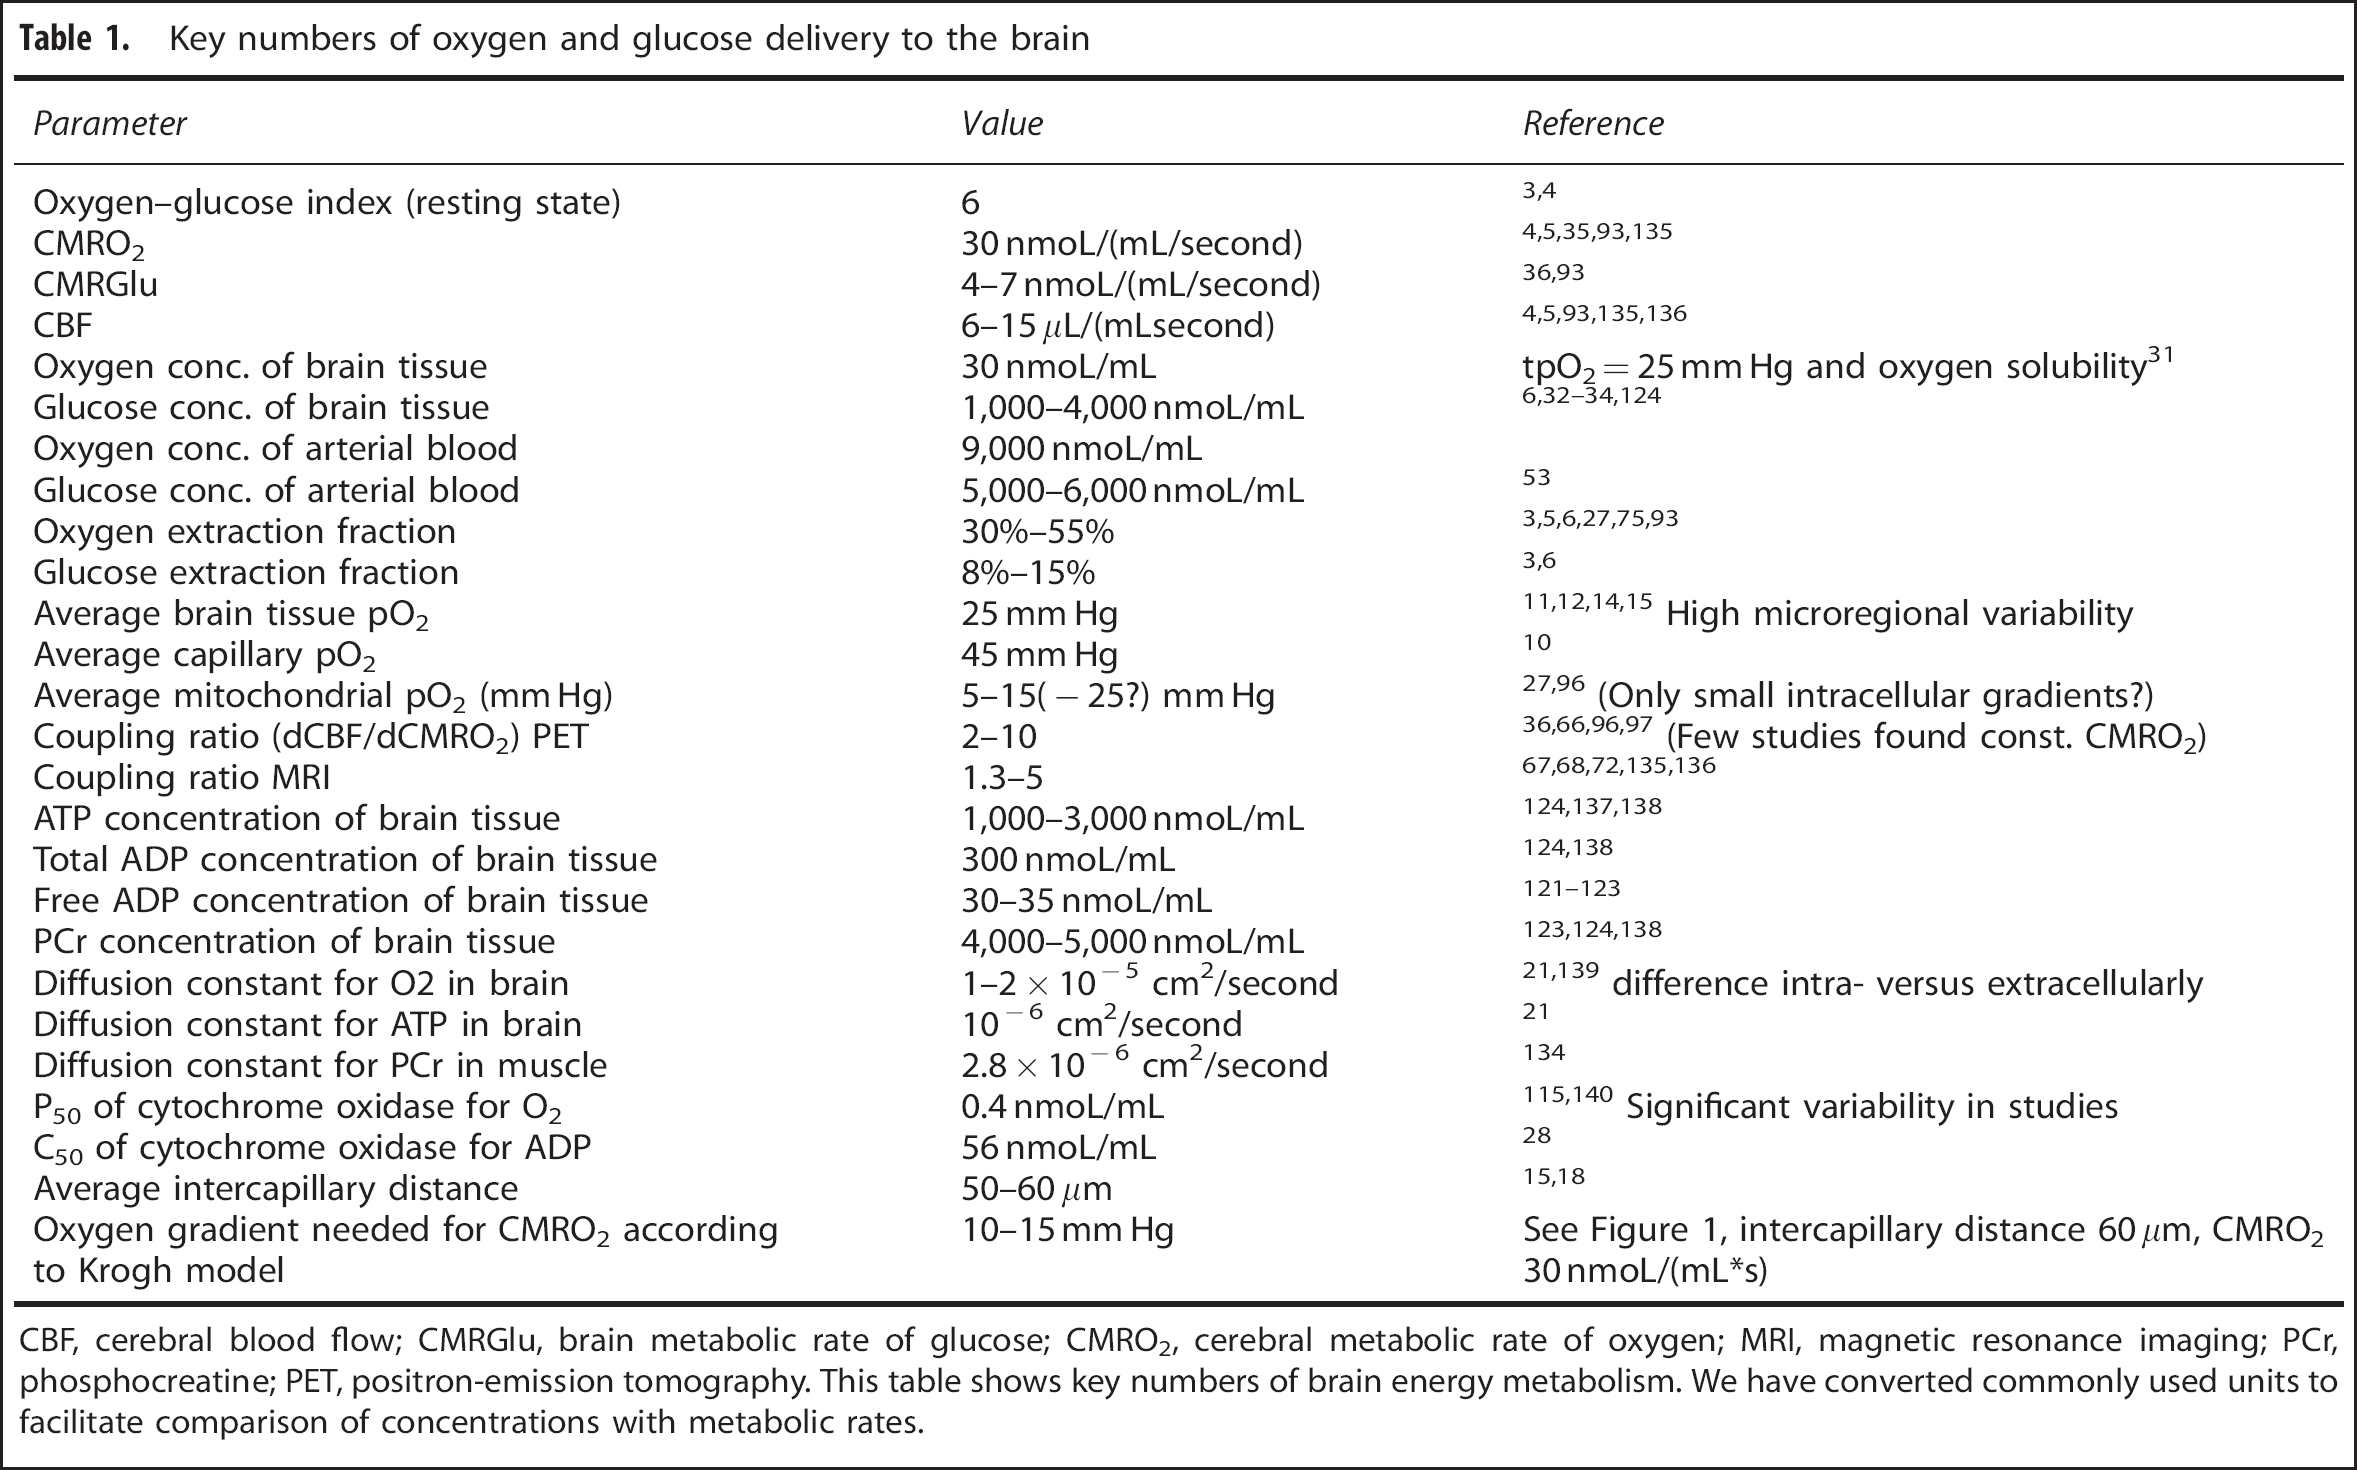
CBF, cerebral blood flow; CMRGlu, brain metabolic rate of glucose; CMRO2, cerebral metabolic rate of oxygen; MRI, magnetic resonance imaging; PCr, phosphocreatine; PET, positron-emission tomography.
This table shows key numbers of brain energy metabolism. We have converted commonly used units to facilitate comparison of concentrations with metabolic rates.
Cerebral Blood Flow Regulation by Oxygen?
An intuitive consequence of the facts mentioned above is the hypothesis that a feedback mechanism exists, which senses the tissue pO2 and consequently transmits a signal to the vasculature such that CBF is adjusted to maintain a constant pO2. Evidence for such a mechanism has been found in brain slice experiments demonstrating a switch from vasoconstrictory to vasodilatory signaling of astrocytes when lowering oxygen concentration in the slices.
63
However, in an environment of 100% oxygen at 3 to 4 atmospheres of pressure, when tissue pO2 is largely elevated and the brain oxygen supply provided entirely by oxygen dissolved in plasma, we found no change in CBF responses to neuronal activation,
64
arguing against a role of an oxygen sensing mechanism for physiologic neurovascular coupling
CEREBRAL BLOOD FLOW AND CEREBRAL METABOLIC RATE OF OXYGEN RESPONSES TO NEURONAL ACTIVATION
As some of the findings discussed above were known at that time, the first concurrent CBF and CMRO2 measurements during neuronal activation in the mid 1980s came as a big surprise. Although CBF increased largely upon visual and somatosensory stimulation, a CMRO2 increase was barely detectable.36, 66 The ratio of relative CBF increases divided by relative CMRO2 increases has been termed coupling ratio. 37 Later, magnetic resonance imaging (MRI) experiments indicated a lower coupling ratio of 2 to 467, 68, 69, 70 (as opposed to 6 to 10 as measured in the early PET experiments and other PET studies, that not even found a CMRO2 increase at all 71 ). However, CMRO2 determination is challenging both with PET and MRI 37 and some recent MRI studies also found comparably high coupling ratios with a refined MRI methodology, 72 confirming the counterintuitive observation that CBF increases much more than CMRO2 during a wide variety of increases in neuronal activity. The discrepancy between large CBF and small CMRO2 responses leads to a hyperoxygenation of the activated brain area with a decrease in deoxyhemoglobin and provides the basis for blood–oxygen-level-dependent (BOLD) functional magnetic resonance imaging.73, 74
MODELS OF OXYGEN DELIVERY: OXYGEN DIFFUSION LIMITATION AND CEREBRAL BLOOD FLOW RESPONSES
An explanation why large CBF responses could be necessary to support small increases in CMRO2 was provided by Buxton and Frank in 1997.
75
The Buxton and Frank model assumed constant diffusivity of oxygen in the absence of capillary recruitment
76
and complete metabolism of the oxygen entering brain tissue. The model predicted that CBF had to increase much more than CMRO2, because the CBF increases are accompanied by decreases in mean transit time and thus decreases of the oxygen extraction fraction. This elegantly resolved the apparent discrepancy between large CBF responses and small CMRO2 responses. Hyder
Although these models provide important insight into the relationship between CBF and CMRO2, key components such as diffusivity of oxygen, exact mitochondrial oxygen tension, and the relationship of mitochondrial oxygen tension with CMRO2 are difficult to measure
IS THE PHYSIOLOGIC CAPILLARY PO2 A PREREQUISITE FOR BRAIN FUNCTION?
Although it is important to keep in mind potential changes of capillary surface area, CTTH and other factors that may influence the CBF–CMRO2 relationship, it is also worthwhile taking a look on the limits of the main driving force of oxygen delivery to the brain: The gradient between capillary and mitochondrial oxygen tension. Grocott
Collectively, these data indicate that the physiologic average capillary pO2 of 40 to 50 mm Hg is not a prerequisite for brain function and physiologic CMRO2, at least within short term. It should be noted, however, that because of the steep slope of the oxygen-binding curve at low pO2, a large amount of oxygen can be offloaded within a narrow pO2 range during the capillary passage (this is further enhanced by increases in hemoglobin content and a left shift of the binding curve at high altitude). Hence, under these conditions, the average capillary pO2 drops dramatically, but the pO2 at the venous end of the capillary and the tissue pO2 in the ‘lethal corners' drop probably much less. Still, these data indicate that the lower limit of arterial pO2 for grossly intact brain function lies in the range of 20 to 30 mm Hg, probably indicating a limit of pO2 at the venous end of the capillary somewhere around 15 to 20 mm Hg. This fits well with the theoretically calculated oxygen gradients using the Krogh–Erlang equation and published values for CMRO2, oxygen diffusivity, and intercapillary distances (Figure 1). We stress that these observations indicate oxygen delivery limits for overall CMRO2 and gross brain function on short term, but do not consider more subtle short-term neuropsychological effects or more deleterious long-term effects of these extreme levels of hypoxia, which may arise as a consequence of limitation of important cellular reactions that become limited at higher pO2 levels but do not contribute relevantly to the overall CMRO2. This may have a role, for example, in diseases that affect small brain vessels. Evidence accumulates that dysfunction of the neurovascular unit has a role in Alzheimer's disease and stroke/small vessel disease and impairment of neurovascular coupling may be part of this dysfunction.80, 81, 87, 88 It can be speculated that impaired neurovascular coupling could lead to repeated drops in tissue pO2 upon neuronal activation with initial short-term preservation of normal neuronal function but induction of inflammatory pathways that ultimately lead to long-term tissue damage. 80 However, no disease affects neurovascular coupling specifically while leaving baseline CBF, capillary morphology, endothelial function, etc. intact. Therefore, it will be challenging to dissect and quantify the contribution of selective neurovascular coupling impairment in disease progression.
SAFETY MARGIN OF OXYGEN DELIVERY SUGGESTED BY UNCOUPLING OF CEREBRAL BLOOD FLOW AND CEREBRAL METABOLIC RATE OF OXYGEN
As oxygen supply of the brain is so delicate, it seems likely that evolution has favored an oxygen delivery system that does not fail once a minor dysfunction of one of its many components occurs. In general, evolution balances costs and advantages of safety factors. 89 As regional large increases in CBF during functional activation are not accompanied by significant increases of whole brain CBF, 57 the costs in terms of increased workload of the heart to provide the additional CBF of a generous CBF response to neuronal activation are low. Thus, a large CBF response could have developed during evolution, even if the potential advantage for the brain may be small. Furthermore, the load applied to the system (changes in CMRO2 during neuronal activation) as well as the capacity of the system (additional O2 delivery via the blood stream during activation) may vary between different types of neuronal activation and between individuals. A relevant genetic variability may exist of receptors, channels, and enzymes involved in the complex interplay between changes in neuronal activity, metabolism, and CBF. As CBF increases are not directly coupled to changes in pO2, 64 the feed-forward mechanisms coupling neuronal activity and CBF may have evolved with a safety factor that ensures CBF levels sufficient even in individuals with an unfavorable combination of genes that lead to rather large CMRO2 responses but small CBF responses.
If a safety factor for oxygen delivery to the brain exists, to some degree independent changes of CBF and CMRO2 with either CBF decreases at constant CMRO2 or CMRO2 increases with constant CBF should be possible.
UNCOUPLING OF CEREBRAL BLOOD FLOW AND CEREBRAL METABOLIC RATE OF OXYGEN
In their seminal 1986 PNAS paper, Fox and Raichle 66 used the term ‘focal physiological uncoupling’ to describe the phenomenon that CBF increased much more than CMRO2 during neuronal activation. Later, it has been pointed out by Buxton and Frank 75 that the large CBF increase may in fact be necessary for a small CMRO2 increase because of the physical properties of the brain tissue (oxygen limitation model, see above). Following this argument, physiologic neurovascular coupling including a capillary pO2 increase during activation could be termed ‘tight’ and in this sense, the positive BOLD signal that forms the basis of functional imaging as well as the negative BOLD signal observed during stimulus evoked reductions of neuronal activity,90, 91 e.g. ipsilaterally to somatosensory stimulation or in ‘surround’ regions of focal activation, could also represent ‘tight coupling’ of CBF and CMRO2.
Following this line of thinking, ‘uncoupling’ of CBF and CMRO2 could be demonstrated more convincingly by studies, which find, to some extent, independent variations of CBF and CMRO2. In the following section, we will review these studies. We think that the most conclusive evidence can be derived from studies, which combine measurements of CBF and CMRO2 in at least two different experimental states of one brain region. Experimental manipulations used include substances interfering with neurovascular coupling (e.g. indomethacin, caffeine), hyperventilation, and variations of stimulus paradigms.
For example, indomethacin decreased CBF in healthy volunteers by around 25% to 40% with constant or minimally reduced CMRO2.26, 92 Hyperventilation reduced CBF in healthy controls and meningitis patients significantly (by around 30%), but CMRO2 remained constant. 93 Caffeine increased CMRO2 by 20% while decreasing CBF by 25% in moderate caffeine consumers who abstained from coffee for at least 12 hours. 67 The CMRO2 levels found during neuronal activation before caffeine administration were equal to baseline CMRO2 values after caffeine, which were supported by a 20% lower CBF. In another study, caffeine decreased CBF by 35% with a non-significant +5% change in CMRO2. 94 Reductions of CBF by 15% accompanied by increases in CMRO2 by 8% were observed after cortical spreading depression in rats. 95
Several functional activation studies indicate that CBF may be considerably above the level needed to support CMRO2 during a variety of specific stimulus conditions. After 10 minutes of continuous finger tapping, CBF remained elevated by 20% to 25% as compared with the resting state, but CMRO2 decreased below the baseline in a PET experiment on healthy volunteers.
96
During continuous visual stimulation, Mintun
Several groups have found transient decreases of tissue oxygen concentration,11, 101, 102, 103 deoxyhemoglobin increases or BOLD signal decreases,48, 52, 104 or decreases of vascular pO217, 105 during the first second(s) of neuronal activation, when CBF has not yet significantly increased, indicating the possibility of increased CMRO2 with constant CBF on very short term. However, this ‘initial dip’ has not been detected in all studies106, 107, 108 and methodological issues remained owing to the complexity of the methods employed.
During partial pharmacological inhibition of CBF responses (attenuated by around two-thirds) and with constant baseline CBF, we found constant CMRO2 responses to neuronal activation in the somatosensory cortex of rats.
109
In the cerebellum, Offenhauser
Collectively, these studies demonstrate that under a variety of conditions, most likely including the physiologic baseline, CBF is higher than needed to support CMRO2. This provides evidence against the hypothesis that a disproportionately large CBF response is a prerequisite for a small increase in CMRO2 during neuronal activation. In contrast, these data suggest that oxidative metabolism can increase within limits without a concomitant CBF increase.
THE OXYGEN PARADOX OF NEUROVASCULAR COUPLING
The low oxygen reserves in brain tissue compared with high glucose reserves and the almost exclusive ATP production via oxidative phosphorylation suggest that the rapid CBF response serves oxygen delivery. The uncoupling data reviewed above could thus be interpreted as an ‘oxygen paradox of neurovascular coupling’: basic physiologic numbers and facts of energy supply to the brain reviewed in detail above indicate that the role of the CBF response is oxygen delivery, but accumulating evidence from recent studies suggests that it is not needed (at least not in its full extent and on short term) for oxygen delivery. As argued above, one possible explanation in terms of ‘ultimate causation’ 89 is a safety margin function. That is, because oxygen delivery is so delicate, it is too dangerous for the brain to operate at a CBF level that does not allow increases in CMRO2 without perfect neurovascular coupling.
Has Neurovascular Coupling Evolved to Keep Tissue pO2 Constant?
An alternative perspective using a similar explanation has been suggested in a recent review. In this review, Buxton
37
notes that although CBF increases much more than CMRO2, there is little change in tissue pO2. Thus, the CBF response may have evolved to keep average tissue pO2 constant during variations of neuronal activity. Keeping average tissue pO2 constant could serve to maintain oxygen-dependent reactions other than ATP production that operate at a considerably higher P50 and are thus more susceptible to reductions from baseline levels. Another slightly different theory developed by Devor
REGULATION OF OXIDATIVE PHOSPHORYLATION AND NONZERO MITOCHONDRIAL PO2
In order to gain a more detailed understanding of whether O2 availability (in the ‘lethal corners' of brain tissue) limits ATP production, we will discuss studies on the regulation of brain oxidative phosphorylation in the following paragraph. Although many details remain unknown to date, the available evidence suggests that at the pO2 levels observed in the brain, regulatory mechanisms other than O2 availability are involved to a substantial degree.
Nerve cells need to rapidly adjust ATP production to demand, which fluctuates with the cells signaling activity. The vast majority of ATP is used for signaling and it is likely that almost the entire short-term fluctuation of CMRO2 is due to changes in signaling activity 113 so that CMRO2 is closely linked to neuronal activity. It seems unlikely that the way developed during evolution to accomplish the adjustment of ATP production to neuronal activity is the detour of first increasing CBF, which then ‘passively’ drives an increased ATP production by increased oxygen delivery. Such a regulation would introduce a high vulnerability of brain function depending totally on intact neurovascular coupling. A combination of regulatory mechanisms may be more safe and effective, separately adjusting CMRO2 and ATP production first and then CBF generously to safeguard oxygen delivery when the amplitude of the CMRO2 increases cannot be exactly predicted or measured by the coupling mechanisms.
Cerebral metabolic rate of oxygen depends, among other factors, on mitochondrial pO2 as well as the dynamics of the respiratory cascade for oxygen (
In the following, we will discuss mechanisms of CMRO2 regulation at the mitochondrial level other than O2 availability. A number of potential mechanisms have been proposed. Several are probably involved at the same time.116, 117 An obvious candidate mechanism is regulation by ADP availability,118, 119 which has been termed the ‘first mechanism of respiratory control’.
120
Magnetic resonance spectroscopy measurements of free ADP concentrations
ATP has been found to act as an allosteric inhibitor of cytochrome c oxidase.
126
This allosteric inhibition could increase the p50 of the respiratory cascade for oxygen and thus reduce ATP production at a given mitochondrial pO2 when energy requirements of the cell are low and ATP accumulates (in addition to the effect of reduced ADP availability under these conditions). Acin-Perez
Nitric oxide has been demonstrated to inhibit cytochrome c oxidase. 128 A reduction of NO levels accompanied by reduced cytochrome c oxidase inhibition during decreases in CBF could thus explain constant CMRO2 whereas pO2 gradients could be maintained despite increased oxygen extraction fraction by a decrease in mitochondrial pO2. 26 However, during neuronal activation, NO levels increase (participating in neurovascular coupling 129 ) and thus this mechanism does not explain CMRO2 increases with constant CBF, e.g. during the first second of neuronal activation.
Several mechanisms have been identified by which changes in cellular Ca2+ concentration influence oxidative phosphorylation.130, 131 As neuronal activity is accompanied by transient increases in intracellular calcium, this would represent a rapid link between neuronal activity and oxidative phosphorylation. However, in the cerebellum, CMRO2 changes during climbing fiber stimulation remained unchanged when stimulus-induced increases in intracellular calcium were pharmacologically reduced. 102
The complex interplay of processes involved in the regulation of oxidative phosphorylation remains incompletely understood. Nevertheless, it seems likely that factors other than oxygen availability are involved in the control of CMRO2 and may adjust ATP supply rapidly and independently of CBF within the limits set by oxygen delivery.
THE SIGNIFICANCE OF HETEROGENEOUS TISSUE PO2 IN THE BRAIN
In this section, we briefly discuss the relevant heterogeneity of brain tissue pO2 detected in recent studies as a potential limitation when interpreting studies that measure average CBF and CMRO2. Because of limited spatial resolution of measurements of molecules relevant for brain energy metabolism and because of the complexity of modeling heterogeneities within small tissue regions, research on brain energy supply has focused on average values. It has recently been demonstrated experimentally in fine detail,12, 20 however, that oxygen concentration is highly heterogeneous in the brain. Keeping in mind the low intracellular oxygen gradients,21, 22 the oxygen measurements implicate high variability also of mitochondrial pO2. Mitochondria located close to diving arterioles may operate at a pO2 as high as 60 mm Hg, whereas those supplied by venous ends of capillaries in ‘lethal corners' of the tissue may have pO2 around 5 to 10 mm Hg. It is very likely that ATP production is not limited by oxygen availability for mitochondria located in the areas of higher oxygen concentration. It could still be, given the potentially very low P50 of the respiratory cascade for oxygen, that from the physiologic baseline even the mitochondria with lowest pO2 may increase their ATP production despite a further decrease in pO2. At the venous end of capillaries, pO2 of around 40 mm Hg has been determined on the brain surface with oxygen electrodes. 10 However, a considerable variability was also detected with pO2 as low as 20 mm Hg on the surface of some vessels. High-resolution three-dimensional oxygen measurements using phosphorescence quenching indicate substantial variability with pO2 as low as 20 to 30 mm Hg at the surface of microvessels with lowest oxygen content.12, 132 Hence, the concentration gradient between blood vessels and tissue areas with lowest pO2 may be around 15 to 20 mm Hg, still enabling physiologic CMRO2 levels, as discussed above. Keeping in mind the potentially very low P50 of the respiratory cascade for oxygen, a further decrease in the tissue pO2 by 2 to 3 mm Hg may thus allow for a relevant increase of this concentration gradient by 10% to 20% and thus an increase in CMRO2 even without changes in CBF. Given the substantial heterogeneity of pO2 in microvessels, a decrease in CTTH may also increase oxygen delivery to areas with lowest pO2 while maintaining constant average CBF. 8
In principle, diffusion of ATP and/or phosphocreatine (PCr) could deliver energy from microregions with high pO2 to those with low pO2. Both high-energy phosphates are found in the brain in relevant concentrations (see Table 1). ATP and PCr may diffuse over significant distances and may have a role in energy transport in addition to energy buffering.
133
In muscle, average diffusion distances of ATP and PCr have been estimated at around 20 (ATP) to 60
The heterogeneity of tissue pO2 introduces a potential limitation to studies exploring effects of changes in average CBF and CMRO2. When reducing CBF or arterial pO2, microregions close to the arterial side of capillaries will maintain constant CMRO2 longer than the ‘lethal corners' of the tissue. Oxygen limitation of energy metabolism may be subtle and restricted to small microregions at the beginning and may have subtle effects on brain function not detected in most of the studies discussed above. To explore this further, experiments using high-resolution imaging of oxidative metabolism and neuronal activity (capable of distinguishing ‘lethal corners' from the rest of the tissue) during manipulations of oxygen supply to the brain are needed.
CONCLUSIONS
Relevant details of oxygen supply to the brain have not yet been fully elucidated. Specifically, it remains unclear to what extent CMRO2 is limited by oxygen availability under physiologic conditions. Studies on the limits of oxygen supply during hypoxia, experimental studies of baseline changes of CBF and CMRO2, studies of transient changes of oxygen concentration during physiologic blood flow responses to neuronal activation and studies of inhibited blood flow responses suggest that a moderate safety margin of oxygen delivery to the brain exists and that CBF at rest is not the sole determinant of CMRO2. Regulation of oxidative phosphorylation to some extent independent from blood flow seems possible. Potential regulatory mechanisms include changes of ADP availability, inhibitory effects of ATP and NO on cytochrome c oxidase and changes in intracellular Ca2+ concentrations. However, detailed
Footnotes
The authors declare no conflict of interest.