
Abstract
Despite the importance of understanding the regulation of microvascular blood flow in white matter, no data on subcortical capillary blood flow parameters are available, largely due to the lack of appropriate imaging methods. To address this knowledge gap, we employed two-photon microscopy using a far-red fluorophore Alexa680 and photon-counting detection to measure capillary red blood cell (RBC) flux in both cerebral gray and white matter, in isoflurane-anesthetized mice. We have found that in control animals, baseline capillary RBC flux in the white matter was significantly higher than in the adjacent cerebral gray matter. In response to mild hypercapnia, RBC flux in the white matter exhibited significantly smaller fractional increase than in the gray matter. Finally, during global cerebral hypoperfusion, RBC flux in the white matter was reduced significantly in comparison to the controls, while RBC flux in the gray matter was preserved. Our results suggest that blood flow in the white matter may be less efficiently regulated when challenged by physiological perturbations as compared to the gray matter. Importantly, the blood flow in the white matter may be more susceptible to hypoperfusion than in the gray matter, potentially exacerbating the white matter deterioration in brain conditions involving global cerebral hypoperfusion.
Introduction
Cerebral white matter disease impairs cognitive function, affecting a vast majority of elders.1–4 It has been demonstrated that cerebral white matter is inherently vulnerable to hypoperfusion,5–8 potentially due to its downstream location relative to cerebral gray matter with respect to arterial blood supply.9–11 Furthermore, ample evidence indicates that cerebral small vessel disease, referring to a spectrum of vascular pathologies affecting small arterioles, venules and capillaries, is a leading cause of cerebral white matter disease.12–16 Therefore, a detailed characterization of white matter capillary blood flow parameters is of critical importance to understand the progression of various cerebral white matter pathologies. However, while regulation of the cerebral cortical capillary blood flow at rest17–21 and during functional activation22–27 has been a subject of intense research, no data about capillary blood flow parameters in cerebral white matter have been reported. This gap in knowledge represents a barrier to a better understanding of both the regulation of white matter microvascular blood flow and the mechanisms of progression of various pathologies that affect white matter microcirculation.
Quantification of the capillary blood flow parameters in cerebral white matter is technically challenging. Two-photon microscopy is currently the only modality that demonstrated capillary blood flow measurements in the white matter in mice.28,29 Kobat et al. 28 demonstrated capillary red blood cell (RBC) speed line-scan measurements at 0.9 mm depth in mouse cortex by imaging Alexa680-labeled blood plasma, which was two-photon excited at 1280 nm with an optical parametric oscillator (OPO) source with 80 MHz pulse repetition rate. 17 Miller et al. 29 used a more advanced optical parametric amplifier source with low repetition rate (511 kHz) and high pulse energy (maximum 400 nJ) to demonstrate RBC speed measurements at 1.2 mm depth in mouse cortex by two-photon imaging of Texas Red-labeled blood plasma excited at 1215 nm. In both cases, the proof of principle line-scan measurements of RBC speed were performed in a single capillary but with a signal-to-noise ratio (SNR) that might be insufficient for mapping RBC speed in the capillary network.
In this work, we applied two-photon fluorescence laser scanning microscopy to measure capillary RBC flux in isoflurane-anesthetized C57BL/6 mice. We labeled blood plasma with a far-red fluorophore Alexa680 and used two-photon excitation at 1280 nm and photon-counting detection to measure RBC flux in hundreds of capillaries up to 1.2 mm deep under the cortical surface. RBC flux was measured in healthy mice during normocapnia and mild hypercapnia, and in mice under global cerebral hypoperfusion induced by bilateral carotid artery stenosis (BCAS) 30 during normocapnia. Our results indicate that capillary RBC flux in the white matter is significantly higher than in the adjacent cortical gray matter under control condition, but is less efficiently regulated under global blood flow perturbations compared to that in gray matter. We speculate that the observed white matter vulnerability to global cerebral hypoperfusion may be related to its downstream location in the arteriolar blood supply and can exacerbate white matter deterioration in brain diseases involving global cerebral hypoperfusion.
Material and methods
Animal preparation
We used n + 12 C57BL/6 mice (3–5 months old, 20–30 g, female, Charles River Laboratories), separated into two groups. The control group (n + 5) were imaged under normoxic normocapnia. Four of these control mice were subsequently imaged under mild hypercapnia (5% CO2 in the air/oxygen mixture for 30-min period). Global cerebral hypoperfusion was induced in the second group of mice (n + 4), and they were imaged under normoxic normocapnia. Three animals were excluded due to either poor cranial window quality or bad physiological condition. To induce hypoperfusion, a micro-coil (diameter 0.18 mm) was bilaterally placed around the mouse carotid arteries to induce BCAS by a procedure previously established. 30 The BCAS procedure was performed seven days prior to experiment to ensure a stable animal physiology during imaging.
The surgical procedures to prepare for imaging experiment were previously described. 31 Briefly, a tracheotomy was first performed to control the animal respiration. A cannula was then inserted into the femoral artery to monitor the animal blood pressure and blood gases, as well as to administer the Alexa680 solution. Craniotomy (3 mm in diameter) was performed over the left hemisphere, approximately centered over the E1 whisker barrel. The dura was removed, and the cranial window was sealed with a 5-mm glass coverslip. Subsequently, the animal was transferred to the two-photon microscope for imaging, which started ∼45 min after installation of the cranial window. All mice were anesthetized with isoflurane (1.5–2% during surgery, and 1–1.5% during experiments), ventilated with air/oxygen mixture throughout all the surgical procedures and experiments, and euthanized after experiments. All the surgical and experimental procedures were conducted following the Guide for the Care and Use of Laboratory Animals and approved by the Massachusetts General Hospital Subcommittee on Research Animal Care.
Physiological parameters were recorded during experiments. (1) In the control mice under baseline condition, averaging over n + 5 mice, the mean arterial blood pressure (MABP), systemic arterial partial pressure of oxygen (PaO2) and partial pressure of carbon dioxide (PaCO2) were 81.3 ± 2.9 mmHg, 113.8 ± 8.7 mmHg and 34 ± 3.8 mmHg, respectively. (2) During mild hypercapnia, the mean MABP, PaO2 and PaCO2 were 78.8 ± 7.2 mmHg, 112.7 ± 9.0 mmHg and 53.1 ± 4.8 mmHg, respectively. (3) In the globally hypoperfused mice, the mean MABP, PaO2 and PaCO2 were 83.8 ± 9.6 mmHg, 99.7 ± 12.2 mmHg and 39.8 ± 1.6 mmHg, respectively. Body temperature was maintained at 37 ℃ throughout all surgical procedures and experiments. Data are expressed as mean±STD.
Two-photon laser scanning microscope
A home-built two-photon laser scanning microscope was employed in this study. The system design and specifications have been described in our previous studies.31,32 Briefly, two-photon excitation of Alexa680 at 1280 nm was conducted by a commercial laser source (InSight DeepSee, Spectra-Physics, tuning range: 680–1300 nm, ∼120 fs pulse width, 80 MHz pulse repetition rate). Laser power was controlled by an electro-optic modulator (EOM) (ConOptics, Inc.). In our experiments, the average laser power used for excitation, measured under the objective lens, was increased from 4 mW for imaging at the brain surface to 89 mW at the depths beyond 1 mm below the brain surface. The laser beam was focused by a water immersion objective lens (XLUMPLFLN20XW, Olympus, NA + 0.95) and scanned in the X-Y plane by a pair of galvanometer mirrors (6215H, Cambridge Technology, Inc.). The objective lens was translated along the Z-axis by a motorized stage (M-112.1DG, Physik Instrumente) to probe different depths. The emitted fluorescence, centered at 700 nm, was directed towards a photon-counting photomultiplier tube (PMT) module (H10770PA-50, Hamamatsu) by a dichroic mirror (FF875-Di01-25 × 36, Semrock), followed by an infrared blocker (FF01-890/SP-25, Semrock), and an emission filter (FF01-709/167-25, Semrock). The output from the PMT was discriminated by a discriminator (C9744, Hamamatsu), and subsequently sampled by a 50 MHz digital board (NI PCle-6537, National Instruments). The collected photon counts were binned with 250-μs-wide bins for post processing. In experiments, the objective lens was heated by an electric heater (TC-HLS-05, Bioscience Tools) to maintain the temperature of the water between the cranial window and the objective lens at 37 ℃.
Conjugation of Alexa680 to dextran
Fluorophore Alexa680 was conjugated to 2000 KDa dextran, according to a custom-developed protocol. The conjugation protocol is available as supplemental material.
Measurements of capillary RBC flow parameters by the RBC-passage method
The measurements were enabled by two-photon microscopic imaging of Alexa680-labelled blood plasma (Figure 1(a)). The dextran-conjugated Alexa680 solution (0.1–0.15 ml at 5% W/V in PBS) was injected into blood stream via the femoral artery cannula before imaging.
Measurements of deep capillary RBC flux by the RBC-passage method. (a) A 1.4-mm-thick in vivo Alexa680-labeled mouse brain microvasculature. (b) Angiograms at two imaging planes (e.g. Z + 0.40 and 0.95 mm) outlined by the red dashed lines in (a). Scale bars: 0.1 mm. (c) Two representative fluorescence intensity time courses (0.4-s-long traces) acquired within the capillaries at the locations denoted by the red dots in (b) The blue curves represent the experimental time courses. The red curves represent the segmented time courses, with the ‘valleys’ and ‘peaks’ representing the RBC and blood-plasma passages flowing through the focal volume, respectively. The associated imaging depth, RBC flux and R2 between the experimental (blue) and segmented (red) curves are provided for each time course (d). The variation of R2 as a function of imaging depth (measurements in 160 capillaries per depth group). Data are expressed as mean±STD.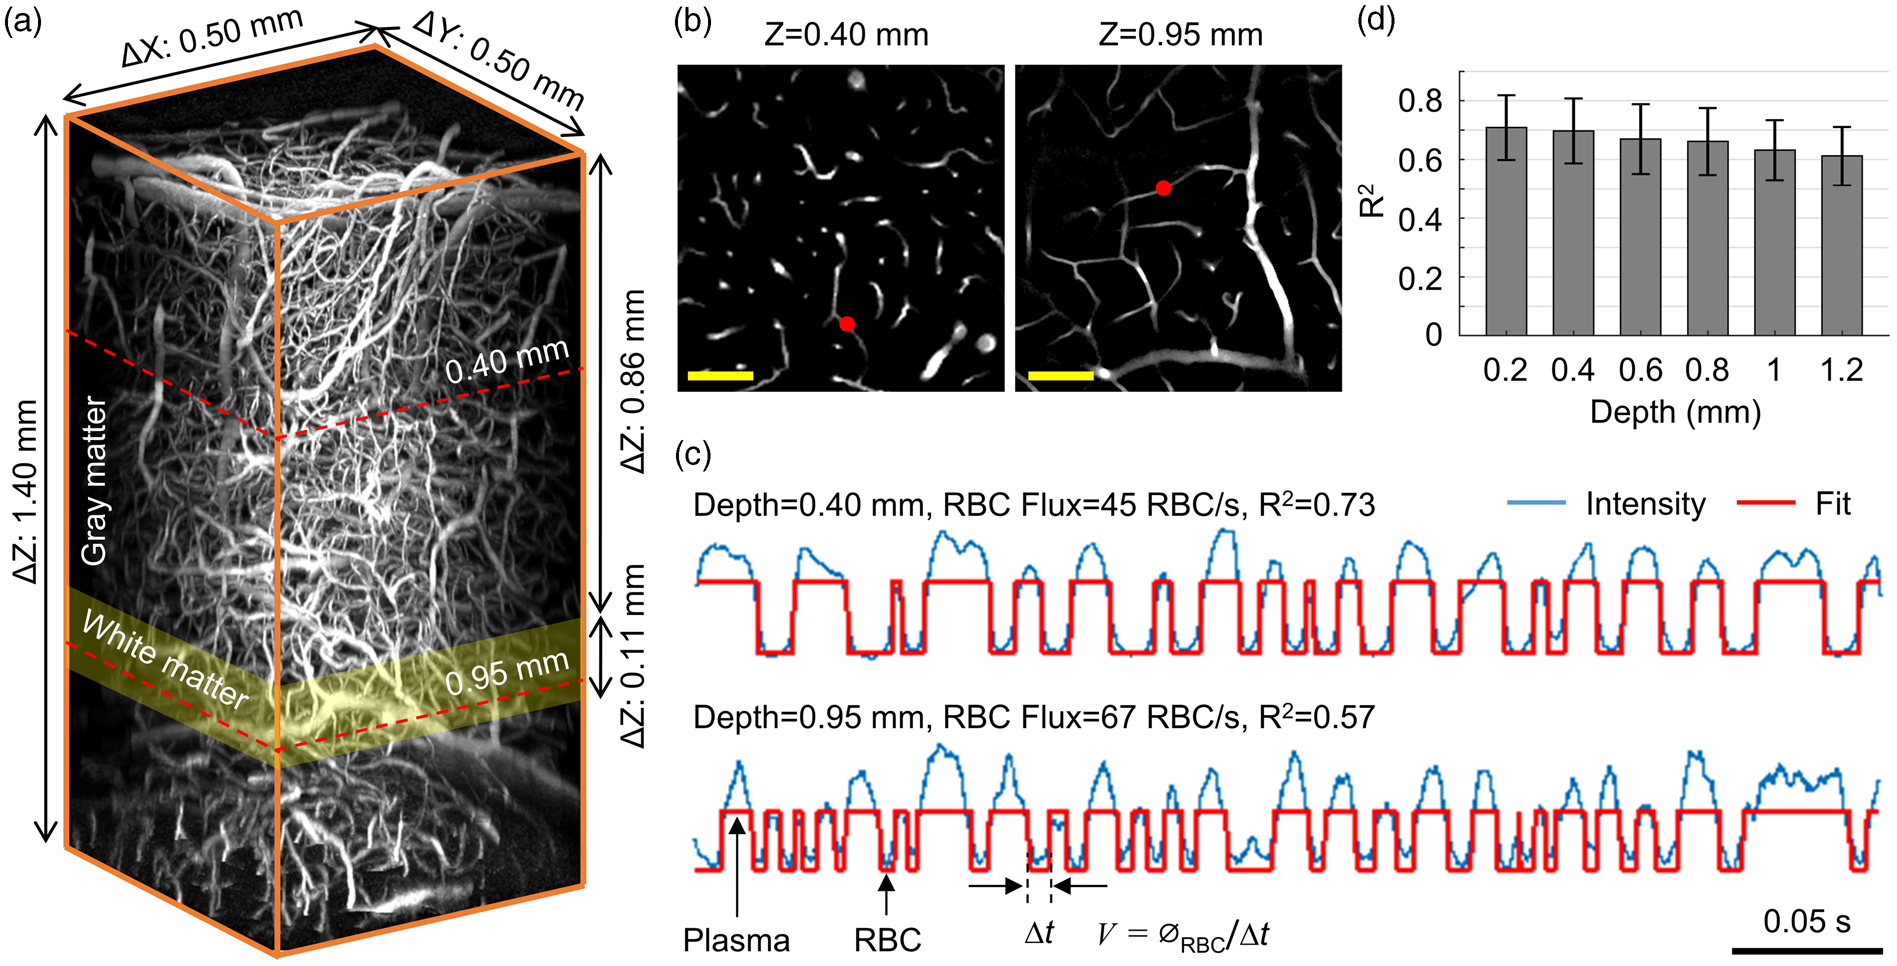
At each depth in the mouse brain tissue, we first acquired a survey image of the vasculature over a 0.5 × 0.5 mm2 field of view (FOV) by raster-scanning the focused excitation beam (Figure 1(b)). Then, we manually selected measurement locations inside most of the capillary segments (one point per segment) that could be visually identified in the survey image (Figure 1(b)). Here, capillaries were identified empirically based on vascular diameter. 33 The focused laser beam was parked at each location for a 1-s-long acquisition. The detected fluorescence was digitally sampled and then binned with 250-μs-wide bins for post processing. The fluorescence intensity amplitude integrated over a 250-μs-wide bin was adjusted by laser power and duration of the laser ‘on’ phase in the corresponding 250-μs-long excitation, and both parameters were controlled by EOM and kept constant for imaging in the same plane.
At each measurement location, we obtained a 4000-point fluorescence intensity time course (250-µs temporal resolution), corresponding to a 1-s acquisition duration. The fluorescence intensity in one time point was given by the integration of the photon counts over the 250-µs period. As the fluorescent dye labeled blood plasma but not RBCs, the fluorescent signal transients in the capillary segments encoded the passing RBCs (e.g. ‘valleys’ in the experimental time course) and plasma (e.g. ‘peaks’ in the experimental time course; Figure 1(c)) flowing through the optical focus. Following the procedures described in the previous studies,34,35 the fluorescence intensity time courses were segmented with a binary thresholding approach. RBC flux could be explicitly calculated by counting the number of detected RBCs (i.e. ‘valleys’ in the segmented curve; Figure 1(c)) normalized by the acquisition time. In addition, RBC hematocrit was estimated as the percentage of the number of points identified as RBCs to the total number of points in the fluorescence intensity time course. RBC speed was estimated as v+ø/Δt, where Δt was the ‘valley’ width in time (i.e. the time duration for a RBC passing through the focal zone; Figure 1(c)), and ø was the RBC diameter, assumed to be constant as 6 µm. 36
The RBC flux measurements in the gray matter were performed at cortical depths from 0.2 to 0.8 mm with 0.2-mm depth intervals. In the subcortical white matter, measurements were performed at the depths from 0.90 to 1.05 mm with 0.02–0.05 mm depth intervals. The order of imaging the gray and white matter was alternated between animals to reduce the influence of the variation of animal physiology, which typically worsens with time under general anesthesia, on the comparisons between the gray and white matter RBC flux measurements. In addition, measurements in the first group of mice during normocapnic and hypercapnic conditions were performed within the same regions of interest (ROIs) and at the same imaging depths. Measurement locations were selected in most of the capillary segments that could be visually identified within the ROI. However, to reduce the imaging time, no effort was made to ensure that the measurements under both physiological conditions were performed in the same capillary segments. The total duration of the imaging session in each mouse was kept under 2 h.
Measurements of cerebral gray and white matter thickness
A spectral-domain optical coherence tomography (SD-OCT) system was used in this study.20,37,38 Briefly, we used a superluminescent diode (1310/170 nm) as the light source. The axial resolution, pixel size and imaging range along the axial direction (Z) were estimated as 3.5 µm, 2.8 µm and 1.6 mm in biological tissue, respectively. The transverse resolution was 3.5 µm, using a 10 × objective lens (Mitutoyo Plan Apo NIR, NA + 0.26). Volumetric OCT scan (1 × 1 mm2 lateral FOV) was performed over the same ROI as for the two-photon imaging to permit identification of the boundary between the gray and white matter. The A-line scanning steps in the lateral directions (X-Y) were 1.9 µm. The optical focus was positioned in the deeper part of the cortex (Figure 2(a)) to facilitate visualization and segmentation of the gray and white matter boundaries.
Estimation of the cerebral gray and white matter thickness. (a) A representative OCT B-scan. The red curve represents the brain surface, and the two yellow curves represent the subcortical white matter boundaries. (b) and (c) Maximum intensity projections (MIPs) of the OCT intensity images from (a), with the depth ranges of 0.40 ± 0.02 mm (b; gray matter region) and 0.95 ± 0.02 mm (c; white matter region). Myelinated fibers (striated lines going from upper left to lower right) can be seen in the white matter (c). (d). MIP of a two-photon en face angiogram from the depth range of 0.95 ± 0.02 mm. The same vessels in the white matter were detected by both OCT (c) and two-photon microscopy (d). Scale bars: 0.1 mm.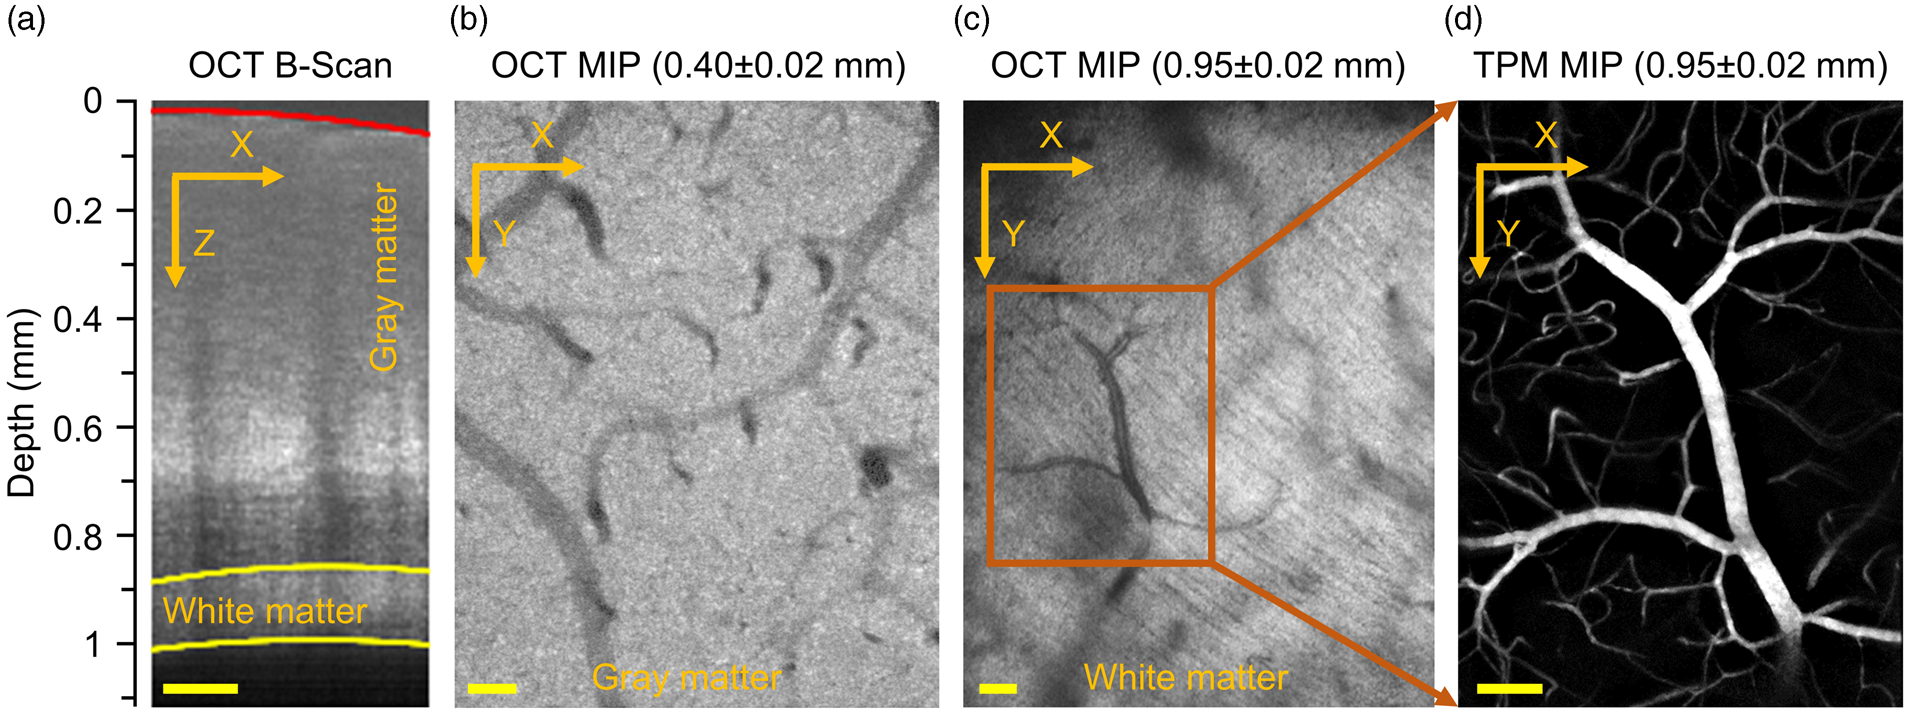
OCT B-scan intensity images were extracted from the volumetric OCT data. We first segmented the B-scan images with a local intensity thresholding algorithm to retrieve the coordinates of the points along the brain surface curvature (the red curve) and the white matter boundaries (the two yellow curves; Figure 2(a)). However, the automatic segmentation might be incorrect where the SNR was low, typically due to the shadow effect caused by the surface vessels. In that case, we manually rejected the incorrectly segmented points at the boundaries. We then fitted the coordinates of the remaining points with a second-order polynomial model, to smoothly delineate the brain surface curvature and the white matter boundaries. Finally, the gray and white matter thickness in each mouse was calculated by the fitted boundaries in each B-scan, and then averaged over several B-scans evenly spaced along the Y-axis.
Study design and statistical analysis
Study design and reporting followed ARRIVE guidelines. All data are presented as mean±STD, where applicable. The average capillary RBC flux, speed and hematocrit presented in Figure 4 were first calculated over capillaries in each mouse and then over mice. Statistical comparisons were conducted using Student's t-test (MATLAB, MathWorks Inc.). P value less than 0.05 was considered statistically significant. Sample sizes were selected to detect 30% difference between the mean values (coefficient of variance + 0.2, power + 0.8, α + 0.05), and indicated in the text and figure legends, where relevant.
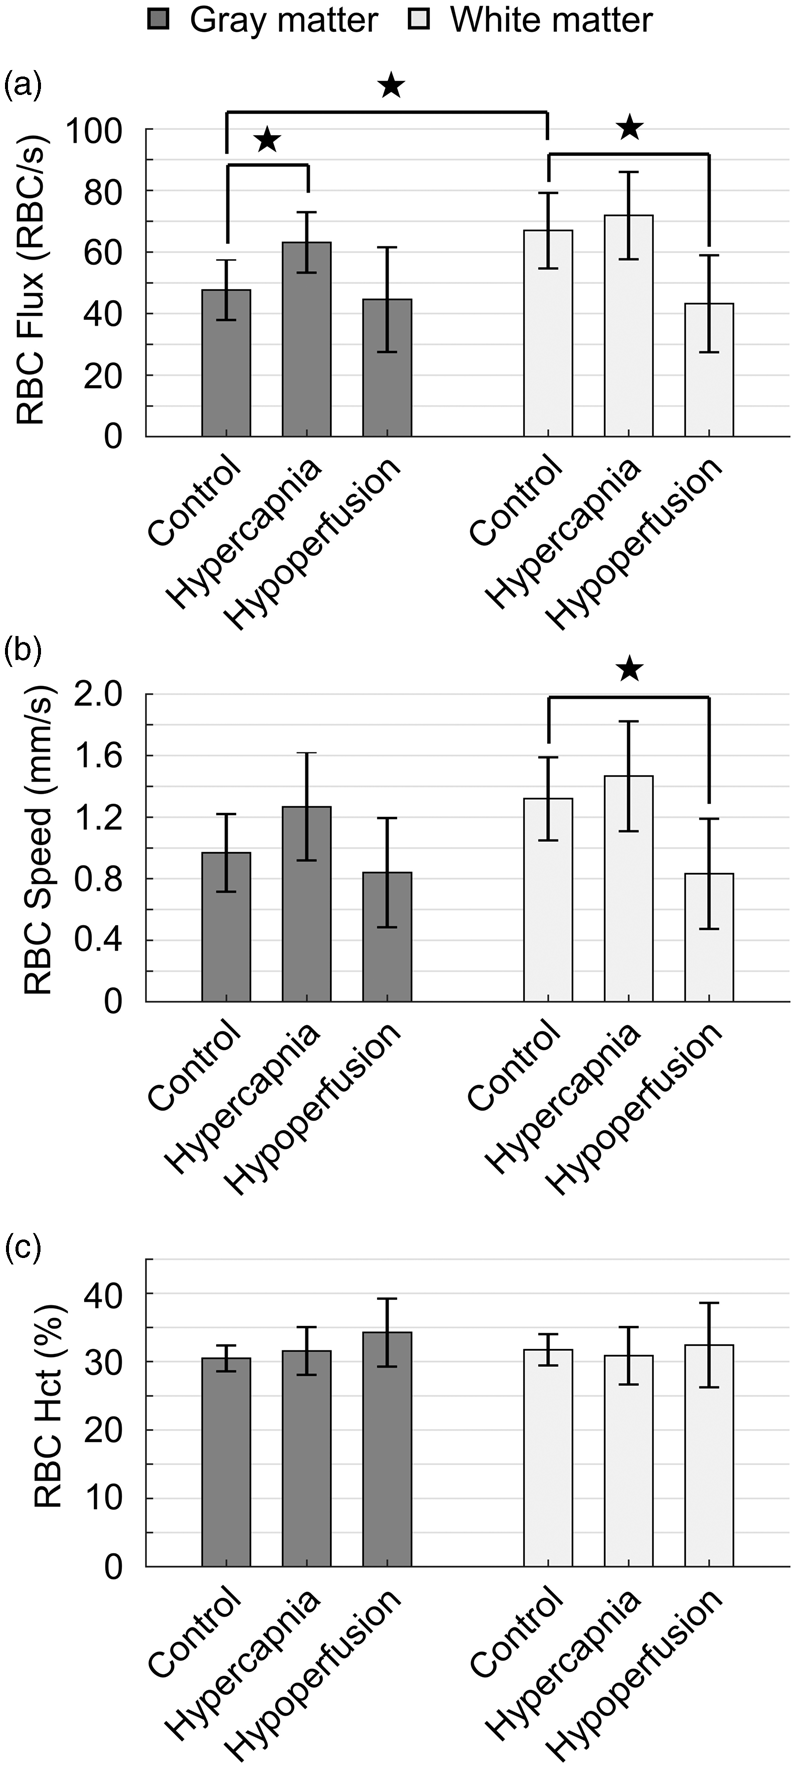
Quantification of capillary RBC flux across different physiological conditions. (a–c) Histograms of capillary RBC flux in the cerebral gray and white matter, with the experiments conducted in the control mice under normocapnia (n + 5 mice, 343 gray matter capillaries and 191 white matter capillaries) and mild hypercapnia (n + 4 mice, 285 gray matter capillaries and 207 white matter capillaries), and in the hypoperfused mice under normocapnia (n + 4 mice, 262 gray matter capillaries and 133 white matter capillaries), respectively. (d) Scatter plot of the average RBC flux calculated over capillaries within each individual mouse. The data under control condition, mild hypercapnia and global cerebral hypoperfusion are represented with blue triangles, red plus signs and black squares, respectively. Comparisons of the measurements. (a–c) Bar plots of the average capillary RBC flux (a), speed (b) and hematocrit (c) in the cerebral gray and white matter, with the experiments conducted under control condition, mild hypercapnia and global cerebral hypoperfusion, respectively. This analysis was made based on the same measurements presented in Figure 3. The data were first averaged over capillaries in each mouse and then over mice. Data are expressed as mean±STD. The star symbol indicates significant difference (Student's t-test, P < 0.05).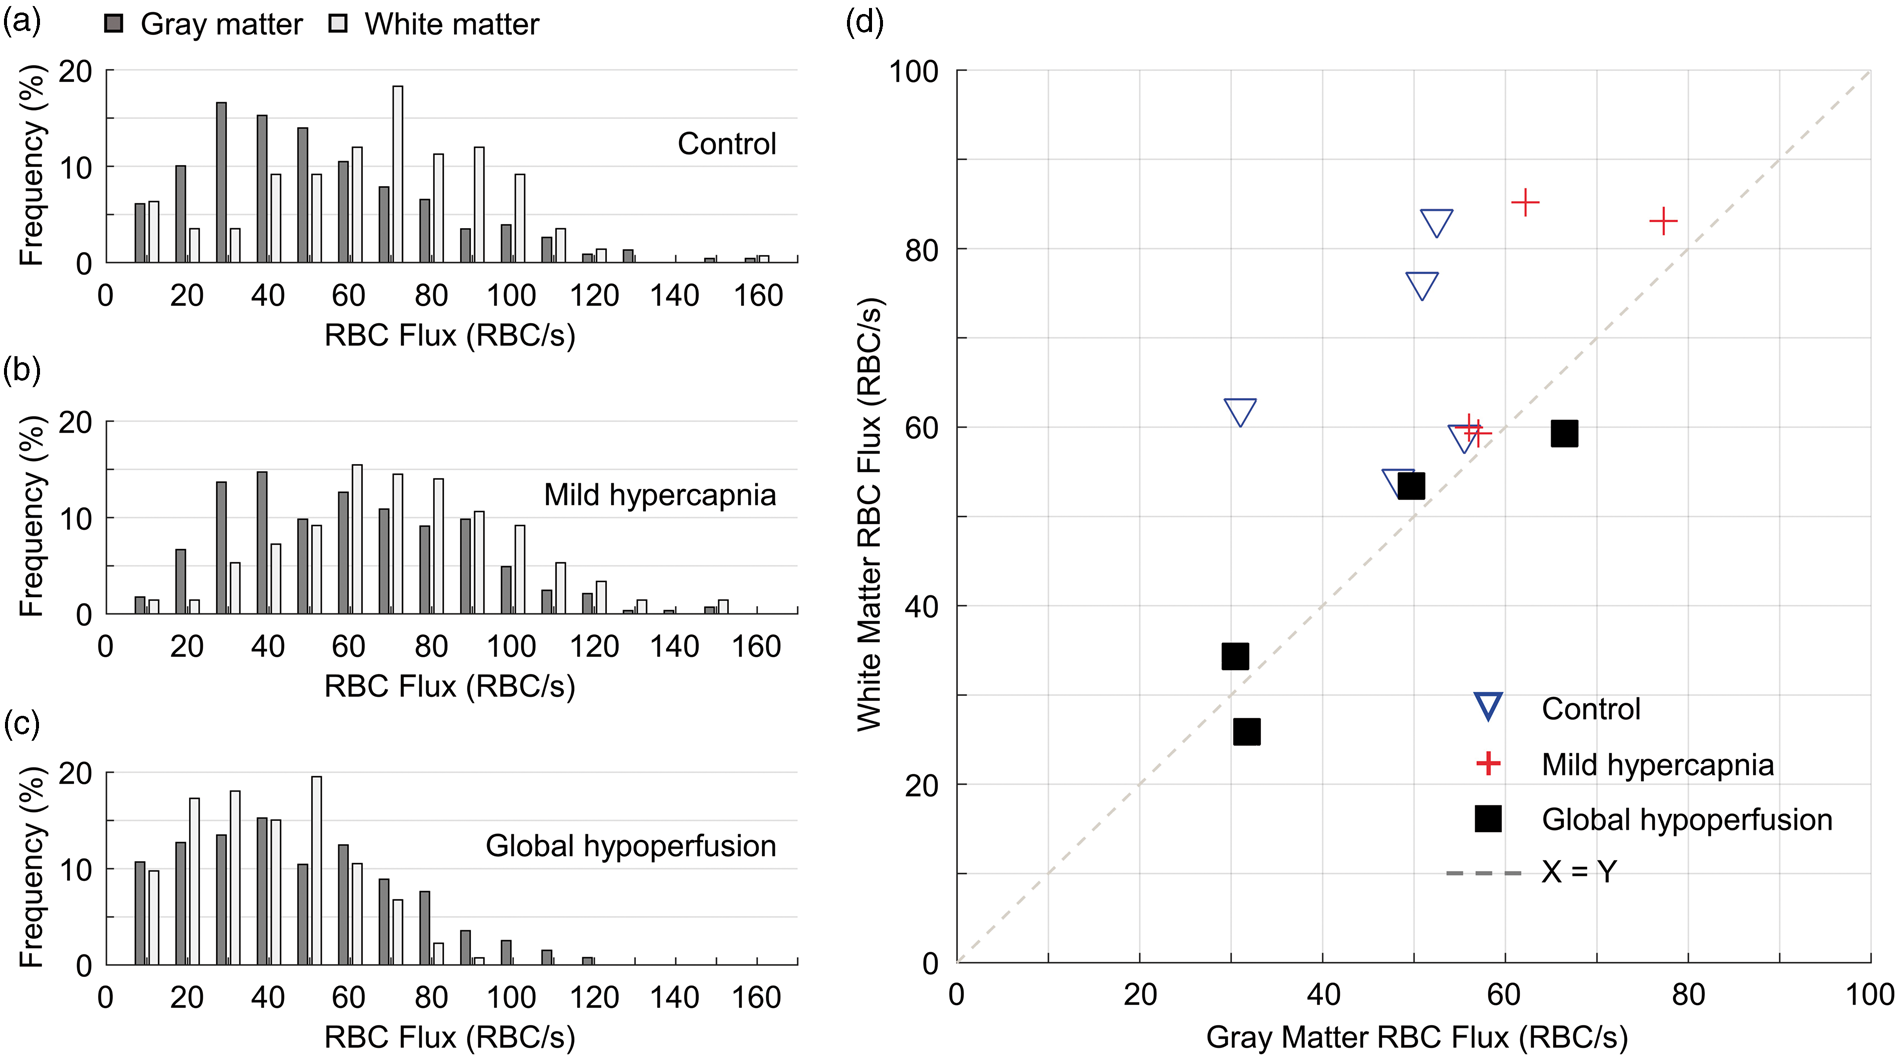
Results
Measuring capillary RBC flux in the subcortical white matter in mice with two-photon fluorescence microscopy
We acquired Alexa680-labelled in vivo angiograms up to 1.4 mm below the mouse brain surface (Figure 1(a)). The deep imaging penetration permitted us to routinely measure capillary RBC flux up to a depth of 1.2 mm (for details please see the methods section). Measurement locations were selected within the capillary segments at different depths. Figure 1(c) shows two representative fluorescence intensity time courses, acquired in two capillary segments at 0.40 and 0.95 mm depths (Figure 1(b)). By applying a binary-segmentation to the fluorescence intensity time courses in Figure 1(b), the RBC flux was calculated as 45 RBC/s at 0.40 mm depth and 67 RBC/s at 0.95 mm depth. The accuracy of the RBC flux calculation was evaluated by the coefficients of determination (R2) between the experimental (blue curves) and the segmented time courses (red curves; Figure 1(c)). R2 decreased as a function of depth from 0.71 ± 0.11 at 0.2 mm to 0.61 ± 0.10 at 1.2 mm (Figure 1(d)).
We employed OCT to estimate the gray and white matter thickness (for details please see the methods section). A representative OCT B-scan intensity image is shown in Figure 2(a). Here, the high OCT intensity level seen in the white matter region was due to the strong backscattered light, originating from the highly scattering myelinated axons. 39 Therefore, the bright ‘band’ between the two yellow curves outlines the location of white matter, in line with the previous studies.39–42 In contrast to the OCT maximum intensity projection image (Figure 2(b)) extracted from the gray matter region, myelinated fibers were observed as the striated lines going from upper left to lower right in the OCT image in Figure 2(c) that was extracted from the region between the two yellow curves (Figure 2(a)), confirming proper localization of the white matter. Averaging over several B-scans, evenly spaced along the Y-axis, and across two representative mice, the gray and white matter thickness within the same ROI as for two-photon imaging (e.g., in the whisker barrel cortex) was estimated as 863 ± 31 and 113 ± 21 µm, respectively. In addition, the same vessels in the white matter were detected by both OCT (Figure 2(c)) and two-photon imaging (Figure 2(d)), demonstrating the capacity of our two-photon microscope to image vessels in the subcortical white matter in mice. Therefore, the results in Figure 2 confirm that our capillary measurements from the depth ranges of 0.2–0.8 and 0.90–1.05 mm were acquired in the gray and white matter, respectively. The data were thus separated into the gray and white matter groups for analysis.
Baseline capillary RBC flux in the white matter is significantly higher than in the gray matter
The RBC flux in both the gray and white matter capillaries under control condition spanned large but similar ranges, i.e. from 12 to 153 RBC/s in the gray matter and from 15 to 150 RBC/s in the white matter (Figure 3(a)). However, RBC flux in the white matter capillaries was distributed more densely around higher flux values (Figure 3(a)). Averaging within individual mice, we found that RBC flux in the white matter capillaries was consistently higher than that in the gray matter capillaries (Figure 3(d)). Furthermore, averaging over mice, the mean capillary RBC flux in the white matter (67 ± 12 RBC/s) was significantly higher than in the gray matter (48 ± 10 RBC/s; Figure 4(a)).
Mild hypercapnia-induced fractional increase in capillary RBC flux in the white matter is significantly smaller than in the gray matter
Capillary RBC flux during mild hypercapnia was increased in both gray and white matter (Figure 3(b) and (d)). However, the flux increase in the gray matter capillaries was more pronounced, diminishing the difference between the gray and white matter flux distributions (Figure 3(b) and (d)), which was present at baseline condition (Figure 3(a) and (d)). The mean gray matter capillary RBC flux was significantly increased during mild hypercapnia (63 ± 10 RBC/s) comparing with the baseline value (48 ± 10 RBC/s), but the flux increase in the white matter capillaries was much smaller (from 67 ± 12 RBC/s to 72 ± 14 RBC/s; Figure 4(a)).
Capillary RBC flux during global cerebral hypoperfusion is significantly decreased in white matter but not in gray matter
We investigated the alterations of capillary RBC flux in the gray and white matter in mouse model of global cerebral hypoperfusion, induced by BCAS. 30 The experiments were performed seven days after the induction of hypoperfusion. Our results indicated that under global cerebral hypoperfusion, the distributions of RBC flux in both the gray and white matter capillaries were shifted towards the lower flux values compared to their baseline distributions (Figure 3(a) and (c)). While the white matter capillaries exhibited disproportionally larger flux decrease (Figure 3(c) and (d)), reducing the difference between the gray and white matter RBC flux distributions (Figure 3(a) and (d)). Further quantification revealed that global cerebral hypoperfusion induced a significant decrease in RBC flux in the white matter capillaries compared to the control value (from 67 ± 12 RBC/s to 43 ± 16 RBC/s), while the flux decrease in the gray matter capillaries was negligible (from 48 ± 10 RBC/s to 45 ± 17 RBC/s; Figure 4(a)).
Finally, we measured RBC speed and hematocrit in the same capillaries as for the RBC flux measurements under control condition, mild hypercapnia and global cerebral hypoperfusion in the same mice. The variation of RBC speed between the gray and white matter groups and under different conditions was found to be similar to that of RBC flux (Figure 4(b)), which can be expected because RBC speed and flux were reported to be positively correlated. 17 Hematocrit in both groups and under different conditions remained comparable (Figure 4(c)).
Discussion
The deep imaging penetration in this study was enabled, for the most part, by using the far-red fluorophore Alexa680, with the two-photon excitation at 1280 nm and emission peak at 700 nm. Similarly, by imaging Alexa680-labeled blood plasma, Kobat et al. 28 have demonstrated a line-scan measurement of RBC velocity in a single capillary at 0.9 mm depth in a mouse cortex. In a subsequent study, using a more sensitive detector, they demonstrated imaging of brain microvascular structure down to 1.6 mm under cortical surface, 43 although with extensive frame averaging at depths deeper than 1.1 mm. In our imaging setup, detector sensitivity, excitation wavelength, average power on the sample and laser pulse repetition rate were all similar to those used by Kobat et al. 43 We improved the detection of fluorescence by using a photon-counting PMT module to further reduce the measurement noise.44,45 In addition, we custom-conjugated Alexa680 to large dextran molecules (i.e. 2MDa) to reduce both leakage of the dye from the blood vessels and its clearance rate from the vasculature, extending the imaging sessions for large sampling. Using two- or three-photon excitation generated by significantly more energetic laser pulses at lower repetition rates is another approach to increase the imaging penetration (e.g. ≥ 1 mm in in vivo mouse brain), but with significantly more complex setups.29,46,47
We evaluated the dependence of the accuracy of RBC flux calculation on imaging depth. This is particularly important for RBC flux measurements at greater depths, typically associated with decreased SNR due to light attenuation.28,43 We indeed observed the decrease in R2 as a function of depth (Figure 1(d)). The lowest R2 that expectedly occurred in the deepest imaging region centered at 1.2 mm depth is 0.61 ± 0.10, which is above the previously found threshold (R2≥0.5) for accurate capillary RBC flux calculation with the RBC-passage counting technique. 38 In addition, capillary RBC flux measurements may be negatively impacted by the aliasing effect, if the sampling frequency is not sufficiently high. 48 The temporal resolution that was typically used in the previous studies was Δt + 1–2 ms.17,19,49–51 Our previous work indicated that Δt + 1.5 ms would be sufficient to measure capillary RBC flux up to 150 RBC/s without any aliasing effect. 48 In this current study, with Δt + 250 µs, we would expect an increased upper limit of capillary RBC flux detection. Besides, the applied laser power might potentially affect the capillary blood flow, especially when the laser beam was parked during the 1-s-long measurements. To address this concern, in a separate group of mice (n + 3), we evaluated whether RBC flux observations varied with measurement durations as long as 8 s. Measurements were performed at 400 µm in 157 capillaries and 950–1000 µm in 76 capillaries, using the same excitation laser power as those reported in Figures 3 and 4 (i.e. 25–30 mW and 89 mW, respectively). No changes of RBC flux were observed over time (data not shown), indicating that the 1-s-long measurements did not significantly affect the capillary blood flow in our experiments.
We assessed the gray and white matter capillary RBC flux distributions under control condition and two other conditions that perturb global cerebral blood flow (CBF) in opposite ways: (1) mild hypercapnia, which increases global CBF,52–54 and (2) BCAS, which was reported to induce global cerebral hypoperfusion.30,55–57 Data were grouped into the gray and white matter groups, and the depth ranges for grouping were based on our OCT measurements and in good agreement with the published mouse brain atlas.11,42,58 Our capillary RBC flux measurements in the gray matter were performed down to 0.8 mm, deeper than the previously reported measurements (≤0.6 mm).20,23,59 Our baseline gray matter capillary RBC flux (ranges from 12 to 153 RBC/s, mean value 48 ± 10 RBC/s) is comparable to the previous measurements performed in the somatosensory cortex in mice, anesthetized with either isoflurane (mean value 24–48 RBC/s)23,59 or α-Chloralose (mean value 52–72 RBC/s).20,23
We have found that in the control group, capillary RBC flux in the subcortical white matter was significantly higher than that in the cerebral cortical gray matter (Figure 4(a)). This result may be surprising but not necessarily conflicting with the fact that CBF and oxidative metabolism in the white matter are lower than that in the gray matter.7,8,60–64 It is possible that the white matter has both lower CBF and higher capillary RBC flux, since capillary density in the white matter is much lower than that in the gray matter,11,65,66 resulting in that more blood is distributed in each of the white matter capillaries (please see Supplemental Results for additional images of the microvasculature in the gray and white matter). High capillary RBC flux in the white matter is likely a result of reduced resistance through the capillary network, which may be due to shorter capillary paths and/or greater capillary diameter. In addition, high capillary RBC flux may be associated with reduced capillary transit time, which is unfavorable for the oxygen unloading from blood to tissue according to the biophysical models.67,68 This is in agreement with the previous studies showing that oxygen extraction fraction in the white matter was lower than that in the gray matter.63,64 Lower cerebral metabolic rate of oxygen in the white matter may be an important contributor to this effect.
We further investigated the changes of capillary RBC flux in both the gray and white matter capillaries in response to global blood flow perturbations. Mild hypercapnia induced a 31.3% increase in RBC flux in the gray matter capillaries (baseline value: 48 ± 10 RBC/s), well within the previously reported range of fractional increase in RBC speed in the isoflurane-anesthetized mice (36%), 69 as well as in RBC flux in the α-Chloralose-anesthetized mice (15–59%).19–21 However, hypercapnia induced only a 7.5% flux increase in the white matter capillaries (baseline value: 67 ± 12 RBC/s; Figure 4(a)). The discrepancy observed in the hypercapnia-induced relative flux increases in the gray and white matter capillaries suggests a limited capacity of the cerebrum to regulate the white matter microvascular blood flow comparing with the gray matter.
The inefficiency of the white matter blood flow regulation was further confirmed by experiments in a mouse model of global cerebral hypoperfusion. The capillary RBC flux measurements were performed seven days after the induction of global cerebral hypoperfusion. With this model, mice exhibit gradual white matter damage and behavioral deficits,30,70–72 and the myelin damage, oligodendrocyte death and cognitive dysfunction are typically not significant during the first week after the micro-coil placement. 30 In addition, this model typically induces an immediate CBF decrease to 50–60% of the baseline CBF, as measured by laser-Doppler flowmetry at the cortical surface, followed by a CBF recovery over one week to a level of 70% of the baseline CBF, which may persist for weeks or months. 57 Our result showed that under global cerebral hypoperfusion, RBC flux in the white matter capillaries was significantly reduced (by ∼36%) in comparison to the controls (Figure 4(a)), while RBC flux in the gray matter capillaries was reduced by only ∼6% (Figure 4(a)). This is in agreement with a previous study, which showed that blood flow to many areas of white matter was impaired during severe systemic hypotension in young dogs, but blood flow to all gray matter areas was preserved. 8 A similar observation was also made in ischemic leukoaraiosis. 7
Our results with the measurements in the hypercapnic and hypoperfused mice suggest that (1) the microvascular network in the white matter might have a limited capacity, in comparison to the gray matter, to reduce the resistance to blood flow, and/or (2) the diving arterioles were unable to provide similar level of relative changes of blood pressure at the inputs of the gray and white matter microvascular networks. The location of the white matter being downstream of the gray matter with respect to the arteriolar blood supply, as observed in the human brain, is also supportive of these two possibilities.73–75 It is not clear if the arterioles supplying the subcortical white matter originate exclusively from the pial surface or from the deep brain regions too. In either case, it is possible that the location of the white matter at the distal part of the arteriolar blood supply contributes to the less efficient blood flow regulation in the white matter as compared to that in the gray matter.
One limitation of this study is that capillary RBC flux in the gray and white matter was measured within the depth ranges estimated in independent OCT measurements (Figure 2(a)). This one-size-fits-all approach might cause inaccurate grouping of data in some animals, potentially misleading the analysis. The capillary density in the subcortical white matter is significantly lower than in the gray matter,11,65,66 which could serve as an additional marker for the confirmation that the measurements were performed in the white matter (Figure 1(b)). We verified that by re-grouping the data with gray and white matter depth ranges shifted for ±50 µm, we obtained the same results. Another potential limitation is that the experiments were performed in anesthetized animals. We cannot rule out the possibility that isoflurane differentially affected CBF in the gray and white matter. In addition, the increased variability of systemic arterial PCO2 under anesthesia might result in large variation of capillary RBC flux between animals. 76 This was likely one of the causes for the observed variation of capillary RBC flux, e.g., in the control and hypoperfused mice (Figure 3(d)). These concerns will be addressed in the future studies with awake mice. Besides, due to the limited number of measured capillaries, all the measurements in the gray matter were grouped together, omitting the potential cortical-depth-dependent RBC flux changes. We reported that capillary RBC flux in cortical layers I-V in awake C57BL/6 mice exhibited a cortical-layer dependence, 77 but with the layer-dependent difference of RBC flux much smaller than that between the gray and white matter observed in this work. We anticipate that the similar small cortical-layer-dependent variability of RBC flux is present in anesthetized mice too. However, it is possible that capillary RBC flux gradually increases across layer VI making a smooth transition towards the higher RBC flux values observed in the white matter. Furthermore, RBCs that were touching each other might be counted mistakenly as a single RBC, causing the underestimation of both RBC flux and speed. Based on visual inspection, we estimated that approximately 6% of the ‘valleys’ identified in the fluorescence intensity time courses might be caused by the passing of multiple RBCs through the optical focus. However, we do not anticipate that our conclusions are affected, as the RBCs-touching phenomenon is likely equally present in both the gray and white matter capillaries and, importantly, the measured differences in capillary RBC flux between the gray and white matter and under different brain physiological conditions are much larger than 6% (Figure 4).
To conclude, the imaging penetration depth and SNR of our two-photon fluorescence microscope were enhanced by using a far-red fluorophore Alexa680 and photon-counting detection. These improvements allowed us to obtain for the first time RBC flux measurements in hundreds of capillary segments in both the cerebral gray and white matter in mice. In addition, we used a common two-photon excitation laser source, which will facilitate adoption of the presented technique for measurements of capillary flow parameters by other research groups. Our results indicated that, comparing with the gray matter capillaries, the white matter capillaries exhibited significantly higher RBC flux at baseline, but had limited capacity to adapt to global CBF perturbations. Importantly, our measurements in mice under global cerebral hypoperfusion revealed that blood flow to the cerebral white matter may be inherently more vulnerable to hypoperfusion than to the gray matter, suggesting a mechanism of the white matter deterioration in brain conditions involving global cerebral hypoperfusion.
Supplemental Material
Supplemental material for Two-photon microscopic imaging of capillary red blood cell flux in mouse brain reveals vulnerability of cerebral white matter to hypoperfusion
Supplemental material for Two-photon microscopic imaging of capillary red blood cell flux in mouse brain reveals vulnerability of cerebral white matter to hypoperfusion by Baoqiang Li, Ryo Ohtomo, Martin Thunemann, Stephen R Adams, Jing Yang, Buyin Fu, Mohammad A Yaseen, Chongzhao Ran, Jonathan R Polimeni, David A Boas, Anna Devor, Eng H Lo, Ken Arai and Sava Sakadžić in Journal of Cerebral Blood Flow & Metabolism
Footnotes
Authors' contributions
BL and SS designed the study with inputs from EHL, KA and RO. BL performed the experiments with help from RO. BL analyzed the data, interpreted the results, and wrote the manuscript with help from SS, EHL, KA, AD, DAB and JRP. SS and MAY built the two-photon microscope. BF and RO performed the animal surgeries. MT, SRA and AD developed the Dextran-Alexa680 conjugation protocol. BL did the chemical conjugation with help from CR and JY.
Funding
The author(s) disclosed receipt of the following financial support for the research, authorship, and/or publication of this article: The authors would like to thank the supports from the National Institutes of Health grants R01GM086197, R01NS091230, R01MH111359, R01MH111419, P01NS055104, U01HL133362 and R01AA027097.
Declaration of conflicting interests
The author(s) declared no potential conflicts of interest with respect to the research, authorship, and/or publication of this article.
References
Supplementary Material
Please find the following supplemental material available below.
For Open Access articles published under a Creative Commons License, all supplemental material carries the same license as the article it is associated with.
For non-Open Access articles published, all supplemental material carries a non-exclusive license, and permission requests for re-use of supplemental material or any part of supplemental material shall be sent directly to the copyright owner as specified in the copyright notice associated with the article.