
Abstract
Brain function, the brain’s metabolic activity, cerebral blood flow (CBF), and intracranial pressure are intimately linked within the tightly autoregulated regime of intracranial physiology in which the role of tissue viscoelasticity remains elusive. We applied multifrequency magnetic resonance elastography (MRE) paired with CBF measurements in 14 healthy subjects exposed to 5-min carbon dioxide-enriched breathing air to induce cerebral vasodilatation by hypercapnia. Stiffness and viscosity as quantified by the magnitude and phase angle of the complex shear modulus, |G*| and ϕ, as well as CBF of the whole brain and 25 gray matter sub-regions were analyzed prior to, during, and after hypercapnia. In all subjects, whole-brain stiffness and viscosity increased due to hypercapnia by 3.3 ± 1.9% and 2.0 ± 1.1% which was accompanied by a CBF increase of 36 ± 15%. Post-hypercapnia, |G*| and ϕ reduced to normal values while CBF decreased by 13 ± 15% below baseline. Hypercapnia-induced viscosity changes correlated with CBF changes, whereas stiffness changes did not. The MRE-measured viscosity changes correlated with blood viscosity changes predicted by the Fåhræus–Lindqvist model and microvessel diameter changes from the literature. Our results suggest that brain viscoelastic properties are influenced by microvessel blood flow and blood viscosity: vasodilatation and increased blood viscosity due to hypercapnia result in an increase in MRE values related to viscosity.
Introduction
Cerebral hemodynamics is a key function of brain physiology. Supply of oxygen and metabolites to the brain relies on tight autoregulation of cerebral blood flow (CBF), which has to be maintained during neuronal activation or with changing intracranial pressure, venous blood return, or carbon dioxide (CO2) partial pressure. Regulatory mechanisms for the adaptation of the amount of blood perfused through the brain include the change of vessel diameters, which influence hemodynamic variables such as vascular resistance, blood viscosity, and intracranial blood pressure (BP). These fluid mechanical parameters can interact with tissue matrix properties giving rise to poroelastic material behavior and effective-medium viscoelastic properties which depend on both solid and fluid-phase properties. 1 Effective-medium viscoelastic models have been proposed for biological tissues including the brain, but experimental data are sparse.2–7
Magnetic resonance elastography (MRE) can measure in vivo cerebral viscoelastic properties.8,9 Recent applications of MRE to the human brain include tumors,10–12 neurodegeneration in Alzheimer’s disease,13,14 Parkinson disease,15,16 or neuroinflammation due to multiple sclerosis.17,18 Other studies have focused on the physiological variation of brain viscoelastic parameters due to aging14,19 and memory performance20,21 or have analyzed the regional variation of brain tissue.22–25 However, little is known whether CBF influences brain viscoelastic properties. Studies which addressed this question by MRE in a swine model 26 or by combining cerebral MRE with jugular compression 27 or arterial spin labeling (ASL) 28 have preliminarily demonstrated the increase in brain stiffness due to venous pressure and perfusion pressure.
In our previous study, ASL-measured CBF of deep gray matter (DGM) was normalized by vessel area data of DGM regions from the literature to obtain a parameter—the flux rate—which is proportional to the perfusion pressure gradient. 28 We could demonstrate that the flux rate of blood in DGM is proportional to MRE-measured brain stiffness, as quantified by the magnitude of the complex shear modulus |G*|, while no such correlation based on viscosity (given by the phase angle ϕ = arg(G*)) was observed. Since CBF was not changed during the MRE examinations, the direct influence of CBF on the brain’s viscoelastic properties could not be analyzed.
In the present study, we use MRE and ASL in healthy volunteers to study brain viscoelastic properties and CBF during hypercapnia. Hypercapnia, breathing of CO2-enriched air, is used for inducing vasodilation and increasing blood perfusion in the brain. The aims of this study are twofold: (i) to detect and analyze the effect of CBF changes on brain viscoelasticity on a global and local level and (ii) to test our hypothesis that hypercapnia-induced vasodilatation increases brain tissue viscosity as blood viscosity increases with vessel diameter due to the well-known Fåhræus–Lindqvist effect. 29 The latter effect could specifically link CBF properties to the mechanical attenuation properties of brain tissue as quantified by the phase angle ϕ of the complex shear modulus.
Material and methods
Fourteen healthy male subjects were investigated in a 3T magnetic resonance imaging (MRI) scanner with a 32-channel head coil (Siemens Magnetom Trio, Erlangen, Germany) after written informed consent was obtained. The study was approved by the ethical review board of the Charité – Universitätsmedizin Berlin in conformity with the Declaration of Helsinki. A Magnetization Prepared Rapid Acquisition Gradient Echo scan with 1 mm isotropic resolution was acquired for T1-weighted anatomical reference prior to the hypercapnia challenge accompanied by pseudo-continuous ASL 30 and continuous-wave multifrequency MRE acquisitions. 31
Hypercapnia challenge
The study paradigm (see Figure 1(a)) consisted of three blocks, each of which comprised a 2-min ASL scan followed by a 3-min MRE scan optimized for speed with reduced brain coverage excluding the cerebellum. During the first and third block, the volunteers inhaled normal air (normocapnia). The hypercapnia block started with a 1-min wash-in of mixed gas (5% CO2, 74% N2, and 21% O2) through a breathing tube connected to a mouth piece (see Figure 1(b)), followed by ASL and MRE examinations and a 1-min wash-out period. Heart rate (HR) and BP were continuously recorded with a Tesla Guard monitor (MIPM, Mammendorfer, Germany).
(a) The study paradigm consisted of three blocks, each one comprising a 2-min ASL scan followed by a 3-min MRE scan. During the first and third block, the volunteers inhaled normal air. The transitions from normocapnia to hypercapnia (red arrow) and from hypercapnia back to normocapnia (blue arrow) were followed by a 1-min wash-in and wash-out phase, respectively. (b) Technical setup in a 3T scanner including the hypercapnia challenge breathing tube connected to a mouth piece, the vital function monitor continuously recording heart rate, and blood pressure and the pneumatic MRE actuator system transferring mechanical vibrations to the head inside the 32-channel coil (see inlay). ASL: arterial spin labeling; MRE: magnetic resonance elastography.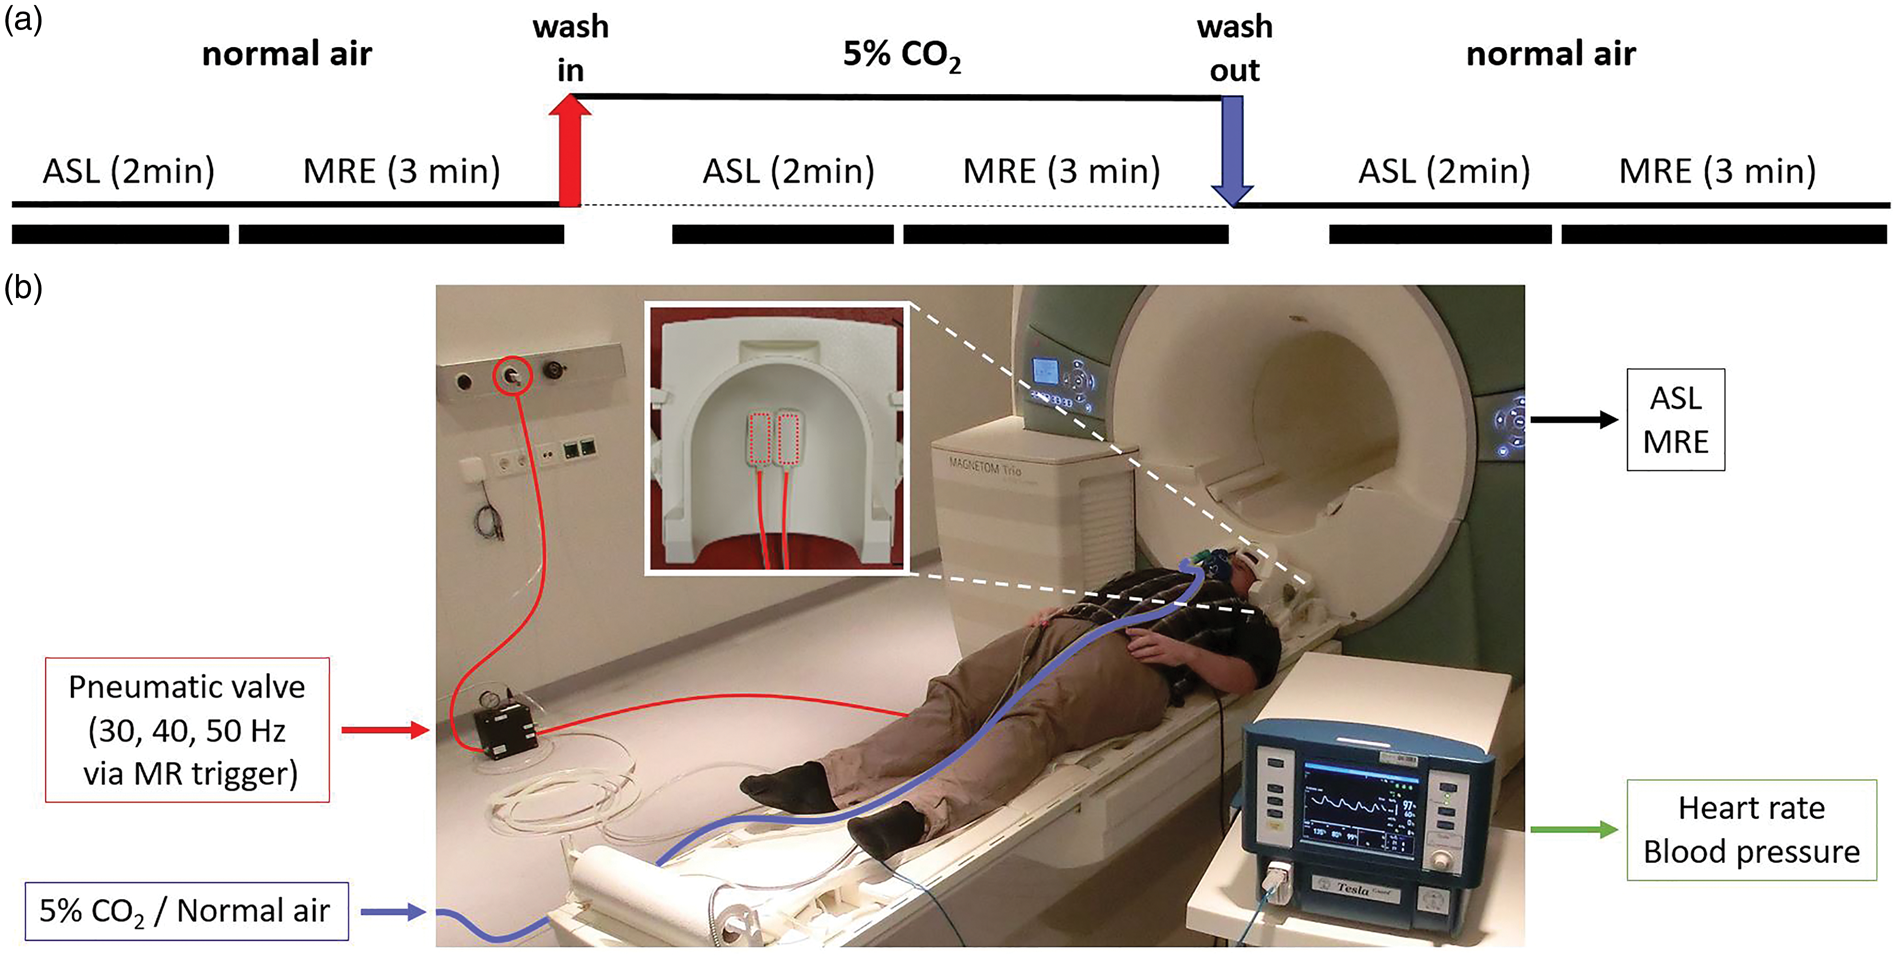
Multifrequency MRE
MRE was performed utilizing a pneumatic head actuator as shown in Figure 1(c). Two plastic cushions placed under the head of the volunteer generated head vibrations by being inflated and deflated at the drive frequency with a 180° phase shift relative to each other. One electromechanical valve was used per cushion to alternate between 0.5 bar overpressure from a pressurized air wall outlet and atmospheric pressure. The valves were controlled by a custom-designed waveform generator with integrated smart trigger option allowing for automated selection of the desired frequency by the MRI scanner. A similar setup was used for abdominal and pelvic multifrequency MRE examinations as detailed in Dittmann et al.32,33 The MRE imaging protocol was identical to Hetzer et al. 28 : three vibration frequencies of 30, 40, and 50 Hz were consecutively applied, and wave images were acquired by a single-shot spin-echo echo planar imaging (EPI) sequence with motion-encoding gradients (MEG). Full wave field data were acquired in 22 contiguous transversal slices with 2 mm isotropic voxel size. Further imaging parameters are echo time (TE) = 67 ms, repetition time (TR) = 2.5 s, matrix size 84 × 100, 25.7 ms single-cycle first moment nulled MEG of 30 mT/m amplitude, eight acquisitions over a wave cycle. Total scan time for MRE was approximately 3 min for each block.
MRE images were processed by multifrequency dual elasto-visco inversion (MDEV) as used in recent clinical MRE studies16,17 and our previous study combining MRE with ASL. 28 The entire postprocessing pipeline is available at https://bioqic-apps.charite.de. The pipeline includes (i) gradient-based unwrapping 8 after 2D Gaussian denoising of complex MRI data with five pixel edge size and σ = 0.65 pixels; (ii) temporal Fourier transformation to generate complex-valued wave derivative images for each frequency; (iii) further noise suppression by a 2D Butterworth low-pass filter with a threshold of 100 m−1 prior to calculation of finite-difference Laplacian using a five-tap stencil; and (iv) MDEV inversion providing high-resolution maps of the complex-valued shear modulus G* = |G*|·exp(iϕ), represented as magnitude |G*| (often referred to as stiffness) and phase angle ϕ (often referred to as viscosity). 8
Arterial spin labeling
A pseudo-continuous arterial spin-labeling (pCASL) sequence 30 was used for perfusion imaging with 2.5 mm isotropic resolution; 30 volumes (15 controls and 15 labels) were acquired with a TR of 4 s resulting in an acquisition time of 2 min. The label duration of τ L = 1.5 s was followed by a post-labeling delay of τ P = 1.2 s and a gradient echo EPI readout covering the whole brain with 18 ascending transversal slices (0.25 mm gap), matrix size 72 × 80, TE = 20 ms, echo spacing 0.69 ms.
In order to optimize signal-to-noise ratio and ASL scan time, we chose a label duration and post-labeling delay within the range of parameters optimized to avoid intravascular artifacts in healthy subject ASL studies similar to ours with voxel volumes roughly six times smaller 34 than recommended for conventional clinical studies. 35 The effective post-labeling delay in our study is around 1.9 s resulting from the 1.3-s long high-resolution EPI readout with slices acquired in ascending order.
ASLtbx
36
was used without smoothing for quantifying CBF in units of ml/100 g/min from the pCASL signal difference ΔM of control and label images using the formula35,37

The following parameters were used: T1 = 1664 ms for the longitudinal relaxation time of the blood at 3T, the brain/blood water partition coefficient λ = 0.9 ml/g, and the labeling efficiency α = 0.85. M0 is the equilibrium magnetization of the local tissue element in the control image while τ L and τ P denote label duration and post-labeling delay with the values given above.
Post-processing of CBF- and MRE maps
All images were post-processed using Matlab (MathWorks, Natick, MA), SPM12 (Wellcome Trust Centre for Neuroimaging, London, UK), and the FMRIB Software Library (FSL v. 5, Oxford Centre for Functional MRI of the Brain, Oxford, UK) for correcting motion and B0 distortion artifacts.
Prior to parameter quantification, subject motion and geometric distortions induced by B0 inhomogeneities were corrected with a pipeline, increasing the spatial precision for both magnitude-based contrasts (e.g., ASL) and phase-based contrasts (e.g., MRE).
38
In order to allow for inter-subject statistics, all individual CBF- and MRE maps were normalized to the automated anatomical labeling (AAL) atlas of brain regions in the anatomical standard space defined by the Montreal Neurological Institute brain template
39
by employing the combined spatial normalization and segmentation algorithm included in SPM12. Whole-brain parenchyma and regions of the AAL atlas were analyzed. Whole brain specifies the entire parenchyma including gray and white matter without ventricles and larger CSF filled sulci. A region was selected from the atlas if at least 30% of its voxels in the MRE and ASL volumes overlapped for all subjects and in all three phases of the hypercapnia challenge. Figure 2(a) shows a tabular overview of all analyzed regions.
(a) Overview of all analyzed regions of the AAL atlas fulfilling the criterion of minimum 30% of overlapping voxels for all subjects in all three phases of the hypercapnia challenge. (b) Analyzed regions labeled in the exemplary slice shown in Figure 3.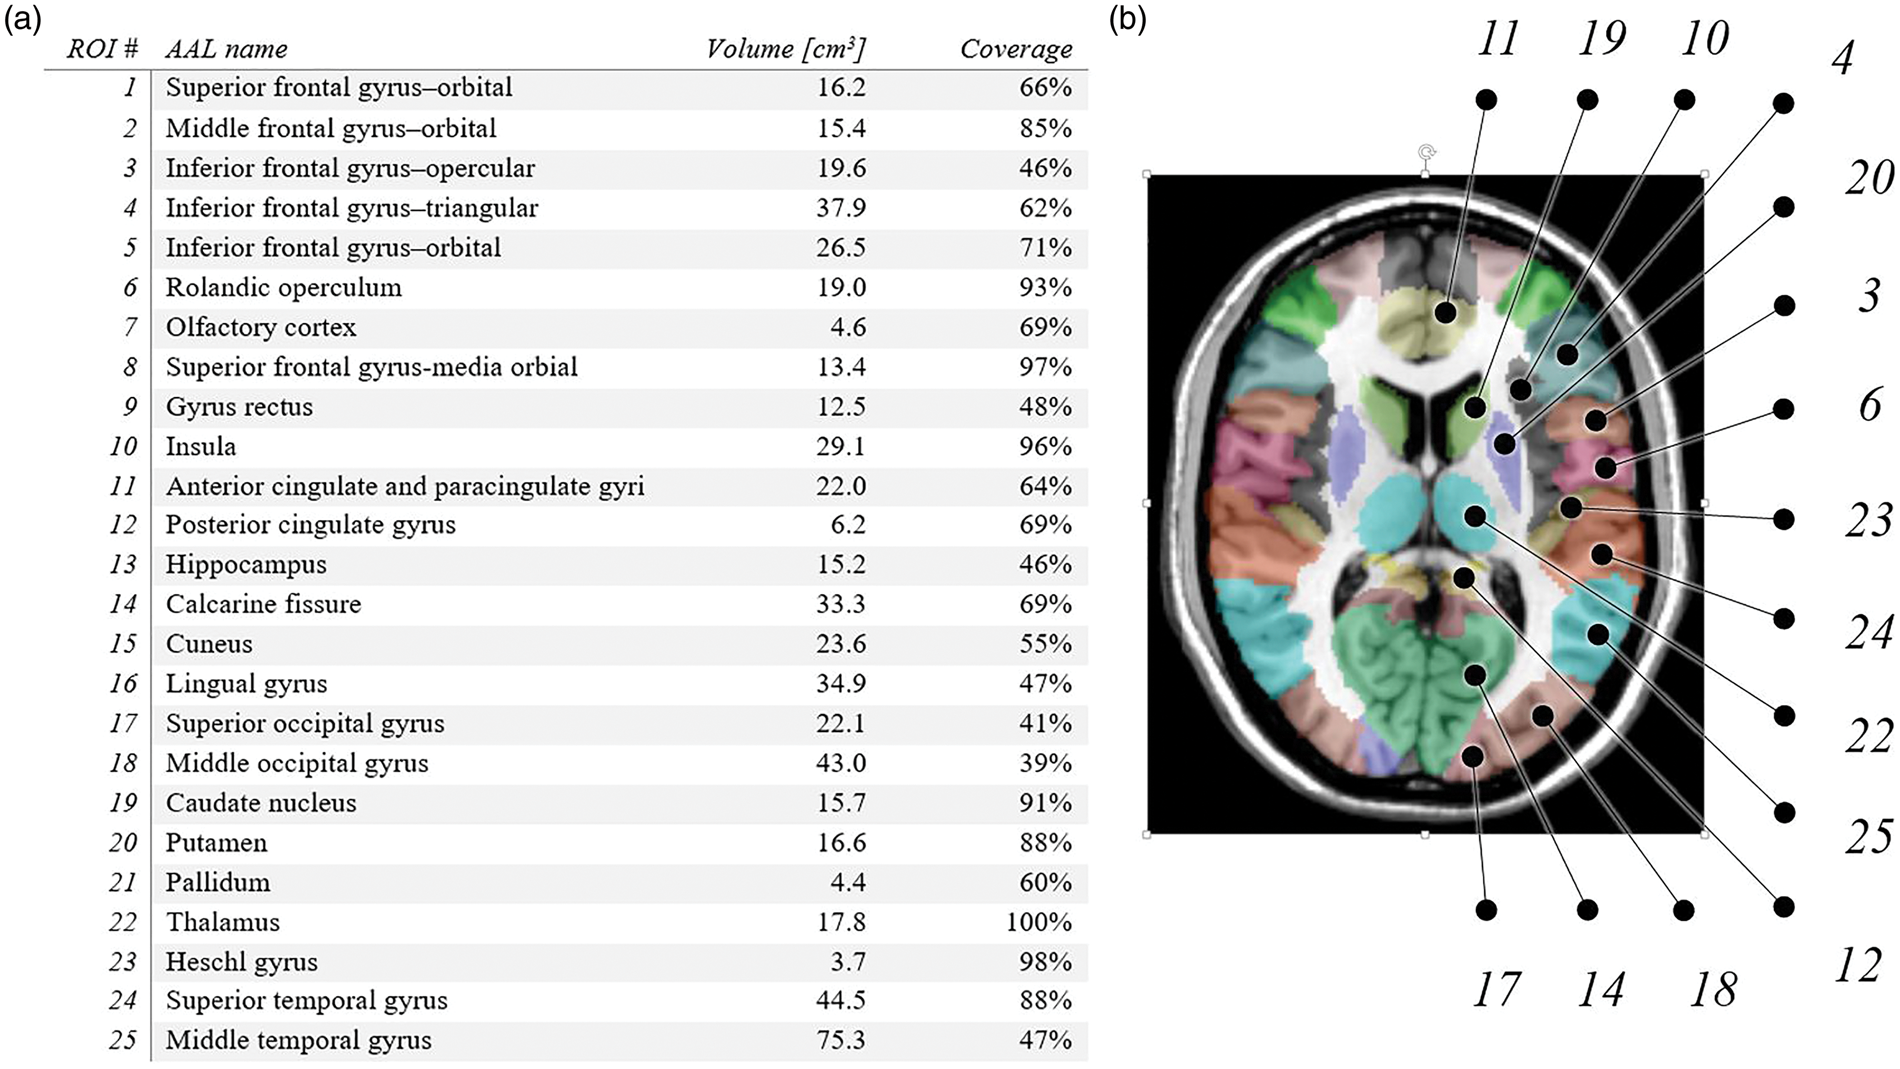
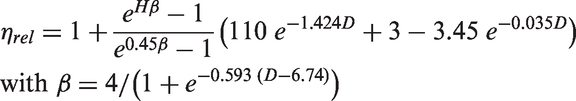
Theoretical blood viscosity changes resulting from vasodilation were calculated with the following parametric equation by Pries et al.
40
derived from in vitro experiments of the Fåhræus–Lindqvist effect
Statistical analyses
All statistical analyses were performed using Matlab Statistics Toolbox. All group-averaged mean values are reported with the corresponding standard deviation. A p value <0.05 was considered statistically significant for Student’s t tests and Pearson’s correlation analyses.
To test regional correlations between MR-derived parameters at the group level, regional correlation coefficients were converted to z values using Fisher’s r-to-z transform. These z values were then used in a one-sample t test (thresholded at p < 0.05).
Results
Figure 3 shows group-averaged perfusion and stiffness maps of one representative image slice for the three phases of the hypercapnia challenge. Figure 4 shows the group-averaged values of whole-brain perfusion, stiffness, and viscosity next to the average values of BP and HR. All of them follow a similar pattern: (i) highly significant increase from normocapnia to hypercapnia: Δ|G*| = +3.3 ± 1.9% (p = 1.1 × 10⁻⁵), Δϕ = +2.0 ± 1.1% (p = 1.8 × 10⁻⁶), ΔCBF = + 36 ± 15% (p = 1.7 × 10⁻⁷), ΔBP = +3.4 ± 3.0% (p = 4.3 × 10⁻³), ΔHR = +5.1 ± 6.0% (p = 5.2 × 10⁻³); (ii) decrease after hypercapnia with significant differences for stiffness, viscosity, and perfusion only: Δ|G*| = −2.4 ± 1.9% (p = 3.9 × 10⁻⁴), ΔBP = −0.8 ± 3.7% (p = 4.5 × 10⁻¹), Δϕ = −2.0 ± 0.7% (p = 1.2 × 10⁻⁶), ΔHR = −2.3 ± 6.4% (p = 9.6 × 10⁻²), and ΔCBF = −36 ± 11% (p = 1.6 × 10⁻⁷). For an overview of all group-averaged whole-brain MRE and CBF values, see Table 1.
Group-averaged perfusion, stiffness, and viscosity maps of one exemplary slice in Montreal Neurological Institute space for the three phases of the hypercapnia challenge. See Figure 2(b) for the corresponding map of analyzed AAL atlas regions in the same slice. Note the pronounced CBF offset in the auditory cortex activated by the scanner noise (Heschl’s gyrus—ROI #23, white arrow). CBF: cerebral blood flow. Highly significant increase in all parameters between normocapnia and hypercapnia (red). Decrease in all measured parameters after hypercapnia (blue) with significant differences for whole-brain perfusion, stiffness, and viscosity only (*p < 0.05; **p < 0.01; ***p < 0.001). Note the significant CBF drop under baseline (dashed line) after hypercapnia. For detailed values, see Table 1. CBF: cerebral blood flow. Group-averaged whole-brain MRE and CBF values and corresponding vital function parameters during the hypercapnia challenge. CBF: cerebral blood flow.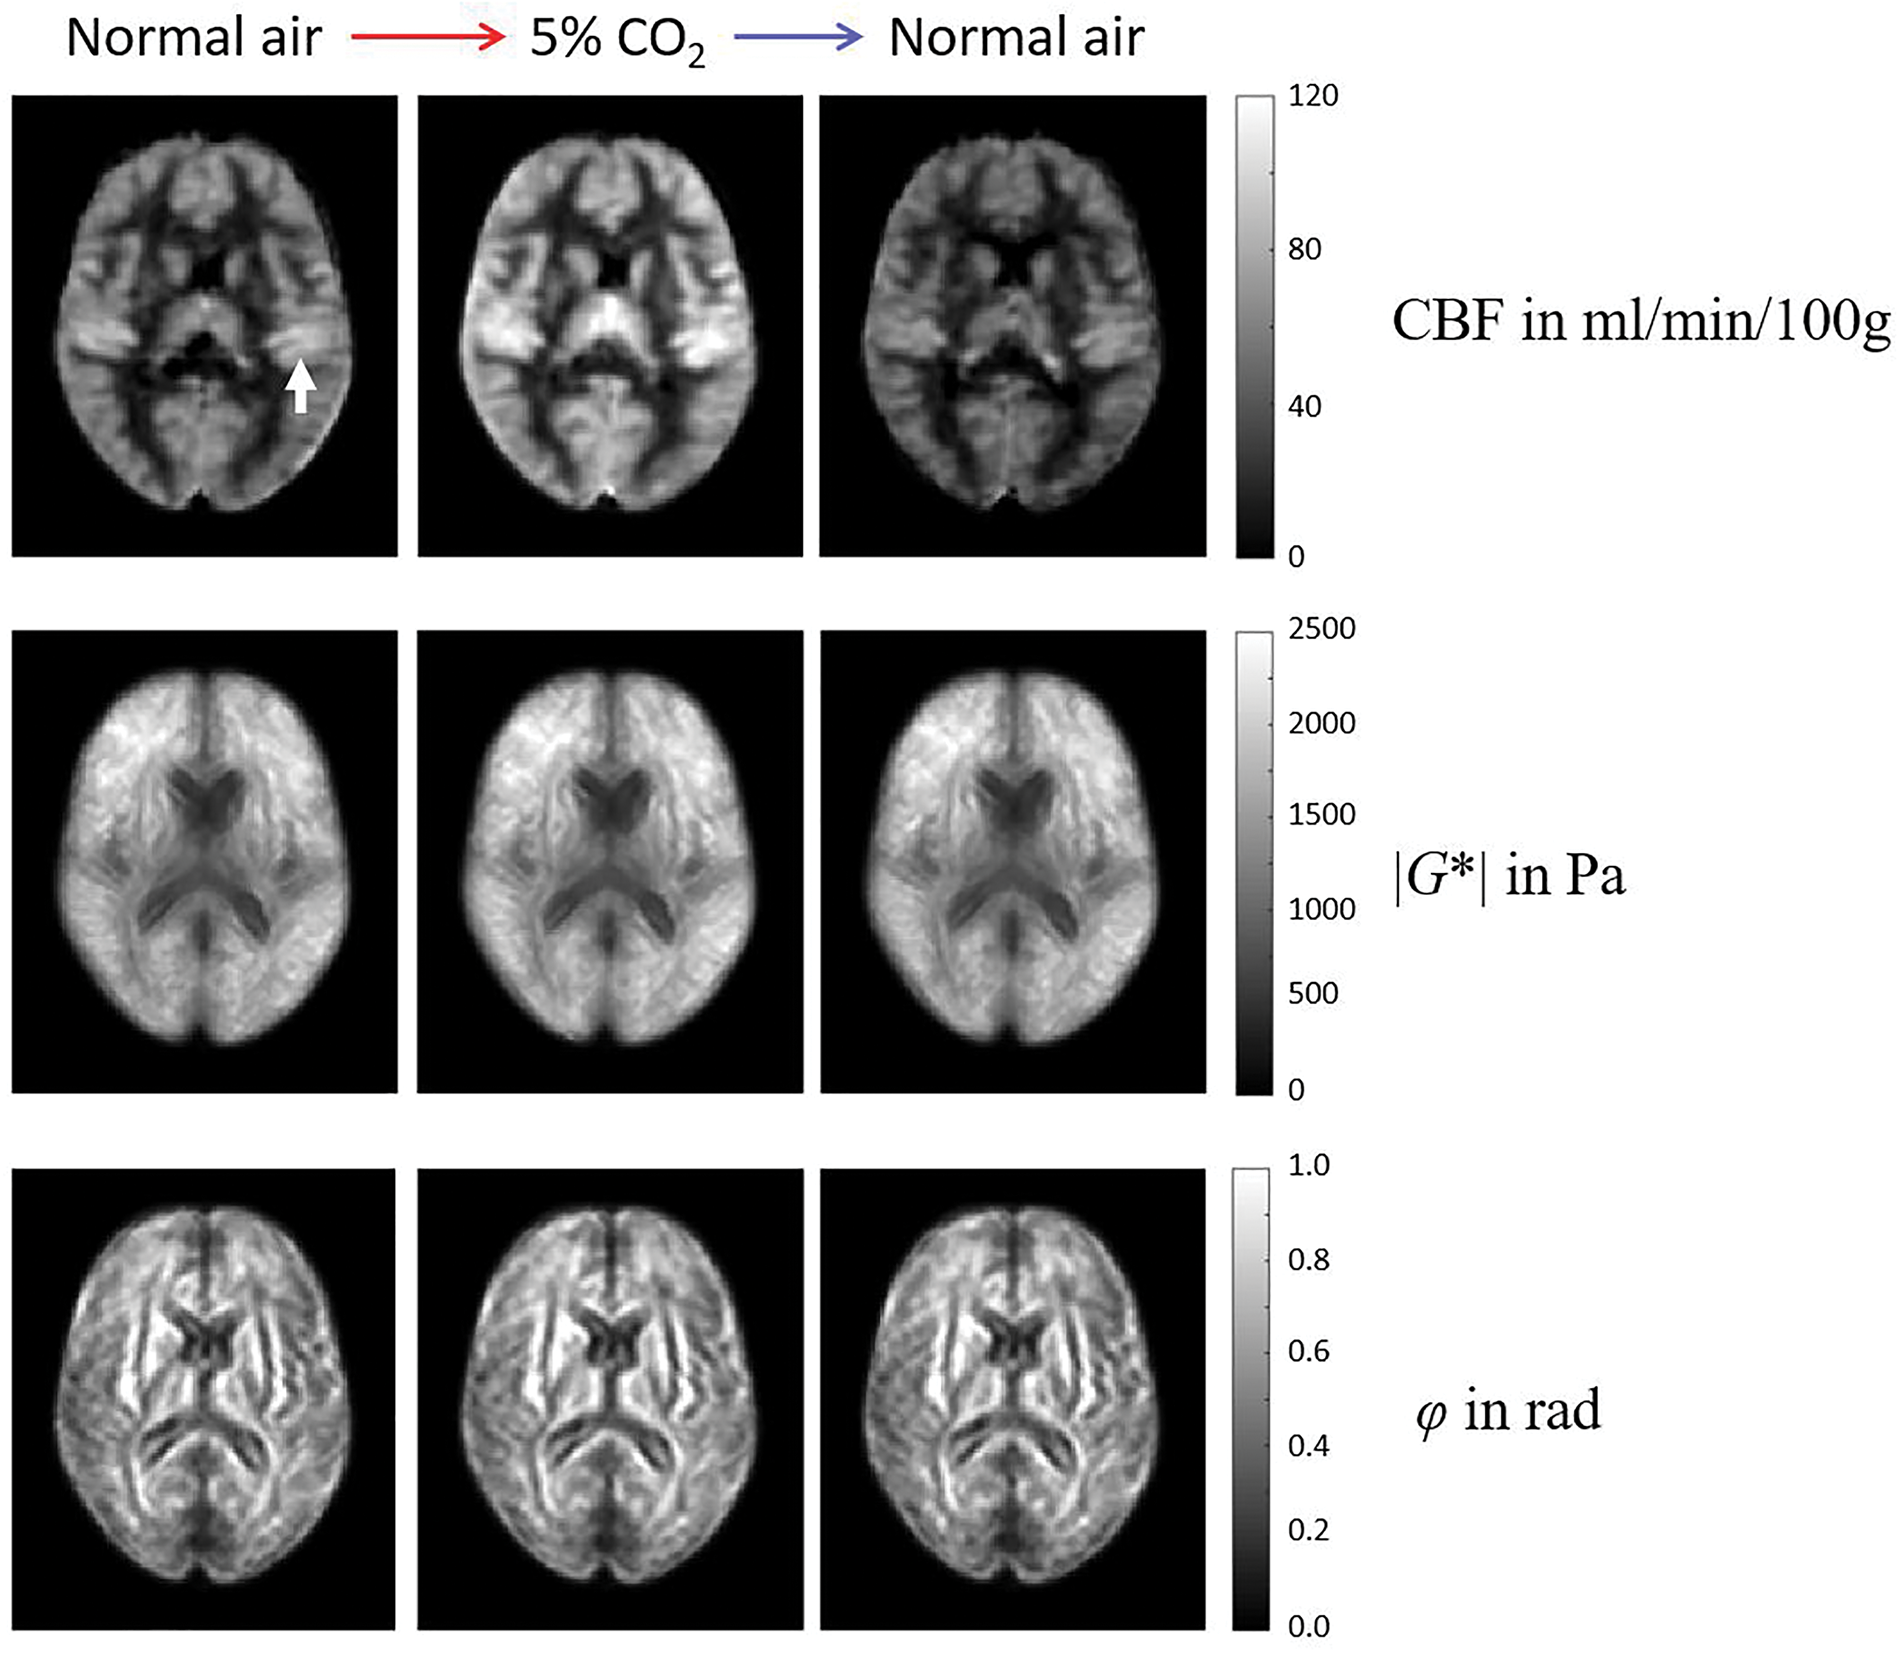
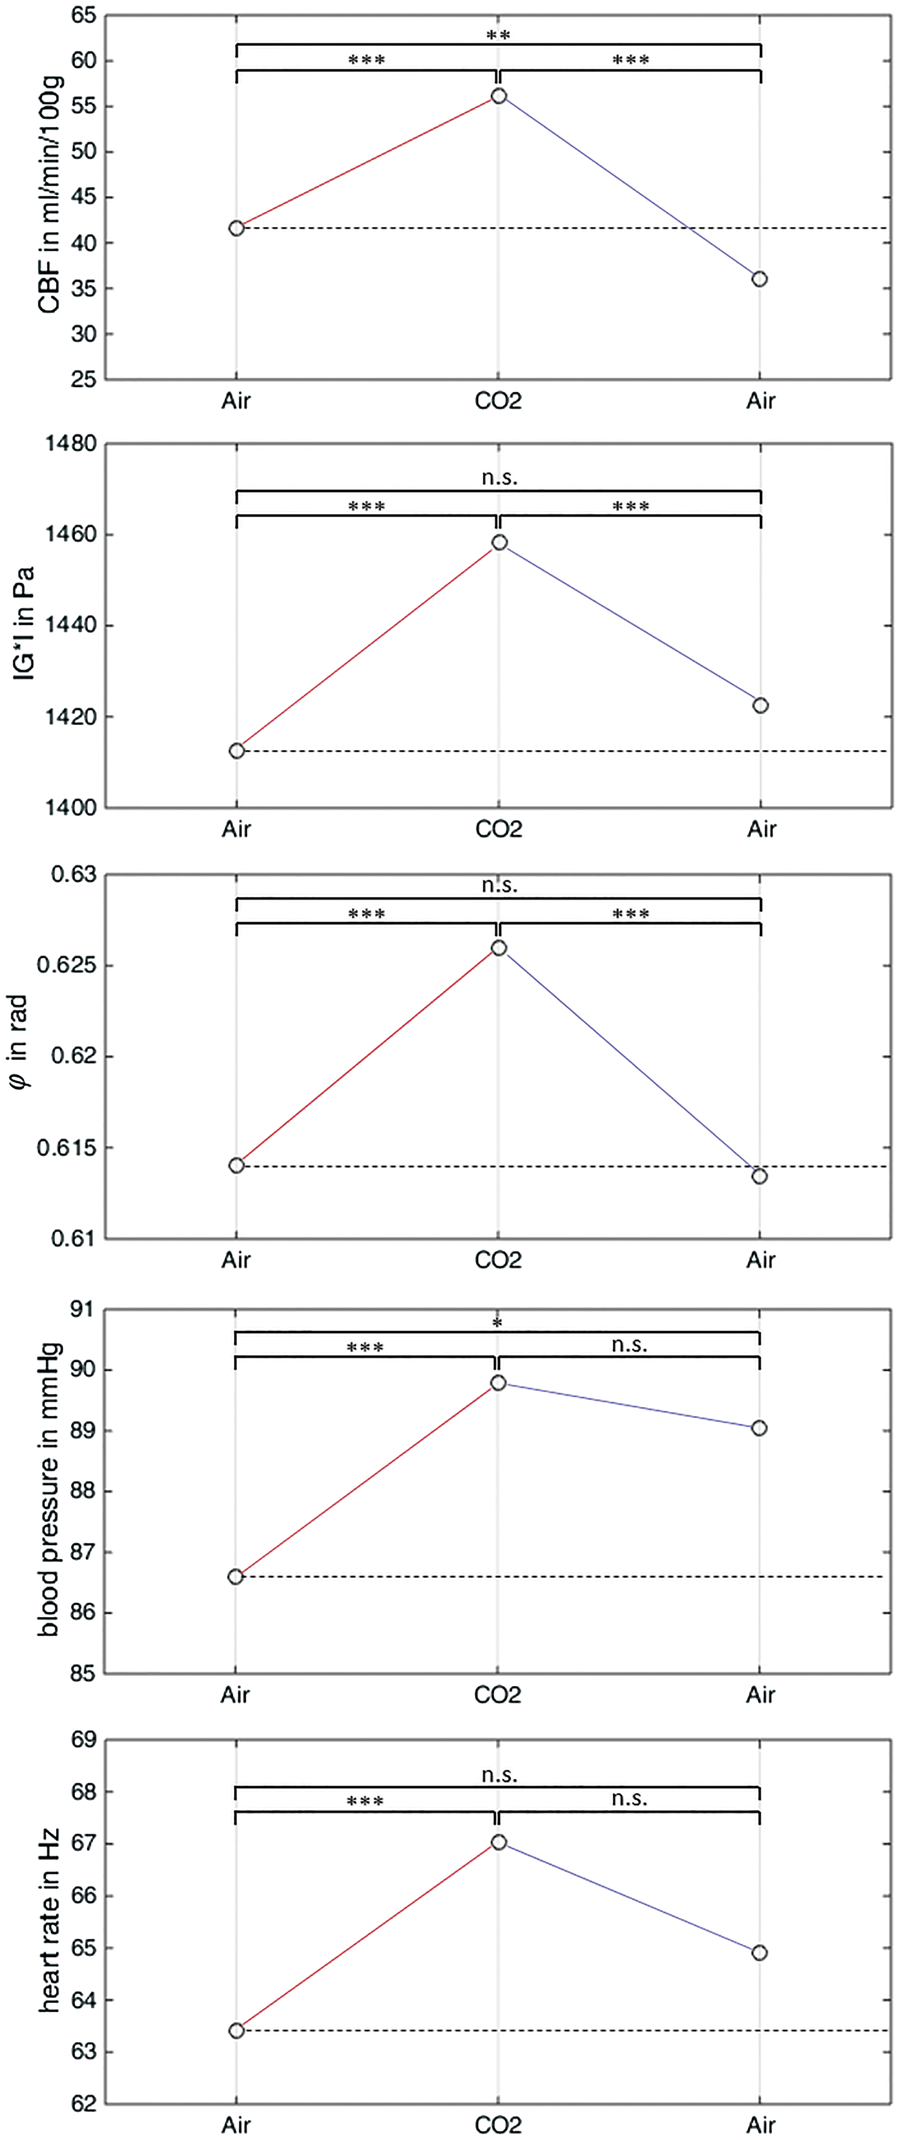
Considering both normocapnia examinations, no significant differences were observed for MRE parameters and HR while BP remained slightly elevated after hypercapnia (ΔBP = +2.8 ± 3.7%, p = 0.019). As expected from observations by Jain et al., 44 CBF values after hypercapnia dropped under the baseline by 13 ± 15% (p = 0.005).
Figure 5(a) depicts the distinct clusters of individual whole-brain Δ|G*| and ΔCBF after the transition to hypercapnia (with increasing |G*| and CBF for all subjects; red circles) and between hypercapnia and the following normocapnia period (with decreasing |G*| and CBF for all subjects; blue circles). Corresponding clusters of whole-brain Δϕ and ΔCBF are shown in Figure 5(b) with significant positive correlations between Δϕ and ΔCBF for both hypercapnia transition phases (normocapnia → hypercapnia: r = 0.60, p = 0.024; hypercapnia → normocapnia: r = 0.82, p = 0.0003).
Whole-brain analysis (top row) and group-averaged region-specific analysis (bottom row) of stiffness and viscosity changes versus CBF changes observed for the transitions normocapnia→hypercapnia (red symbols) and the reverse process hypercapnia→normocapnia (blue symbols). For the whole-brain analysis (a and b), the whole-brain average values are shown for each of the 14 subjects (one circle = one subject). For the region-specific analysis (c and d), the group averages of these quantities over all subjects were calculated for each of the analyzed GM regions of the AAL atlas (one dot = group-averaged value of one region). While hypercapnia induced an increase in all three quantities in the global and regional analysis, the transition to normocapnia had the opposite effect. CBF: cerebral blood flow.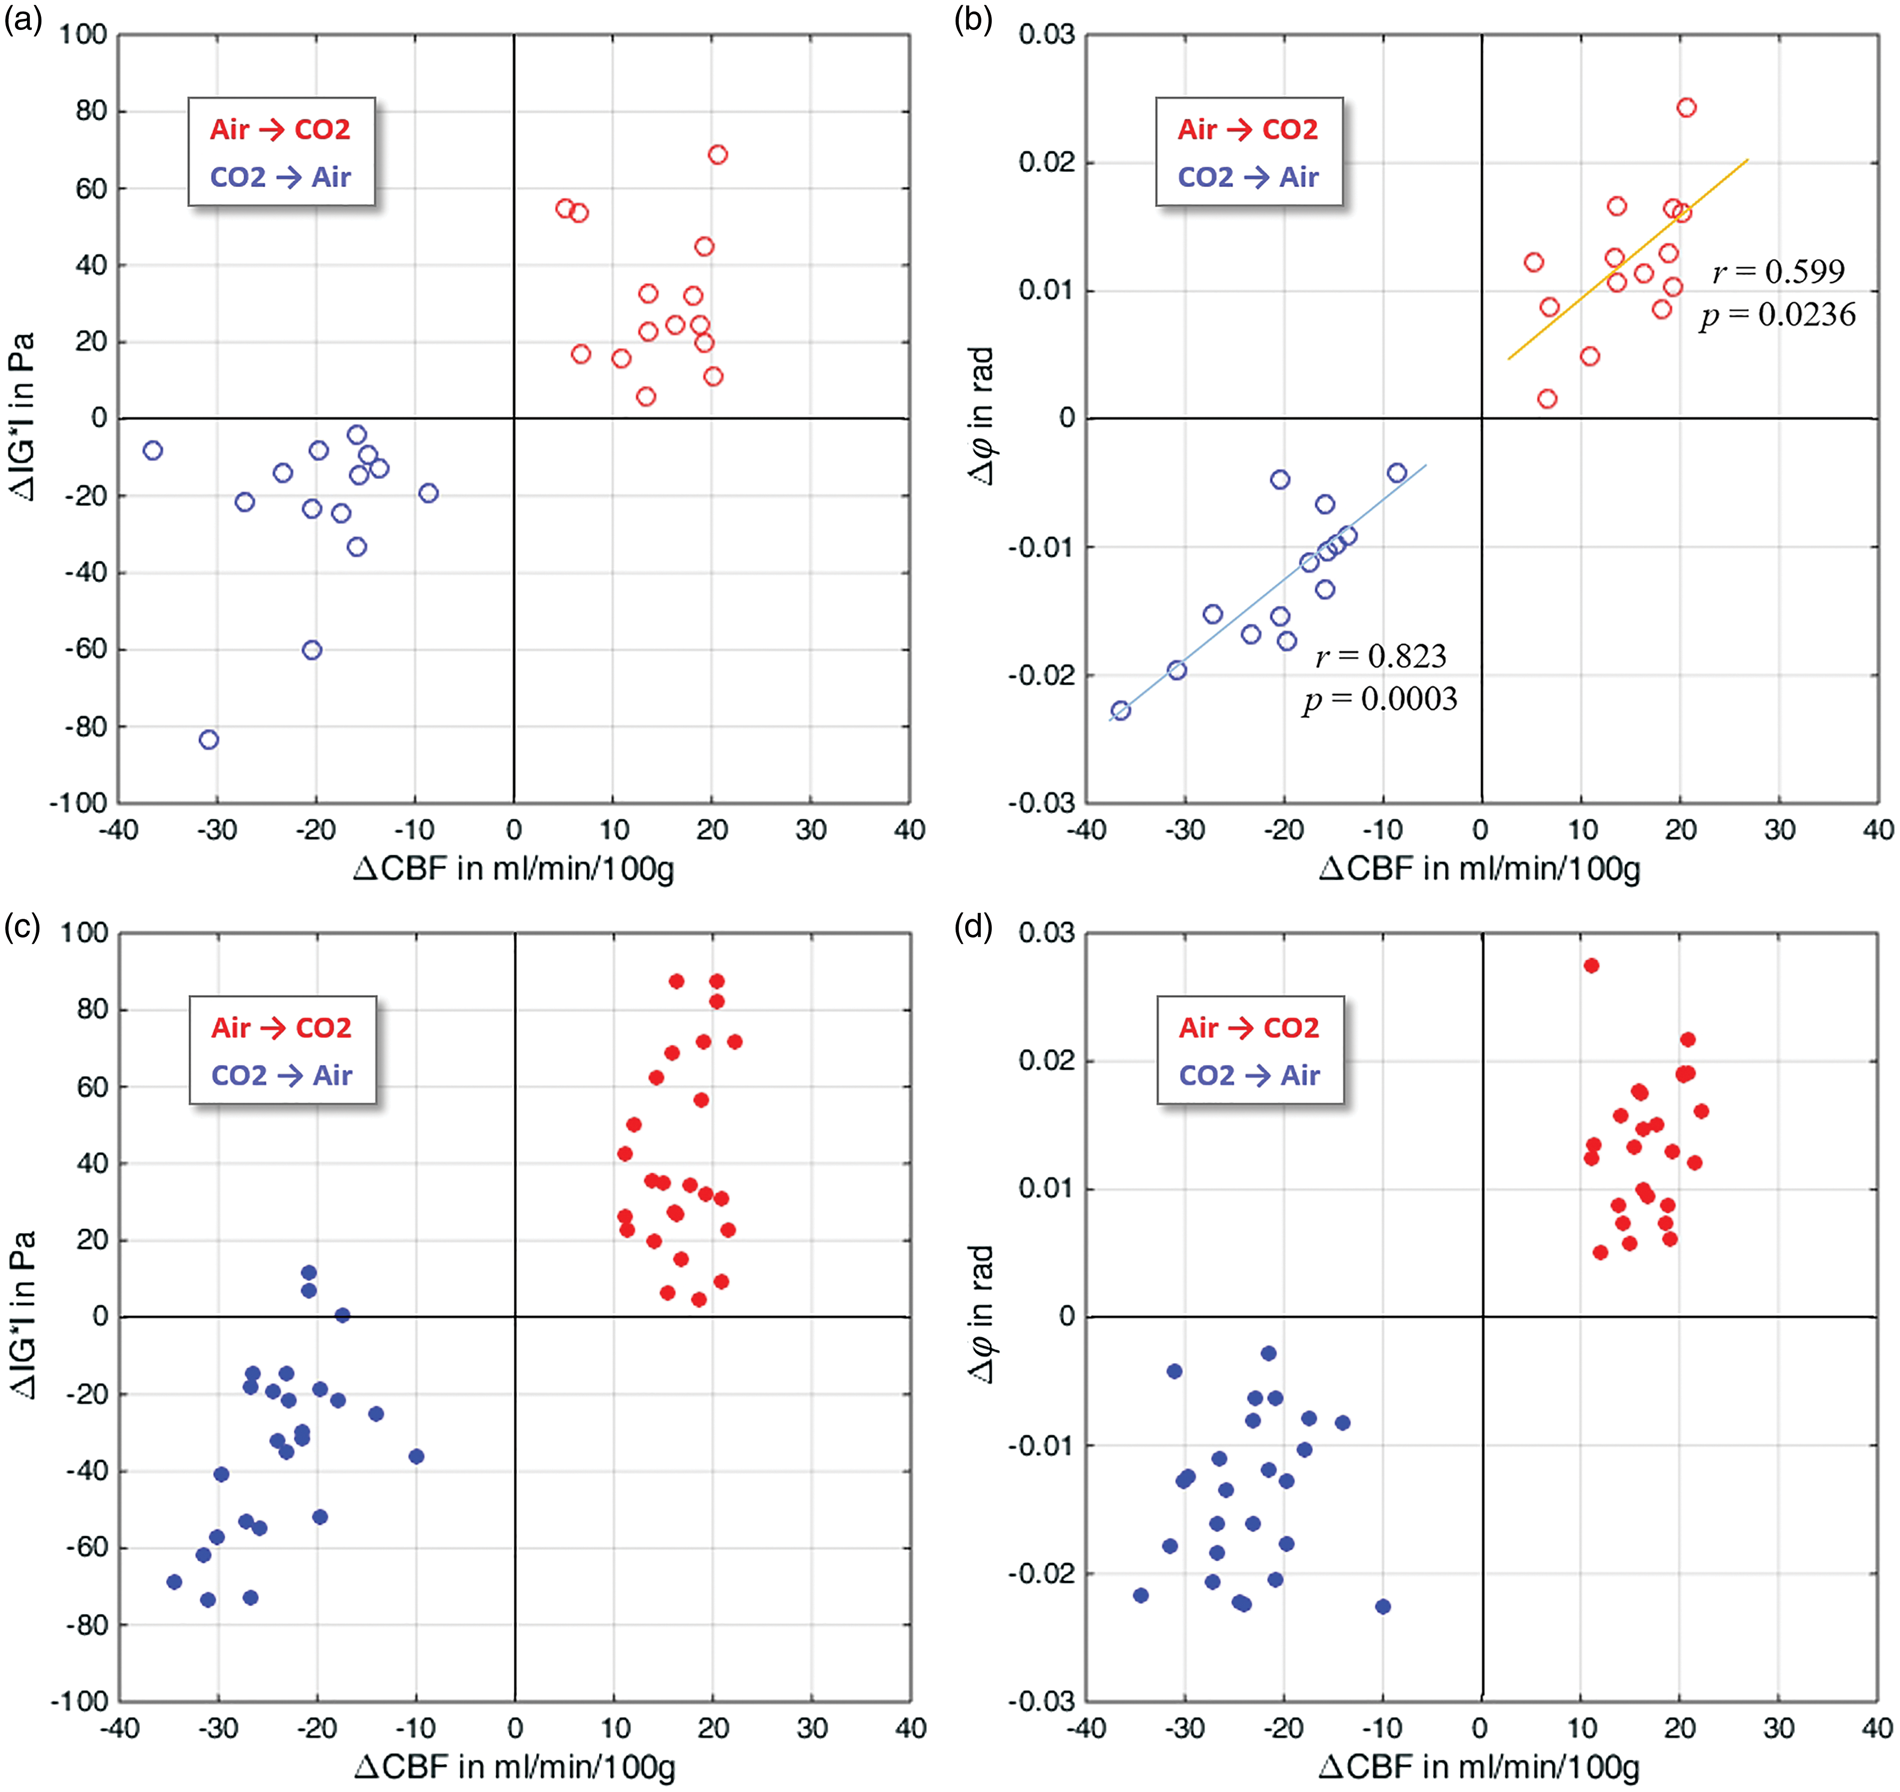
Figure 5(c) shows the average values of Δ|G*| and ΔCBF for all 25 analyzed regions of the AAL brain atlas after the transition to hypercapnia (with increasing |G*| and CBF for all regions; red dots) and between hypercapnia and the following normocapnia period (with decreasing |G*| and CBF for all regions; blue dots). The corresponding clusters of Δϕ and ΔCBF are shown in Figure 5(d).
The effect of positive correlation between Δϕ and ΔCBF found across the whole-brain values of 14 subjects (see Figure 5(b)) was also detectable in the region-specific analysis within the AAL atlas (see Figure 6(a)) as indicated by a group-level one-sample t test (t = 3.5, p = 0.002) on Fisher’s z-transformed regional correlation coefficients (r = 0.21 ± 0.55). No such correlation was observed between regional resolved Δ|G*| and ΔCBF (r = −0.06 ± 0.60, t = −1.0, p = 0.32).
(a) A group-level analysis of the regional correlations between viscosity and perfusion changes due to hypercapnia revealed a highly significant positive correlation (r = 0.2 ± 0.5, t = 3.5, p = 0.002). (b) The MRE-measured viscosity changes Δϕ correlated well with blood viscosity changes Δηlit predicted by the Fåhræus–Lindqvist model
40
and regional microvessel diameter data from the literature
43
(r = 0.64, p = 8.0 × 10⁻⁴). CBF: cerebral blood flow.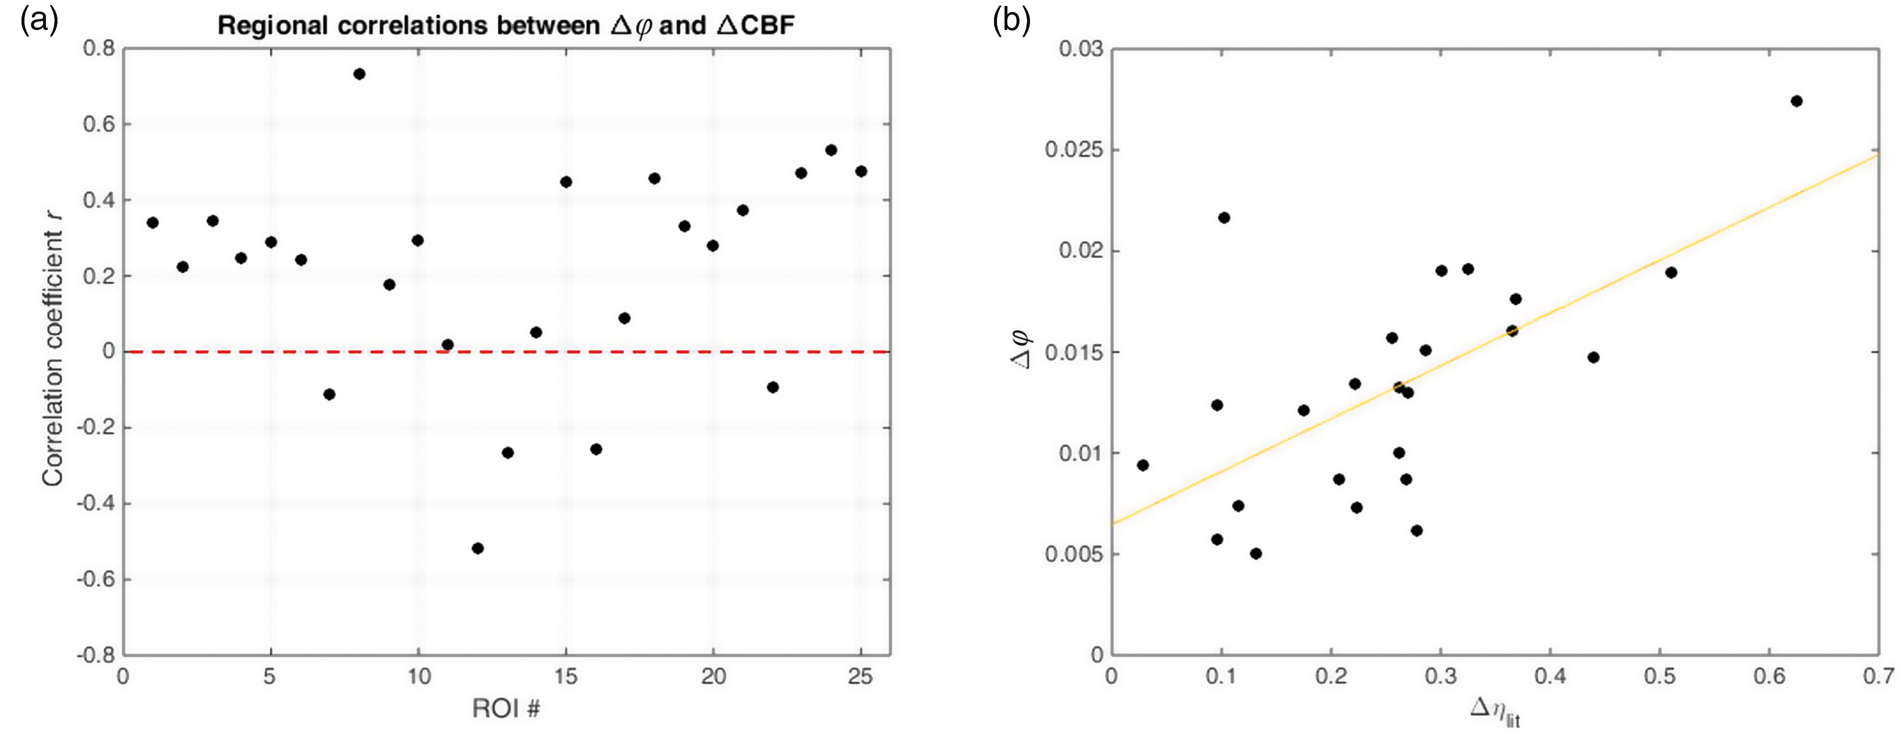
Figure 6(b) shows the correlation between regional hypercapnia-induced Δϕ values and theoretical vasodilatory blood viscosity changes derived from a model of the Fåhræus–Lindqvist effect (equation (2)) and regional vessel size data (r = 0.64, p = 8.0 × 10⁻⁴). A similar correlation was also found between regional Δϕ values and vessel diameter changes ΔD (r = 0.66, p = 3.6 × 10⁻⁴) but not between regional Δ|G*| and ΔD values (r = 0.29, p = 0.16).
Following hypercapnia, we observed a mean increase in the perfusion pressure gradient of +8.4 ± 15.5% averaged over all analyzed regions with values ranging from −23.9% in the hippocampus to +39.2% in the superior frontal gyrus. Across gray matter regions, we found significant inverse correlations between local change in perfusion pressure gradients and change in viscoelastic tissue properties (Δϕ: r = −0.53, p = 0.0083; Δ|G*|: r = −0.62, p = 0.0013).
Discussion
To the best of our knowledge, this is the first report on hypercapnia-induced increase of in vivo viscoelasticity of brain tissue. Our results demonstrate the high sensitivity of MRE to hypercapnia-induced changes of viscoelasticity on the order of 2% to 3%. In contrast, ASL measured relative CBF changes on the order of 40%. Assuming a hypercapnia-induced increase in vessel diameter of approximately 13% in GM, 43 the Fåhræus–Lindqvist model (equation (2)) predicts an increase of 20% in blood viscosity which, with approximately 5% blood in GM tissue, 45 translates to a blood-viscosity effect of only 1% in global GM. The overall larger effect in MRE parameters indicates the importance of fluid–solid interactions for global tissue-mechanical properties. Furthermore, the correlation between MRE-measured viscosity changes and vascular size changes as shown in Figure 6(b) suggests that capillary blood flow influences the damping properties of brain tissue while stiffness is less affected. Note that the magnitude shear modulus |G*| is a mixed quantity of both elastic and viscous properties while ϕ is solely related to viscous properties. We therefore hypothesized that ϕ is more directly related to blood-viscosity changes addressed in our study than |G*|. The Fåhræus–Lindqvist effect postulates that blood viscosity increases with increasing diameter of capillaries. Our data show that MRE is sensitive to this effect and thereby reveal a new mechanism of mechanical brain function with potential importance to the neurovascular coupling in functionally activated areas of the brain. Future research in the field of functional diffusion imaging 46 and functional MRE, such as recently reported,47,48 should account for vascular contributions similar to those presented here.
Furthermore, we observed an inverse correlation between changes in local perfusion pressure gradient and MRE parameters which points toward the influence of vessel sizes on cerebral viscoelasticity. Since the perfusion pressure gradient decreases with increasing vessel sizes, 28 our correlation results are consistent with the well-known vasodilatory response of the brain during hypercapnia and the associated blood viscosity change. This sensitivity of cerebral viscoelasticity to vessel size changes makes MRE potentially useful for the assessment of vasodilatory reactivity related to many diseases such as hypertension or stroke. Interestingly, positive outcomes of therapeutic hypercapnia are reported mainly for the hippocampus49,50 in which we measured the largest increase in MRE parameters (∼5%) and the largest negative change in perfusion pressure gradient (−24%). This is in alignment to our previous work in which we interpreted elevated perfusion pressure gradient values as being indicative of higher risk of vascular rupture. 28
Although encouraging, our study has limitations. We are aware of the relatively small effect in MRE parameters, which was significant in repeated experiments with unchanged head positions under well-controlled hypercapnia challenges. However, cerebral MRE generally shows relatively wide variability across subjects of same age and sex.8,25 The origin of this variability is the subject of ongoing research. 51 A recent analysis based on 3D heterogeneous multifrequency direct inversion increased the overall consistency of brain MRE but still showed some outliers of unknown origin. 52 Therefore, we used here the validated MDEV pipeline identical to previous studies and focused on relative viscoelasticity changes. While the hypercapnia-induced modulation of vital parameters (e.g., HR, BP, CBF) is well known, 53 uncovering the mechanisms behind the observed viscoelasticity changes requires further research. For example, we cannot determine if intrinsic blood rheology alterations induced by breathing gas manipulation, blood rheology changes due vasodilation, or associated blood volume changes dominate the observed increase in brain viscoelasticity. Also, normoxic vessel diameters which we took from Shen et al. 43 rely on the assumption that hyperoxia and hypercapnia have similar effects with inverse signs on vessel diameters. However, it is known that the cerebral blood volume decreases less during hyperoxia (100% O2 in breathing air) than it increases during mild hypercapnia. 54 Therefore, hypercapnia could induce an even larger increase in vessel diameter D than we accounted for in equation (2) resulting in an overall underestimation of the hypercapnia-induced blood viscosity change. More insight is expected from future studies accounting for hypercapnia and hyperoxia in a single examination by combining MRE-ASL with more quantitative MRI methods such as vessel size imaging, 55 diffusion imaging, or T2* mapping.
In summary, we showed that hypercapnia-induced vasodilatation increases brain viscoelasticity with excellent correlation between CBF changes and changes in the phase angle ϕ of the complex shear modulus. The Fåhræus–Lindqvist effect of blood viscosity might explain the high sensitivity of MRE-measured viscosity ϕ to hypercapnia-induced changes in blood vessel diameters. Therefore, MRE could be of future clinical value for the assessment of vasodilatory reactivity related to many diseases such as hypertension or stroke.
Footnotes
Funding
The author(s) disclosed receipt of the following financial support for the research, authorship, and/or publication of this article: IS and JB received funding from the German Research Foundation (grant no. Sa 901/16). Furthermore, IS received funding from the German Federal Ministry of Education and Research (BMBF 01GQ1408) and from the European Union’s Horizon 2020 Programme (ID 668039, EU FORCE—Imaging the Force of Cancer).
Acknowledgements
The authors would like to thank Philipp Sonnenschein for his valuable help during data acquisition and Martin Weygandt and Thomas Christophel for fruitful discussions.
Declaration of conflicting interests
The author(s) declare no potential conflicts of interest with respect to the research, authorship, and publication of this article.
Authors’ contributions
SHe and IS conceived and designed the experiments. KB, FD, SHe, SHi, and AL performed the experiments. SHe, IS, KB, and DJJW were involved in the analysis and interpretation of the data, alongside SHi and JB. IS, SHe, and SHi wrote the manuscript, and all authors provided critical revisions.