
Abstract
Blood pressure is tightly controlled by the central nervous system, particularly the brainstem. The aim of this study was to investigate the relationship between mean blood pressure (MBP), muscle sympathetic nerve activity (MSNA) and resting regional brain activity in healthy human subjects. Pseudocontinuous arterial spin labeling and functional magnetic resonance imaging of the brain were performed immediately following a laboratory microneurography recording of MSNA and BP measurement in 31 young, healthy normotensive subjects. Regional cerebral blood flow (CBF) correlated significantly with resting MBP levels in the region encompassing the rostroventrolateral medulla (RVLM), dorsolateral pons, and insular, prefrontal and cingulate cortices. Functional connectivity analysis revealed that the ventrolateral prefrontal cortex displayed greater resting connectivity strength within the RVLM in the lower compared with the higher MBP group. No significant differences in CBF were found when subjects were divided based on their MSNA levels. These results suggest that even subtle differences in resting MBP are associated with significant differences in resting activity in brain regions, which are well known to play a role in cardiovascular function. These data raise the question of the potential long-term consequences of differences in regional brain activity levels and their relationship with systemic blood pressure.
Keywords
Introduction
The regulation of baseline blood pressure (BP) is essential for maintaining perfusion to vital organs and is one of the fundamental roles of the central nervous system. Over the past half a century, many experimental animal investigations have found that synaptic activity levels in areas of the brainstem, in particular within the medulla, are critical for the beat-to-beat homeostatic regulation of BP.1–3 These studies have revealed that when BP rises, baroreceptors located within the carotid sinus and aortic arch are excited, resulting in activation of neurons in the nucleus of the solitary tract (NTS). In turn, the NTS excites neurons in the region of the caudal ventrolateral medulla (CVLM), which then exerts tonic inhibitory control of the rostral ventrolateral medulla (RVLM).1–3 The RVLM is the primary output nucleus for sympathetic vasoconstrictor drive to the muscle, splanchnic, and renal vascular beds, and as such plays an important role in the ongoing regulation of total peripheral resistance and hence BP. Sympathetic outflow to the muscle vascular bed can be recorded directly in humans via microelectrodes inserted into a peripheral nerve (microneurography). Using concurrent microneurography and functional magnetic resonance imaging (fMRI), we have recently confirmed the role of the NTS-CVLM-RVLM circuit in regulating muscle sympathetic nerve activity (MSNA) in awake humans. 4
In addition to playing a critical role in BP homeostasis, preclinical studies have shown that the RVLM is critical for maintaining absolute resting BP levels. Almost all sympathetic premotor vasoconstrictor neurons originate in the RVLM and electrolytic destruction of the RVLM results in precipitous, life-threatening falls in BP. 5 Given this, it has been hypothesized that altered functioning of the RVLM may underlie the development of at least some forms of hypertension and, although there is no association between resting MSNA and BP, 6 it is well established that elevated MSNA contributes to the development of hypertension in humans.7–9 While numerous studies have shown the importance of the central nervous system in regulating long-term BP,10–12 the mechanisms through which the brain contributes to hypertensive processes are not well understood. Furthermore, it remains unknown if activity levels in brainstem regions such as the RVLM are critical for maintaining resting BP in normotensive individuals. If they are, it is possible that changes in resting activity in regions such as the RVLM may be associated with clinical hypertension, and subtle changes may even precede the development of hypertension. Given that an increase in activity of neurons in the brain requires adequate delivery of oxygen and glucose from the blood, one might expect that a higher level of baseline blood flow to a particular region would indicate a higher level of neuronal activity at rest.
The aim of this study was to determine the relationships between regional ongoing brain activity and MSNA and BP in healthy normotensive human subjects. To address this aim, we used fMRI and pseudocontinuous arterial spin labeling (pCASL) to quantify regional cerebral blood flow (CBF). Given that baseline MSNA and BP differ across individuals, we hypothesize that inter-individual differences in regional blood flow, a proxy marker of neuronal activity, within the RVLM would be associated with differences in baseline MSNA and BP. Moreover, we predict that differences would also arise in cortical regions, such as the insular and prefrontal cortices, which are known to influence the RVLM. Indeed, we recently used MSNA-coupled fMRI to identify cortical and subcortical areas that are functionally coupled to the RVLM.13,14 Accordingly, we hypothesize that the strength of resting functional connectivity between the RVLM and areas such as the insula and prefrontal cortices will be significantly related to both resting BP and MSNA.
Material and methods
Subjects
Experiments were performed on 31 healthy subjects (13 females, 18 males; mean±SD age: 23.3 ± 3.8) at the same time of day (2 p.m.) for each subject. No subject had any history of cardiovascular, neurological, or psychiatric diseases. Subjects were instructed to omit from rigorous exercise and from drinking caffeine prior to the experiment. No other dietary instructions were given. All procedures were approved by the Human Research Ethics Committees of Western Sydney University and the University of New South Wales. Written consent was obtained from all subjects in accordance with the Declaration of Helsinki.
Microneurography
Subjects lay supine on a magnetic resonance imaging (MRI) bed with the legs supported by a foam cushion. Percutaneous insertion of a tungsten microelectrode into a muscle fascicle of the right common peroneal nerve was used to record resting multiunit MSNA. Intraneural stimulation was used to guide the microelectrode tip into a muscle fascicle, defined as such if twitches of a specific muscle, without radiating paraesthesia, were generated at currents of 0.01–0.02 mA. Neural activity was amplified 100 times via an MR-compatible head-stage located close to the recording site and further amplified to a total gain of 20,000 times, and a band pass of 300 Hz to 5 kHz (NeuroAmp EX; ADInstruments, Sydney, Australia), and stored on a computer, using a computer-based data acquisition and analysis system (PowerLab16SP hardware and LabChart 7 software; ADInstruments, Sydney, Australia). Spontaneous bursts of MSNA were identified by their strong cardiac rhythmicity, and an increased burst incidence during an inspiratory-capacity apnoea. At least 5 min of continuous MSNA, BP (radial arterial tonometry; Colin 7000 NIBP; Colin Corp., Aichi, Japan), and heart rate (ECG (0.3–1.0 kHz) with Ag-AgCl surface electrodes on the chest sampled at 2 kHz) were then recorded with the subject relaxed. The BP monitor was then removed, and the subject wheeled to the scanner.
MRI scanning
Subjects were instructed to lay still, eyes closed and asked to not fall asleep. Using a 3 Tesla MRI scanner (Philips Achieva, 32-channel SENSE head coil), three scans encompassing the whole brain were collected: (1) a high-resolution 3D T1-weighted anatomical image (200 axial slices, echo time [TE] = 2.5 ms, repetition time [TR] = 5600 ms, raw voxel size = 0.87 mm3), (2) a series of 180 wholebrain resting state gradient echo echo-planar functional images (37 axial slices, [TE] = 30 ms, [TR] = 2000 ms, raw voxel size = 3 × 3 × 4 mm3), and (3) a series of 108 pCASL images (50 axial slices, 54 label/control image pairs, [TE] = 12.7 ms, [TR] = 5310 ms, raw voxel size = 2.4 × 2.4 × 3.0 mm3, labelling time = 1650 ms, slice time = 36.6 ms, post label delay time = 1600 ms, background suppression).
Analysis
MSNA
Individual bursts of MSNA were displayed as a mean-voltage neurogram, computed as the root-mean-square (RMS) processed signal with a moving time average window of 200 ms. MSNA burst frequency (bursts/min) was measured from this signal over a period of 5 min. The participants were divided into two separate groups based on a median split in MSNA frequency. Subjects with MSNA burst frequency less than the median were classified as “lower MSNA,” and subjects with MSNA greater than the median were classified as “higher MSNA.”
BP
BP was measured over the same 5 min period used to quantify MSNA. Participants were classified into two separate groups based on the median of the mean BP (MBP) for all subjects: those with an MBP less than the median were classified as “lower MBP,” and subjects with MBP greater than the median were classified as “higher MBP.”
pCASL image processing and analysis
Using statistical parametric mapping (SPM) 12 (Wellcome Trust Center for Neuroimaging, University College London, UK) and custom software, all pCASL image sets were realigned, co-registered to each individual’s T1-weighted image set, the label and control images averaged and a mean CBF image created using the subtraction method using the ASL toolbox. 15 Each subject’s T1-weighted anatomical image was then spatially normalized to a template in Montreal Neurological Institute (MNI) space and the parameters applied to the CBF maps. The wholebrain CBF maps were then smoothed using a 5 mm full-width at half-maximum (FWHM) Gaussian filter. We also performed a brainstem specific analysis in each subject. Using the spatially unbiased infratentorial template (SUIT) toolbox, 16 the brainstem was isolated from the T1-weighted anatomical image and normalized into MNI space and the parameters applied to the CBF maps resulting in a blood flow map of the brainstem only in MNI space. These brainstem maps were then spatially smoothed using 3 mm FWHM Gaussian filter. A grey matter mask derived from the T1-weighted anatomical image segmentation was used to restrict the wholebrain analysis to grey matter, and a brainstem-specific mask was used for the brainstem analyses.
We first evaluated the relationship between MBP and MSNA and total grey matter CBF. Then, significant differences in regional CBF between groups were determined using a voxel-by-voxel two-group random effects analysis (p < 0.05 family wise error corrected). Significant clusters were overlaid onto a mean of all subjects T1-weighted anatomical image. For each significant cluster, the CBF value for each subject was extracted and plotted along with the mean (±SD) for each of the two groups.
In addition to this two-group analysis, we performed a one-sample voxel-by-voxel linear correlation analysis to determine significant linear relationships between MBP and resting CBF and between MSNA and resting CBF using the brainstem and wholebrain images (age and gender including as nuisance variables). Following an initial threshold of uncorrected p < 0.001, we used cluster correction procedure (p < 0.05, corrected for multiple comparisons). 19 For each significant cluster, the CBF value for each subject was extracted and the values tested for normality using Shapiro–Wilk Normality tests. Since all data were normally distributed, Pearson’s correlation coefficients were added to each of the plots to provide an estimate of tightness of linear relationship between variables.
fMRI image processing and analysis
In a first set of analysis, using SPM12 and custom software, all fMRI images were realigned, detrended using the method described by Macey et al., 17 and then co-registered to each individual’s T1-weighted anatomical image set. The T1-weighted anatomical image was then spatially normalized to a template in MNI space and the parameters applied to the fMRI image sets. Furthermore, we used the dynamic retrospective filtering (DRIFTER) algorithm, 18 which is a Bayesian method for physiological noise correction, to reduce the potential effects of physiological noise on our results. A cardiac frequency band of 60–120 beats per minute (+1 harmonic) and a respiratory frequency band of 8–25 breaths per minute (+1 harmonic) were removed using the DRIFTER algorithm. We performed both wholebrain and brainstem specific analyses. For the brainstem focused analysis, the brainstem was isolated and spatially normalized to a brainstem-specific template in MNI space using the SUIT toolbox as described above. Finally, the wholebrain and brainstem images were spatially smoothed using 5 mm and 3 mm FWHM Gaussian filters, respectively.
Using the wholebrain and brainstem specific fMRI image sets, we performed a resting functional connectivity analysis using the region of the right rostroventrolateral medulla (RVLM), an area in which we found significant blood flow differences in the lower versus higher MBP group analysis. To explore resting functional connectivity strengths between the right RVLM and the voxels in the brain that also showed significant blood flow differences, we first extracted the signal intensity changes from the right RVLM using the brainstem-only images. We then performed a voxel-by-voxel analysis on the whole-brain only fMRI images sets to determine brain regions that displayed significant signal intensity covariations with the right RVLM. For each subject, the six direction movement parameters (translational x, y, z planes; rotational: tilt, roll, yaw) obtained during the realignment step were included as nuisance variables. We also found no significant differences in the mean translational and rotational displacements derived from each subject, between the higher and lower MBP groups (t-tests, p < 0.05). To remove any effects from cerebrospinal fluid movement, signal intensity changes derived from a 2 mm sphere placed in the fourth ventricle were also included as a nuisance variable. This type of connectivity analysis results in a spatial map of the correlation coefficients of each voxel’s time series with that of the seed region.
The resulting contrast maps were placed into a second level random effects analysis to determine significant connectivity differences between the lower MBP and higher MBP groups. In addition to this two-group analysis, we performed a one-sample voxel-by-voxel linear correlation analysis to determine significant linear relationships between MBP and resting connectivity using the brainstem and wholebrain images (age and gender including as nuisance variables). Following initial thresholds of uncorrected p < 0.001, we used cluster correction procedure (p < 0.05, corrected for multiple comparisons). 19 Significant clusters were overlaid onto a mean of all subjects T1-weighted anatomical image. For each significant cluster, we extracted connectivity strength values and plotted individual subject values and the mean (±SD) of each group for each cluster. No significant linear relationships between MBP and resting connectivity were found, and so no further analysis was performed.
Results
Resting MSNA, BP, HR and CBF
For all 31 subjects, the mean (±SD) resting MSNA burst frequency was 15.2 ± 9.3 bursts/min (range 3.6–36.8 bursts/min) and the median was 13.3 bursts/min. The higher MSNA group (n = 15, 5 females, age: 23.1 ± 4.6 years) had a mean burst frequency of 22.3 ± 7.4 bursts/min, and the lower MSNA group (n = 16, 8 females, age: 22.3 ± 3.1 years) had a mean of 7.5 ± 2.8 bursts/min (Figure 1(a)). Mean blood pressure (MBP) was 87.6 ± 10.1 mmHg (range 72.9–105.7 mmHg), and the median was 88.4 mmHg. The lower MBP group (n = 15, 9 females, age: 22.7 ± 3.1 years) had a mean MBP of 78.8 ± 4.4 mmHg, and the higher MBP group (n = 16, 4 females, age: 23.8 ± 4.4 years) had a mean MBP of 95.9 ± 6.2 mmHg (Figure 1(a)).
(a) Plots of muscle sympathetic nerve activity (MSNA) burst frequency and mean blood pressure (MBP) in each of the 31 subjects grouped into lower and higher resting MSNA and lower and higher resting MBP groups. In addition, a plot of MSNA burst frequency against each subject’s resting MBP is shown. Note the lack of significant relationship between resting MSNA and MBP. (b) Plot of MSNA burst frequency against mean grey matter cerebral blood flow (CBF), and plot of MBP against mean grey matter CBF.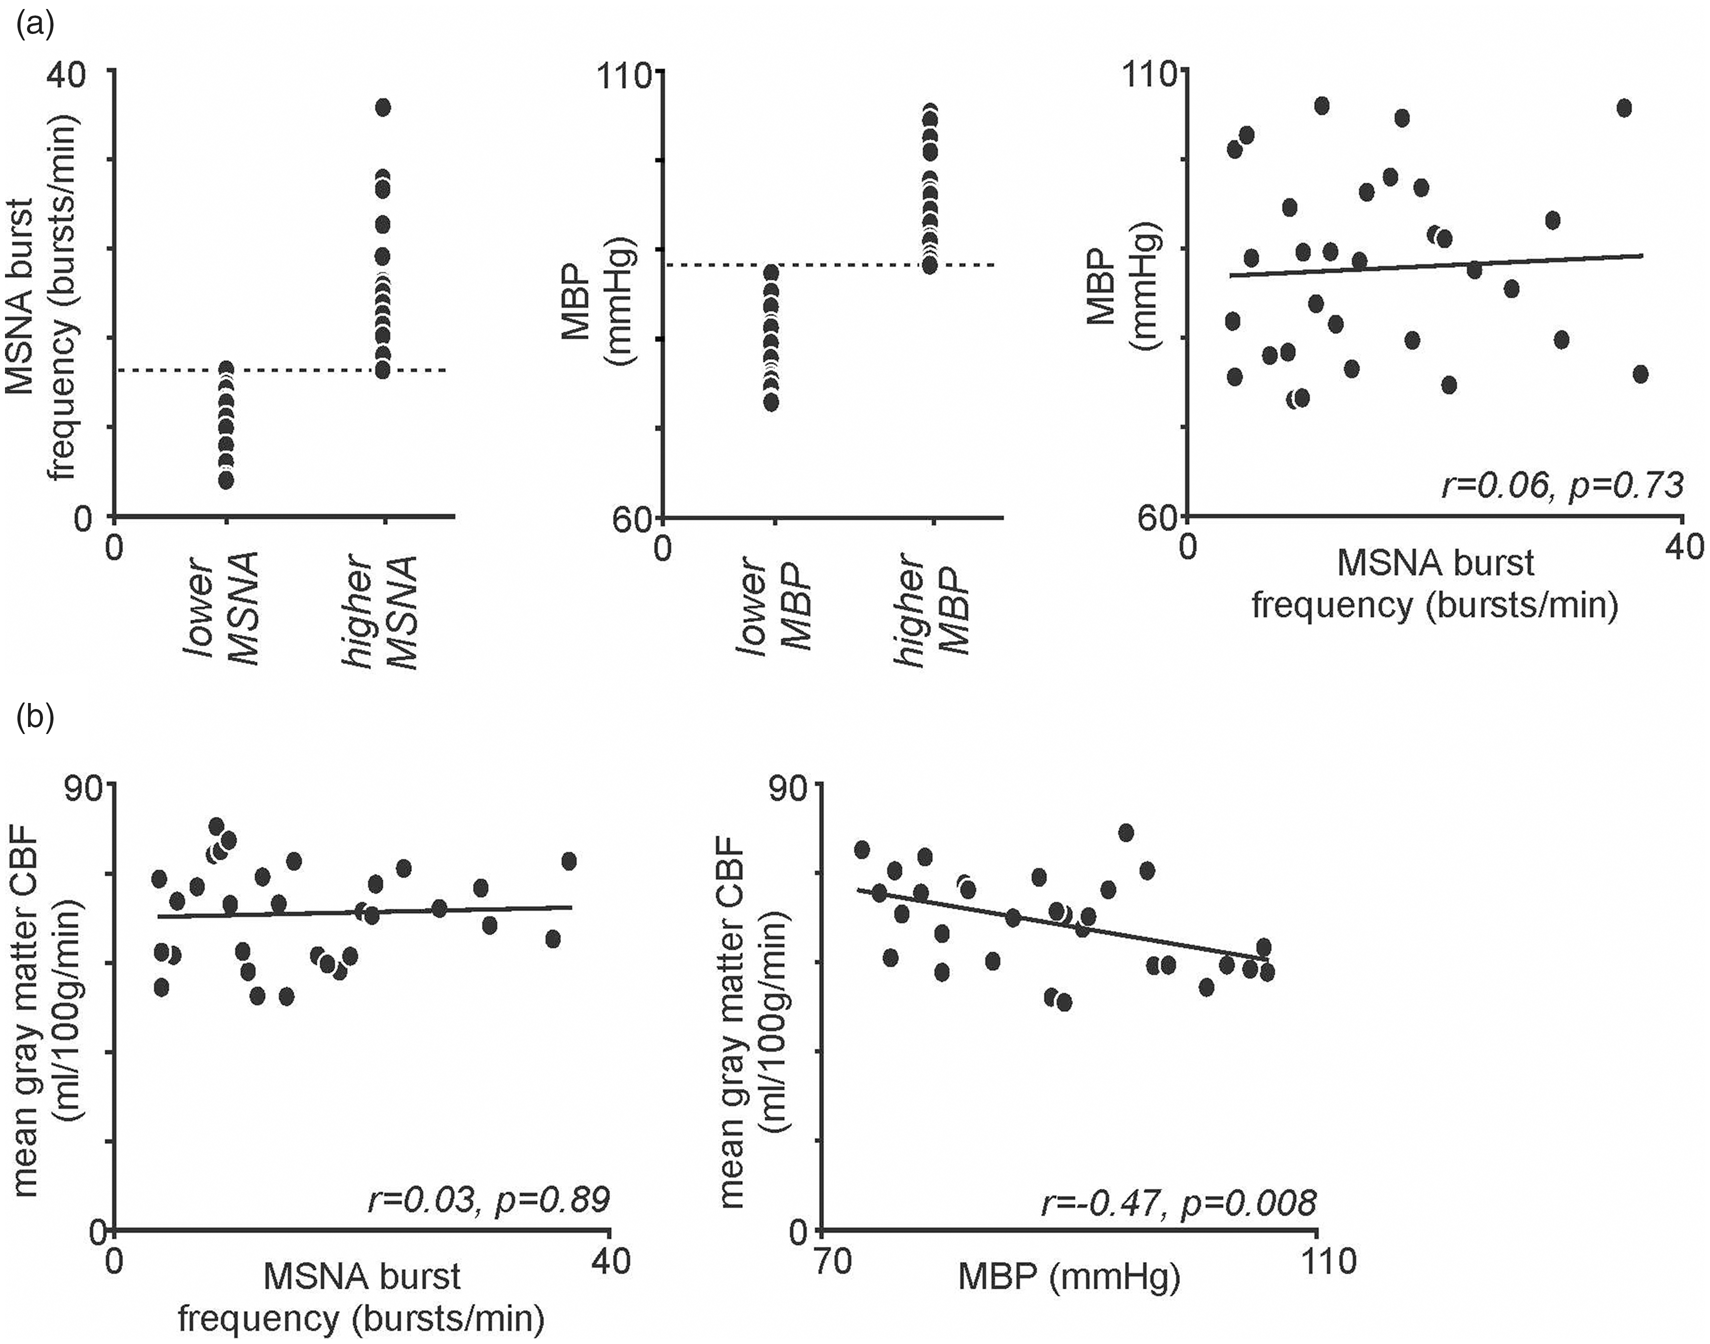
There were no significant relationships between MSNA burst frequency and MBP (r = 0.06, p = 0.73), or between MSNA burst frequency and mean total grey matter CBF (r = 0.03, p = 0.89) (Figure 1(a) and (b)). There was, however, a significant negative correlation between MBP and mean total grey matter CBF (r = −0.47, p = 0.008) (Figure 1(b)). Finally, there was no significant difference in resting HR between the two BP groups (mean ± SD HR: low BP 67.5 ± 7.2 bpm vs. high BP 68.2 ± 7.8 bpm, p = 0.41, t-test) or between the two MSNA groups (low MSNA 68.7 ± 7.6 bpm vs. high MSNA 64.4 ± 6.9 bpm, p = 0.10).
Relationships between resting regional CBF and MSNA and between resting regional CBF and MBP
A voxel-by-voxel analysis of CBF revealed no significant difference in regional CBF in any brain region in the higher MSNA compared with the lower MSNA group. In contrast, comparison of CBF values in the higher MBP compared with the lower MBP revealed a number of brain regions in which ongoing CBF was significantly different. The brainstem-specific voxel-by-voxel analysis revealed regions in which regional blood flow was significantly greater in the lower MBP compared with the higher MBP group. The lower MBP group had greater CBF values in the region encompassing the right RVLM (mean±SD ml/100 g/min; lower MBP vs. higher MBP groups): (98.3 ± 18.0 vs. 71.8 ± 16.1), and the left dorsolateral pons (dlPons) (77.9 ± 16.5 vs. 52.1 ± 22.5) (Figure 2(a), Table 1). Furthermore, a one sample voxel-wise linear correlation analysis with brainstem-only images revealed that CBF in these same regions was also significantly negatively correlated with MBP: right RVLM (r = −0.67), left dorsolateral pons (r = −0.65) (Figure 2(b), Table 2). Nowhere in the brainstem was regional CBF greater in the higher MBP group compared with the lower MBP group, indicating that regional CBF was not simply resulting from higher MBP levels. Nowhere in the brainstem was blood flow significantly different in the lower compared with the higher MSNA group.
(a) Brainstem regions in which cerebral blood flow (CBF) was significantly greater in the lower mean blood pressure (MBP) group compared to the higher MBP group (blue color scale). Significant clusters are overlaid onto a T1-weighted brainstem template. Slice locations in MNI space are indicated in the lower right of each image. The left inset shows the anatomical identification of the human rostral ventrolateral medulla (RVLM) based on histochemical identification (courtesy of Allen et al., 1988)20. Below these are plots of individual subject and mean (±SD) regional CBF values for the lower MBP group (grey) and higher MBP group (black) for the right RVLM, and left dorsolateral pons (dlPons). (b) Brainstem regions in which CBF correlated significantly with MBP; the greater the MBP the lower the resting CBF. Below these are plots of individual subject MBP against regional CBF for the right RVLM and left dlPons. Correlation coefficients are shown at the lower left of each scatter plot. Note the overlap with the regions depicted in (a) and (b). Locations in Montreal Neurological Institute space (MNI), t values, and cluster sizes of regions in which regional cerebral blood flow was greater in the lower mean blood pressure group than the higher MBP group. Locations in Montreal Neurological Institute space (MNI), t values, and cluster sizes of regions in which regional cerebral blood flow correlated significantly with MBP.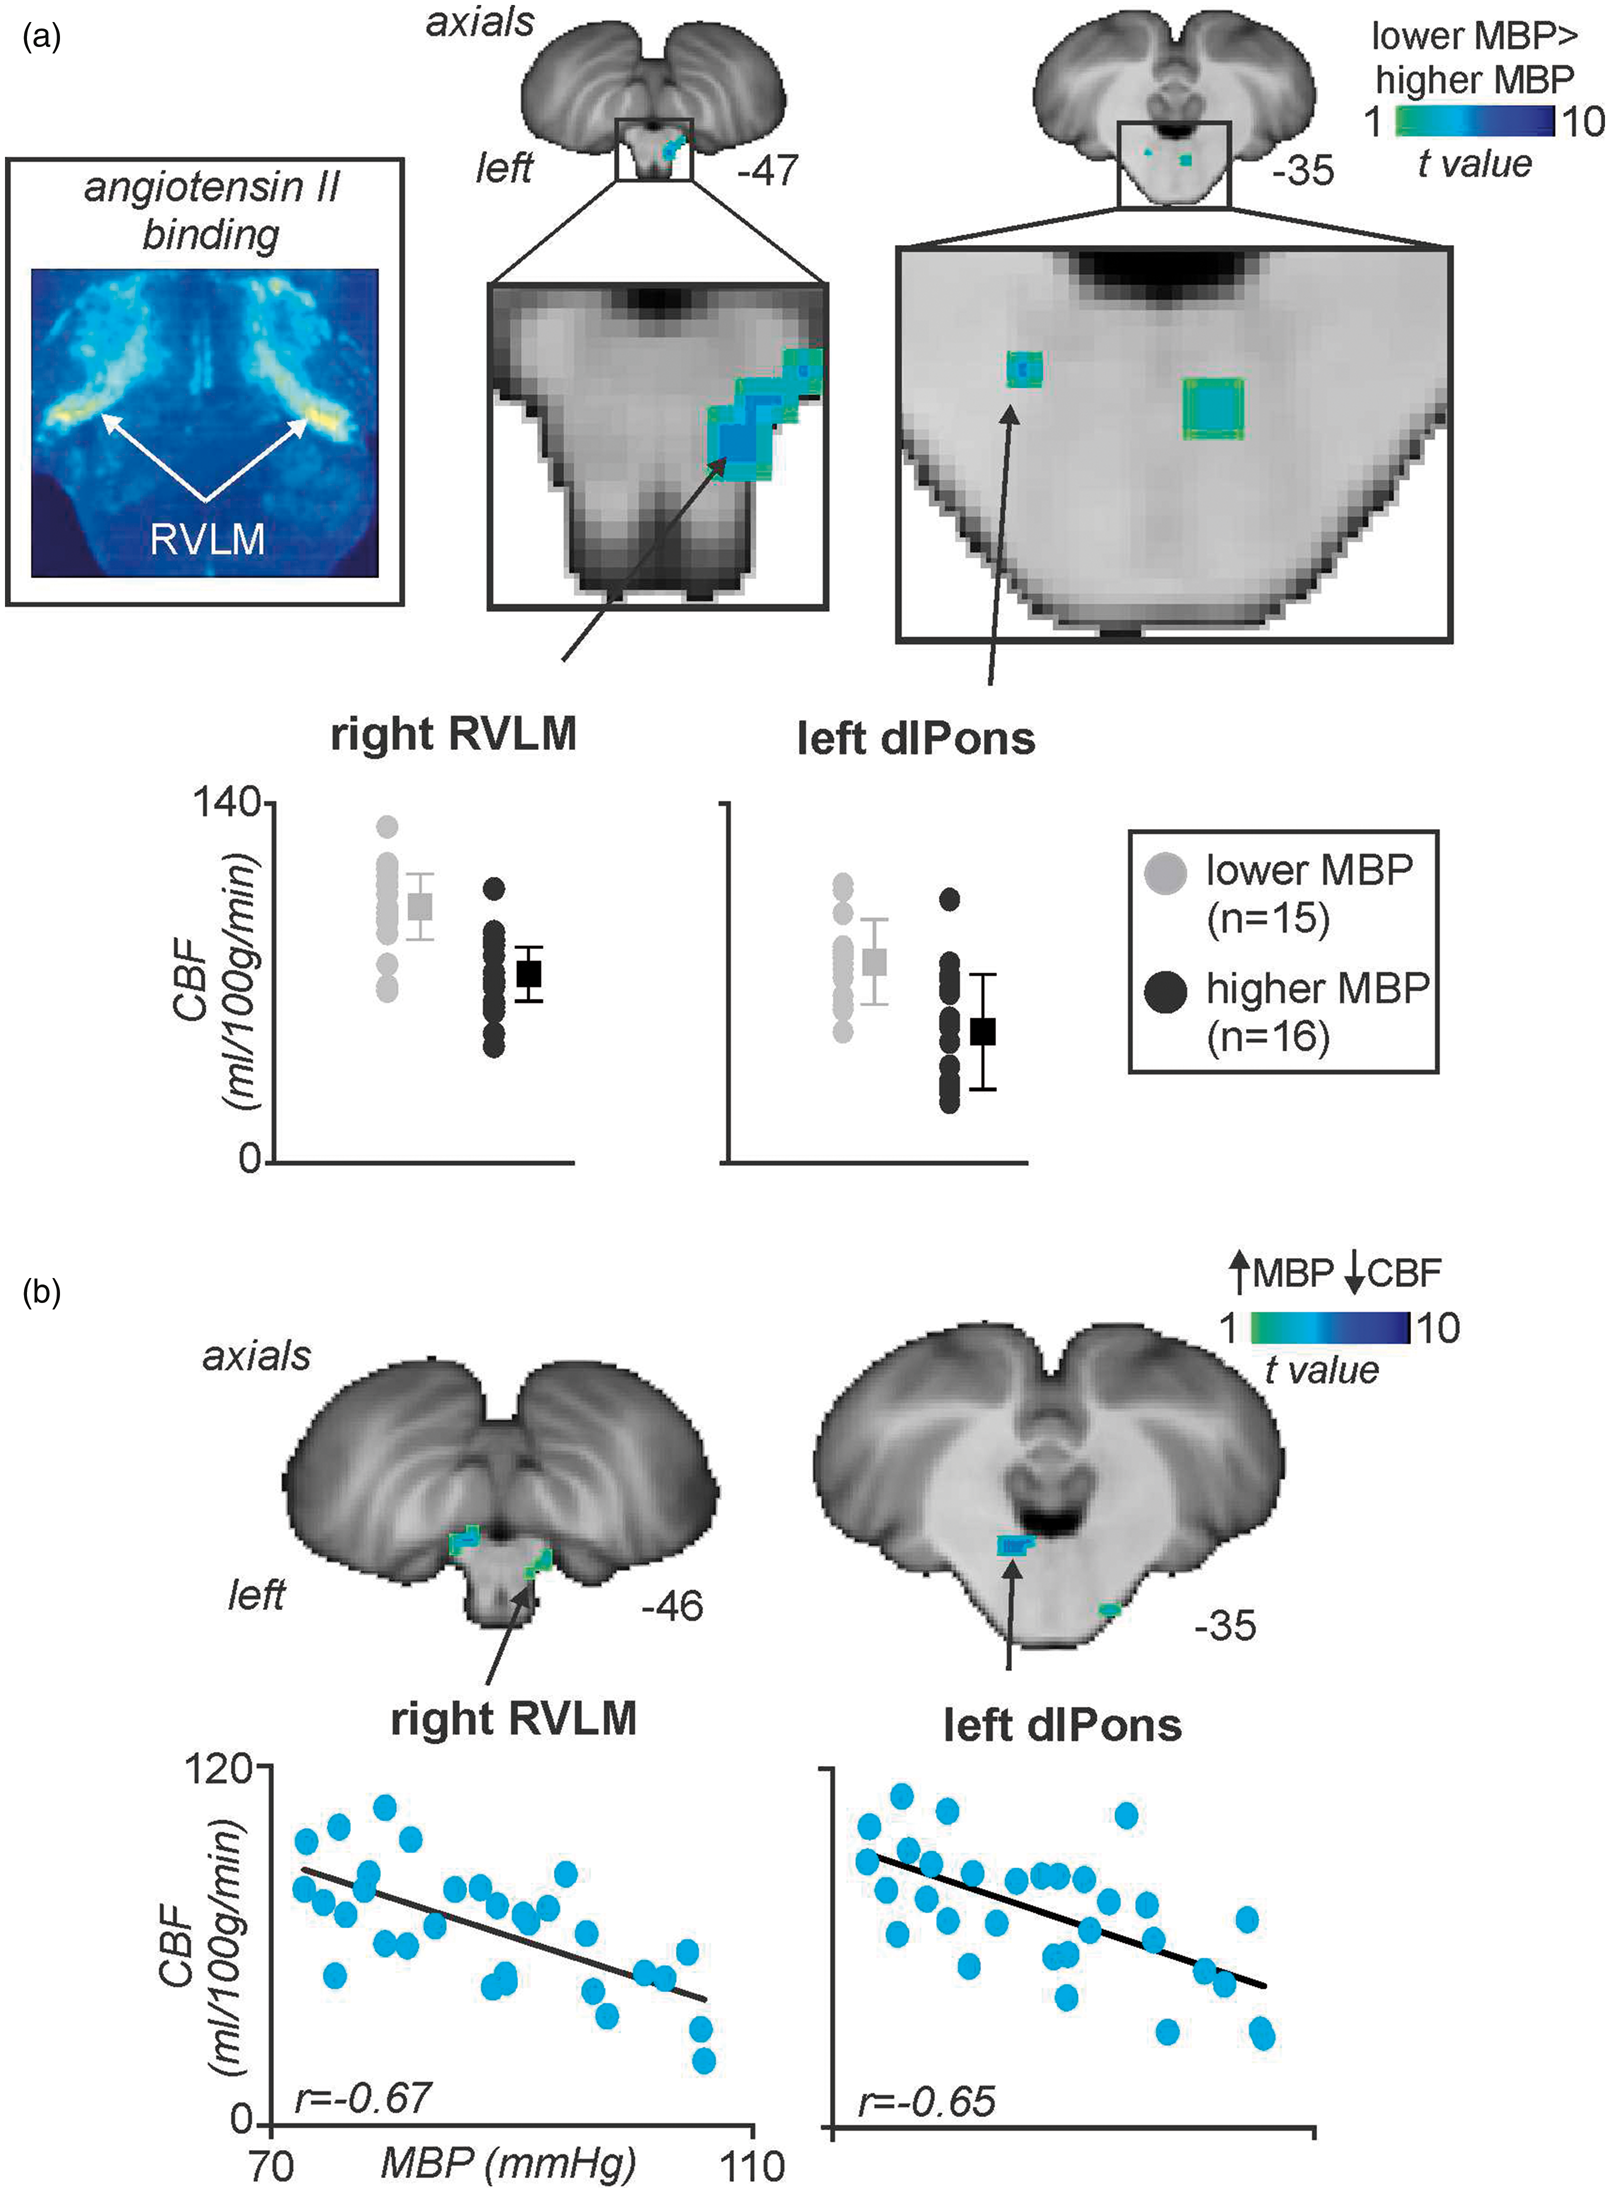
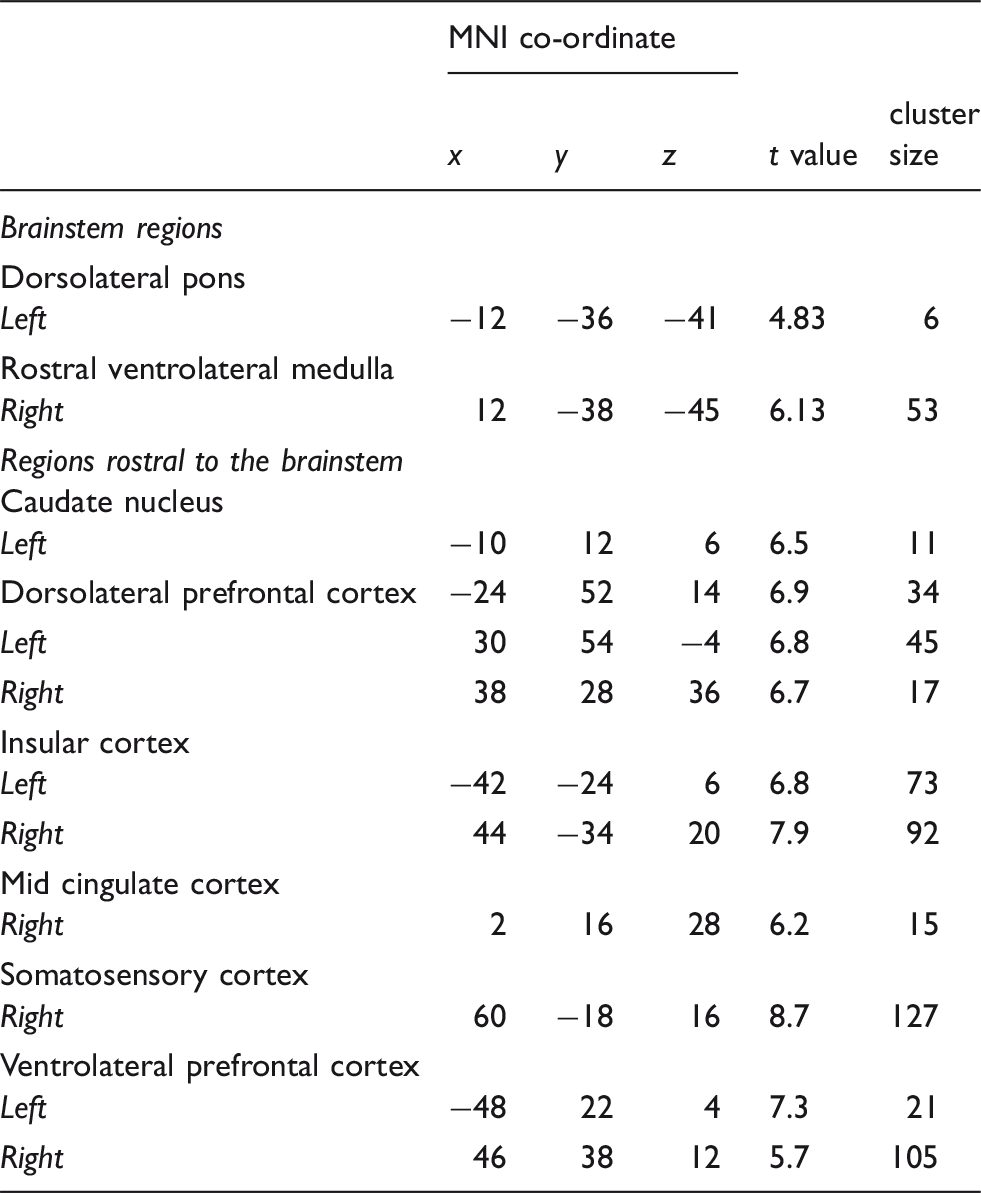
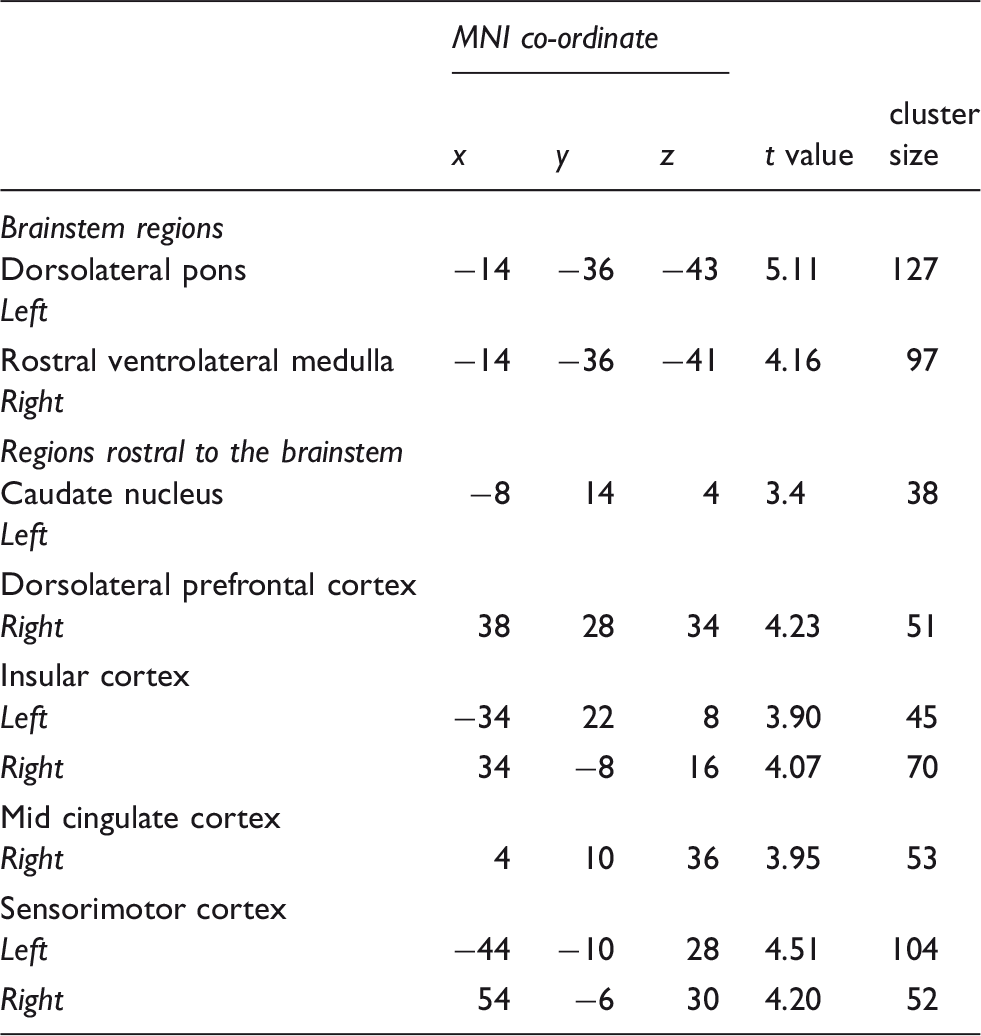
CBF was also significantly higher in the lower MBP compared with the higher MBP group in the left posterior insula (mean±SD ml/100 g/min; lower MBP vs. higher MBP groups): (85.8 ± 12.6 vs. 68.0 ± 16.2), left anterior insula (101.0 ± 12.8 vs. 52.6 ± 10.5), right mid insula (85.1 ± 14.2 vs. 57.5 ± 10.9), right posterior insula (82.0 ± 9.8 vs. 51.8 ± 10.7), left dorsolateral prefrontal cortex (dlPFC) (96.3 ± 14.2 vs. 59.6 ± 12.1), right dlPFC (103.4 ± 16.2 vs. 66.1 ± 11.8), right midcingulate cortex (MCC) (85.1 ± 19.1 vs. 51.4 ± 11.5), right ventrolateral PFC (vlPFC) (106.6 ± 19.9 vs. 65.0 ± 13.5), left vlPFC (101.0 ± 12.8 vs. 65.0 ± 10.8), left caudate nucleus (64.7 ± 10.8 vs. 38.6 ± 7.3), and right primary somatosensory cortex (S1) (95.1 ± 14.9 vs. 60.4 ± 12.3) (Figure 3(a), Table 1). Furthermore, a one sample voxel-wise linear correlation analysis revealed that CBF in some of these same regions was also significantly negatively correlated with MBP, that is, the lower the individual’s MBP, the higher the resting CBF: left caudate nucleus (r = −0.65), left anterior insula (r = −0.66), right posterior insula (r = −0.60), right dlPFC (−0.64), right posterior insula (r = −0.60), right MCC (r = −0.64) (Figure 3(b), Table 2). In no brain region was regional CBF greater in the higher MBP group compared with the lower MBP group.
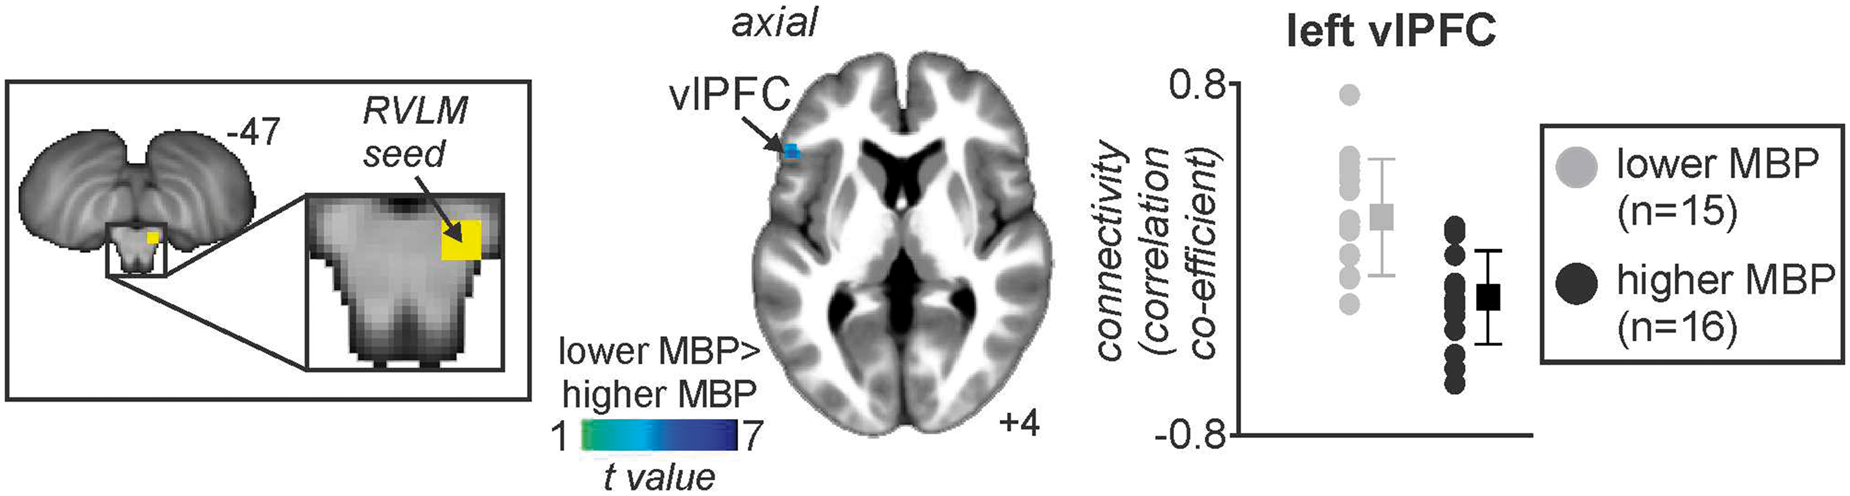
(a) Brain regions in which cerebral blood flow (CBF) was significantly greater in the lower mean blood pressure (MBP) group compared to the higher MBP group (cool color scale). Significant clusters are overlaid onto a mean T1-weighted anatomical image set created from all 31 subjects. Slice locations in MNI space are indicated in the lower right of each image. In addition, plots of individual subject and mean (±SD) regional CBF values for the lower MBP group (grey) and higher MBP group (black) for the left ventrolateral prefrontal cortex (vlPFC), left and right insular cortices, and the right mid cingulate cortex (MCC). (b) Brain regions in which CBF correlated significantly with MBP; the greater the MBP, the lower the resting CBF. Below these are plots of individual subject MBP against CBF for the regions of the left and right insula, right dorsolateral prefrontal cortex (dlPFC), and right MCC. Correlation coefficients are shown at the lower left of each scatter plot. Note the overlap with the regions depicted in (a) and (b). Location in Montreal Neurological Institute space, t value, and cluster size of the region in which functional connectivity with the right rostral ventrolateral medulla was greater in the lower blood pressure group than the higher blood pressure group. Brain region in which RVLM connectivity strength was significantly greater in the lower mean blood pressure (MBP) group compared with the higher MBP group. The significant cluster is overlaid onto a mean T1-weighted anatomical image set created from all 31 subjects. Slice location in Montreal Neurological Institute space is indicated in the lower right of each image. To the right is a plot of individual subject and mean (±SD) RVLM connectivity strengths for the lower MBP group (grey) and higher MBP group (black) for the left ventrolateral prefrontal cortex (vlPFC).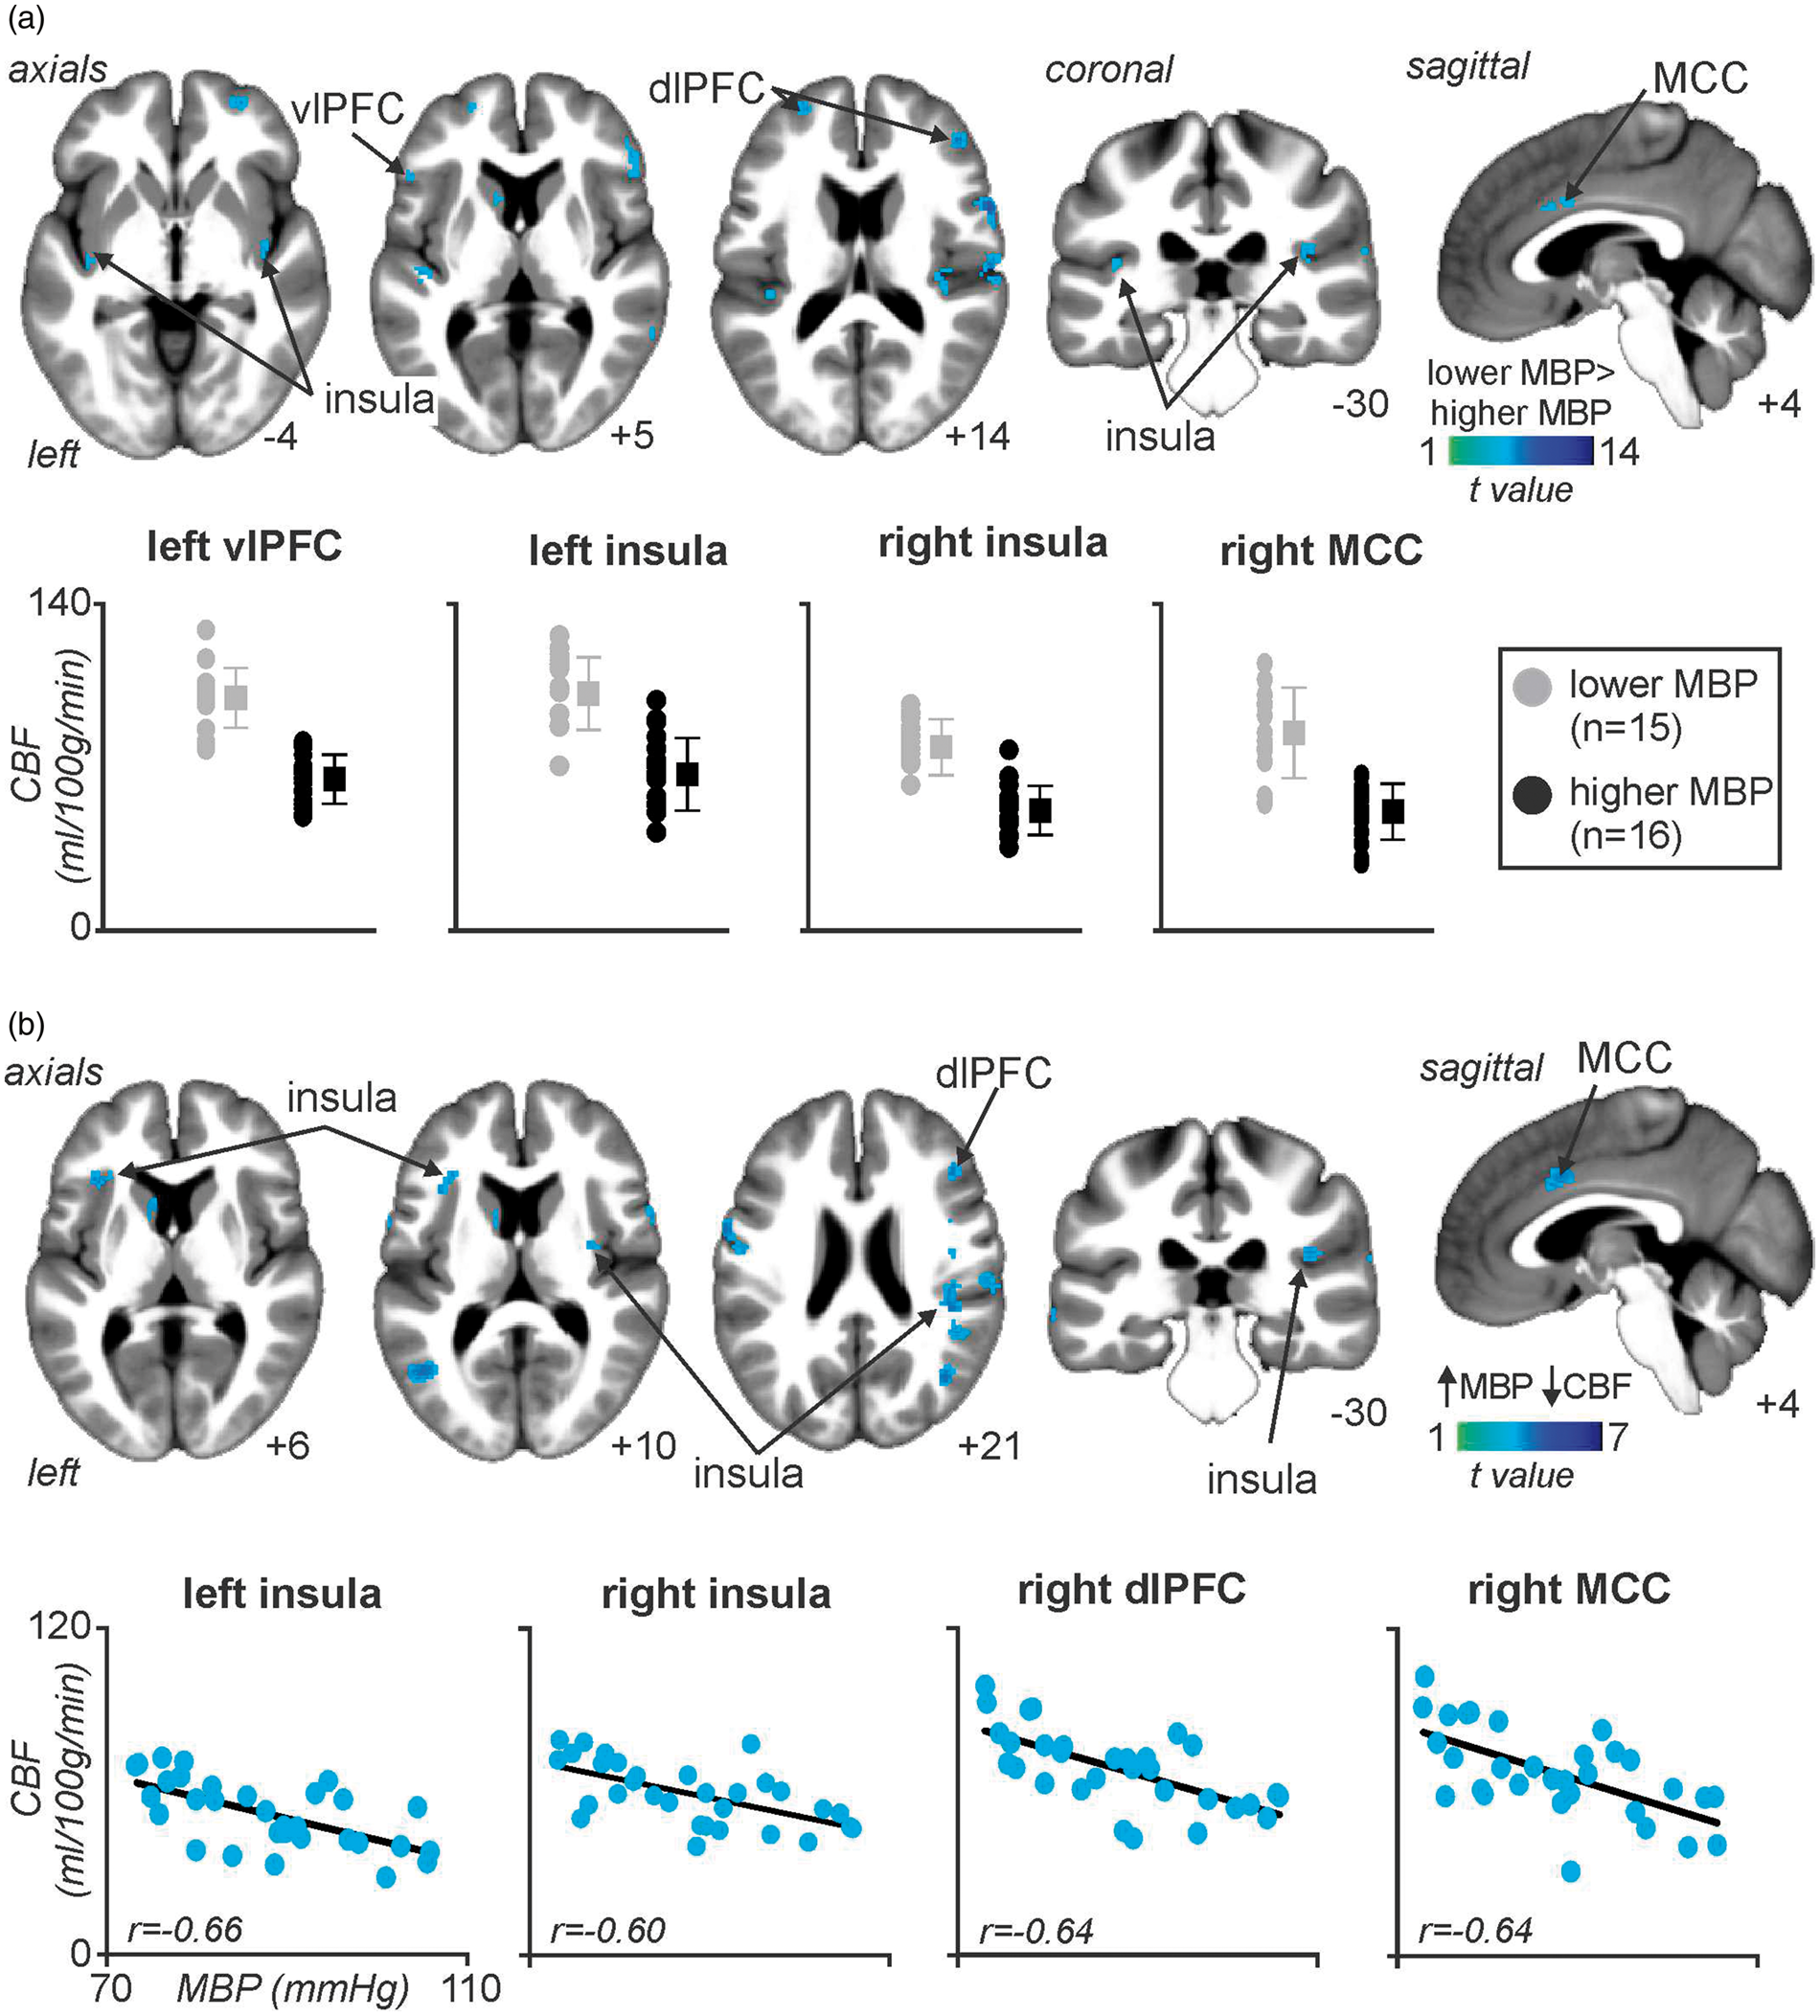
Resting functional connectivity
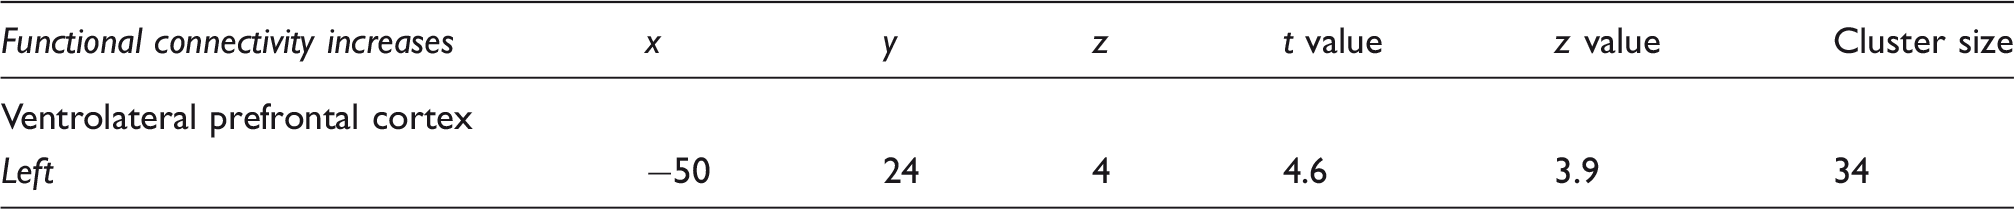
Given the well-established role of the RVLM in BP regulation, we compared resting RVLM functional connectivity strengths between the higher and lower MBP groups. Using the right RVLM cluster in which we showed significant differences in resting blood flow, we found that the RVLM displayed significantly greater resting connectivity strength in the lower compared with the higher MBP group in one brain region, the left vlPFC (mean±SD connectivity strength; higher MBP vs. lower MBP: −0.16 ± 0.21 vs 0.21 ± 0.25). In no brain region was RVLM connectivity strength greater in the higher MBP group and furthermore in no region was there a significant linear relationship between MBP and RVLM connectivity strength (Figure 4, Table 3).
Discussion
In this study, we reveal for the first time that resting regional CBF and functional connectivity levels are significantly related to an individual’s resting MBP, even in the narrow normotensive range (MBPs of our subjects ranged from 72.9 to 105.7 mmHg). Remarkably, we found a significant relationship between resting activity in the RVLM and dlPons and an individual’s resting MBP, that is, the greater the resting MBP, the lower the ongoing blood flow. Similar relationships occurred in the regions of the insula, MCC, dlPFC, and vlPFC. Furthermore, resting RVLM functional connectivity strength was significantly correlated to MBP in the vlPFC, with greater connectivity strength associated with lower resting MBP. These findings reveal that, discrete regional differences in ongoing resting activity levels and network dynamics are associated with subtle differences in an individual’s resting MBP, despite subjects being defined as normotensive.
Consistent with previous investigations, we found no significant relationship between mean BP and MSNA burst frequency at rest in healthy individuals.6,21 It is, however, well established that during spontaneous fluctuations in BP at rest, MSNA bursts occur when diastolic pressure is low, as baroreceptor input is reduced. 22 Although we found no significant relationship between resting MSNA levels and ongoing brain activity, we found that a number of discrete regions displayed robust relationships between ongoing activity and resting MBP levels. Consistent with our hypothesis, we found that ongoing activity in the RVLM was significantly lower in individuals with higher MBP compared to individuals with lower MBP. Indeed, RVLM activity was inversely correlated to resting MBP – the higher the MBP, the lower the RVLM blood flow. One might expect that blood flow to this region would be higher if it was simply and directly related to MBP, as increases in BP can lead to increases in blood oxygen level-dependent (BOLD) signal intensity, whereas decreases can lead to decreases in the latter. 23 Furthermore, relatively small BP increases during cardiovascular challenges in healthy individuals most often evoke increases in regional signal intensity,24,25 as well as 15–30% regional CBF increases. This increase in CBF may become widespread as BP increases further.26–29 In direct contrast to this body of literature, we found decreases in both global grey matter CBF and discrete regional CBF changes with increasing MBP, the opposite of what potential BP related artefacts would evoke.
Given that CBF is an index of ongoing oxygen demand and thus an index of ongoing neuronal activity, 30 likely synaptic activity, 31 our data indicate that higher BP is associated with reduced synaptic activity in the region of the RVLM. It is well established that the RVLM is crucial for the regulation of both resting and evoked changes in BP, and contains a large proportion of premotor sympathetic vasoconstrictor neurons controlling the sympathetic preganglionic neurons in the lateral horn of the spinal cord.1–3 Studies in experimental animals have shown that direct stimulation of the RVLM results in increased sympathetic vasoconstrictor drive, heart rate, and BP 2 ; and elevated sympathetic drive contributes to the development of hypertension.7–9 We recently used MSNA-coupled fMRI to show that in awake humans, individual MSNA bursts are associated with increases in RVLM activity. 4 This beat-to-beat regulation of MSNA by the RVLM is constantly modulated by ongoing inhibitory inputs, since microinjection of GABA antagonists into the RVLM results in drastic increases in BP.32–36 Our finding of decreased ongoing RVLM blood flow in individuals with higher resting MBP likely represents a reduction in ongoing inhibitory drive, thereby resulting in an overall increase in RVLM output. This is further supported by the fact that reduction in blood flow in the RVLM of animals causes sympathoexcitation and increases in BP,37,38 through a mechanism that is likely to involve metabolic by-products resulting from hypoxemia. 39 Furthermore, research has shown global increases in the activity of RVLM barosensitive neurons in neurogenic hypertensive rats.40,41
Comparison of normotensive individuals with higher resting MBP to those with lower resting MBP also revealed significant differences in the insular, ventrolateral, dorsolateral prefrontal, and midcingulate cortices, where greater CBF was associated with lower MBP. These regions, in addition to the parabrachial nucleus (PBN), NTS and RVLM play a key role in the “central autonomic network.” 42 The insula projects directly and indirectly (via the hypothalamus) to brainstem areas responsible for autonomic outflow such as the NTS, PBN, and ventrolateral medulla.43–47 Using MSNA-coupled fMRI, we recently showed that the insula, hypothalamus, and RVLM are functionally coupled in human subjects.14,15 Interestingly, we found in the current study that the strength of resting RVLM functional connectivity was associated with lower resting MBP in the same vlPFC region that had shown significant CBF differences between higher and lower MBP levels. This indicates that this region not only has higher ongoing levels of activity, but also tighter co-variations in signal intensity with the RVLM when resting MBP is low. These results may indicate a top-down modulation from the cerebral cortex onto the brainstem circuitry, and particularly the RVLM.
This greater functional coupling between the RVLM and vlPFC when resting MBP is lower likely represents the increased inhibitory input onto the RVLM. This greater synaptic activity is reflected by our finding of increased CBF levels in the RVLM with decreased resting MBP levels. Conversely, greater resting MBP was associated with lower functional connectivity strength, likely indicating reduced GABAergic input onto the RVLM, as depicted by the lower CBF levels in the RVLM. This disparate ongoing restraining activity of the prefrontal cortex on the RVLM may be indicative of a set-point that determines resting BP levels. Indeed, it has been hypothesized that a set-point for BP may be encoded by the central nervous system,3,48 and in humans it has been argued that this set-point determines whether or not a burst of MSNA occurs. 49 An important question arises as to whether this set-point is associated with a distinct level of ongoing activity, which is reflected in the resting CBF level of important BP regulating centers, such as the RVLM. If so, then greater activity in these brain regions would be representative of a set-point for lower BP levels, and vice versa. Along those lines, there may be a distinct set-point with an associated CBF level that contributes to the development of essential hypertension.
While we only investigated normotensive individuals in this study, it is likely that further reductions in RVLM ongoing blood flow may facilitate the rise in sympathetic nerve activity, which is present in most forms of human hypertension. 8 Whether these regional CBF differences are even more robust in hypertensive patients is an interesting question, as it has been hypothesized that essential hypertension may initially induce CBF anomalies prior to the establishment of hypertension, and that brainstem hypoperfusion may be the underlying cause of hypertension, rather than being a consequence.50,51 In this light, hypertension is seen as a homeostatic correction to low perfusion of the brainstem, produced by stenosis of vertebral arteries, for example, 52 and it has been postulated that astrocytic oxygen signaling within the brainstem may be one mechanism by which autoregulation of CBF occurs. 53
Limitations
It is worth pointing out that, while BP and MSNA recordings were performed concurrently in the laboratory, and MSNA and imaging of CBF were performed concurrently in the scanner, technical limitations meant we were unable to record BP in the scanner. However, subjects entered the scanner within 10 min of the conclusion of the laboratory recording of BP and we do not believe that BP during scanning would be any different to that obtained in the laboratory immediately prior to the scanning. Another potential limitation is that our subjects were all young and healthy with normal BPs, and one might expect that had we included subjects with hypertension our correlations would have been stronger. Nevertheless, our rationale was to first determine whether relationships existed between MSNA, MBP and regional CBF at rest in normotensive subjects, before investigating hypertensive subjects.
Given the exploratory nature of this investigation, limited power size could have increased the likelihood of a Type II error skewing the results. This is particularly important when considering the existence or non-existence of significant relationships between two variables such as CBF and MBP. One could argue that with limited power, non-significant correlations cannot be used to conclude that there is no association in the data; thus, we performed both median split and voxel-by-voxel correlation analyses. Furthermore, while it is possible that anxiety and/or habituation may have altered an individual’s MBP, it is extremely unlikely that all subjects in one group would be more anxious in the MRI scanner than all subjects in another group.
Conclusions
This investigation reveals that slight differences in MBP are associated with significantly different regional CBF in healthy humans. Whether these CBF differences in key autonomic and BP regulating areas are even more pronounced in hypertensive individuals, remain unknown. Moreover, it would be interesting to investigate the evolution of the BP and regional CBF levels in these individuals, in order to understand whether the individuals with higher MBP and lower regional CBF are more prone to developing hypertension, and whether lower CBF in key autonomic and BP regulating regions is a predictive and contributing factor to this development.
Footnotes
Funding
The author(s) disclosed receipt of the following financial support for the research, authorship, and/or publication of this article: This work was supported by the National Health and Medical Research Council of Australia (GNT1100040).
Acknowledgements
We thank Dr Paul Macey, Dr Andrew Youssef, and Mr Julius Macefield for their generous contributions.
Declaration of conflicting interests
The author(s) declared no potential conflicts of interest with respect to the research, authorship, and/or publication of this article.
Authors’ contributions
SK (1) made a substantial contribution to the concept and design, acquisition of data or analysis and interpretation of data, (2) drafted the article, (3) approved the version to be published. VGM (1) made a substantial contribution to the concept and design, acquisition of data and interpretation of data, (2) revised the article critically for important intellectual content, (3) approved the version to be published. LAH (1) made a substantial contribution to the concept and design, analysis and interpretation of data, (2) revised the article critically for important intellectual content, (3) approved the version to be published.