
Abstract
The semi-quantitative estimate standardised uptake value ratios (SUVR) correlate well with specific binding of the tracer expressed as distribution volume ratios (DVR) for the tau positron emission tomography tracer [18F]AV-1451 uptake and are therefore widely used as proxy for tracer binding. With regard to tracer kinetic modelling, there exists a time point when SUVR deviates minimally from DVR, occurring when the specific binding reaches a transient equilibrium. Here, we have investigated whether the time to equilibrium affects the agreement between SUVR and DVR across different brain regions. We show that the time required to reach equilibrium differs across brain regions, resulting in region-specific biases. However, even though the 80–100 min post-injection time window did not show the smallest bias numerically, the disagreement between SUVR and DVR varied least between regions during this time. In conclusion, our findings suggest a regional component to the bias of SUVR related to the time to transient equilibrium of the specific binding. [18F]AV-1451 uptake should consequently be interpreted with some caution when compared across brain regions using this method of quantification. The commonly used time window 80–100 min post-injection shows the most consistent bias across regions and is recommended for semi-quantification of [18F]AV-1451.
Introduction
The first positron emission tomography (PET) tracer used to visualise the molecular underpinnings of Alzheimer’s disease (AD) binds to both β-amyloid (Aβ) and neurofibrillary tangles (NFTs), the two main neuropathological hallmarks of AD. 1 While revolutionary at the time, it was quickly replaced by tracers specific for either Aβ or tau. The development of the Aβ-specific PET ligand Pittsburgh Compound B shifted the attention of the field to Aβ when first introduced in the early 2000s. 2 During the past decade, knowledge of the temporal and spatial course of Aβ pathology in AD has increased substantially. Extensive effort was invested in the validation of Aβ PET scan evaluation, including visual assessment,3–5 use of reference regions6,7 and simplified scanning and quantification approaches such as the standardised uptake value ratio (SUVR).8,9
While important lessons were learned from Aβ imaging, it also became apparent that tau pathology in AD is more closely associated with the development of cognitive impairment during the prodromal and dementia phases of AD.10–15 Aβ accumulation was shown to be present in many elderly individuals with normal cognition 16 and to appear decades before manifestation of cognitive symptoms in AD. 17 In addition, post-mortem studies showed a weaker association between Aβ load and cognitive impairment than between tau-containing NFT and cognition. While some efforts were made early on to develop dedicated tau ligands, finding tracers with a much greater specificity for tau than Aβ remained a challenge unsolved for almost a decade in part due to the heterogeneity of the paired helical tau-filaments within NFT. Recently, [18F]AV-1451 – a benzimidazole pyrimidine derivative – was developed for the imaging of NFT, and it has quickly become one of the most extensively used. 18
Unlike Aβ imaging, where a global cortical uptake value is often used to determine the presence or absence of pathology, tau imaging is influenced by tau accumulating in a more focal manner following a rather typical hierarchical pattern. 19 Different approaches have been suggested in order to classify tau PET scans as normal or abnormal and for the staging of the pathology,20–23 while visual assessment of tau PET scans has not gained the same impact for tau imaging as for Aβ imaging, yet. While the importance of Aβ PET imaging increased relatively slowly and via extensive validation,24–26 a number of tau imaging agents were quickly incorporated in large-scale clinical research using simplified methods of quantifying tracer uptake such as SUVR, before proper tracer validation had been performed. Given the importance of correct quantification in tau PET imaging, validation of methods for quantification is, however, of uttermost importance.
Recently, the use of semi-quantitative estimates such as SUVR has been validated in several studies of varying degree of complexity. SUVR has been validated against the DVR − a reference region-based quantification applied to dynamic PET scans − under the assumption that the cerebellar cortex is a valid reference region,27,28 or through full validation against arterial input modelling.29–32 Both approaches supported the use of SUVR estimated with cerebellar cortex as a reference region. Furthermore, these studies have shown that an SUVR over the time window of 80–100 min post-tracer injection correlates well with the specific binding of the tracer expressed as non-displaceable binding potentials (BPND) or DVR. SUVR has thus been widely used as a proxy for specific tracer uptake and, as such, as a representation of the degree of tau pathology. In spite of these high correlations, simplifications like these are often associated with bias since the time point used for estimating SUVR affects its value. A recent study showed that [18F]AV-1451 SUVR was indeed dependent on the time window, when studied across regions. 27 Theoretically, there is a time point for SUVR estimations where SUVR deviates minimally from DVR. This has been shown to occur at the instant when the association and dissociation of the specific binding of the tracer to the molecular target exhibits a transient equilibrium.33,34 Validation studies of SUVR as a simplified means of quantification have typically been performed across different brain regions or by categorising regions based on the level of uptake but with little focus on investigating whether individual brain regions behaved differently in terms of optimal time window for estimation of SUVR. In this study, we investigate the time point where equilibrium of [18F]AV-1451 is reached across individual brain regions, and how it affects the accuracy of SUVR.
Material and methods
Subjects
Ten subjects were recruited from the ongoing Swedish BioFINDER study (Biomarkers For Identifying Neurodegenerative Disorders Early and Reliably, www.biofinder.se). These included four healthy controls (HCs; mean age ± SD, 75.0 ± 3.8 years; one woman) and six patients with AD (64.8 ± 14.7 years; two women). All patients underwent a battery of clinical and neurological examinations as well as a [18F]flutemetamol PET scan for Aβ status assessment. Patients with a diagnosis of AD met the DSM-5 criteria for dementia and the criteria for probable AD. 35 Exclusion criteria for both AD and HC included current alcohol or drug abuse; other major or recurrent neurologic or psychiatric disorders; inability to undergo magnetic resonance imaging (MRI) and severe renal, hepatic impairment or significant infectious disease. All subjects signed a written informed consent form after detailed explanation of the study protocol. The procedures were approved by the Ethical Review Board of Lund University (2014-233) and the Swedish Medical Products Agency. All procedures were performed according to the Declaration of Helsinki.
Imaging procedures
A detailed report of the imaging procedures and [18F]AV-1451 production has been given by Hahn et al. 30 In short, subjects underwent a 180-min dynamic PET examination with [18F]-AV-1451 on a Discovery 690 PET/CT scanner (GE Healthcare, Milwaukee, WI, USA) at Skåne University Hospital, Lund, Sweden. A mean dose of 373.9 ± 12.9 MBq [18F]AV-1451 was administered intravenously, as a bolus over 40 s. Data were collected in list mode from 0 to 60, 80 to 140 and 160 to 180 min after injection and reconstructed into frames of 12 × 10, 6 × 20, 6 × 30, 3 × 60, 5 × 120 and 8 × 300 s (0–60 min), followed by 12 × 300 s (80–140 min) and 4 × 300 s (160–180 min). Corrections were applied for attenuation, random counts and scatter.
Arterial blood sampling was performed via a cannula in the radial artery, and samples were manually collected every 5 s for the first 1.5 min, every 10 s up until 3 min, every 20 s until 5 min, every 30 s until 8 min, every 1 min until 12 min, every 2 min until 20 min and then every 5 min until the end of the measurement (excluding PET breaks) for measurement of radioactivity concentration in blood. Radioactive metabolites were determined using HPLC in samples collected at 5, 15, 30, 45, 60, 90, 120 and 180 min. Data were used to create a metabolite-corrected plasma input function for quantification of [18F]AV-1451 data.
T1-weighted structural MR images were obtained using a 3 T Siemens Skyra scanner (Siemens Medical Solutions, Erlangen, Germany). Structural images were used for coregistration with PET images and transformation of regions of interest (ROIs) to individual space.
The [18F]flutemetamol PET scans were performed on a Philips Gemini TF PET-CT scanner (Philips Medical Systems, Amsterdam, Netherlands), as dynamic scans 90–110 min post-injection. The [18F]flutemetamol data were reconstructed into 5 min frames using an iterative Vue Point HD algorithm with six subsets, 18 iterations with 3 mm filter and no time-of-flight correction and quantified using CortexID (GE Healthcare, Milwaukee, WI, USA) for neocortical uptake using SUVR.
Image processing
Coregistration, spatial normalisation and segmentation were performed with the Advanced Neuroimaging Tools (http://stnava.github.io/ANTs/). PET images were corrected for head motion by coregistration of each frame to the first frame within that data set using a six-parameter rigid transformation. The brain was extracted from the structural MR images, and [18F]AV-1451 data coregistered to the MR data. For the generation of ROIs, the structural MR images were spatially normalised to the Montreal Neurological Institute (MIN) 152 structural T1 MRI template (http://www.bic.mni.mcgill.ca/ServicesAtlases/ICBM152NLin2009) and segmented into grey matter, white matter and cerebrospinal fluid.
Bilateral ROIs were derived from the Harvard-Oxford atlas and the cerebellar atlas provided in FMRIB Software Library (http://fsl.fmrib.ox.ac.uk/fsl/). A grey matter mask, thresholded at 50% probability, was applied to the cortical template brain regions to reduce spill-over from non-grey matter areas. Subcortical regions were masked with a tissue mask (consisting of grey and white matter). The masked brain regions were inversely transformed into patient space and projected onto the dynamic PET image to obtain regional time-activity curves.
ROIs included the frontal cortex; the frontal medial cortex; the temporal pole; the superior, middle and inferior temporal gyrus; the parietal cortex; the supramarginal gyrus; the angular gyrus; the occipital cortex; the posterior and anterior cingulate gyrus; the precuneus and cuneus; the thalamus; the caudate; the putamen; the pallidum; the hippocampus as well as the cerebellar grey matter excluding the vermis. Most ROIs contained several template subparts; for these, the time-activity curves were generated from these multiple ROIs as an average weighted by the size of the subparts.
Methods for quantification of imaging data
Based on a previous comparison of different arterial-based alternatives, 30 estimation of [18F]AV-1451 uptake was performed using a MATLAB R2015a (The Mathworks, Natick, MA, USA) implementation of plasma input Logan graphical analysis. 36 Distribution volumes (VT) were estimated using a t* of 30 min for all regions, and DVR were estimated using the cerebellum as reference region (DVR = VT(Target)/VT(Cerebellum)). Regional SUVR were estimated for the time windows 20–40, 40–60, 80–100, 100–120 and 120–140 min post-injection, also using cerebellum as reference region.
The approach described by Ito et al. was used for the identification of the time point where equilibrium is reached (tEq).
34
In short, it is based on assumptions of the two-tissue compartment model for neuroreceptor ligands.37,38 Three compartments are defined in this model for the expression of the total tissue radioactivity concentration (CT): the plasma radioactivity concentration of unmetabolised tracer (CP), the tissue concentration of tracer specifically bound to target (CS) and the non-displaceable tissue radioactivity concentration consisting of non-specifically bound and free tracer (CND). The model also includes rate constants for transfer between these compartments (K1, k2, k3 and k4), where K1 and k2 represent influx and efflux of tracer across the blood-brain barrier, k3 and k4 are the association and dissociation of tracer-specific binding. The model equations are expressed as follows
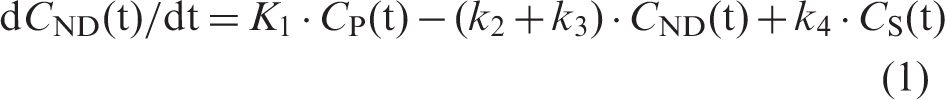


At tEq the derivative of specific binding becomes zero, i.e. dCS(tEq)/dt = 0, and it follows from equation (2) that

From equation (3), time-activity curves for CS were estimated as the difference between CT and CND, where CND was approximated by the cerebellar time-activity curve (CCerebellum). Thus

The time point when the CS(t) reached its maximum value was defined as tEq for each subject and region.
Statistical methods
To assess bias, linear regression analysis was performed comparing SUVR over different time windows with the plasma input Logan DVR on a region-by-region basis, with the outcome parameters being the slope, intercept and coefficient of determination (R2) for the association between SUVR and DVR for each region and SUVR time window.
In order to investigate the impact of the time to equilibrium on SUVR, linear regression was performed between the slopes estimated for the region-specific regression between SUVR and DVR and the tEq within each time window, with the outcome parameter being the level of significance of the regression. All linear regressions were performed using GraphPad Prism (version 7.0 c from Mac, GraphPad Software, La Jolla CA, USA, www.graphpad.com).
Results
Aβ status
All six AD subjects were classified as Aβ positive based on mean neocortical [18F]flutemetamol SUVR > 1.42 (mean±SD, 2.20 ± 0.34). All four HC were classified as Aβ-negative (mean±SD, 1.22 ± 0.13).
Regional relationship between SUVR and DVR
A high correlation was found between the reference estimate – plasma input Logan DVR – and SUVR across all different time windows and regions. Regression analyses were also performed across the AD subjects and HCs separately for use in further analyses; however, due to the small HC sample size and narrow dynamic range, these showed a much weaker correlation. Slopes, intercept and coefficient of determination (R2) values are reported in Supplementary Table 1. A more detailed account on model preferences based on the current cohort has previously been reported by Hahn et al. 30
Group differences in tEq
Equilibrium was reached at highly differing time points across the different regions. In addition, the order and timing of tEq across the regions were different for the HCs and the AD group, confirming that the accumulation of tau as assessed with PET appears to have an impact on tracer kinetics. Subcortical regions have previously been reported to demonstrate different kinetic profiles compared to cortical regions, which was also confirmed here for the putamen, caudate, thalamus and pallidum.27,28,30 These regions reached a transient equilibrium between 20 and 50 min post-injection. Examples of time-activity curves for the cerebellar reference region (CND), a target region total tissue and specific binding (CT and CS for the middle temporal gyrus) and SUVR are shown in Figure 1, with a graphical demonstration of the identification of tEq. The figure is also showing that for AD, SUVR=DVR near tEq but not at later time points in spite of dCs/dt remaining virtually zero.
Time-activity curves for the cerebellar reference region (CND, red), a target region total tissue and specific binding (CT: dashed blue and CS: dashed yellow) for the middle temporal gyrus (MTG) in a HC subject (a) and an AD patient (b), together with SUVR over time (dashed orange) and DVR estimated using plasma input Logan (horizontal dotted blue line). tEq is marked for each subject, approximately coinciding with the time point when SUVR=DVR. SUVR: standardised uptake value ratios; SUV: standardised uptake value; DVR: distribution volume ratios; MTG: middle temporal gyrus.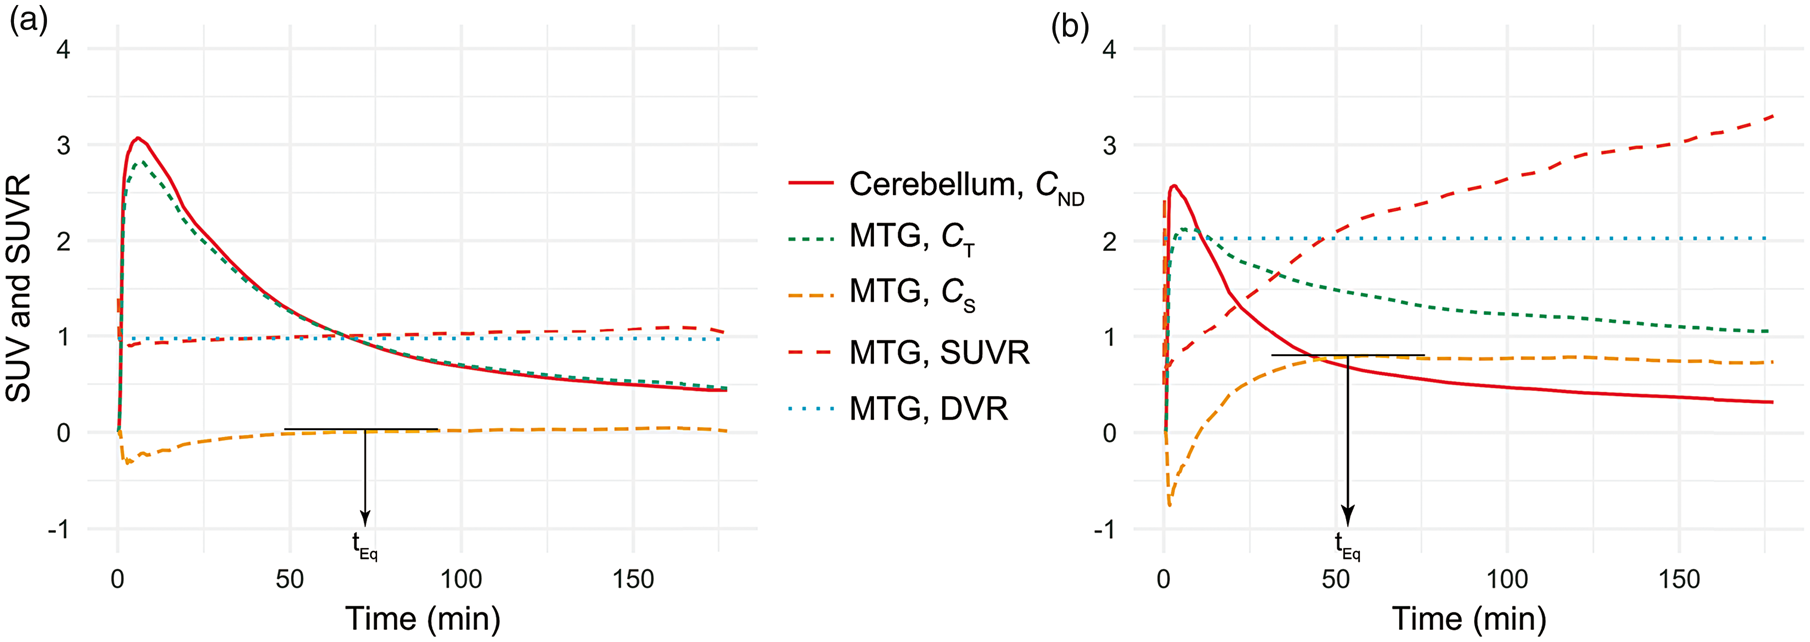
The relationship between the cortical late-phase wash-out rates and wash-out in the reference region resulted in a plateau-like appearance of the CS curve for duration of the scan, with SUVR increasing throughout the scan. On average, cortical regions reached equilibrium between 90 and 140 min, except the temporal pole in HCs which had not reached equilibrium at the end of scanning. Average tEq for each cohort and region are shown in Figure 2.
Regional average time to equilibrium for healthy controls (HC) and patients with Alzheimer’s disease (AD). For temporal pole in HC equilibrium had not been reach at the end of the PET scan.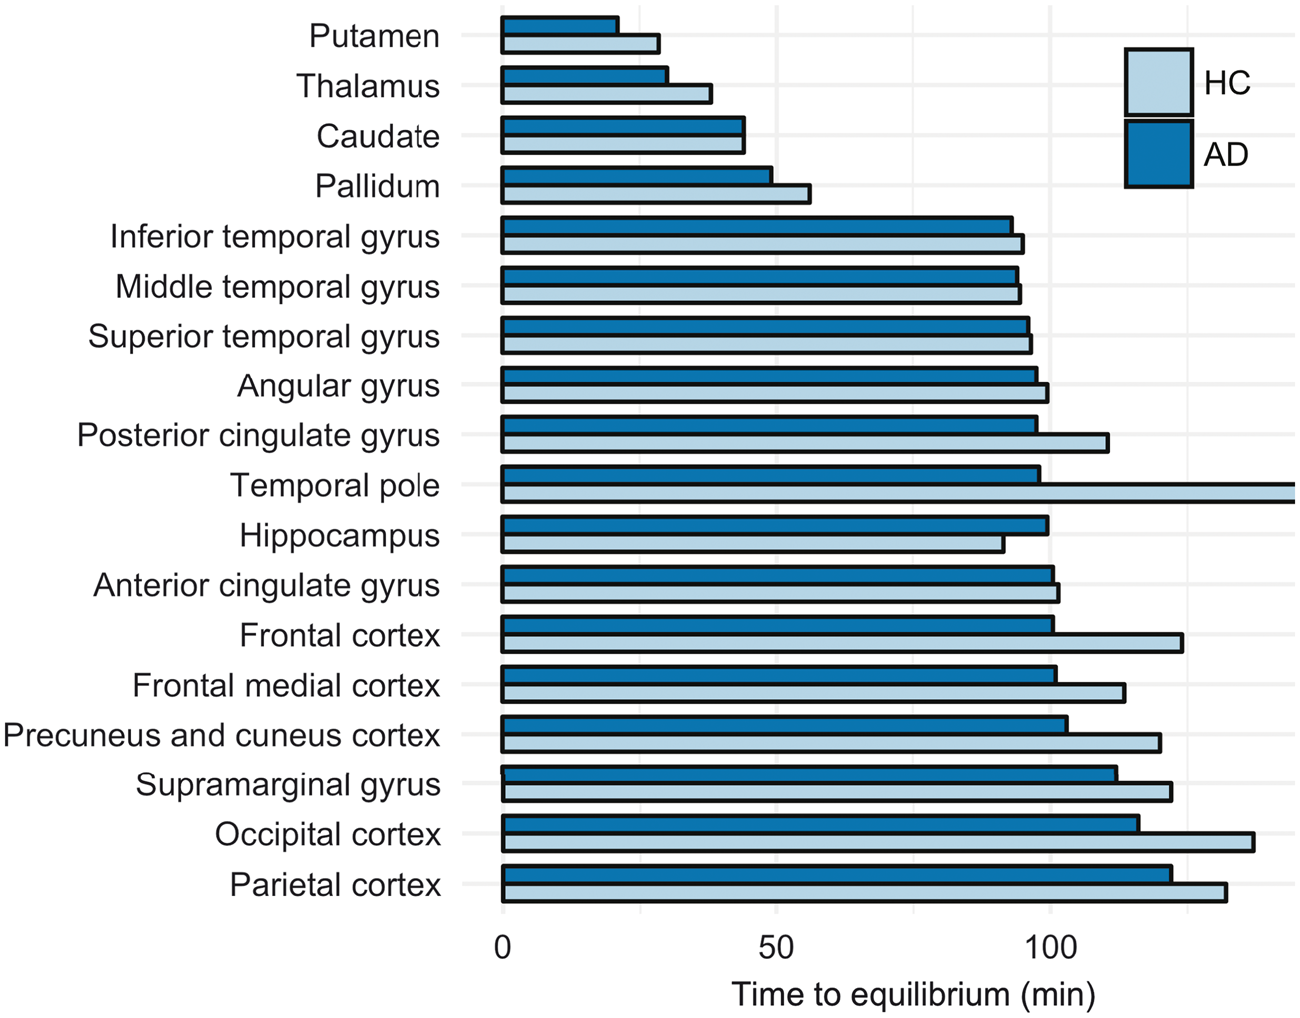
Impact of tEq on SUVR bias
We used the slope of the linear regression between SUVR and plasma input Logan DVR on a region-by-region basis was used as an estimate of the bias of SUVR for each time window studied. To investigate the impact of tEq on this bias, another linear regression was then performed between group average tEq and the bias, as well as the ranked order of tEq and the bias. Due to differences in tEq between the AD group and the HCs, and the narrow dynamic range and small sample size in the HC group, this analysis only included the AD subjects. In Figure 3(a), these linear regressions are shown for AD subjects. All correlations with tEq were statistically significant at p < 0.05 for all time windows (p < 0.0001–0.0019), except at 80–100 min where p = 0.0537, indicating that during this specific time window the regional SUVR is least affected by the tEq. Similar results were demonstrated for the ranked order of tEq, p < 0.05 for all time windows (p = 0.0008–0.017), except for 80–100 min where p = 0.083. During the earlier time windows (20–40 min and 40–60 min), we observed a negative correlation between bias and tEq; for later time windows (100–120 min and 120–140), there was a positive correlation, i.e. regions with later tEq had a greater bias compared to plasma input Logan DVR.
(a) Linear regressions of the SUVR bias in AD patients, represented by the slope for DVR vs. SUVR linear regression, and the time when the average time-activity curves reached equilibrium (tEq) (top) as well as the ranked order of the time when the different regions reached equilibrium (bottom). The models were significant (p < 0.05) for all time windows for SUVR estimation except 80–100 min. (b) Visual representation of the bias introduced across regions by SUVR at different time points. SUVR was estimated based on the region-specific equation of the linear regression between plasma input Logan DVR and SUVR, using cerebellar cortex as reference region and the following equation: SUVR
i
= α
i
· DVR + β
i
, where i is the time window used for estimation of SUVR (see Supplementary Table 1). The top series show a set level of uniform DVR of 2 across all regions, and the bottom series a DVR of 1. Blank areas were not included in the analysis, hence was no SUVR estimated for these. SUVR: standardised uptake value ratios; DVR: distribution volume ratios.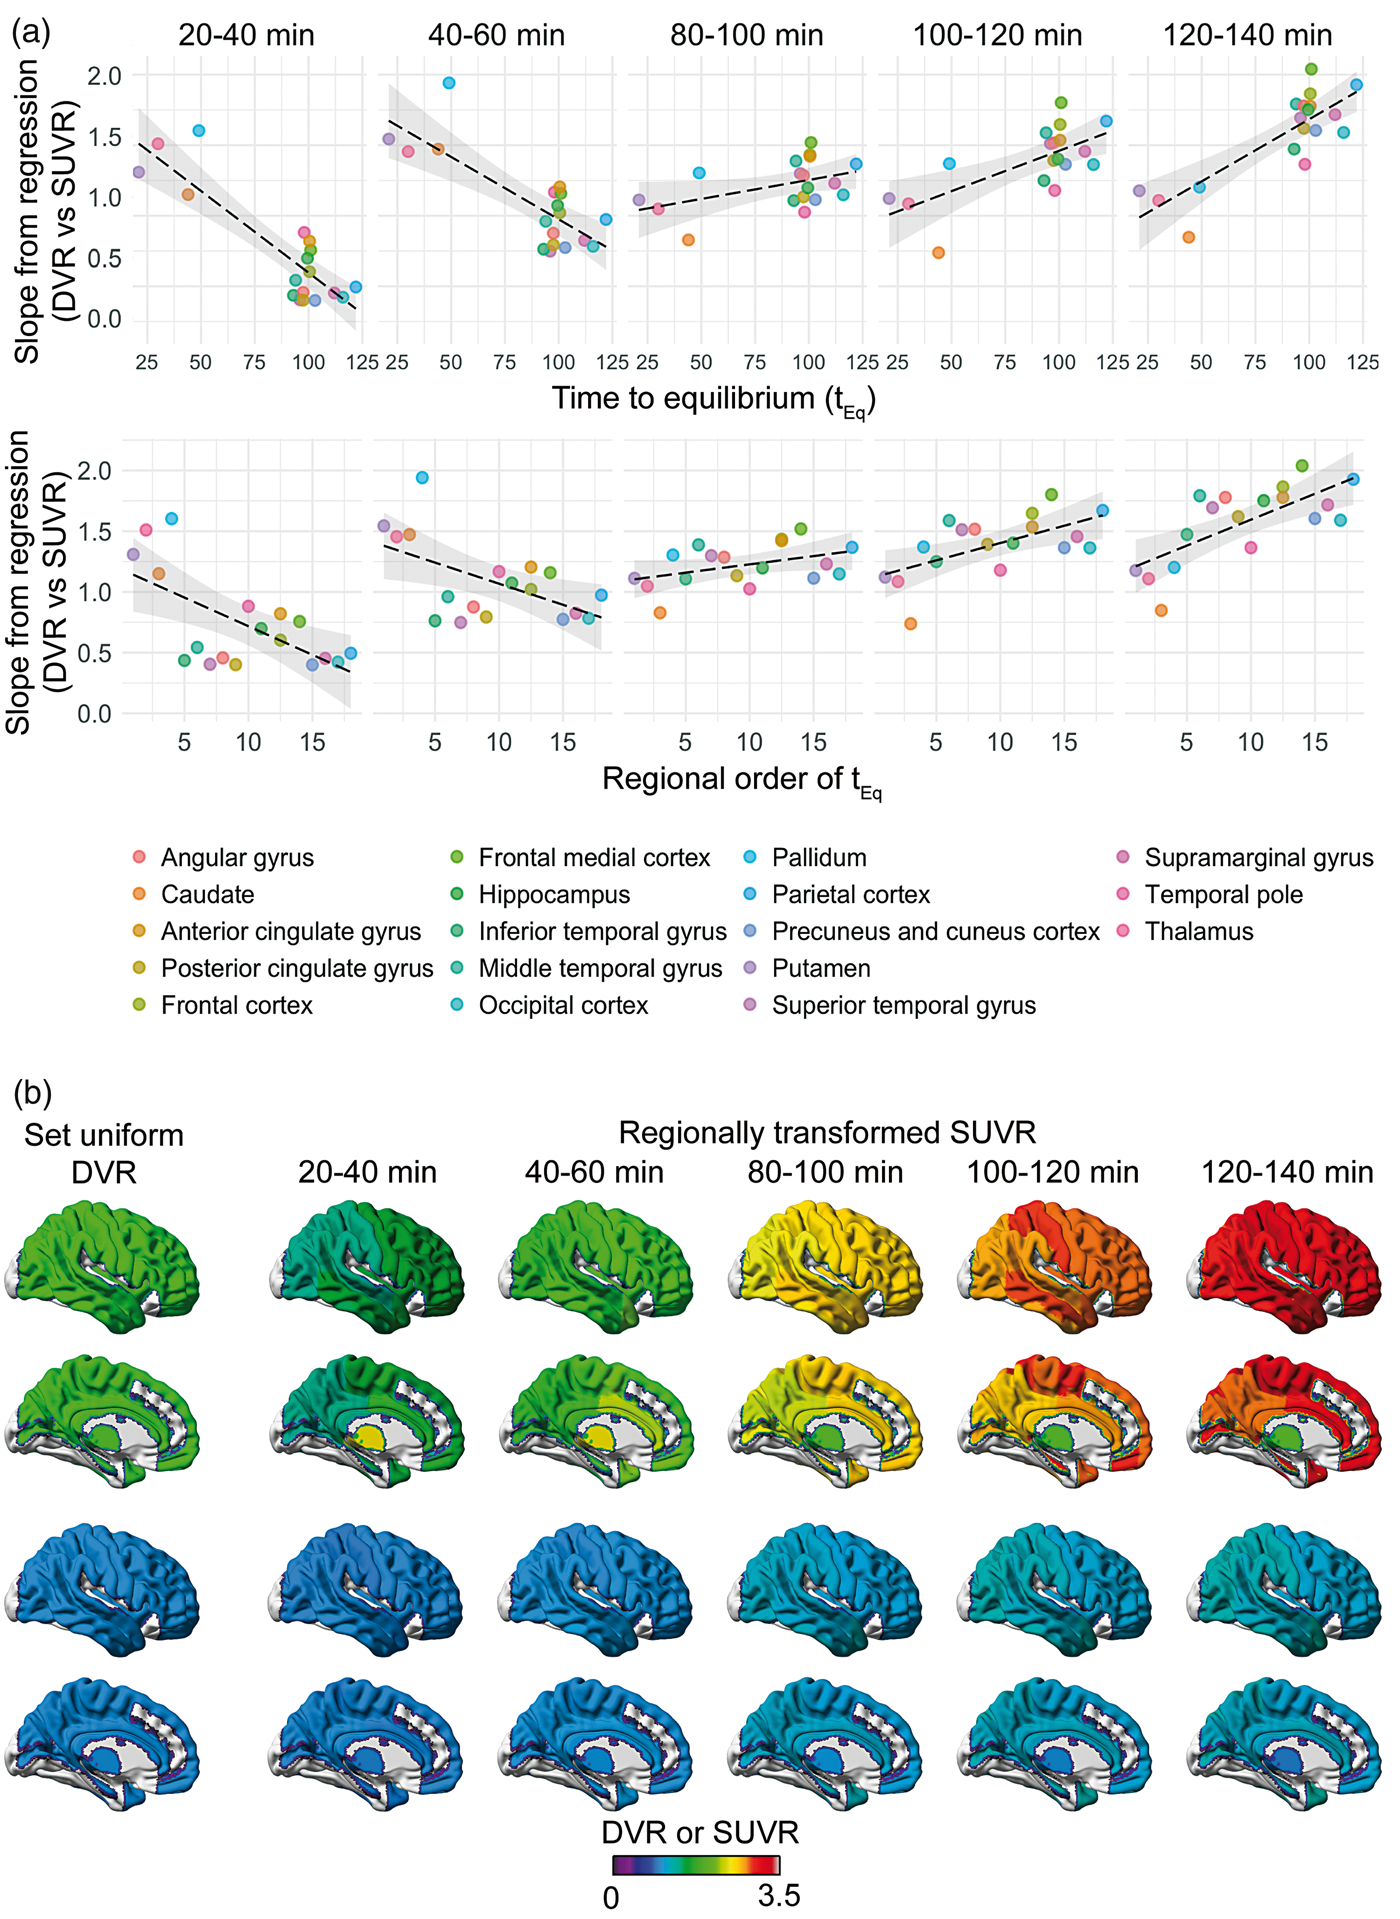
Visualisation of region-specific SUVR bias
For demonstrational purpose, two series of synthetic images were created, wherein predetermined regional DVR was recalculated to SUVR using the parameters listed in Supplementary Table 1 including all subjects and regions included in the atlas. The two series were based on DVR = 1 representing low uptake, and DVR = 2, representing moderate to high uptake, across all regions. The resulting series are shown in Figure 3b, visualised using the BrainNet Viewer (v 1.6. https://www.nitrc.org/projects/bnv/). 39 The figure highlights the bias introduced when using the semi-quantitative SUVR estimate instead of DVR based on a dynamic scan, and especially demonstrates how it introduces regional variation of the uptake, where ideally there should be none.
Discussion
In this study, we investigated the occurrence of the equilibrium of the approximated specific binding for the tau PET ligand [18F]AV-1451 across different brain regions and how it affects the accuracy of the short-duration late-phase uptake estimate standardised uptake value ratio or SUVR. We observed that while SUVR of [18F]AV-1451 may correlate well with more accurate dynamic scan-based measurements of ligand uptake, as has been previously shown, there are regional differences in the bias that the simplification introduces. Our study also demonstrated that the bias itself is associated with the regional time point at which equilibrium is achieved during all studied time windows except for 80–100 min post-injection.
The time point for reaching transient equilibrium has previously been indicated as the optimal time point for estimation of SUVR, as it at this time theoretically should be equivalent to the DVR when fulfilling certain assumptions.34,40,41 For [18F]AV-1451, the time point when equilibrium was reached varied between different regions and between AD and HC, likely related to the degree of specific binding. In cortical regions, the radioactivity concentration curve of the estimated specific binding, CS, maintained a virtual equilibrium as a result of the relationship between the late-phase wash-out rates in the target and reference regions resulting in parallel time-activity curves (dCT/dt = dCCerebellum/dt). The ratio of the target and reference region, however, demonstrated a steady increase as a result of the decreasing radioactivity concentrations. This could suggest that the specific binding exhibits such slow kinetics that it is approaching irreversibility during the scan duration, and that the wash-out represents decrease in non-specific binding; however, further kinetic analyses are required to confirm this theory. In practice, however, this means that the duration between the time window and the time to equilibrium determines the bias of SUVR in the cortical regions. For time windows later than tEq, the bias is positive, whereas for time windows before tEq, SUVR will be under-estimated. In the sub-cortical regions, demonstrating earlier time to equilibrium, this relationship is shifted in time. The time window of 80–100 min, however, appears to be positioned at a point in the tracer kinetics where the bias is most consistent across regions.
Previous analyses have shown disagreement regarding the accuracy of describing the kinetics of [18F]AV-1451 using a two-tissue compartment model, and no improvement in model fitting was observed when the three-tissue compartment model was applied.29,30 Further, in those cases where compartmental models have failed to accurately describe the data, the disagreement between model and measurement was observed predominantly at late scanning time points. Interestingly, the number of metabolites detected in blood varies between one and two, where one has been described as moderately non-polar, which may in part explain the discrepant findings.29–31 Another potential explanation for the problems with fitting compartmental models to the experimental data may be the uptake of a radiolabelled metabolite contributing to the signal in the late phase, although this has not been examined more closely. This has previously been demonstrated for the tau tracer [11C]-PBB3 but was not found to influence the correlation between SUVR-1 and BP*ND (i.e. the BPND estimated when including the metabolite in the input function). 42 While studies in mice showed no presence of radiolabelled metabolites of [18F]AV-1451 in the brain after 30 min, 18 this does not guarantee that it does not occur in the later phases of scanning that have been conducted here. Assuming that this potential contribution is similar both in the target and reference region, the assumptions of the transient equilibrium method would still be valid.
The graphical analysis methods introduced by Logan et al., for both plasma 36 and reference region input, 43 are known to introduce bias, primarily in the form of underestimation compared to compartment modelling, due to their sensitivity to noise. 44 These issues have been addressed previously, and one approach, the Relative Equilibrium graphical method, was suggested by Zhou et al. 45 In this approach, the starting point of the linear fitting is selected based on the time point where the lowest bias of DVR is achieved, i.e. at the time point when equilibrium between target tissue and plasma or reference tissue is reached. It was further suggested by Zhou et al. to estimate tracer-specific constants using the relative equilibrium method to correct for bias of SUVR compared to DVR. 46 However, based on our finding of varying kinetic properties across different brain regions, such tracer-specific constants common throughout the brain cannot be estimated, thus rejecting application in [18F]AV-1451 quantification.
While the results of this study indicate regional dependency of the SUVR bias, proposing that such comparisons of ligand uptake across different regions using SUVR should be made with some caution, they also confirmed that the bias varies least between regions during the most commonly used time window for static scanning, i.e. 80–100 min post-injection. The bias itself for this time window is greater compared to the 40–60 min time window; however, it is more consistent across regions and thus favourable for tau imaging as the pathology is wide-spread throughout the brain at the disease stage.
Although limited by the modest sample size, our results demonstrate differences also between HCs and AD patients, with regard to both the time to equilibrium and the regional order in which it occurred. While this is likely to be an effect of differential tau accumulation in various regions, it could hypothetically also be an effect of differences in the reference region kinetics used to identify the time point when equilibrium is reached, though it has been shown that the distribution volume of the cerebellar cortex is not significantly different between AD subjects and age matched controls. 29 Moreover, the small number of HCs in this study and the narrow dynamic range in uptake among these made it impossible to study the association between bias of SUVR and the time to equilibrium in this group.
Comparisons of uptake ratio methods with more sophisticated estimates of uptake have been performed previously and consistently shown high correlations but varying degrees of bias, with slopes ranging from 1.00 to 1.85 in the comparison of SUVR against reference input Logan DVR in the 80–100 min time window (slopes algebraically deducted to enable comparison, from Barret et al., 29 Shcherbinin et al., 28 Wooten et al. 31 and Hahn et al. 30 ). This variation between studies might be caused by the inherent bias of the Logan approach itself. The numerical bias presented here and in other studies should therefore be interpreted with some caution; however, the association between the regional bias and the time to equilibrium should be replicable in other data sets.
Four of the regions studied here showed substantially earlier and more transient equilibria than the others, the caudate, putamen, thalamus and pallidum; these have previously been ascribed a different kinetic profile compared to other regions.27–30,32 Although it is yet not fully understood what the cause of this alternative kinetic property is, increased capillary permeability has been indicated in the putamen and the globus pallidus using dynamic gadolinium-contrast enhanced MRI, 47 which would result in an increased extraction of tracer, i.e. a higher influx-rate, K1, which has also been confirmed for [18F]AV-1451 in putamen. 29 Although our study did not investigate differences in uptake between HC and AD, the thalamus and the putamen have been shown to exhibit hyperperfusion in AD, which would lead to increased delivery increasing the uptake. 48 An alternative hypothesis is based on the correlation between high and age-related tissue iron content and [18F]AV-1451 uptake within the basal ganglia, suggesting that the uptake could be at least in part due to “off-target” binding to iron or ferritin. 49 More studies are needed to confirm the theories of the regionally different kinetic characteristics of the [18F]AV-1451 and to investigate these characteristics in other tau PET tracers.
Conclusion
The time point for reaching equilibrium of the [18F]AV-1451 kinetics varies across regions, affecting the agreement between DVR and SUVR differentially in different brain regions. Although graphic analysis using plasma input Logan may itself introduce a negative bias, our findings suggest that there is a regional component to the bias of late scan SUVR, and uptake estimates using this approach for quantification should thus be interpreted with caution when compared across brain regions. The degree of this bias varied across the studied time windows with the regional variation being lower and the bias more consistent in the time window 80–100 min post-injection, further supporting the use of this previously recommended time window for semi-quantification of [18F]AV-1451 uptake. We have examined and highlighted a potential issue to be taken into consideration when quantifying [18F]AV-1451 uptake using SUVR regarding the regional time-dependent bias. Our findings conclude, however, that the best available option is the currently used standard, and as such validates the continued use of a static scan 80–100 min post-injection for [18F]AV-1451 tau imaging, where dynamic scans cannot be performed.
Supplemental Material
Supplemental material for Regional times to equilibria and their impact on semi-quantification of [18F]AV-1451 uptake
Supplemental material for Regional times to equilibria and their impact on semi-quantification of [18F]AV-1451 uptake by Kerstin Heurling, Ruben Smith, Olof T Strandberg, Martin Schain, Tomas Ohlsson, Oskar Hansson and Michael Schöll in Journal of Cerebral Blood Flow & Metabolism
Footnotes
Funding
The author(s) disclosed receipt of the following financial support for the research, authorship, and/or publication of this article: The Knut and Alice Wallenberg Foundation, the Wallenberg Centre for Molecular and Translational Medicine, University of Gothenburg, Sweden, the European Research Council, the Swedish Research Council, the Strategic Research Area MultiPark (Multidisciplinary Research in Parkinson’s disease) at Lund University, the Swedish Alzheimer Foundation, the Marianne and Marcus Wallenberg foundation, the Crafoord Foundation, the Swedish Brain Foundation and the Swedish Federal Government under the ALF agreement, and Swedish Brain Power.
Acknowledgements
The authors would also like to acknowledge the contribution of Jonas Jögi and Andreas Hahn and other members of the Swedish BioFINDER study.
Declaration of conflicting interests
The author(s) declared the following potential conflicts of interest with respect to the research, authorship, and/or publication of this article: The precursor of AV-1451 was generously provided by Avid radiopharmaceuticals. Oskar Hansson has served at advisory boards for Eli Lilly, Roche Diagnostics and Fujirebio and received research support from GE Healthcare and Hoffman La-Roche. No other disclosures were reported.
Authors’ contributions
KH, MaS and MiS jointly developed the concept, performed the analysis and interpreted the results. General study design and concept and obtaining of funding was performed by OH. Pre-processing of data was performed by RS, MaS and OTS. RS, TO and OH participated in the acquisition of the data. Administrative, technical and material support was performed by OH. Drafting of the manuscript was done by KH and MiS. Critical revision of the manuscript was done by RS, MaS, OTS, TO and OH.
References
Supplementary Material
Please find the following supplemental material available below.
For Open Access articles published under a Creative Commons License, all supplemental material carries the same license as the article it is associated with.
For non-Open Access articles published, all supplemental material carries a non-exclusive license, and permission requests for re-use of supplemental material or any part of supplemental material shall be sent directly to the copyright owner as specified in the copyright notice associated with the article.