
Abstract
Cellular ATP energy metabolism and regulation are essential for brain function and health. Given the high ATP expenditure at resting-state, it is not yet clear how the human brain at working-state can effectively regulate ATP production to meet higher energy requirement. Through quantitative measurement of regional cerebral ATP production rates and associated neurophysiological parameters in human visual cortex at rest and during visual stimulation, we found significant stimulus-induced and highly correlated neuroenergetic changes, indicating distinctive and complementary roles of the ATP synthesis reactions in supporting evoked neuronal activity and maintaining ATP homeostasis. We also uncovered large individual variances in the neuroenergetic responses and significant reductions in intracellular [H+] and free [Mg2+] during the stimulation. These results provide new insights into the mechanism underlying the brain ATP energy regulation and present a sensitive and much-needed neuroimaging tool for quantitatively assessing neuroenergetic state in healthy and diseased human brain.
Keywords
Introduction
Bioenergetics plays fundamental roles in human evolution and diseases. 1 As the most energy-demanding organ in the body, maintaining energy homeostasis in the human brain is vital to its health and function.2,3 In the brain, the biochemical energy in the form of adenosine triphosphate (ATP) is generated predominately from glucose and oxygen via cytosolic glycolysis, mitochondrial tricarboxylic acid (TCA) cycle, oxygen metabolism and oxidative phosphorylation (OXPHOS) pathways2,4; biosynthesis and neural signaling consume most of the ATP energy, largely for maintaining the membrane integrity and the ion gradients of the brain cell.5–8 Current understanding of brain ATP energy metabolism and neurochemistry derives mainly from isolated brain cells or tissues; however, given their ample differences from intact functioning brain, it is critically important to directly assess neuroenergetic properties of the living brain under various physiopathological conditions.
Modern neuroimaging technologies make it possible to non-invasively study glucose and/or oxygen metabolisms in live brains. The 18F-fluorodeoxyglucose (FDG) positron emission tomography (PET) or the 15O-PET can measure the regional glucose uptake or oxygen consumption, respectively.9,10 In vivo magnetic resonance (MR) spectroscopy (MRS) techniques provide powerful tools for studying the brain metabolisms and neurochemistry. Among them, the 13C MRS in combination with 13C-isotope-labeled substrate infusion has been the only non-invasive method for determining the neurotransmission cycling rate and cell-specific neuroenergetics; and the 17O MRS-based imaging method with an 17O-labeled oxygen gas inhalation is able to determine the cerebral metabolic rate of oxygen (CMRO2).11–13 These measurements could be employed to indirectly estimate the brain’s ATP energy expenditure based on assumptions or the stoichiometric relations of the oxygen–glucose index (OGI) and the cerebral ATP synthesis to oxygen consumption ratio (P/O ratio). However, the actual values of the OGI and P/O ratio in the human brain are either difficult to determine or not present in the literature, they may also vary depending on brain conditions and brain regions14–17; thus, large uncertainties could arise from such estimation.
In vivo 31P MRS in combination with the magnetization transfer preparation (31P-MT) has been established recently as the sole technique capable of directly and non-invasively measuring the kinetics and metabolic fluxes of the ATP synthesis reactions in the human brain.18–24 Since the ATP synthesis is controlled by mitochondrial ATP synthase (ATPase) reaction and supported by the creatine kinase (CK) reaction,3,4,25 a complex chemical exchange system involving ATP, phosphocreatine (PCr) and inorganic phosphate (Pi) exists inside cells; thus, by employing frequency-selective saturation on γ-ATP (i.e. the terminal phosphate group of ATP) resonance, the forward rate constant (kf) and flux of the ATPase (Pi → ATP) and CK (PCr → ATP) reactions can be calculated from the chemical exchange induced signal reduction on the Pi and PCr resonances, respectively.19,20,26 When incorporated with a spatial localization technique such as three-dimensional (3D) chemical shift imaging (CSI), 27 the ability of the in vivo 31P-MT approach can be further extended to enable the assessment of regional cerebral ATP metabolism. 21 Due to the relative low concentration of the intracellular Pi in normal brain tissue and the low intrinsic sensitivity of the in vivo 31P MRS detection, it is generally challenging to reliably measure the ATP production rate via the ATPase reaction in the human brain. Nevertheless, with the advancement in emerging MR imaging technology and the increasing availability of ultrahigh magnetic field human scanners, the sensitivity and spectral quality of the in vivo 31P MRS have been improved significantly,20,28 quantitative assessments of cerebral ATP metabolic rates via both ATPase (CMRATP) and CK (CMRCK) reactions have been demonstrated in the resting-state human brain at ultrahigh field of 7 Tesla (T).19–22
It is well recognized that a conscious human brain never truly rests because essential cellular processes and spontaneous neuronal activities occur even when the brain is in a restful state; in fact, those activities have a very high ATP energy expenditure,3,6,29 particularly in the cortical gray matter as evaluated by the 31P-MT studies.19–21 With a high resting-state energy budget, how much more ATP energy would a working-state human brain require in order to function properly? To answer this intriguing question, many studies have been conducted that mainly focused on determining the substrate or oxygen consumption changes in activated human or animal brain, and the results were diverse and inconclusive.30–37 A related question is how the brain cells effectively regulate their ATP production under resting and working conditions to meet the energy needs of a healthy human brain. A direct measurement of the ATP energy production rates in resting and working human brain should be the most relevant approach to address these scientific questions.
In this study, we established a 31P-MT based neuroimaging technique with a specifically designed protocol to measure and quantify an array of neuroenergetic and neurophysiological parameters including two key metabolic rates of CMRATP and CMRCK in the human visual cortex at rest and during visual stimulation, and thus the stimulation-evoked regional neuroenergetic and neurophysiological responses in healthy human subjects were quantitatively determined and investigated.
Material and methods
Subject and phantom information
Nine healthy volunteers (four males and five females, age = 24.3 ± 5.0 years with normal or corrected-to-normal vision) participated in this study with written informed consent. All study procedures followed the Code of Federal Regulations and were approved by the Institutional Review Board: Human Subjects Committee of the University of Minnesota.
A head-sized spherical ATP phantom containing ∼2 L freshly prepared ATP solution ([ATP] = 10 mM, [Na+] ≈50 mM, [Mg2+] = 10.3 mM and pH ≈ 7.0) was used in this study as an external reference for calibrating and quantifying the ATP concentration of the human brain.
MR scanner and RF probe
A whole-body/90-cm bore actively shielded 7T human scanner (Siemens MAGNETOM, Erlangen, Germany) was used for conducting all 1H MRI and 31P-CSI measurements. B0 shimming (up to third order) focusing on the human visual cortex was performed using Siemens 3D shimming sequence. A home-built RF probe consists of passively decoupled 1H and 31P (5 cm diameter) dual surface coils were placed beneath the human occipital lobe for the MR data acquisition. A small glass sphere containing a phosphorus reference (1.0 M solution of methylphosphonic acid) was fixed at the center of the 31P coil for RF power and pulse flip angle (FA) calibration.
Study protocol and visual stimulus
The study protocol is illustrated in Figure S1 and it consists of two parts: the human brain scans followed by the scan of a head-sized ATP phantom. During the human scan, we acquired blood-oxygen-level dependent (BOLD) contrast based functional MR imaging (fMRI) 38 data with visual stimulation and 3D 31P-CSI data with and without γ-ATP saturation under resting and stimulation conditions. A black-red reversal checkerboard at 8 Hz was presented on a screen placed ∼ 50 cm from the subject’s eyes (view angle ≈ 35°) for visual stimulation. The participants were instructed to fixate on a crosshair at the center of the screen during the measurement and respond by pressing the button when the crosshair was rotated or changed color; the responses were recorded for evaluation of the subjects’ performance. We avoided continuous functional 1H and/or 31P MR data acquisition to gave subjects some rest. After each human scan, fully relaxed 3D 31P-CSI data with identical spatial resolution were also obtained on the ATP phantom, which had the same RF coil loading, sample position and RF pulse FA profile as the subject’s head (see Figure S2 for experimental setup). An additional phantom scan with identical setup was conducted to map the 31P RF magnetic field (B1) and calibrate RF pulse FA in the brain region of interest (ROI).
MR data acquisition
T1-weighted anatomic image for brain structure (TR/TE/TI = 3000/3.3/1500 ms, FA = 7°, 1 mm isotropic resolution; T1: longitudinal relaxation time, TR: repetition time, TE: echo time, TI: inversion time) and gradient-echo echo-planar images for fMRI (GE-EPI: TR/TE = 2000/23 ms, matrix size = 64 × 64, 22 image slices, 6-min acquisition and 3 mm isotropic resolution) were acquired. A functional paradigm (60 s baseline + (20 s stimulation + 40 s rest) × 5) was used for collecting fMRI data.
3D 31P-MT CSI data (field of view: FOV = 12 ×12 × 9 cm3, matrix size = 7 × 7 × 5, cylindrical-shape voxel size = 4.1 cm3, TR = 1.2 s, total number of transit NT = 896, 300 -µs hard pulse and FA = 48°) with and without applying the B1 insensitive selective train to obliterate signal (BISTRO) pulse (50 ms pulse length with 160 Hz saturation bandwidth and 0.9 s saturation duration) for frequency-selective saturation on γ-ATP resonance were acquired under resting and stimulated conditions in the human brain.18,39
MR data process
The fMRI data were analyzed with statistical parametric mapping (SPM) package (http://www.fil.ion.ucl.ac.uk/spm/software/spm8). After realignment and spatial smoothing (8 mm FWHM), general linear model (GLM) and Gaussian random field (GRF) were performed to make inference about spatially extended data through statistical parametric maps; statistical significance was given at p < 0.05 after correcting multiple comparisons using family-wise error (FWE) with a cluster size of 100.
The 31P MRS data of selected 3D CSI voxels were zero-filled, and a 10 Hz line broadening was applied before fast Fourier transformation to enhance the signal-to-noise ratio (SNR). The AMARES time domain spectra fitting algorithm in the jMRUI software package (version 5.0) was used to analyze selected 31P spectra40,41; the integrals of the phosphorous metabolites were used to quantify their molar concentration after correcting the saturation effects based on the T1, B1 and FA information, or to derive other physiological parameters. The T1 values of the human brain phosphorous metabolites at 7T were previously determined and employed in this study.20,28,42
Absolute phosphorous metabolites quantification
We established a two-step approach to quantify the molar concentration of phosphorous metabolites in the human brain: first to determine the brain ATP concentration using a head sized ATP phantom, and then using the brain ATP resonance signal as an internal reference to quantify the concentration of other phosphate compounds. Choosing ATP as the reference makes the quantification more reliable and measurement less time consuming since the ATP has the most stable tissue content across a wide range of brain conditions or tissue types and the shortest T1 value comparing to other phosphate compounds.28,42,43 Specifically, we carefully calibrated the RF power using the reference sphere at the center of the 31P surface coil to adjust and match the 31P coil excitation profile for both human brain and phantom scans. Thereby, the actual cerebral ATP molar concentration of each subject can be determined by comparing the ATP signals in the selected brain region to that of ATP phantom (see Figure S2) after correcting signal saturation effects. By comparing the γ- and/or α-ATP signal integral (I) of the corresponding CSI voxel measured in the ATP phantom and the resting human brain without the γ-ATP saturation, we can calculate the absolute ATP concentration ([ATP]) of the brain according to

The resting [ATP]brain in millimolar (mM) unit can then be used as an internal standard for determining the molar concentration of other phosphorous metabolites including PCr and Pi in each subject at different conditions with the correction of saturation effect.
Quantification of regional energetic parameters in the human brain
To quantitatively and efficiently determine the reaction rate constant kf and metabolic rate of ATP, we applied a previously developed superfast magnetization saturation transfer method.21,44 Specifically, the 3D 31P-MT CSI data were co-registered with the 1H anatomic image and fMRI map of the same subject according to the head position in the magnet; the activated voxels in the 31P-MT CSI were identified based on the fMRI map, and the 31P spectra in the selected ROI coincided with the activated brain region were further analyzed for quantification and comparison.
To determine the forward rate constant of the ATPase and CK reactions (kf,ATPase and kf,CK), following equation was used21,44

The corresponding cerebral metabolic rates of ATP production via ATPase and CK reaction can be quantified as


The intracellular pH (pHi) and free magnesium concentration [Mg2+] of the brain tissue were calculated using the subroutine in jMRUI software with the chemical shift differences information of Pi to PCr (δ-Pi) and PCr to β-ATP (δ-βATP), respectively. 40
Statistics
All results are presented as mean ± standard deviation (SD) in this study. The statistical analysis using paired two-tailed student t-test and linear regression reported the p-values and Pearson’s correlation coefficient (r); and a p value of < 0.05 was considered statistically significant.
Results
Imaging human brain functional responses to visual stimulation
All subjects showed robust BOLD response inferring brain activation covering the primary visual cortex in response to the visual stimulus (average BOLD response: 3.3 ± 0.7%, n = 9, details can be found in Figure S3). The functional neuroenergetic changes in subjects’ visual cortices were assessed using 3D-CSI-based 31P-MT imaging approach in the absence (resting state) and presence (activated state) of the visual stimulation. Figure 1 shows typical 31P-MT imaging and fMRI data obtained from a representative subject. It illustrates one typical slice of the BOLD activation map (Figure 1(a)), the corresponding 31P-MT CSI slice in the absence (Figure 1(b)) and presence (Figure 1(c)) of the γ-ATP saturation, and the paired 31P-MT spectra acquired under the resting and activated conditions (Figure 1(d)) in the ROI showing robust BOLD responses to visual stimulation. Excellent sensitivity and spectral quality of the human brain 31P spectra at 7 T are evident from the high SNR and narrow spectral linewidth (LW) of the PCr resonance (SNRPCr = 74 ± 9 and LWPCr = 15.3 ± 0.5 Hz, n = 9) obtained in the central CSI voxels near the calcarine fissure, which made it possible to reliably measure and quantify the regional neuroenergetic parameters and their changes.
Functional MRI and 31P-MT imaging measurement in a representative subject: (a) BOLD-based fMRI activation map (in coronal orientation) overlay on the T1-weighted anatomic brain image, and the corresponding slice of 31P-MT imaging data in the absence (b) and presence (c) of γ-ATP saturation; and (d) the paired 31P-MT spectra within the ROI (as outlined in a–c) acquired at resting and activated state in this subject.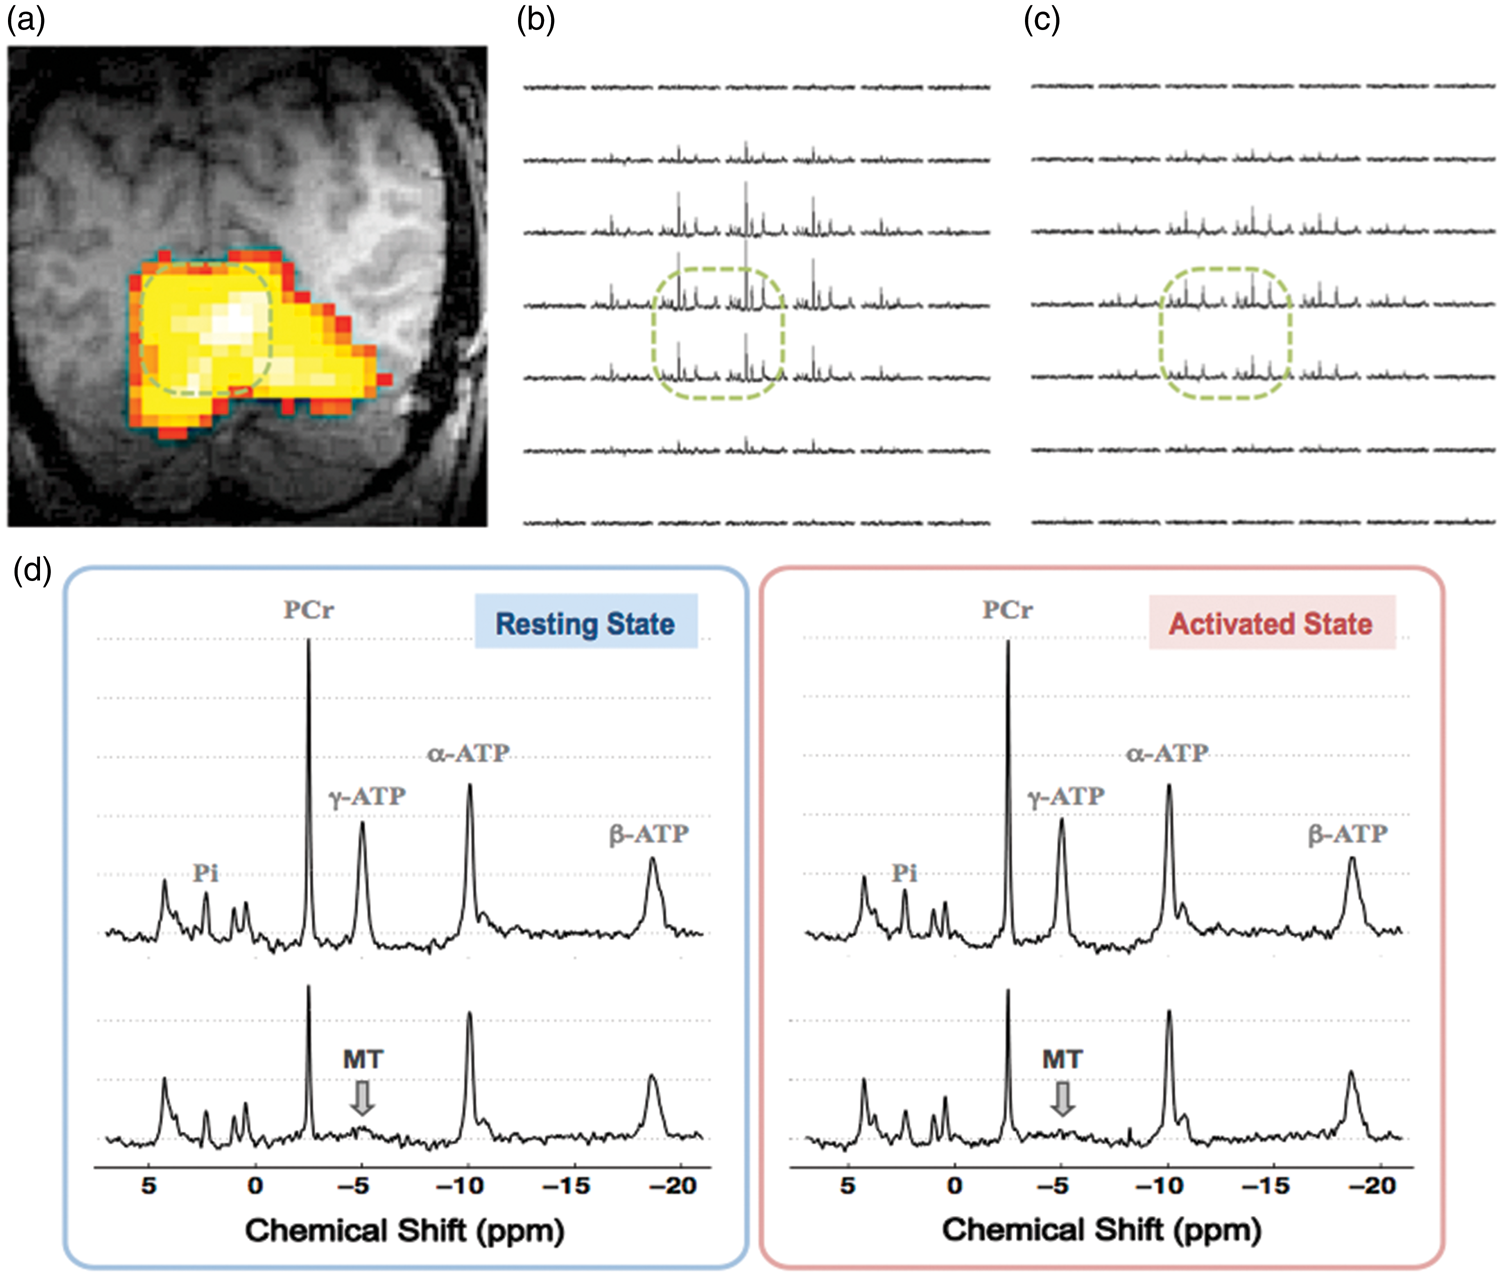
Functional changes of cerebral ATP energy metabolism via ATPase reaction
To determine the visual stimulus-induced neuroenergetic changes related to the ATPase reaction, the intracellular Pi concentration, forward rate constant and the unidirectional flux in the activated brain region during stimulation and at rest were measured and quantified, and the results are summarized in Figure 2(a) to (c). We found that the intracellular Pi level in the activated brain tissue only increased slightly without statistical significance ([Pi]rest = 0.96 ± 0.10 mM versus [Pi]stim =1.00 ± 0.12 mM, p = 0.15, n = 9), while the forward rate constant and flux of the ATPase reaction were significantly higher during the stimulation (kf,ATPase =0.19 ± 0.04 s−1 and FluxATPase = 10.6 ±2.5 µmol/g/min) as compared to that of the resting brain (kf,ATPase =0.15 ± 0.02 s−1 and FluxATPase =8.1 ± 1.3 µmol/g/min) with p values of 0.01 and 0.004 (n=9), respectively. The relative regional functional energetic responses associated with the ATPase reaction can be calculated as: Δ[Pi] = 4 ± 8%, Δkf,ATPase =29 ± 27% and ΔCMRATP (i.e. ΔFluxATPase) =31 ± 25% (n = 9) in the human visual cortex.
(a) Intracellular Pi concentration, (b) forward rate constant (kf,ATPase) and (c) unidirectional flux (FluxATPase) of the ATPase reaction; (d) intracellular PCr concentration, (e) forward rate constant (kf,CK) and (f) unidirectional flux (FluxCK) of the CK reaction obtained in human brains at rest (light bars) and during visual stimulation (dark bars) (n = 9; mean ± SD; two-tailed paired t-test indicating significant differences detected when comparing these two conditions with * p < 0.05 and ** p < 0.01, see also Table S1).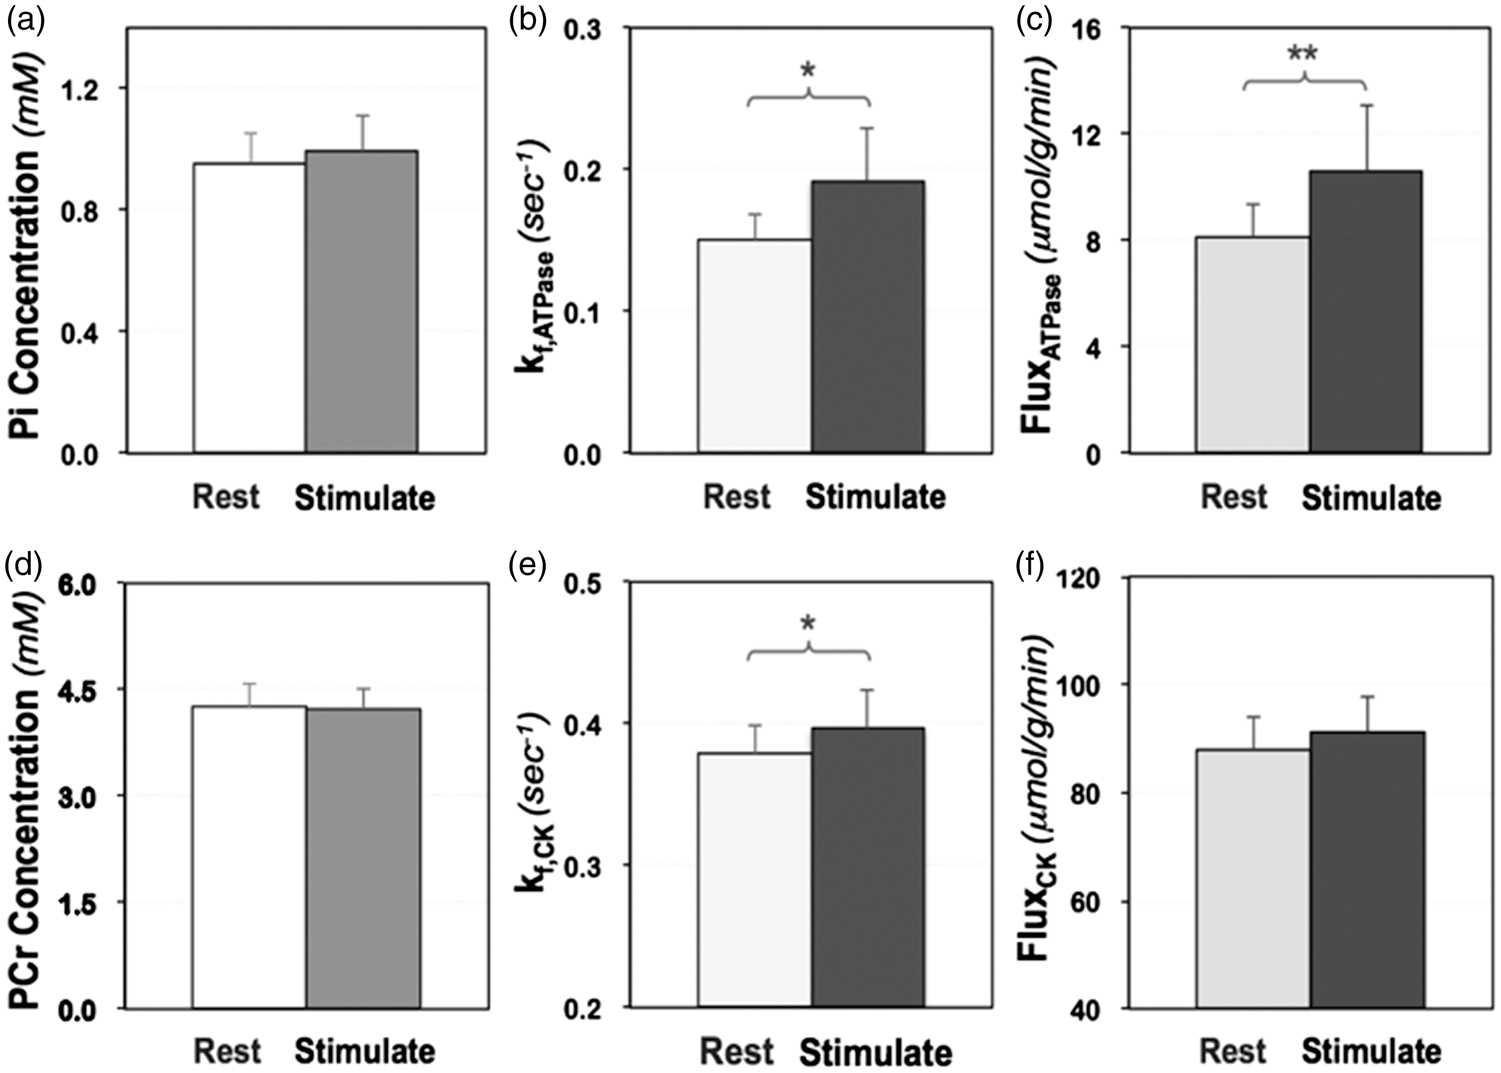
Functional changes of cerebral ATP energy metabolism via CK reaction
In contrast to the large kinetic and flux changes of the ATPase reaction, Figure 2(d) to (f) shows that only the forward rate constant of the CK reaction increased significantly during the visual stimulation (kf,CK =0.40 ± 0.03 s−1) as compared to that at rest (kf,CK =0.38 ± 0.02 s−1; p = 0.04, n = 9); while the PCr content was marginally lower ([PCr]stim = 4.23 ±0.29 mM versus [PCr]rest = 4.27 ± 0.32 mM, p = 0.49, n = 9) and the CK flux was slightly increased (FluxCK,stim =91.3 ± 6.4 µmol/g/min versus FluxCK,rest = 88.0 ±5.9 µmol/g/min, p = 0.22, n = 9) in the activated brain region, with the changes not being statistically significant. The relative functional energetic responses related to the CK reaction in the same brain regions were determined as: Δ[PCr] = −1 ± 3%, Δkf,CK = 5 ± 6% and ΔCMRCK (i.e. ΔFluxCK) = 4 ± 9% (n = 9).
Large individual variances in the functional energetic responses
As shown in Table S1, large variations of the measured bioenergetic parameters were found among different subjects, especially in their stimulus-induced changes. Figure 3(a) and (b) displays the functional responses of the phosphorous metabolite content, forward rate constant and unidirectional flux of the ATPase (Figure 3(a)) and CK (Figure 3(b)) reactions, respectively. The functional neuroenergetic changes, either positive (mostly) or negative, showed large variances ranging up to several folds of their mean values; such variances could not be attributed to the measurement errors (see more details in ‘Discussion’), they reflected the true neuroenergetic differences among individual subjects.
Functional neuroenergetic responses of individual subjects (n = 9) to visual stimulation associated with (a) ATPase reaction and (b) creatine kinase reaction; and the strong negative correlation between individual energetic changes displayed as (c) Δkf,CK versus Δkf,ATPase (Pearson’s r = −0.88, p = 1.7 × 10⁻³); and ΔFluxCK versus ΔFluxATPase presented in a (d) relative scale (Pearson’s r = −0.99, p = 1.9 × 10⁻⁷) or (e) absolute unit (Pearson’s r = −0.96, p = 3.6 × 10⁻⁵). See also more details in Table S1.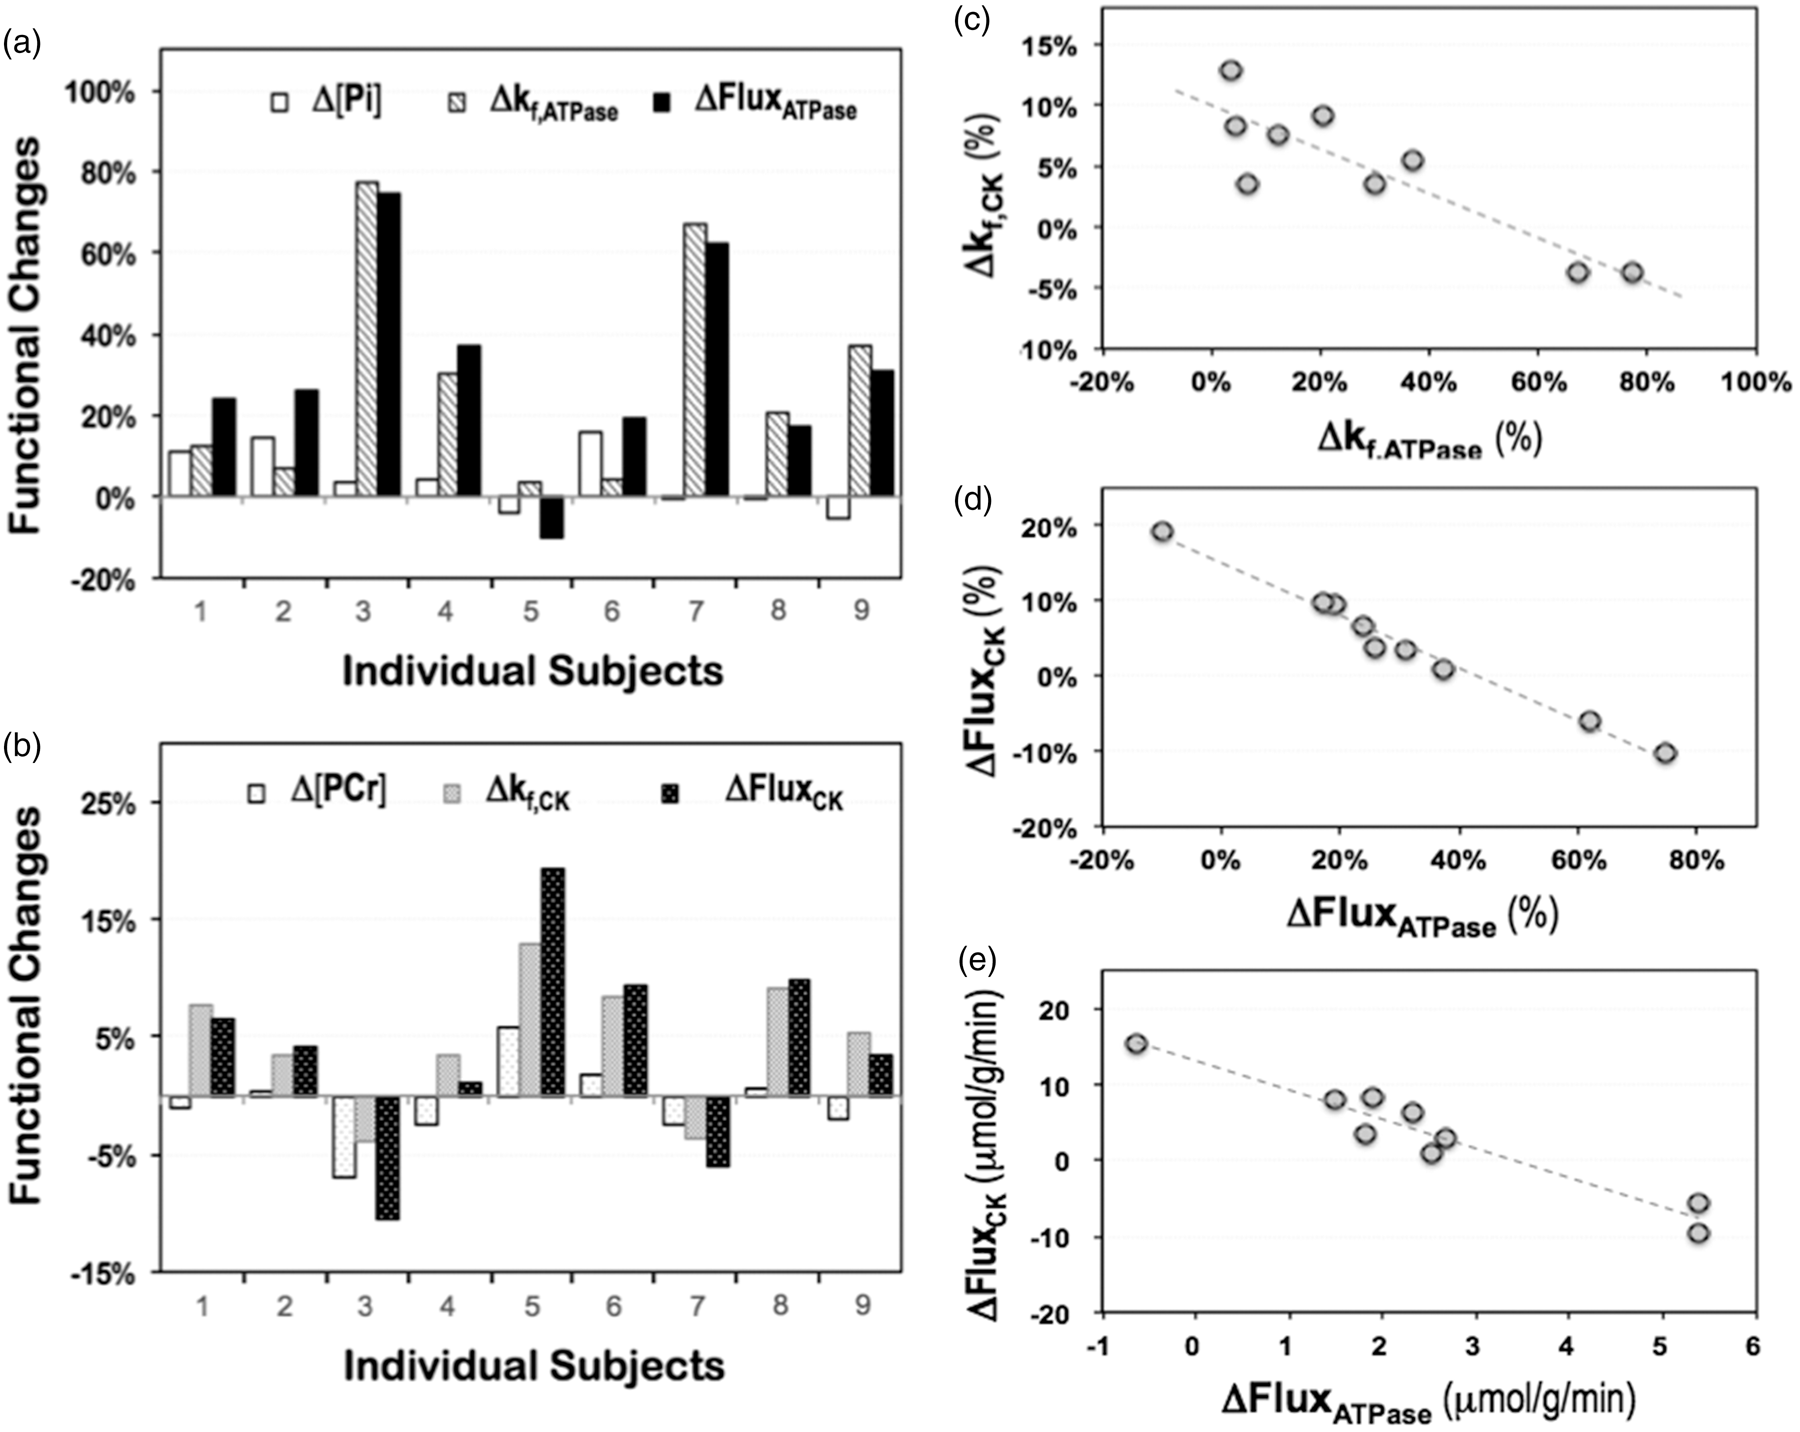
Correlation of neuroenergetic responses via the ATPase and CK reactions
When comparing Figure 3(a) and (b), the functional responses of the ATPase reaction appeared to have an opposite trend as that of CK reaction. A careful examination confirmed that there was indeed a strong and negative correlation (Pearson’s r = −0.88, p = 1.7 ×10⁻³, n = 9) between the forward rate constant changes of these two reactions (Figure 3(c)). Strikingly, the correlation became even stronger when comparing the changes of the ATP metabolic fluxes in either relative (Figure 3(d)) or absolute (Figure 3(e)) scale (Pearson’s r = −0.99 or −0.96 and p = 1.9 × 10⁻⁷ or 3.6 × 10⁻⁵, n = 9), even though the stimulation-induced ΔFluxCK averaged over all subjects did not reach a statistical significance. This was due, in part, to the range of ΔFluxCK spanning both positive and negative directions (Figure 3(b)), thus reducing the mean ΔFluxCK value and statistical significance (Table S1).
Other stimulus-induced neurophysiological changes facilitating the elevated ATP production
As shown in Figure 4, we consistently detected a higher intracellular pH in the activated brain region during the visual stimulation in all subjects (pHstim = 7.048 ± 0.008 versus pHrest = 7.037 ± 0.006; p = 1.4 × 10⁻⁵, n = 9), whereas the intracellular free magnesium content was relatively lower ([Mg2+]stim = 0.160 ± 0.005 mM versus [Mg2+]rest = 0.163 ± 0.005 mM; p = 0.02, n = 9). Meanwhile, we also found that the intracellular ATP concentration of the brain tissue remained constant ([ATP]rest = 2.83 ± 0.16 mM versus [ATP]rest = 2.82 ±0.14 mM; p = 0.70, n = 9); and the metabolite concentration ratios of [Pi]/[ATP], [PCr]/[ATP] and [Pi]/[PCr] had no statistically significant changes during the visual stimulation (p = 0.14, 0.84 and 0.13, respectively, n = 9; see Table S1 for details).
The group averaged results of (a) intracellular pH (pHi) and (b) free magnesium concentrations ([Mg2+]) measured in activated human visual cortex under resting (light bars) and stimulated (dark bars) conditions (n = 9; mean ± SD; two-tailed paired t-test indicating significant differences detected comparing the two conditions with * p < 0.05 and *** p < 0.001, see also Table S1); and (c) their functional changes of individual subjects showing consistent increases in pHi and decreases in [Mg2+] (mM) during visual stimulation.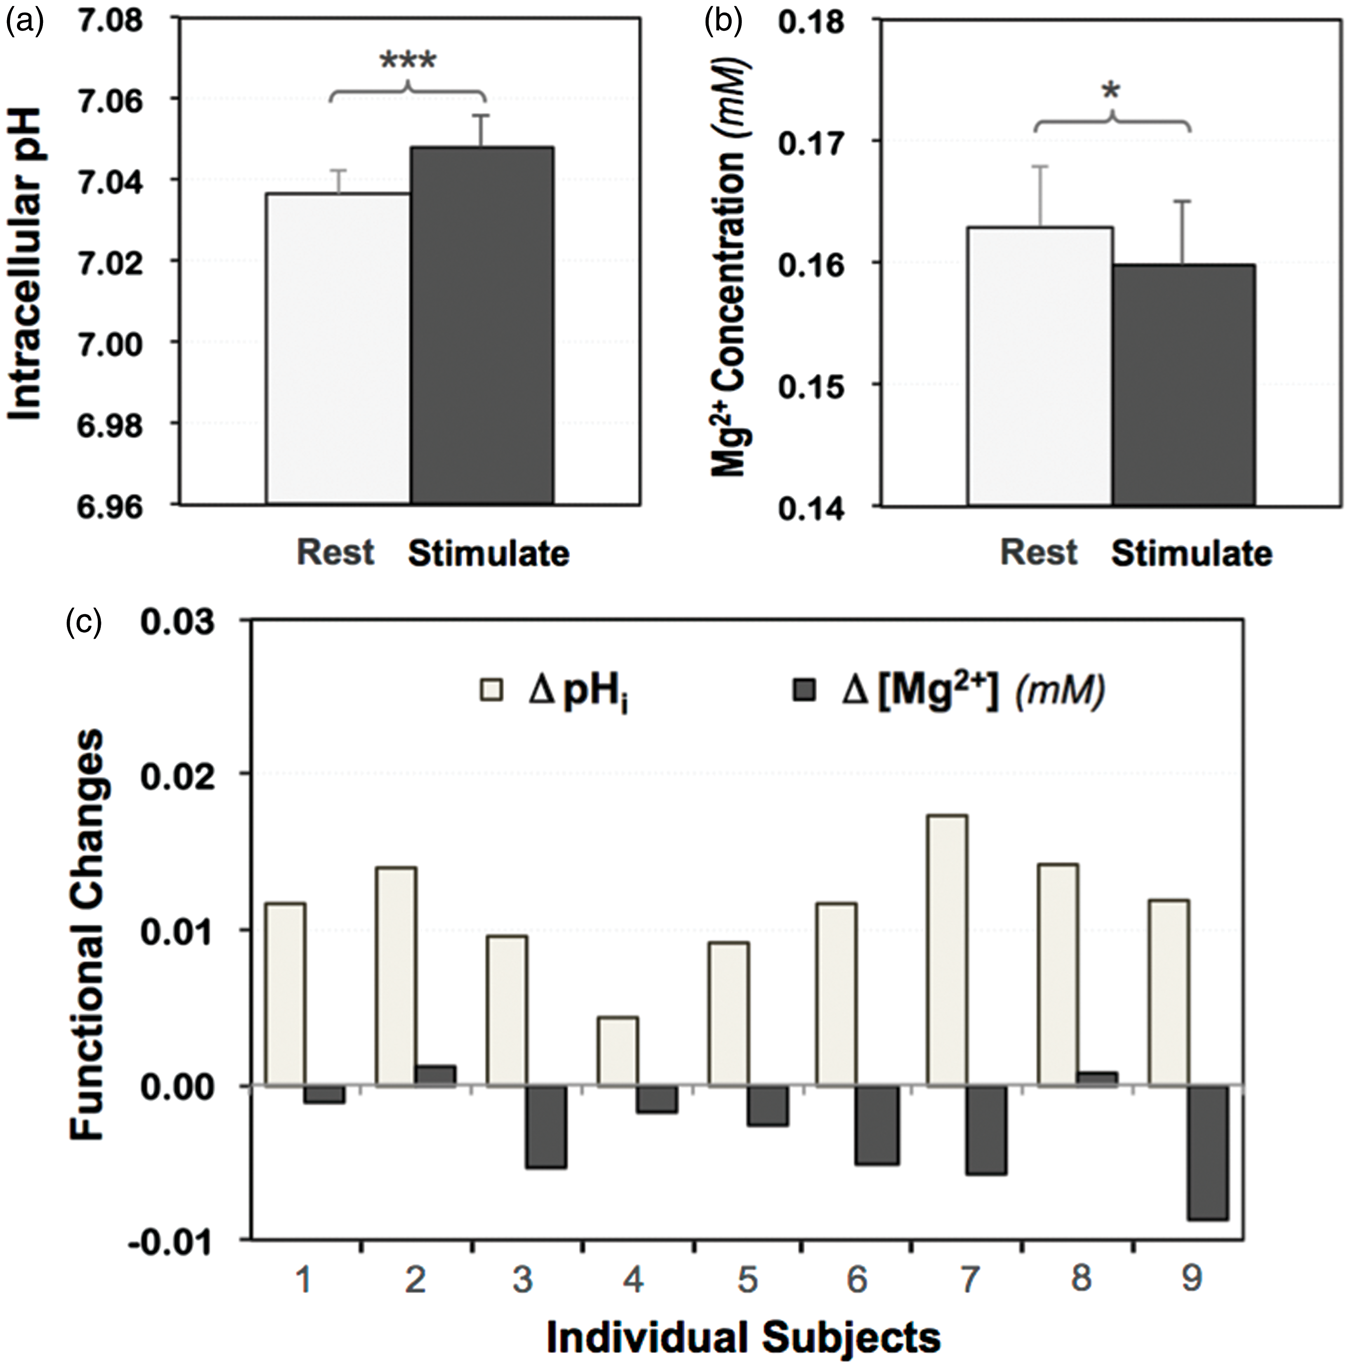
Discussion
ATP energy metabolism and regulation are essential cellular processes underlying basic brain function and neurophysiology, and their abnormality has been linked to various brain disorders and neurodegeneration.2–4,46,47 However, due to the technical difficulties, there has been a lack of non-invasive neuroimaging tools capable of providing quantitative neuroenergetic assessment, and a crucial understanding of the functional ATP energetic response and its impact on human brain health and function.
In the present work, we established an advanced neuro-metabolic-imaging technique for directly measuring the regional cerebral ATP metabolic rates and their functional changes in activated human visual cortex. The methodology involving protocol design, sensitivity and spectral quality enhancement, optimization of 3D 31P-MT imaging data acquisition at ultrahigh field and absolute quantification of brain phosphate contents and other physiological parameters has not only ensured the maximum SNR with adequate spatiotemporal resolution of the 31P-MT imaging data, but also enabled quantitative determination of key neuroenergetic parameters, which were presented in the absolute scale and standard units rather than in arbitrary units or relative scale commonly found in the literature. As a result, excellent 3D 31P-MT CSI data with SNRPCr > 70 and LWPCr ≈ 15 Hz were obtained with a 4 ml CSI voxel size within an 18 min sampling time; and the regional ATP metabolic rates, in particular the functional CMRATP change in the human brain were determined for the first time. Utilizing the advanced imaging approach, we were able to simultaneously measure an array of neuroenergetic and neurophysiological parameters for evaluating the cellular ATP energy status of the human brain under resting and activated conditions; the measured values represent the energetic properties of the brain tissue and they are independent of the MR scanner or magnetic field strength employed. Furthermore, the measured parameters including the concentrations of major phosphorous metabolites (e.g. ATP, PCr and Pi), the forward reaction rate constants and fluxes of the ATPase and CK reactions, the intracellular pH and free magnesium content ([Mg2+]) were independently derived from distinctive 31P resonances contained in the same 31P spectral data and/or based on different chemical exchange and enzyme reactions; therefore, they provide a comprehensive neuroenergetic assessment in the targeted brain region of interest.
Absolute metabolite quantification in vivo is an essential but practically demanding procedure, and conventional methods such as biochemical assay are not suitable for the human brain application. To date, only few 31P MRS studies reported molar concentrations of the phosphates in human brain with large variability among the reports.48–52 Our results of [ATP] = 2.8 mM, [PCr] = 4.3 mM and [Pi] = 1.0 mM rigorously determined in this study are in good agreement with surveyed literature values obtained in animal and human brains from both ex vivo and in vivo studies2,48–52; they should represent the actual cerebral phosphate contents of the healthy human brain. The measured forward rate constants of the ATPase (kf,ATPase = 0.15 s−1) and CK (kf,CK = 0.38 s−1) reactions reflect the corresponding enzyme activities at resting state; and the fluxes of FluxATPase = 8.1 µmol/g/min and FluxCK = 88.0 µmol/g/min represent the net rate of ATP production via these two reactions in the human visual cortical region dominated by the gray matter. Since the measurement of each 3D 31P-MT CSI dataset took about 18 min and presumably the brain activities had reached a new or pseudo steady state during the visual stimulation, the kf and flux values measured during the activation should reflect the sustained energetic state of a working human brain.
As shown in Figure 2, we detected significant increases of the ATPase enzyme activity (Δkf,ATPase =29%, p = 0.01, Figure 2(b)) and ATP production rate (ΔCMRATP = 31%, p = 0.004, Figure 2(c)) in activated human visual cortex during visual stimulation. This result indicates that the evoked neural activities were tightly associated with heightened ATP energy requirement or increased ATP consumption and were supported by elevated ATPase enzyme activity and ATP production rate. On the other hand, a smaller, but statistically significant increase in the CK enzyme activity (Δkf,CK = 5%, p = 0.04, Figure 2(e)) was also detected during the visual stimulation, though the increase of the CK metabolic flux (ΔCMRCK = 4%, p = 0.22) was statistically insignificant. These findings collectively attest that the mitochondrial ATPase reaction is the main driving force to produce additional ATP energy in supporting evoked neural activity during brain activation. Previous PET and in vivo MRS studies had reported about 50% higher glucose uptake, 5%–30% higher oxygen consumption and over 50% TCA cycle rate (VTCA) increases in activated animal and human brains,30–37 and the relative functional CMRATP change detected in this work (averaged increase ≈31%) is in the similar range of those reported CMRO2 and VTCA changes. However, it is important to note that the CMRATP value presents a direct and quantitative measure of the neuroenergetic state of the human brain. Even though the averaged percentage CMRATP increase is smaller than that of glucose uptake found in the human brain with similar visual stimulus, the notion that mitochondrial OXPHOS dominates the functional ATP energetic response still holds when taking into account the low efficiency of the ATP production via the cytosolic glycolysis: it produces only 2 ATPs per glucose versus over 30 ATPs that are generated via the mitochondrial oxidative phosphorylation pathway. We have reported earlier that, on average, a single neuron in the human brain utilizes 4.7 billion ATP molecules per second under resting condition, 21 thereby the observed 31% CMRATP increase in the present study implies an additional energy expenditure equivalent to 1.5 billions more ATP molecules per second per activated neuron in the human visual cortex used during the visual stimulation.
The mean values of the functional energetic changes reported herein were averaged across a small cohort of young and healthy participants (24.3 ± 5.0 years, n = 9). Surprisingly, the individual energetic responses to the same visual stimulus varied greatly among the subjects of similar age. As shown in Table S1, the variations of the relative changes ranged from −6% to 16% for Δ[Pi], 4% to 77% for Δkf,ATPase and −10% to 74% for ΔCMRATP; and −7% to 6% for Δ[PCr], −4% to 13% for Δkf,CK and −10% to 19% for ΔCMRCK in the subjects studied herein (n = 9). Considering the excellent in vivo 31P detection sensitivity and spectral quality achieved in the present study at 7 T, such large variances were unlikely caused by the measurement error since similar variations in Δ[Pi] and Δ[PCr] were observed, while the amplitude or SNR of the PCr signal was four-times larger than that of Pi. Moreover, the remarkable correlations of the functional rate constant and metabolic flux changes between the ATPase and CK reactions among individual subjects (Figure 3(c) to (e)) further support this view. Therefore, the possibility of the large individual variance caused by random distribution of the in vivo measurements or errors could be ruled out.
Interestingly, we found that Subjects #3 and #7, who showed the greatest increases in Δkf,ATPase and ΔCMRATP, had negative Δkf,CK and ΔCMRCK responses, whereas Subject #5, who happened to be the only one who showed a negative ΔCMRATP response to visual stimulation, had the largest positive ΔCMRCK in all participants (Figure 3(a) and (b) and Table S1). We also noticed that Subject #5 is the only participant who took an anti-depressant drug before the MR scan. Whether or not the unusual neuroenergetic response (i.e. negative ΔCMRATP response accompanying with large positive ΔCMRCK) observed in this particular subject was implicated by the medication will require further investigation; however, this interesting observation suggests that the in vivo 31P-MT imaging approach could be highly sensitive in detecting abnormal ATP energy metabolism in individuals with neurological disorder. Additionally, these results also underscore the importance of individual-based imaging and data analysis for understanding brain function in the perspective of neuroenergetics, which could be even more critical for the translational application and diagnosis dealing with individual patients. The varied functional ATP energetic responses among individual subjects as observed in this study may reflect the inherent variance in individual’s energetic capacity or efficiency when responding to the same visual stimulation since each person was born with a mitochondrial genotype that determines the degree of robustness in energy generation or the plasticity of energy transduction, which could be modified over the lifetime by environmental influence, disease or aging effect.1,15 What’s noteworthy is that the in vivo 31P-MT imaging method as presented herein might provide a valuable and sensitive neuroimaging tool for assessing such individual variance in healthy or diseased brains.
The strong negative correlations of the energetic responses associated with the ATPase and CK reactions across all subjects (Figure 3(c) to (e)) clearly demonstrate that both of the ATP synthesis reactions were actively involved in regulating the overall ATP metabolism to fulfill the heightened energy requirement during brain activation: the ATPase reaction dominated the ATP energy production and supply, and the CK reaction played complementary role in energy transportation and maintaining intracellular ATP homeostasis. Consequently, the cellular ATP concentration is anticipated to remain constant in normal human brain during the physiological stimulation, which was confirmed in this study. We had previously reported an equal intracellular ATP concentration across the human gray and white matters despite their three times CMRATP difference at resting state 21 ; and a stable ATP level in anesthetized rodent brain even when the neuronal activity was completely suppressed under the isoelectric state. 43 These findings collectively lead to the conclusion that efficient regulation of intracellular ATP homeostasis by dynamic adjustment of the ATP metabolic fluxes to effectively balance the mitochondrial ATP production and utilization should be a general phenomenon in healthy human brain, which forms the basis for understanding the underlying mechanism of neuroenergetics at different brain states.
In Figure 5(a), we propose a neuroenergetic model to describe the relationship between the baseline brain ATP energy levels and the relative functional neuroenergetic changes under different brain states (i.e. work, rest, or isoelectric state). These brain states are tightly linked to their neuroenergetic states, which reflect upon the mitochondrial ATPase activity and can be quantified by CMRATP. The baseline brain state and its associated ATP energetic state can influence the functional energetic response during the brain activation, while the intracellular ATP homeostasis is tightly regulated under varied brain states. The ability to increase cellular ATP energy production through mitochondrial OXPHOS in the working human brain varies from person to person; it may be limited by the high “dark” energy consumption at resting state
29
and the inherent maximum mitochondrial ATP energetic capacity; thus, the supportive role of the CK reaction becomes essential for maintaining the ATP homeostasis under higher ATP energy demanding condition. This explains the strong and negative correlation between the functional ΔCMRATP and ΔCMRCK found in this study (Figure 3(d) and (e)). The limited functional energetic response during intense neurological activity is also consistent with the relatively small CMRO2 and VTCA percentage changes observed in the conscious human visual cortex where a high baseline energetic state was anticipated.30,33 In contrast, the magnitude of the relative functional energetic change could become much larger in anesthetized brain with significantly lower baseline brain energetic level.
53
For example, we had reported paralleled CMRATP and CMRCK reductions in the rat brain under increased anesthesia depth
43
; a larger stimulus-induced ΔVTCA had been observed in anesthetized rodent brain as compared to the conscious human brain.31,32,53 We also observed an inverse relationship between the stimulus-induced ΔCMRO2 changes versus the baseline CMRO2 level in anesthetized cat visual cortex.
37
These seemingly discrepant results could be readily explained by the bioenergetic model derived from the new findings of the present study and supportive evidences in the literature. The unified bioenergetic model as illustrated in Figure 5(a) represents our current understanding of the functional ATP energetic regulation in normal brains at various states.
(a) A unified neuroenergetic model describes the relationship between the baseline brain ATP energy levels and the relative functional neuroenergetic changes under different brain states. This relationship obeys a fundamental principle: to provide necessary ATP energy in supporting evoked neuronal activity and neural signaling while tightly maintaining the intracellular ATP homeostasis. Within the maximum energetic capacity, the baseline CMRATP level determines the functional change of the ATP production rate (ΔCMRATP) in response to physiological stimulation. (b) Schematic illustration of complex and coherent changes of ATPase activity, ATP production rate (CMRATP), intracellular pH and free [Mg2+] in response to brain stimulation.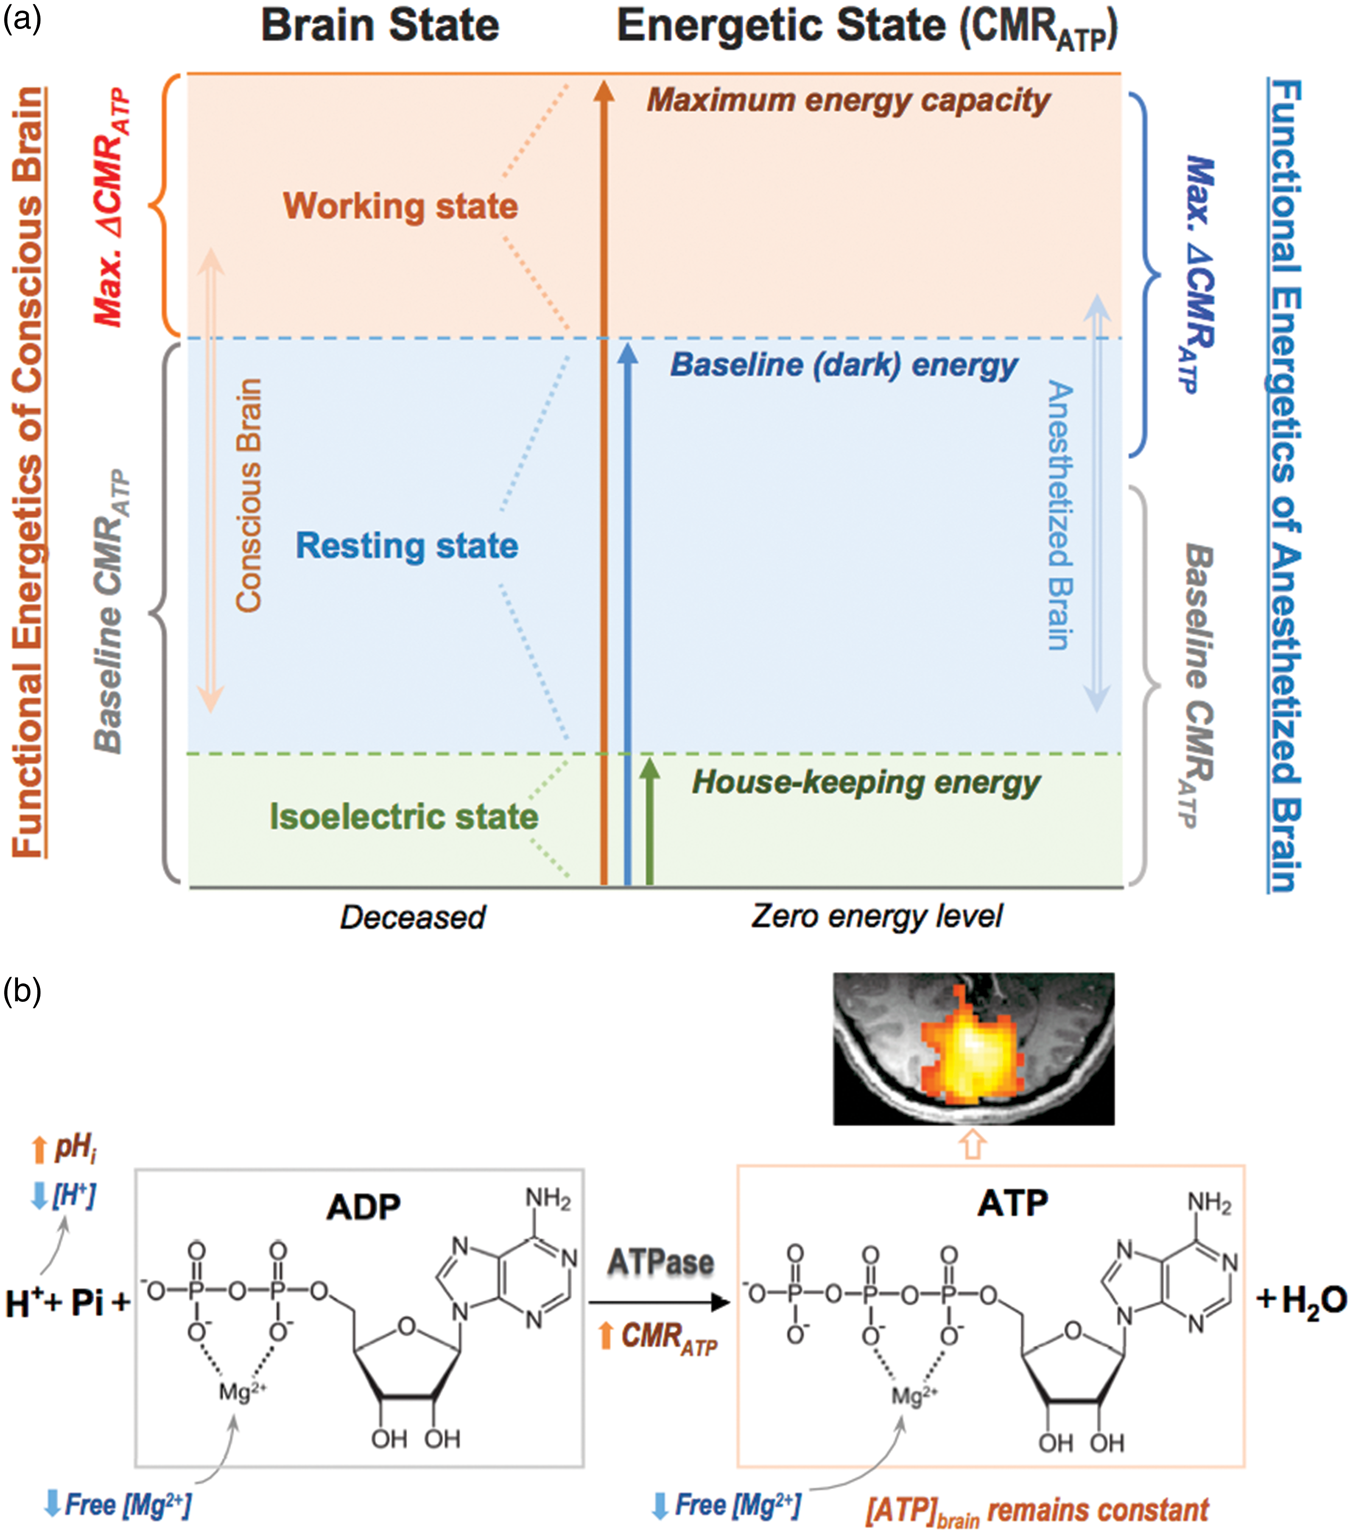
The intracellular ATP concentration in the human brain is low (2.8 mM, Table S1); this implies approximately 2 g for the total ATP content in the entire human brain, assuming an average adult brain weight of 1.4 kg. In contrast, the oxidative ATP synthesis rate through the F1F0-ATPase reaction (i.e. CMRATP) in resting human brain is very high (8.1 µmole/g/min, Table S1); it implies that over 8.3 kg of ATP molecules (on average) could be synthesized and utilized by a healthy human brain in a single day (about six times its own weight), which dominates the brain’s “dark energy” (an astrophysics analogy of the dark matter) in supporting spontaneous neuronal activity and basic brain function. 29 The dark energy of the universe based on the dark matter hypothesis may be the deepest mystery in cosmology and astrophysics54,55; nevertheless, the human brain “dark energy” can be quantitatively measured and investigated, as demonstrated in this study, which can vary under pathological, neurodegenerative or anesthetic conditions. For instance, the mitochondrial function gradually declines during normal aging,56,57 and it is crucial to study and understand the age-related changes in baseline and functional CMRATP.
Brain function and neuronal activity are sensitive to the cellular environment and the H+ homeostasis. Intracellular pH (pHi) is an important physiological parameter representing the H+ ion concentration inside the cell, which is actively maintained and tightly regulated by a number of acid-base-coupled ion and metabolite transporters located on the brain cell membranes to balance the rates of acid loading and extrusion.58,59 The electrochemical gradient created by the H+ ion concentration difference across the mitochondrial membrane also plays a key role in ATP synthesis. 60 Evoked neuronal activity could induce a change in pHi due to altered metabolic processes, ion exchange and enzyme activities. To assess pHi and its change in healthy human brain, in vivo 31P MRS is probably the only well-established and non-destructive imaging technique available to date. 61 Owing to higher 31P spectral resolution and minimal contamination from the background phosphate lipids signals at ultrahigh field, the pHi measurement accuracy is substantially improved. Our result of pHi = 7.04 obtained in the resting-state human visual cortex agrees well with that previously measured in the gray matter dominated human brain tissue. 21 Importantly, a small but statistically significant pHi increase detected in the activated human visual cortex under sustained visual stimulation (ΔpH ≈ 0.01, p < 0.001) indicates an alkaline shift of the cellular environment, where the increased acid extrusion rather than reducing the acid loading may occur in the activated brain cells.59,62 In addition, the elevated ATP production during the visual stimulation could utilize more proton ions (Figure 5(b)) and lead to a lower intracellular [H+], thus, a higher pHi as reliably observed in the present study. This finding suggests a critical role of the intracellular pH in brain activation and a tight link between the pHi and the neuroenergetic status. Furthermore, we detected a statistically significant reduction of the intracellular free [Mg2+] in the human visual cortex during the visual stimulation. This is consistent with the elevated ATP synthesis rate and enzyme activity since more ATP and ADP molecules are anticipated to bind with Mg2+ in the activated neurons and/or astrocytes, 63 which could reduce the free [Mg2+] in these cells. As summarized in Figure 5(b), the pHi and [Mg2+] reductions could facilitate elevated ATP production to support evoked neural activity during the visual stimulation. These physiological responses and cellular processes are highly synchronized in the brain to fulfill two critical functions: to provide necessary ATP energy in supporting the neuronal activity while at the same time regulating and maintaining ATP homeostasis.
In contrast to the robust and highly dynamic functional responses of the ATP metabolic rates (or enzyme activities) and reliably detected intracellular pH and free [Mg2+] changes, the alterations in the brain high-energy phosphates concentration or their ratios were statistically insignificant (Table S1), suggesting that these parameters are not sensitive to the brain activation owing to the highly effective energetic regulation in human brain under normal physiological conditions. On the other hand, they could alter substantially under pathological conditions due to energetic impairment or deficiency (e.g. in ischemic stroke) and thus could serve as important biomarkers of neurological disorder and disease progression.
In summary, this study demonstrates, for the first time, that an array of independent neuroenergetic and neurophysiological parameters, in particular the CMRATP, representing the regional neuroenergetic state of the individual human brain could be reliably measured and quantified using the in vivo 31P-MT imaging technique at 7T under resting and activated conditions. The directly determined energetic parameters and their functional responses provide comprehensive yet complementary information that is highly valuable for investigating and understanding the fundamental neuroenergetics in healthy human brain. The overall findings present clear evidences showing the central roles of cerebral ATP metabolism in supporting the elevated neural activity during a physiological stimulation. The methodology and protocol described in this work could be applied to quantitatively assess neuroenergetic status and alterations of the human brain under various physiopathological conditions, or to monitor the progression and treatment efficacy in individual patients with brain disorders.
Supplemental Material
Supplemental material for Functional energetic responses and individual variance of the human brain revealed by quantitative imaging of adenosine triphosphate production rates
Supplemental material for Functional energetic responses and individual variance of the human brain revealed by quantitative imaging of adenosine triphosphate production rates by Xiao-Hong Zhu, Byeong-Yeul Lee and Wei Chen in Journal of Cerebral Blood Flow & Metabolism
Footnotes
Funding
The authors disclosed receipt of the following financial support for the research, authorship, and/or publication of this article: This work was supported in part by NIH grants: R01 NS041262, NS057560, NS070839 and MH111413, R24 MH106049, P41 EB015894, P30 NS5076408; and the W.M. Keck Foundation.
Declaration of conflicting interests
The author(s) declared no potential conflicts of interest with respect to the research, authorship, and/or publication of this article.
Authors’ contributions
X-HZ and WC devised and initiated the study; B-YL and X-HZ performed the experiments and analyzed data; X-HZ and WC wrote the manuscript.
References
Supplementary Material
Please find the following supplemental material available below.
For Open Access articles published under a Creative Commons License, all supplemental material carries the same license as the article it is associated with.
For non-Open Access articles published, all supplemental material carries a non-exclusive license, and permission requests for re-use of supplemental material or any part of supplemental material shall be sent directly to the copyright owner as specified in the copyright notice associated with the article.