
Abstract
Binswanger’s disease is a form of subcortical ischemic vascular disease (SIVD-BD) with extensive white matter changes. To test the hypothesis that biomarkers could improve classification of SIVD-BD, we recruited 62 vascular cognitive impairment and dementia (VCID) patients. Multimodal biomarkers were collected at entry into the study based on clinical and neuropsychological testing, multimodal magnetic resonance imaging (MRI), and cerebrospinal fluid (CSF) analysis. The patients’ diagnoses were confirmed by long-term follow-up, and they formed a “training set” to test classification methods, including (1) subcortical ischemic vascular disease score (SIVDS), (2) exploratory factor analysis (EFA), (3) logistic regression (LR), and (4) random forest (RF). A subsequently recruited cohort of 43 VCID patients with provisional diagnoses were used as a “test” set to calculate the probability of SIVD-BD based on biomarkers obtained at entry. We found that N-acetylaspartate (NAA) on proton magnetic resonance spectroscopy (1H-MRS) was the best variable for classification, followed by matrix metalloproteinase-2 in CSF and blood–brain barrier permeability on MRI. Both LR and RF performed better in diagnosing SIVD-BD than either EFA or SIVDS. Two-year follow-up of provisional diagnosis patients confirmed the accuracy of statistically derived classifications. We propose that biomarker-based classification methods could diagnose SIVD-BD patients earlier, facilitating clinical trials.
Keywords
Introduction
Vascular cognitive impairment and dementia (VCID) is a major cause of dementia for which treatment trials have been impeded by the diversity of pathological processes.1–3 Vascular diseases involving both large and small vessels produce a heterogeneous group of patients.4,5 While treatment of VCID due to large vessel strokes is complicated by the sporadic nature of multiple strokes, small vessel disease (SVD) produces subcortical ischemic vascular disease (SIVD), which generally has a progressive course, allowing for identification of the natural history. More importantly, SVD injures white matter, which can be observed on MRI as growth of white matter hyperintensities (WMHs). This growth in lesion size along with a decline in neuropsychological test scores can be used to both follow disease progression and as surrogate markers for treatment effects.
The mechanism of hypertension-induced SVD, the main vascular risk factor for SIVD, while difficult to determine in humans, can be extrapolated from extensive animal studies.6,7 Hypertension narrows the blood vessel lumen, restricting blood flow, and leads to fibrosis of the vessel outer wall; reduced cerebral blood flow leads to hypoxia, while the fibrotic vessel wall stimulates a neuroinflammatory response.8,9 Activated microglia and recruited inflammatory cells release proteases, including matrix metalloproteinases (MMPs) and free radicals. Proteases from activated microglia/macrophage have a dual effect that contributes to the pathology of SIVD-BD: the MMPs disrupt the blood–brain barrier (BBB) and break down the myelin surrounding the axons. 6 Clinically, the damage to the white matter produces a characteristic syndrome, involving hyperreflexia, gait imbalance, incontinence, apathy, and executive dysfunction. Biomarkers obtained from clinical and neuropsychological examination, along with cerebrospinal fluid (CSF), and imaging studies can be used to classify patients into SIVD-BD and other diagnoses (OD). Because SIVD-BD of the multiple forms of VCID has a progressive course, it is considered to be the optimal form for treatment trials.10–15
Pathological changes in the brain are reflected in imaging and cerebrospinal fluid (CSF) studies. Dynamic contrast-enhanced MRI (DCEMRI) shows disruption of the BBB, indicating sites of inflammation. Structural damage can be quantified by fluid attenuated inversion recovery (FLAIR) MRI, diffusion tensor imaging (DTI), and proton magnetic resonance spectroscopy (1H-MRS). Inflammation also leads to changes in CSF, including an increase in albumin and MMPs. SIVD-BD is a spectrum disorder, and none of the biomarkers alone is sufficient to make that diagnosis. Furthermore, SIVD-BD has symptoms that overlap in the early stages with other neurodegenerative diseases, 16 increasing the need to combine multiple biomarkers for improved diagnostic accuracy.
We collected multi-modal biomarkers on patients with suspected VCID at the time of entry into the study. Diagnoses were made after follow-up for one or more years. We hypothesized that while a clinical diagnosis is difficult to make in the early stages due to overlapping diagnoses, a set of biomarkers collected at entry could accurately predict the final diagnoses. Biomarkers fell into three categories: (1) clinical examination and neuropsychological testing; (2) structural and functional damage based on MRI; and (3) CSF biochemistry. The diagnoses made after follow-up without knowledge of the results of the initial biomarkers were: (1) multiple or single strategic infarcts (MI), including lacunar infarcts limited to the basal ganglia; (2) SIVD of the Binswanger type (SIVD-BD) based on diffuse white matter (WM) involvement on MRI associated with imbalance, hyperreflexia, and executive dysfunction; (3) WMHs of uncertain etiology or leukoaraiosis (LA); and (4) Alzheimer’s disease (AD) based on clinical findings, CSF proteins and neuropsychological test results. Small vessel disease can take several forms, including WMHs with axonal damage in SIVD-BD, lacunar infarcts isolated to the basal ganglia, and changes of aging. To distinguish between these, we have used the term SIVD-BD to indicate extensive WMHs with or without lacunes, isolated lacunar infarcts in the basal ganglia were grouped with multiple infarcts (MI), and WMHs of unknown etiology, possibly related to aging were called leukoaraiosis (LA). 17
In an earlier study, we used a 10-point heuristic subcortical ischemic vascular disease score (SIVDS) based on multiple biomarkers to classify VCID patients. 18 The earlier cohort of patients that had long-term follow-up formed a training set, and another group that were subsequently recruited formed a provisional diagnosis or test set. Diagnoses for the training set were made clinically after long-term follow up without the aid of the biomarkers that were being tested. However, these results were not cross-validated and thus overoptimistic. In this report we compare four statistical classification methods, using 16 biomarkers to estimate the probability that an individual patient belongs in the SIVD-BD group versus the OD group. In addition to the SIVDS, the statistical methods include: (1) exploratory factor analysis (EFA), (2) logistical regression (LR), and (3) a machine learning algorithm called random forest (RF).19–21 The SIVDS used in the earlier report included 10 features with a point system for making the SIVD-BD diagnosis. EFA groups the biomarkers into factors. LR uses multiple factors simultaneously to classify according to features. RF uses a set of “trees” to vote whether an individual is in the SIVD-BD class. In this report, we compared the diagnostic accuracy of the four methods for prediction of the SIVD-BD diagnosis in the test patients, and have followed some of the test patients long enough to check the accuracy of the test patient diagnoses.
Methods
Established diagnosis dataset
Fifty-two of the 62 patients with suspected VCID that were recruited from 2006 to 2010 had sufficient information to be included in the training set for statistical prediction (Figure 1). Patients were seen in the Neurology Clinics at the University of New Mexico Hospital and Albuquerque Veterans Medical Center. The University of New Mexico Human Research Review Committee approved the study, which followed the ethical standards for human experimentation.
Consort diagram of numbers of established patients used for training the classifiers, and the number of provisional patients to be classified.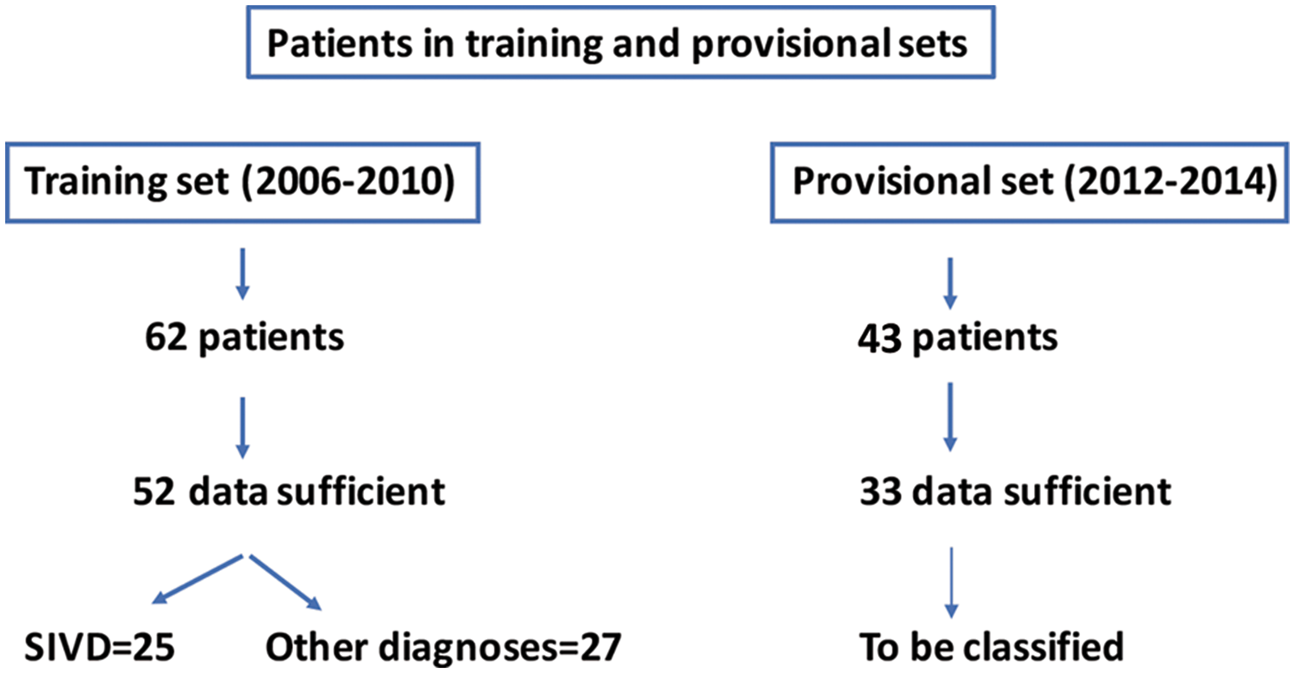
Left side of table: Demographics and clinical factors for the patients based on clinical consensus diagnoses separated into the two diagnostic categories (percentages for categorical features, median, and interquartile range for numeric features, with Kruskal–Wallis p-value of one-variable group differences rounded to the nearest thousandth), as well as the provisional patients to be classified. Right side of table: Classification methods and features used by each to select patients most likely to have SIVD-BD.
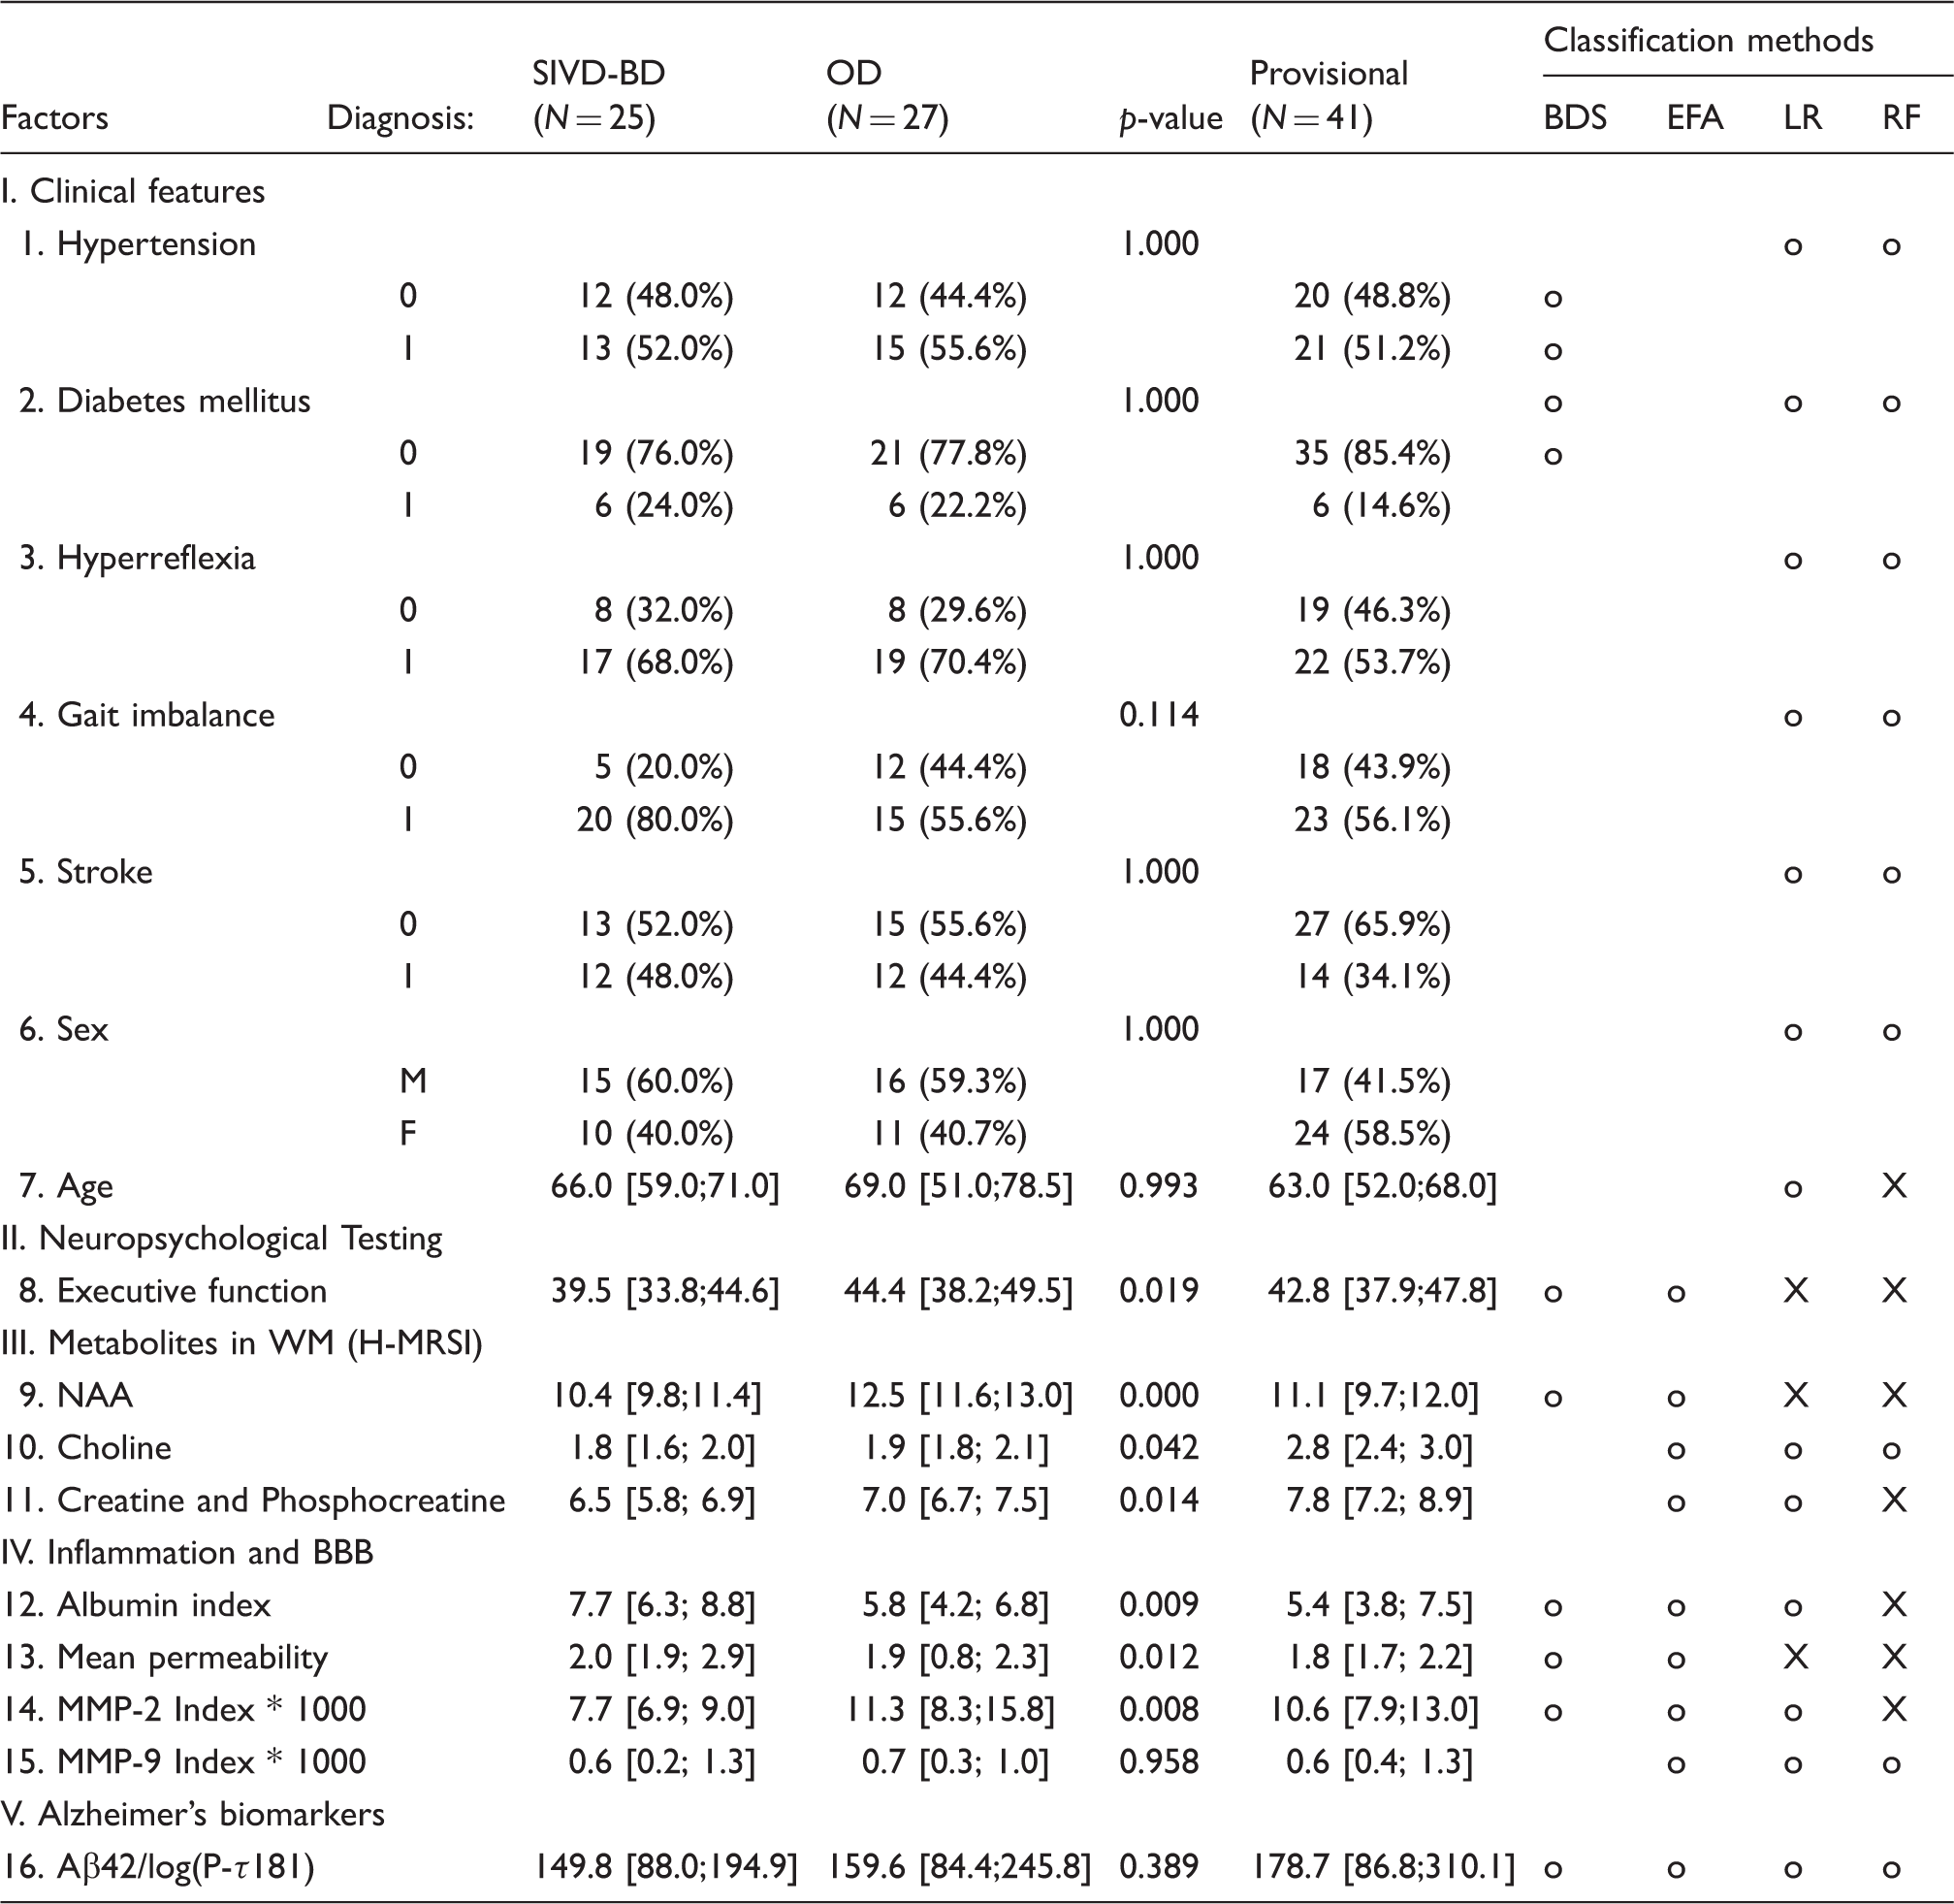
o=used, X=used and found to be “important”.
SIVD-BD: subcortical ischemic vascular disease of the Binswanger’s type; OD: other diagnosis; WM: white matter; NAA: N-acetyl-containing compounds and N-acetylglutamy; BBB: blood–brain barrier; MMP: matrix metalloproteins.
All patients underwent neurological examination, standard neuropsychological tests, MRI, venipuncture for blood and lumbar puncture to obtain CSF. Thirty-eight patients were available for follow up for at least one year.
Provisional diagnosis dataset
Thirty-three of a second cohort of 43 patients with suspected VCID recruited from 2012 to 2014 that had sufficient data formed the “provisional diagnosis” dataset. They underwent the same tests as the established diagnosis patients, except all of the MRI studies prior to 2011 were done on a 1.5 T MRI (Siemens Corp.), and those after 2011 were on a 3 T MRI (Siemens Corp.).
Since patients in both the training and test sets underwent the exact same biomarker determinations at the time of their entry into the study, we eliminated any bias in the test set due to entry at a later time.
Neuropsychological test batteries
Cognitive tests were administered by trained research psychologists and scored according to standard procedures. Averaged composite T-scores were calculated for each test. Averaged composite T-scores were calculated for four cognitive domains: memory, executive function, attention and language. Tests for each domain included: memory (Hopkins Verbal Learning Test-Delay, Rey Complex Figure Test-Long Delay), executive function (Digit Span Backwards, Trail Making Test B, Wisconsin Card Sorting-Total errors), attention (Digit Span Forward, and Trial Making Test A), and language (Boston Naming 60 item test, Controlled Oral Word Association (FAS)). An overall cognitive composite score was derived as the mean of individual domain T-scores. Control participants for the MRI studies underwent the same neuropsychological test battery.
Magnetic resonance studies
Proton magnetic resonance spectroscopy imaging (1H-MRSI) was performed on a 1.5 T when the study began and subsequently switched after the purchase of a 3.0 T MRI scanner (Siemens Corp.). Both scanners were used to collect phase-encoded version of a point-resolved spectroscopy sequence (PRESS) with or without water pre-saturation (TR/TE = 1500/135 ms, FOV=220 × 220 mm2, slice thickness=15 mm, circular k-space sampling (radius = 24), total scan time = 9 min 42 s). The WM concentrations of total N-acetyl-containing compounds (NAA and N-acetylglutamylaspartate, together referred to as NAA), choline-containing metabolites (CHO), and creatine + phosphocreatine (CR) are reported. 22
MR BBB measurements were performed with dynamic contrast-enhanced MRI (DCEMRI), using gadolinium-diethylenetriaminepentaacetic acid (Gd-DTPA; Magnevist, Bayer Corp.), as previously described. 23 Briefly, MRI investigation was performed using a 1.5 - or 3-Tesla Siemens whole-body clinical scanner with a standard 8-channel array head coil (Siemens AG, Erlangen, Germany). The MRI protocol consisted of anatomic and contrast-enhanced sequences with Gd-DTPA contrast (Bayer Corp). One T1 map was acquired before Gd-DTPA injection and the rest were sampled post injection resulting in a two-dimensional time series data set of MR images. We used a quarter dose of Gd-DTPA, which provided sufficient washout curves. Plasma levels of Gd-DTPA that are used in the Patlak graphical method of permeability calculation were sampled from the sagittal sinus. We calculated the rate at which the contrast agent passed from the vascular compartment into the tissue compartment permeability transfer constant, Ki, using the Patlak formulation of tracer leakage. Permeability measurements were made in the white matter.
FLAIR and spectroscopic results were similar on the two MRI scanners, and were combined.
Biomarkers in CSF and blood
Routine measurements of glucose, cells and protein were done on all CSF samples. Multiple sclerosis was ruled out by measuring immunoglobulin G index, myelin basic protein, and oligoclonal bands in the CSF. The inflammatory biomarkers, matrix metalloproteinases-2 (MMP-2) and MMP-9 were measured in the CSF and plasma by gelatin-substrate zymography, and MMP-2 and MMP-9 indexes were calculated as is done for IgG index in the multiple sclerosis panel, using albumin in both CSF and blood to account for transfer of MMPs from blood to brain.24,25 Measurements of AD proteins, amyloidβ1-42 (Aβ42) and phosphoTau181 (PTau) were made using assay kits (INNO-BIA AlzBio3, Innogenetics, Gent, Belgium) with the LUMINEX instrument (Luminex Corp. Austin, TX) in a laboratory that was part of the AD consortium.
Classification methods
Binswanger’s disease score
SIVDS was calculated from a heuristic combination of 10 clinical, imaging, and CSF features to indicate the likelihood that patients with clinical symptoms may have SIVD-BD. 18 The ten items used in the original SIVDS are shown in Table 1. The SIVDS ranges from 0 to 10, with 10 indicating the highest expression of characteristics that are associated with SIVD-BD; this is similar to the Delphi method as it is based exclusively on literature and expert opinion.
Logistic regression
LR is a generalized linear modeling approach that fits a regression model for the binary categorical response variable (SIVD-BD versus OD) from the predictors list in Table 1; this method, while it is both familiar and interpretable, is susceptible to overfitting. 26 Logistic regression was performed in R software using the standard package “stats” function “glm” with option “family=binomial(link=logit)”.
Exploratory factor analysis
EFA is a variable reduction technique used with high-dimensional data. EFA produces a reduced set of latent “factors”, which are linear combinations of the predictors listed in Table 1. 18 These factors are then used in place of the original predictors in a logistic regression for SIVD-BD versus OD. This was run using the R statistical program.
Random forests
RF is a supervised ensemble learning algorithm that is based on classification trees.27,28 Many classification trees (a “forest”) are fit on bootstrapped samples of the original data. Each tree partitions the data based on a random subset of predictor variables in such a way as to try to get optimal separation between the SIVD-BD and OD groups. RF provides a measure of variable importance for prediction accuracy, as well the marginal probability of group identity for values of each variable, and does not overfit. Furthermore, RF can perform multiclass prediction (which could include AD as a third group), automatically employs external cross-validation by predicting a patient diagnosis based on trees estimated without that patient, does not have restrictive distributional model assumptions, and is easy to implement. RF was performed in R software using package “randomForestSRC” function “rfsrc” with 5000 trees. 29
Cross-validation
CV was used with LR, EFA, and RF. The goal of CV is to provide a realistic measure of classification accuracy when predicting new observations by “training” a model on a large subset and comparing the model predictions against the true labels in the small “test” subset. In RF, each tree is constructed from a bootstrap resample of the data, thus roughly one-third of the cases are left out of each tree. To make the EFA and LR comparable, we used 10-fold CV, where the data are partitioned into 10 roughly equal sized subsets and the observations in each subset are predicted conditional on the model built on the other combined subsets.
Classification error
Classification accuracy depends on how separable the groups are conditional on the features analyzed, as well as the algorithm used and the asymptotic probability of misclassification. As the sample size increases, the asymptotic probability of misclassification decreases to a fixed amount. For example, a sample of about 50 is needed for the asymptotic misclassification to be within 9% of convergence if using a standard linear discriminant function (a weaker classifier than RF) with five parameters and a distance between means of 1.8 standard deviations. For our stronger RF classifier with 16 parameters, our model is within 10% of convergence, which is a small contribution to misclassification relative to the similarity of the SIVD-BD and OD groups being classified. 30
Imputing missing values
For some patients, there were some missing values for the variables listed in Table 1. Over all patients and variables, the SIVD-BD group had 4% values missing, the OD group had 7%, and the Provisional group had 13%, with the most common missing features being the Alzheimer’s Biomarkers, followed by the Inflammation and BBB features, and finally NAA by 1H-MRS features. To impute (predict) these missing values to have full data records for each patient, a robust non-parametric missing value imputation strategy for mixed-type data was used. 31 We first imputed data for the SIVD-BD and OD groups, then the Provisional group using the R package “missForest” function.
Statistical analysis
All analyses were carried out using R 3.4.0 with extensive use of the ggplot2 package for visualization.32,33
Results
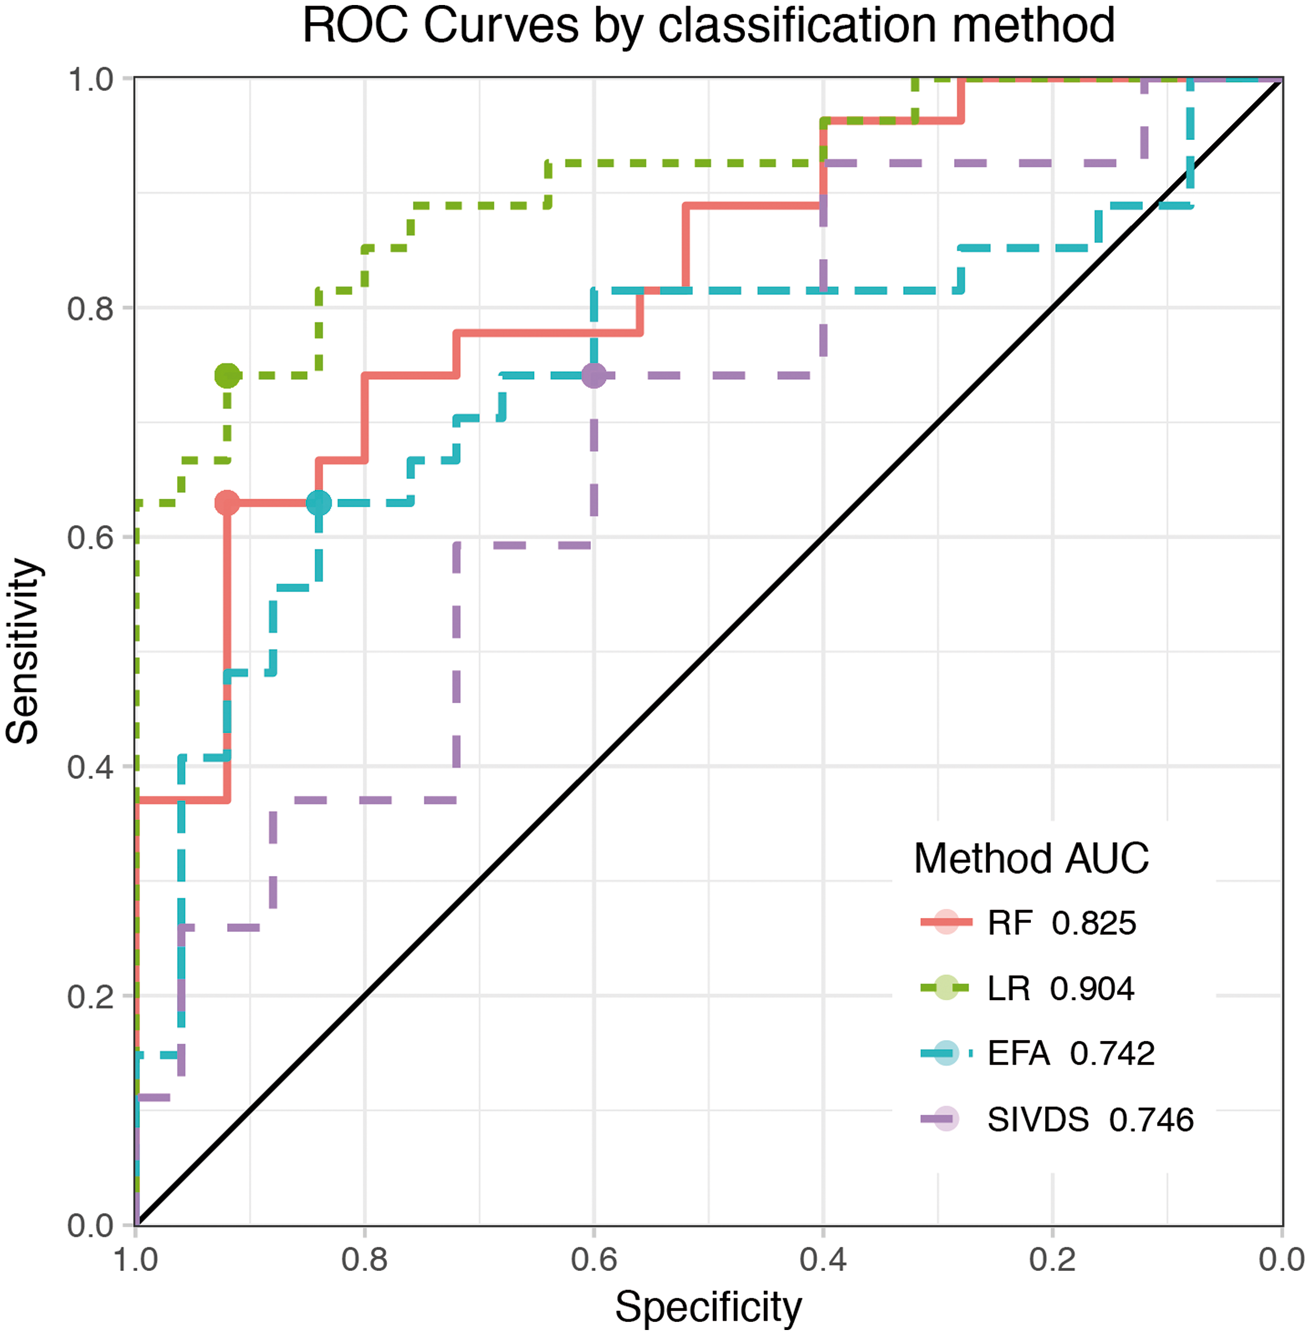
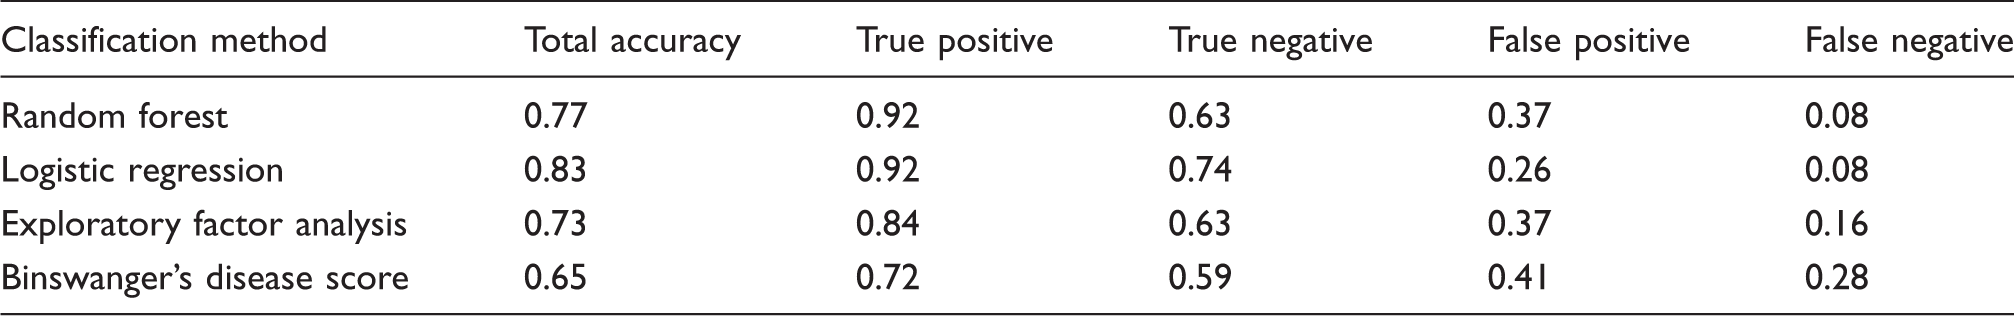
Comparing the classification accuracy of SIVDS, LR, EFA, and RF methods on the established diagnosis patients, we found that RF and LR are the two best methods (Figure 2). Prediction accuracy for the SIVD-BD class was superior to those diagnosed with one of the other diagnoses (OD), which were a heterogeneous group of patients. To determine the optimal cutoff value for classification with each method, ROC curves were used (Figure 3), and the resulting summary of method performance is in Table 2.
Classification accuracy comparison. A visual representation of the classification “confusion matrices” for each classification method. Results are based on external predictions. Green represents the proportion of patients correctly predicted to be either SIVD-BD or OD. ROC curve comparison. The ROC curves summarize the predictive ability for a range of thresholds by plotting sensitivity (y-axis) versus the specificity (x-axis) for each method. They can be used to assess classification ability, using the area under the curve (AUC) indicated in the legend inlay. A perfectly predicting model would have an AUC of 1 while a coin flip would have an AUC of 0.5 (the diagonal reference line represents 0.5). Note that the results here are based on external cross-validation, to be comparable to RF which always uses external predictions. Each point on the ROC curve corresponds to a potential Probability of SIVD-BD threshold for prediction, and the optimal threshold is the one corresponding to the top-left most point on the ROC curve. Summaries of classification at the optimal thresholds were provided in Figure 2. ROC summary of external prediction accuracy rates by method for the optimal threshold.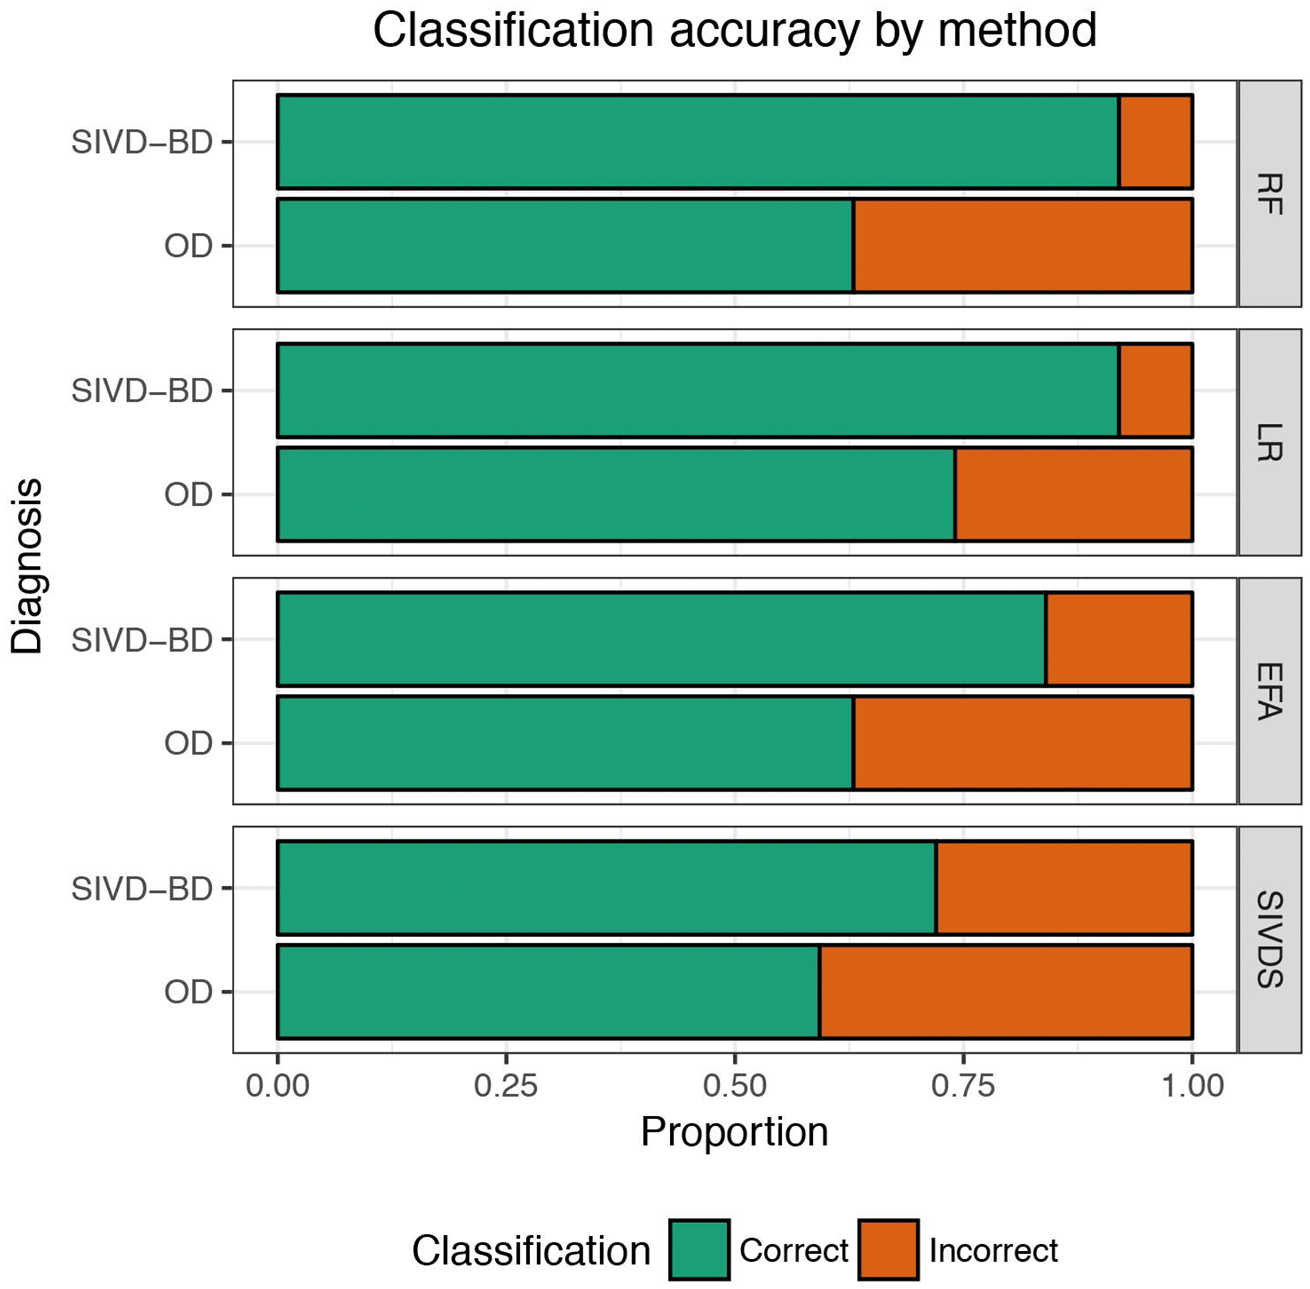
Using the SIVDS method, the characteristics most common to those with SIVD-BD were: Mean Permeability = 1 (92%), MMP2 Index < 0.01 (84%), Gait Imbalance = 1 (80%), Executive Function < 45 (76%), AB42/logPTau > 150 (76%), Hyperreflexia = 1 (68%), and Albumin Index > 6 (68%) (Supplemental Table 1).
The LR model was reduced from the full model with the original 16 predictors to a reduced model via stepwise selection using the Bayesian information criterion (BIC), a metric that balances model fit (with the deviance) and parsimony (with a penalty that increases with the number of predictors). 34 The reduced logistic model, which did not show deviance lack-of-fit (p = 0.8) included only three predictors: executive function, NAA, and mean permeability. Interpretation of logistic model coefficients is on the scale of the log-odds of having SIVD-BD, a monotonic transformation of Pr(SIVD-BD). For example, for each unit increase in NAA, we expect a -0.93 increase in the log-odds of SIVD-BD holding the other predictors constant (Supplemental Table 2), in other words, the probability of SIVD-BD decreases as NAA increases.
EFA extracted four factors from nine variables. Factor loadings range from −1 to 1 with high positive values indicative that high values of the observed variable are related to high values of the factor, while high negative values indicate that low values of that observed variable are related to high values of the factor, and values close to 0 indicate the variable contributes little to that factor (Supplemental Table 3). The EFA logistic regression also did not show deviance lack-of-fit (p = 0.23).
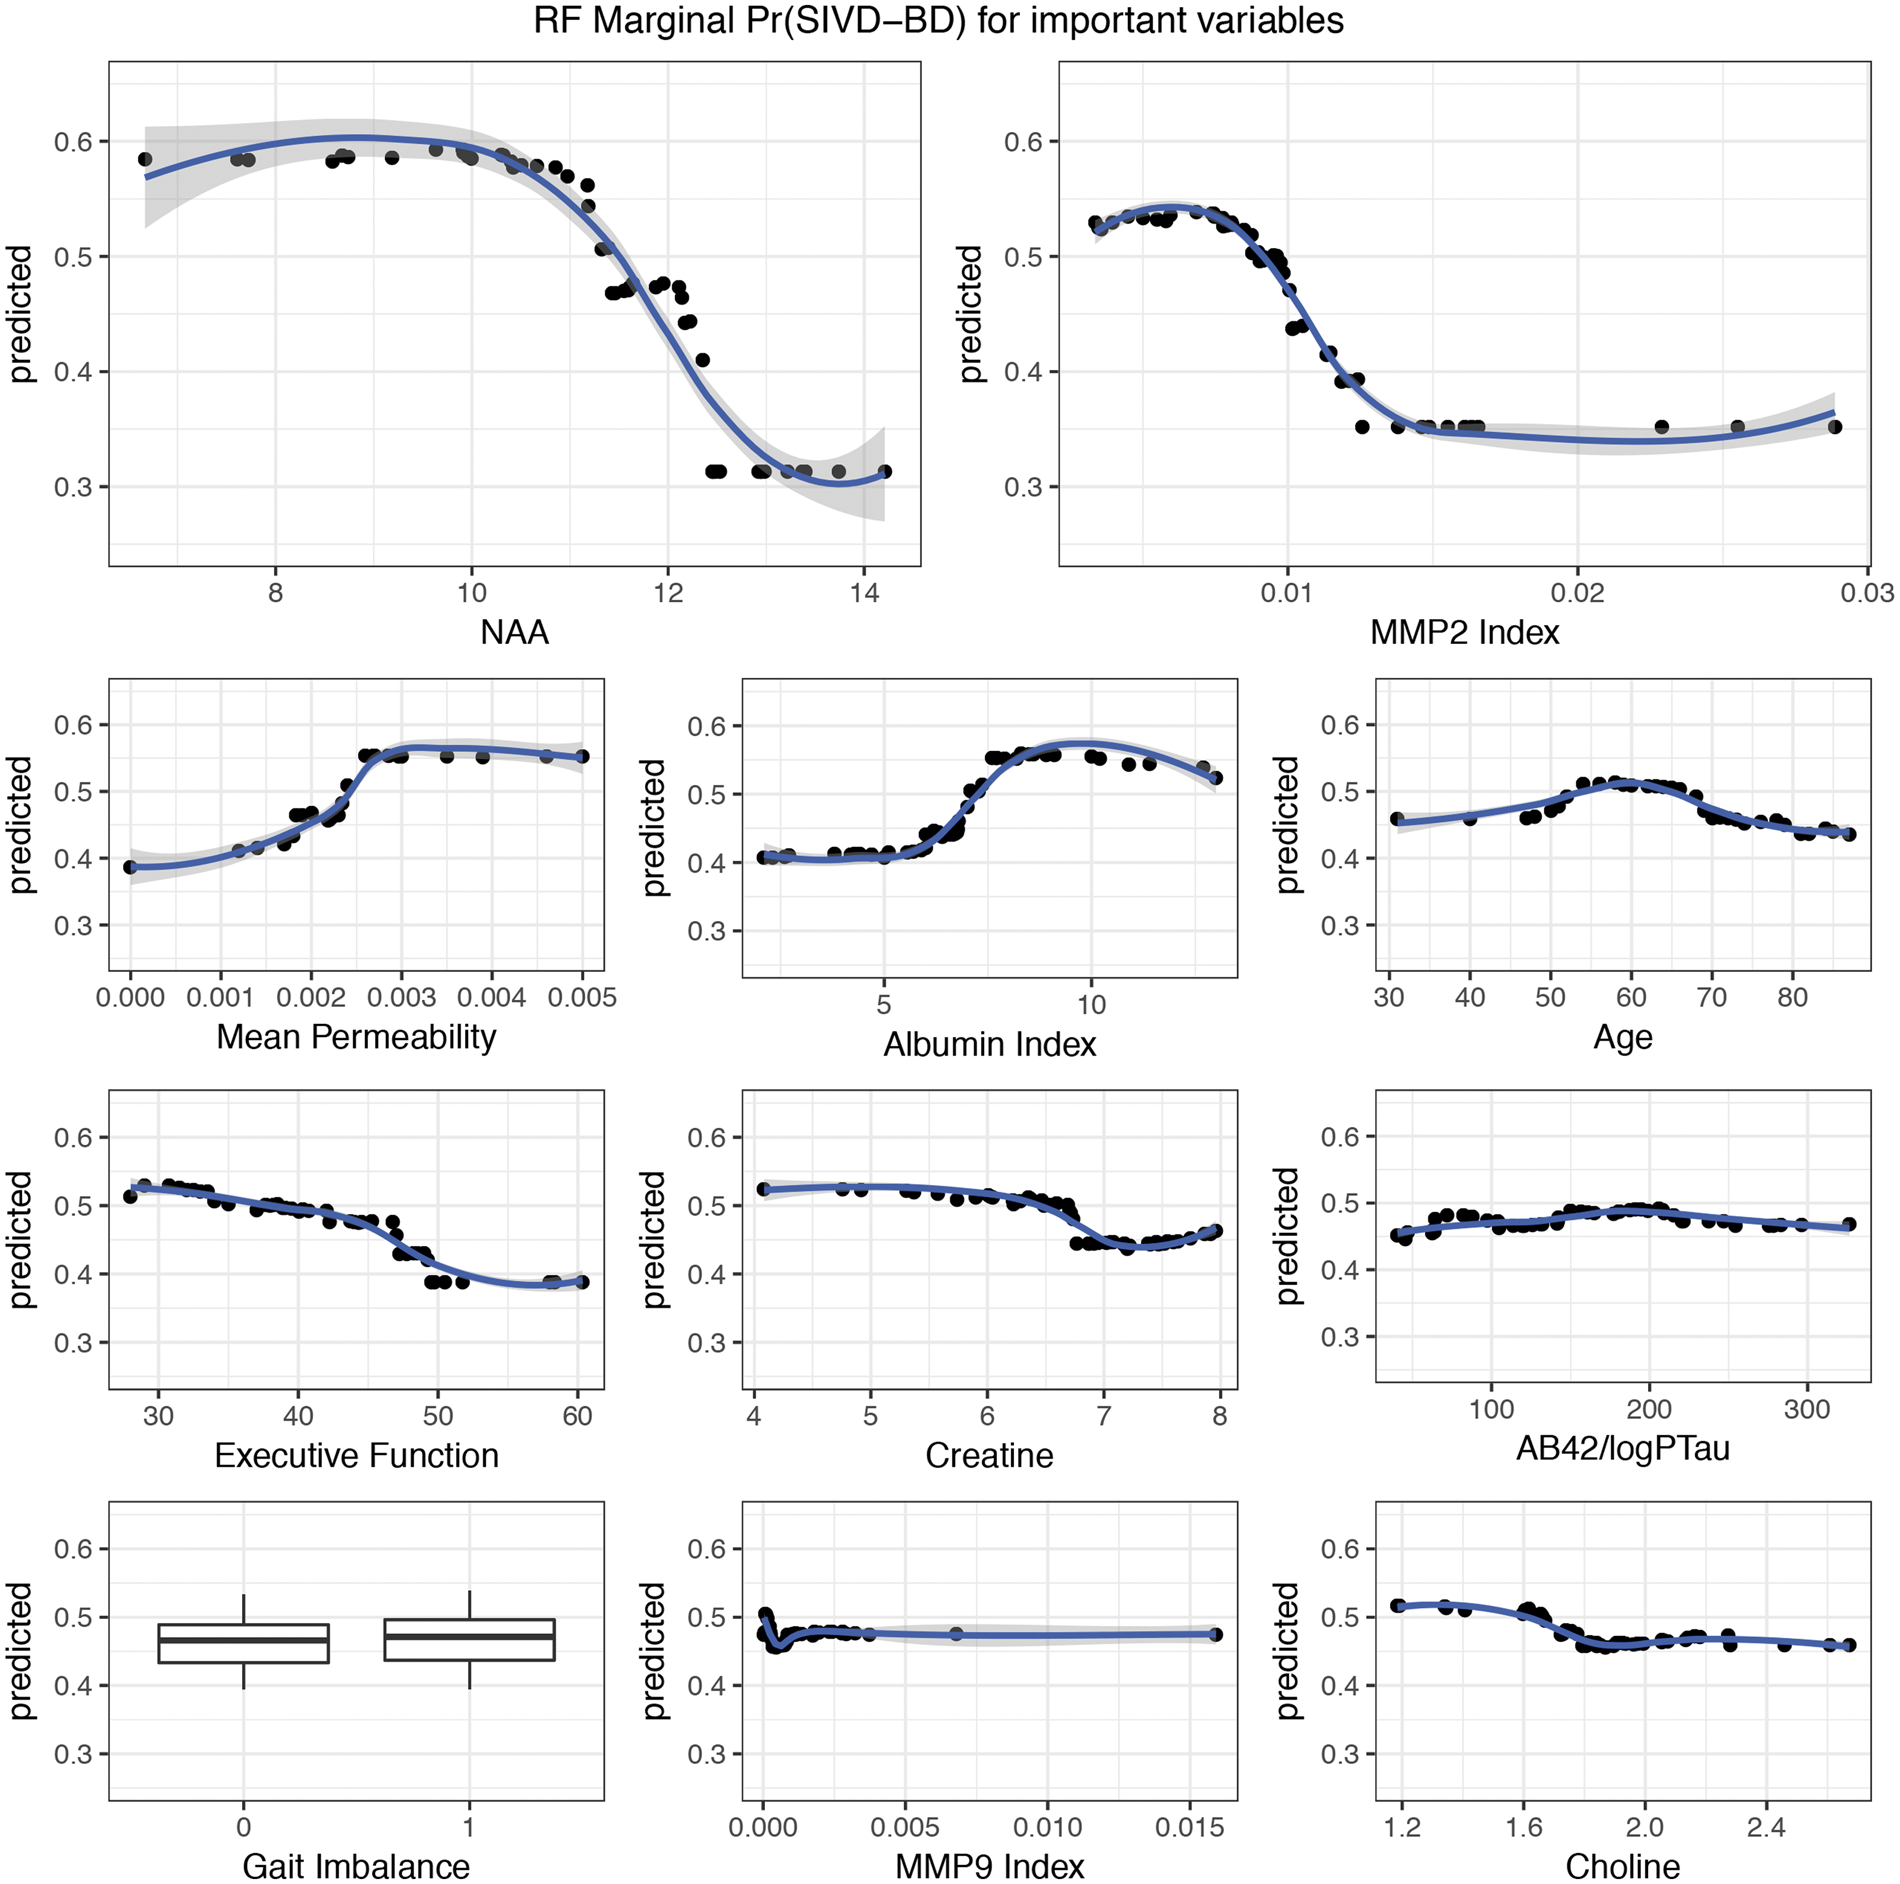
Variable importance is derived from RF (Figure 4). The RF algorithm predicts SIVD-BD versus OD with 79% accuracy, implying we expect that four out of five diagnoses based only on the patient’s biomarkers obtained at the initial visit will match the clinicians’ diagnosis after multiple year visits (Table 2). The marginal effect of each variable on classification is given in Figure 5.
Random forest variable importance plot. Variable importance measurements from the RF based on the established diagnosis dataset. After variable selection, RF predicted with 79% accuracy. Variables are ordered top to bottom from most to least important. Along the horizontal axis, we have the average increase in classification accuracy that occurs when a variable is included classification trees. For our purposes, we dropped the few variables at the bottom indicated as negative marginal improvement with Keep = FALSE as their inclusion reduced prediction accuracy. Random forest marginal effect of variables on classification. Each plot indicates the average probability of a patient being SIVD-BD for a given predictor value on the x-axis. The plots indicate marginal nonlinearities in the variables responsible for the Pr(SIVD-BD). For example, averaging over other variables, patients with NAA<11 have high Pr(SIVD-BD), while patients with NAA>13 have low Pr(SIVD-BD).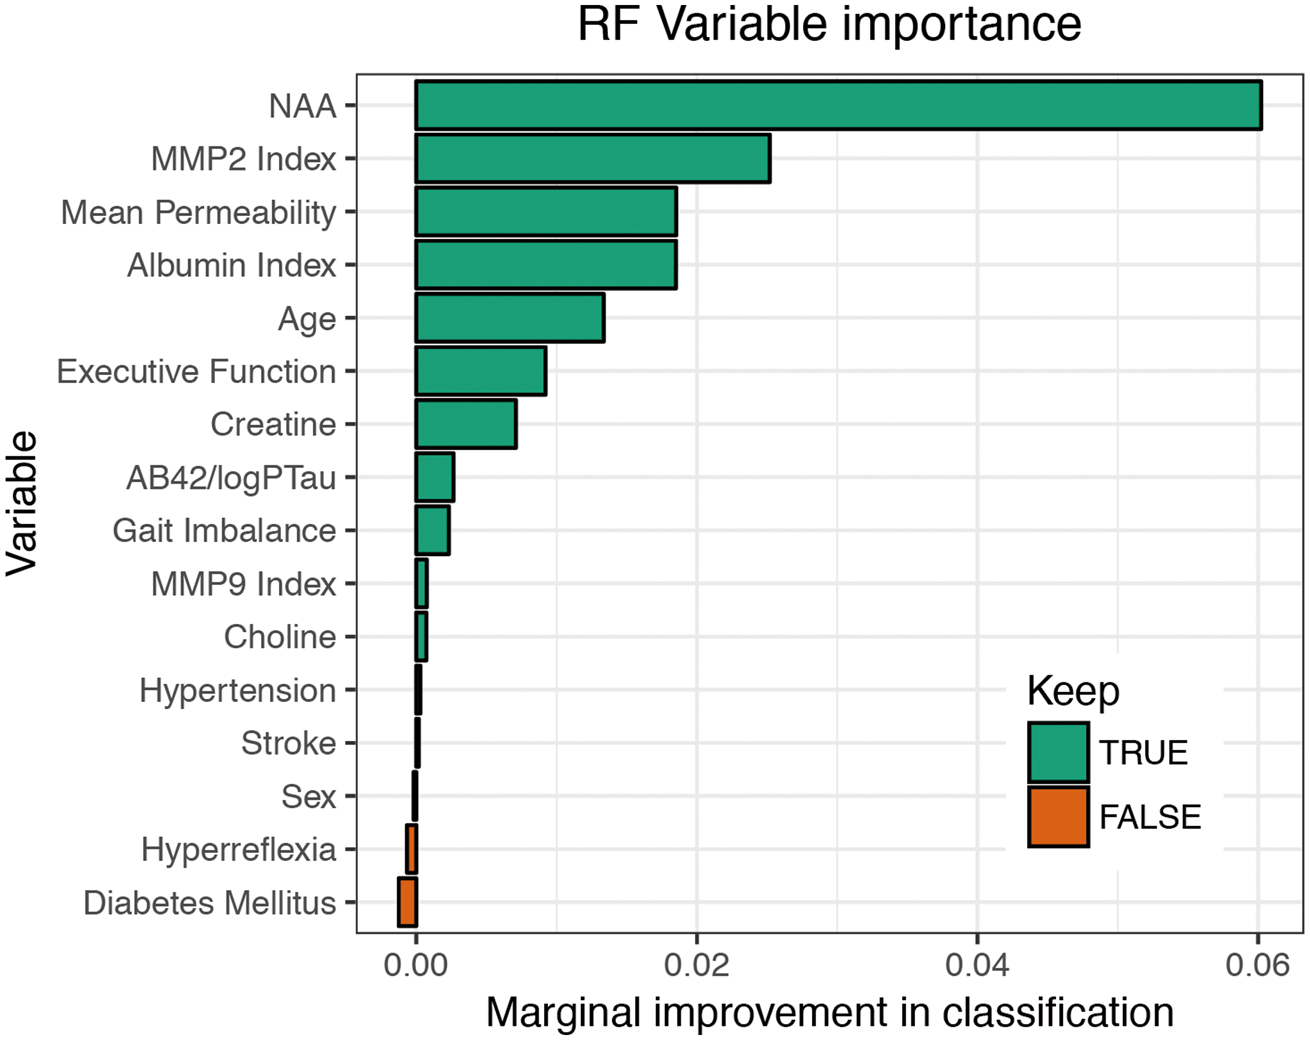
We used RF to predict the provisional diagnoses for the second cohort of 43. Because LR is susceptible to overfitting and because RF and LR have similar classification accuracies, we are using RF since we expect RF to outperform LR as the training set grows. In Supplemental Figure 1, we observe that patients with low NAA have higher Pr(SIVD-BD), for the two groups in the established diagnosis dataset, as well as the provisional patients. The patients to the far right have high Pr(SIVD-BD), making them the prime candidates for early inclusion in a clinical trial. Supplemental Figure 2 shows the high correlation in prediction probability of SIVD-BD between the RF and LR methods.
In the provisional diagnosis set, of the 43 possible patients, 33 had sufficient data, and there were 23 that had follow-up data for one (1) or two years (22). Of those followed for 2 years, 18 were correctly classified: 10 with OD and 8 with BD. Of the 4 misclassified, 3 were OD and 1 was BD. The patients without long-term follow-up had either died, moved away, could not be contacted, or no longer wanted to participate.
Discussion
We applied four statistical classification methods to a multimodal dataset to determine the optimal method to predict the probability of a diagnosis of SIVD-BD prior to a clinical diagnosis. The biomarkers used in the analysis reflect the underlying pathophysiology, including structural damage to the white matter and inflammation. This stratification of patients overcomes two of the principal impediments to treatment trials in VCID, namely, the pathological diversity and the delay before clinical diagnoses become evident. SIVD-BD is the small vessel gradually progressive form that is considered optimal for clinical trials. We identified both the LR and RF probability prediction methods as the most accurate in classification of SIVD-BD and separating them from patients with white matter lesions of uncertain significance, which were labeled as SIVD-LA.3,35
Both LR and RF performed better than a heuristic (Delphic) method used in an earlier report. 18 The RF and LR methods showed roughly equal diagnostic accuracy and both will improve as the training set grows. Diagnoses made by both methods are provisional, but in the provisionally diagnosed patients in whom follow-up data was available, there was excellent agreement between the diagnosis made at entry based on biomarkers and subsequent clinical diagnosis. Although this will need to be confirmed over time, our results demonstrate that early diagnosis can be made in patients with VCID of the SIVD-BD type.
None of the biomarkers alone was adequate to diagnose SIVD-BD. However, several of the biomarkers emerged as the most important in establishing the SIVD-BD diagnosis, including structural damage to WM as shown by decreased levels of the axonal injury marker, NAA, neuroinflammation as shown by reduced MMP-2 index, executive dysfunction on neuropsychological testing, and disruption of the BBB as indicated by increased albumin index and elevated permeability as measured by DCEMRI. The biomarkers could be classified into several categories. MRI provided structural and functional data with 1H-MRS and BBB permeability, neurological examination and neuropsychological data gave clinical information, and CSF studies of albumin and MMPs indicated neuroinflammation.
Large datasets consisting of high-quality measurements, which are becoming more common, will improve the diagnostic accuracy up to a limit. 30 We expect LR and EFA to overfit the data and perform worse at prediction in the long run, and other clustering (e.g. k-means) or classification (e.g. support vector machine) methods are not interpretable, but RF provides an interpretation of the importance of variables to prediction as well as marginal effect estimates. Also, RF is not dependent on a single fixed parametric data model, affording both flexibility and convenience, as there is no need to impose assumptions beyond having observations that are representative of the process under study, which is inherent to any inferential procedure. 21 Furthermore, RF avoids the pitfall of overfitting by implementing CV to ensure generalization to new observations, and it overcomes the problem of dimensionality by using random subsets of features in the construction of each tree that composes the ensemble forest, even in the extreme case where the number of predictors is greater than the sample size.
Ability to correctly classify patients has obvious advantages for clinical treatment trials, and multiple statistical methods can be used in this process. The advantages include: (1) an individual patient can be stratified into subgroups on the basis of the pathophysiology, improving the chance of a successful trial in a smaller population, using an agent designed specifically for that pathophysiology, and (2) a patient can be diagnosed at an earlier stage of the illness, allowing the agent to have a better chance of success.
While our goal was to compare these methods as if they were in competition, it is also important to note the benefits of trying multiple reasonable approaches in any statistical analysis: if the methods agree, it gives more credibility to the result, as all paths lead to the same conclusion. All of the methods suggest that NAA and permeability are highly informative in determining the diagnosis of SIVD-BD versus OD with RF and LR giving similar predictions (Supplemental Figure 2).
An important consideration for personalized medicine is that no single biomarker was sufficient for classification. Although 1H-MRS measurements of NAA were an excellent biomarker for structural damage, and more likely to be low in the SIVD-BD group, a number of patients with other diagnoses had low NAA, including some patients later found to have AD. Using WMHs on FLAIR MRI, which are used in many large population-based studies, as a surrogate biomarker for SIVD-BD would also have failed because of the high percentage of normal elderly people with WMHs. However, adding the BBB opening, which is indicated by the elevation of the albumin index and the increased permeability with DCEMRI, we see improved diagnostic accuracy. Other biomarkers that proved useful in the diagnosis of SIVD-BD included abnormal MMPs in the CSF, which indicates neuroinflammation, and impairment in executive functions.
A caveat for the present report is that not all patients in the provisional diagnosis group had a final clinical diagnosis. However, a sufficient number of them were followed long enough to show the accuracy of the statistical classification methods. Our study provides a basis for further studies in larger numbers of patients that are followed for longer periods with possible autopsy confirmation. Another caveat is that because this is an early attempt to classify SIVD-BD patients, these biomarkers may need to be modified for use in future studies with larger cohorts of patients.
Supplemental Material
Supplemental material for Biomarkers identify the Binswanger type of vascular cognitive impairment
Supplemental material for Biomarkers identify the Binswanger type of vascular cognitive impairment by Erik Barry Erhardt, John C Pesko, Jillian Prestopnik, Jeffrey Thompson, Arvind Caprihan and Gary A Rosenberg in Journal of Cerebral Blood Flow & Metabolism
Footnotes
Funding
The author(s) disclosed receipt of the following financial support for the research, authorship, and/or publication of this article: The study was funded by grants from the NIH RO1 NS 052305 and the US-Israeli Binational Research Foundation to GAR, and the National Center for Research Resources and the National Center for Advancing Translational Sciences of the NIH through Grant Number 8UL1TR000041, UNM Clinical and Translational Science Center.
Acknowledgments
JC Adair and Janice Knoefel helped recruit patients.
Declaration of conflicting interests
The author(s) declared no potential conflicts of interest with respect to the research, authorship, and/or publication of this article.
Authors’ contributions
EE supervised and performed the statistical analysis and contributed to the writing. JPes performed the statistical analysis and contributed to the writing. JPre was the study coordinator. JT ran the CSF studies and assisted in the MRI and CSF data analysis. AC collected and analyzed MRI data. GR conceived the study, participated in patient recruitment, and contributed to the writing.
References
Supplementary Material
Please find the following supplemental material available below.
For Open Access articles published under a Creative Commons License, all supplemental material carries the same license as the article it is associated with.
For non-Open Access articles published, all supplemental material carries a non-exclusive license, and permission requests for re-use of supplemental material or any part of supplemental material shall be sent directly to the copyright owner as specified in the copyright notice associated with the article.