
Abstract
The human brain consumes a disproportionate amount of the body’s overall metabolic resources, and evidence suggests that brain and body may compete for substrate during development. Using perfusion MRI from a large cross-sectional cohort, we examined developmental changes of MRI-derived estimates of brain metabolism, in relation to weight change. Nonlinear models demonstrated that, in childhood, changes in body weight were inversely related to developmental age-related changes in brain metabolism. This inverse relationship persisted through early adolescence, after which body and brain metabolism began to decline. Females achieved maximum body growth approximately two years earlier than males, with a correspondingly earlier stabilization of brain metabolism to adult levels. These findings confirm prior findings with positron emission tomography performed in a much smaller cohort, demonstrate that relative brain metabolism can be inferred from noninvasive MRI data, and extend observations on the associations between body growth and brain metabolism to sex differences through adolescence.
Introduction
The mammalian brain is a metabolically demanding organ that is estimated to require 6 kCal per billion neurons per day. 1 The adult human brain represents only ∼2% of body weight, yet it consumes approximately 20% of total body metabolic substrate. 2 As such, the caloric intake needed to supply the brain’s metabolic requirement has been considered an evolutionary constraint on brain size. 3 While most vertebrate species use less than 10% of their basal metabolism to support brain function in adulthood, primates and particularly humans use considerably more. 4
Brain energy requirements are even larger in childhood. 5 Some evidence suggests that brain and body development may be in competition for metabolic substrate and the considerable metabolic needs of the developing brain may account for the remarkably slow early development of the human body relative to other species.2,5,6 Kuzawa et al. 6 combined positron emission tomography (PET) data on brain metabolic rates in childhood 7 with information about body growth rates and metabolism to demonstrate that brain glucose utilization, relative to total body metabolism, does not peak in infancy, when brain mass is highest relative to body mass. Rather, it occurs during childhood when body growth rates are slowest and synaptic proliferation is maximal. 8 Their findings support the notion of brain and body competition for metabolic substrate, but were limited by a small sample size with only three measures of adolescent brain metabolism after age 10 and no information about sex differences.
The most rapid phase of human body growth occurs during adolescence, 9 when brain development is associated with continued thinning of cortex due to white matter expansion10–16 and reorganization of prefrontal synaptic connections.17,18 Notably, the adolescent growth spurt is unique to humans. 19 Adolescence is also associated with the emergence of highly significant sex differences in body growth, with females reaching full body mass index (BMI) considerably earlier than males. 20 Thus, it is of interest to further understand the relationship between brain and body metabolism during this period of development.
Here, we evaluated sex differences in brain metabolism as it relates to body growth in the Philadelphia Neurodevelopmental Cohort (PNC), a large population-based sample of over 9500 individuals aged 8–21 years from the greater Philadelphia area. Imaging data were collected in a subset of 1600 subjects, and included quantitative magnetic resonance imaging of cerebral blood flow (CBF) using arterial spin labeled (ASL) perfusion magnetic resonance imaging (MRI).21,22 We previously reported age-related differences in CBF in 921 PNC participants, demonstrating a progressive reduction in gray matter CBF from age 8 through 18 and a more subtle increase in CBF in early adulthood. 23 Significant sex differences in CBF developmental changes were also observed, with females demonstrating an increase in CBF in late adolescence, while CBF continued to decline in males.
CBF is thought to be tightly coupled to neural activity, 24 and hence serves as a proxy for regional brain metabolism that can be acquired entirely noninvasively. In contrast to PET scanning, ASL MRI is totally noninvasive and does not require exposure to ionizing radiation. To relate our developmental data to the PET measurements of brain glucose metabolism, 6 we used CBF, demographic variables including self-reported weight, and published values relating glucose metabolism to CBF6,25,26 to estimate the percentage of resting metabolic rate attributable to the brain (%RMR). We derived the development-related changes for mean CBF, whole brain glucose consumption, and %RMR as it relates to body growth through adolescence. We also included regional investigations of these measures of brain metabolism in precuneus and superior frontal gyrus (SFG), which have been identified as early and late developing CBF trajectories, respectively, in developmental reports. 27 Finally, we used these MRI-derived measures to investigate sex differences in the relationship between body growth rate and brain metabolism.
Methods
The study procedures were performed according to the ethical guidelines set forth in the Belmont Report and approved by the Institutional Review Boards at University of Pennsylvania (Penn) and Children’s Hospital of Philadelphia (CHOP). All subjects or their parent or legal guardian gave informed consent and minors gave assent. The Institutional Review Boards at Penn and CHOP both approved study procedures.
Sample description
Sample demographics for weight-change and imaging data curve estimation.
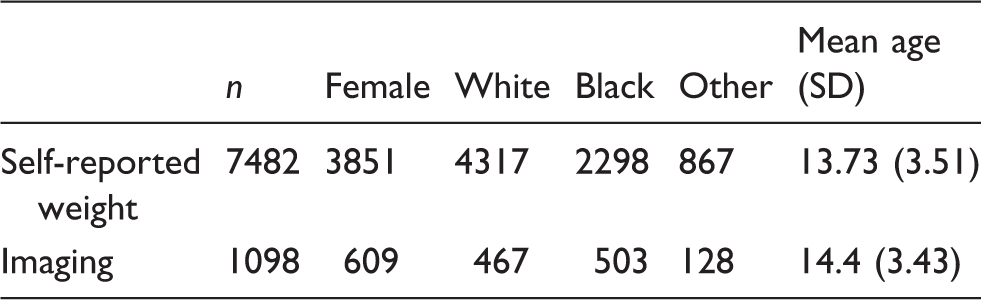
Note: Age is mean (standard deviation).
Image acquisition, QA, and preprocessing
All imaging data were acquired on the same scanner as part of the same imaging protocol as previously described.22,23 CBF was imaged using a custom pseudo-continuous arterial spin labeling (pCASL) sequence. 28 The sequence used a single-shot spin-echo echo-planar imaging readout. The arterial spin labeling parameters were TR 4 s, TE 15 ms, flip angle 90/180°, FOV 220 × 220 mm, matrix 96 × 96 × 20, slice thickness/gap 5/1 mm, effective voxel resolution 2.3 × 2.3 × 6 mm, label duration 1500 ms, postlabel delay 1,200 ms, GRAPPA 2, 80 volumes (40 label, 40 control). Before the pCASL sequence, a magnetization-prepared, rapid acquisition gradient-echo T1-weighted image was acquired for use in spatial normalization to standard atlas space, using the following parameters: TR 1,810 ms, TE 3.51 ms, TI 1,100 ms, FOV 180 × 240 mm, matrix 192 × 256, 160 slices, slice thickness/gap 1 mm/0 mm, flip angle 9°, GRAPPA 2, effective voxel resolution of 0.9 × 0.9 × 1 mm, and total acquisition time 3:28 min. Additionally, a B0 field map was acquired for application of distortion correction procedures, using a double-echo gradient recall echo sequence: TR 1,000 ms, TE1 2.69 ms, TE2 5.27 ms, 44 slices, slice thickness/gap 4 mm/0 mm, flip angle 60°, FOV = 240 mm, effective voxel resolution of 3.8 × 3.8 × 4 mm.
All imaging data were loaded into an XNAT database that included custom front-end (QLUX) software that monitored QA by checking that acquisition parameters matched a study-defined template. ASL data were pre-processed using standard tools included with FSL. 29 Following distortion correction using the B0 map with FUGUE, the first four image pairs were removed, the time series was realigned with MCFLIRT, 30 the skull was removed with BET, 31 and the image was smoothed at 6 mm FWHM using SUSAN. 32 CBF was quantified from control-label pairs using ASL Toolbox. 33 As described previously, 23 the T1 relaxation parameter was modeled on an age- and sex-specific basis. 34 This model accounts for the fact that T1 relaxation time differs according to age and sex, and has been shown to enhance the accuracy and reliability of results in developmental samples. 35 The procedure is discussed in detail in the Supplement of our previous report. 23 The T1 image was co-registered to the CBF image using boundary-based registration, 36 and CBF values were averaged within each anatomically defined parcel.
T1-weighted structural images were processed using tools included in ANTs. 37 Brain extraction was guided using a study-specific set of tissue priors; bias-field correction used N4. 38 In order to parcellate the brain into anatomically-defined regions, we used an advanced multi-atlas labeling approach 39 . Specifically, 24 young adult T1 images from the OASIS data set that were manually labeled by Neuromorphometrics, Inc. (http://Neuromorphometrics.com/) were registered to each subject’s T1 image using the top-performing top-performing SyN diffeomorphic registration.40,41 These label sets were synthesized into a final parcellation using joint label fusion. 42 The labeled images allowed estimation of regional and whole brain volumes. The T1 image was co-registered to the CBF image using boundary-based registration, 36 and CBF values were averaged within each anatomically defined parcel.
Brain glucose consumption and %RMR estimation
Brain glucose metabolism (CMRGlc) and brain metabolism as a percentage of total resting metabolic rate of the body (%RMR) were estimated for the whole brain and anatomically defined parcels using the MRI-derived CBF maps and a CMRGlc:CBF ratio derived from the literature. Brain metabolism was estimated in the units of grams of glucose consumed per day based on CBF quantified with ASL using the formula
Estimation of glucose metabolism from CBF also assumed that the rate of grams of glucose consumption per milliliter of CBF 
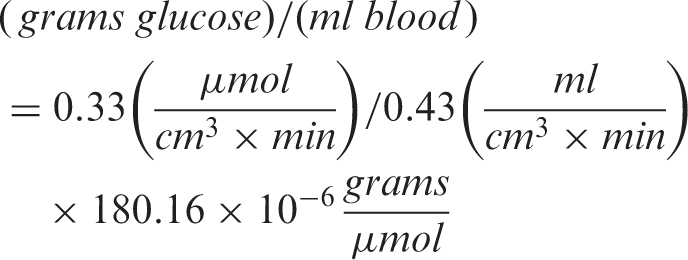
The rate of average glucose uptake
Body weight and imaging outcome model fitting
Our main focus was to characterize sex differences in the age-dependent bivariate relationship between body growth and brain metabolism. Body growth and brain metabolism were estimated using weight-change and %RMR, respectively. First, the population weight curve was estimated and then the weight-change curve was obtained by differentiating the weight curve with respect to age. As we were utilizing a cross-sectional sample where the rate of weight-change was not directly observed for each subject, the estimation was restricted to the marginal relationships of weight-change with age, and of %RMR with age separately. The curves were estimated and tested for each variable and plotted together to investigate their relationship.
All the statistical analyses were implemented in R 3.3.1.
45
The software package ‘mgcv’ 1.1246,47 was used to conduct spline-based model fitting. The imaging outcome measures and body weight were modeled as nonlinear functions of age using generalized additive models (GAMs). Nonlinear functions for each sex were fit using a 12 knot P-spline bases with a third degree penalty in order to ensure flexibility of the weight-change trajectories after differentiation. A single smoothing parameter, estimated by restricted maximum likelihood (REML), was used for male and female age curves. After obtaining the estimated developmental weight curves, the population-level weight-change curve was differentiated with respect to age by taking small finite differences (
Testing hypotheses of nonlinear functions
For each outcome (weight-change or imaging measure), we conducted tests for nonlinear sex difference in the weight-change curves (i.e. the sex by age interaction). For the weight-change curve, the test is equivalent to testing for a nonlinear age by sex interaction on weight over a linear age by sex interaction. This is because the derivative of a line is a constant; if the difference in weight curves between males and females was linear or constant then the difference in the weigh-change curves would be constant or zero. Thus, for weight, only coefficients for higher order spline terms were tested. Specifically, to test the interaction for weight, we fit the following two models and performed F-test for the difference


To investigate whether %RMR and CBF in the precuneus or SFG reached maturity earlier, we compared the first age after 10 when the slope of the developmental curve was zero. In order to test the difference between the age that the slope of the curve reached zero in SFG and precuneus, we used 1000 bootstrap samples to estimate the distribution of the difference and computed the probability that the difference was less than zero (see Supplement for details).
Results
Nonlinear weight-change developmental curves differ in males and females
To understand the developmental course of body weight-change, nonlinear weight-change curves were estimated and differentiated to obtain the estimated weight-change curve. The estimated growth curves produced by this procedure closely match the shape of the median estimates reported by the Center for Disease Control
48
(Figure 1(a) and (b)), indicating the reliability of the sample data and model fit. Results from hypothesis testing suggested that the rates of weight-change estimated from self-reported weight are not constant over time for males (F = 15.74, df1 = 10, df2 = 7454, p < 0.001) or for females (F = 27.00, df1 = 10, df2 = 7454, p < 0.001). In addition, we were able to detect a sex difference in developmental weight-change curves (F = 3.90, df1 = 10, df2 = 7456, p < 0.001). Weight-change curves demonstrate an earlier peak for females (age = 11) than males (age = 13; Figure 1(c)). The confidence interval for male weight-change covered zero at age 19 (Figure 1(c)), indicating no significant growth after that age for males. For females, weight-change covered zero between 17 and 18, but increased slightly afterward (Figure 1(c)). Between ages 13 to 18, female weight-change was significantly slower than males. Together, this suggests that the female weight-change curve appears shifted approximately two years earlier than males.
Males and females exhibited different developmental curves in weight, weight-change, and whole-brain CBF-derived imaging measures. (a) PNC estimated mean growth curves. (b) CDC median weight trajectories from May 2000. Dashed lines are 25% and 75% percentiles. (c) Females had an earlier peak and decline in rate of weight-change than males. (d) CBF declined for females until age 15 where it began to increase, while CBF in males declined until age 18 where the curve flattens. (e) Whole-brain glucose consumption was lower in females through development until adulthood where males and females had identical brain glucose consumption. (f) %RMR was approximately equal in males and females until reaching adult resting levels. Fitted curves are estimated with generalized additive models (GAMs). Colored dashed lines in (a) and (c–f) are 95% simultaneous confidence intervals; WB: whole brain; Est: estimated.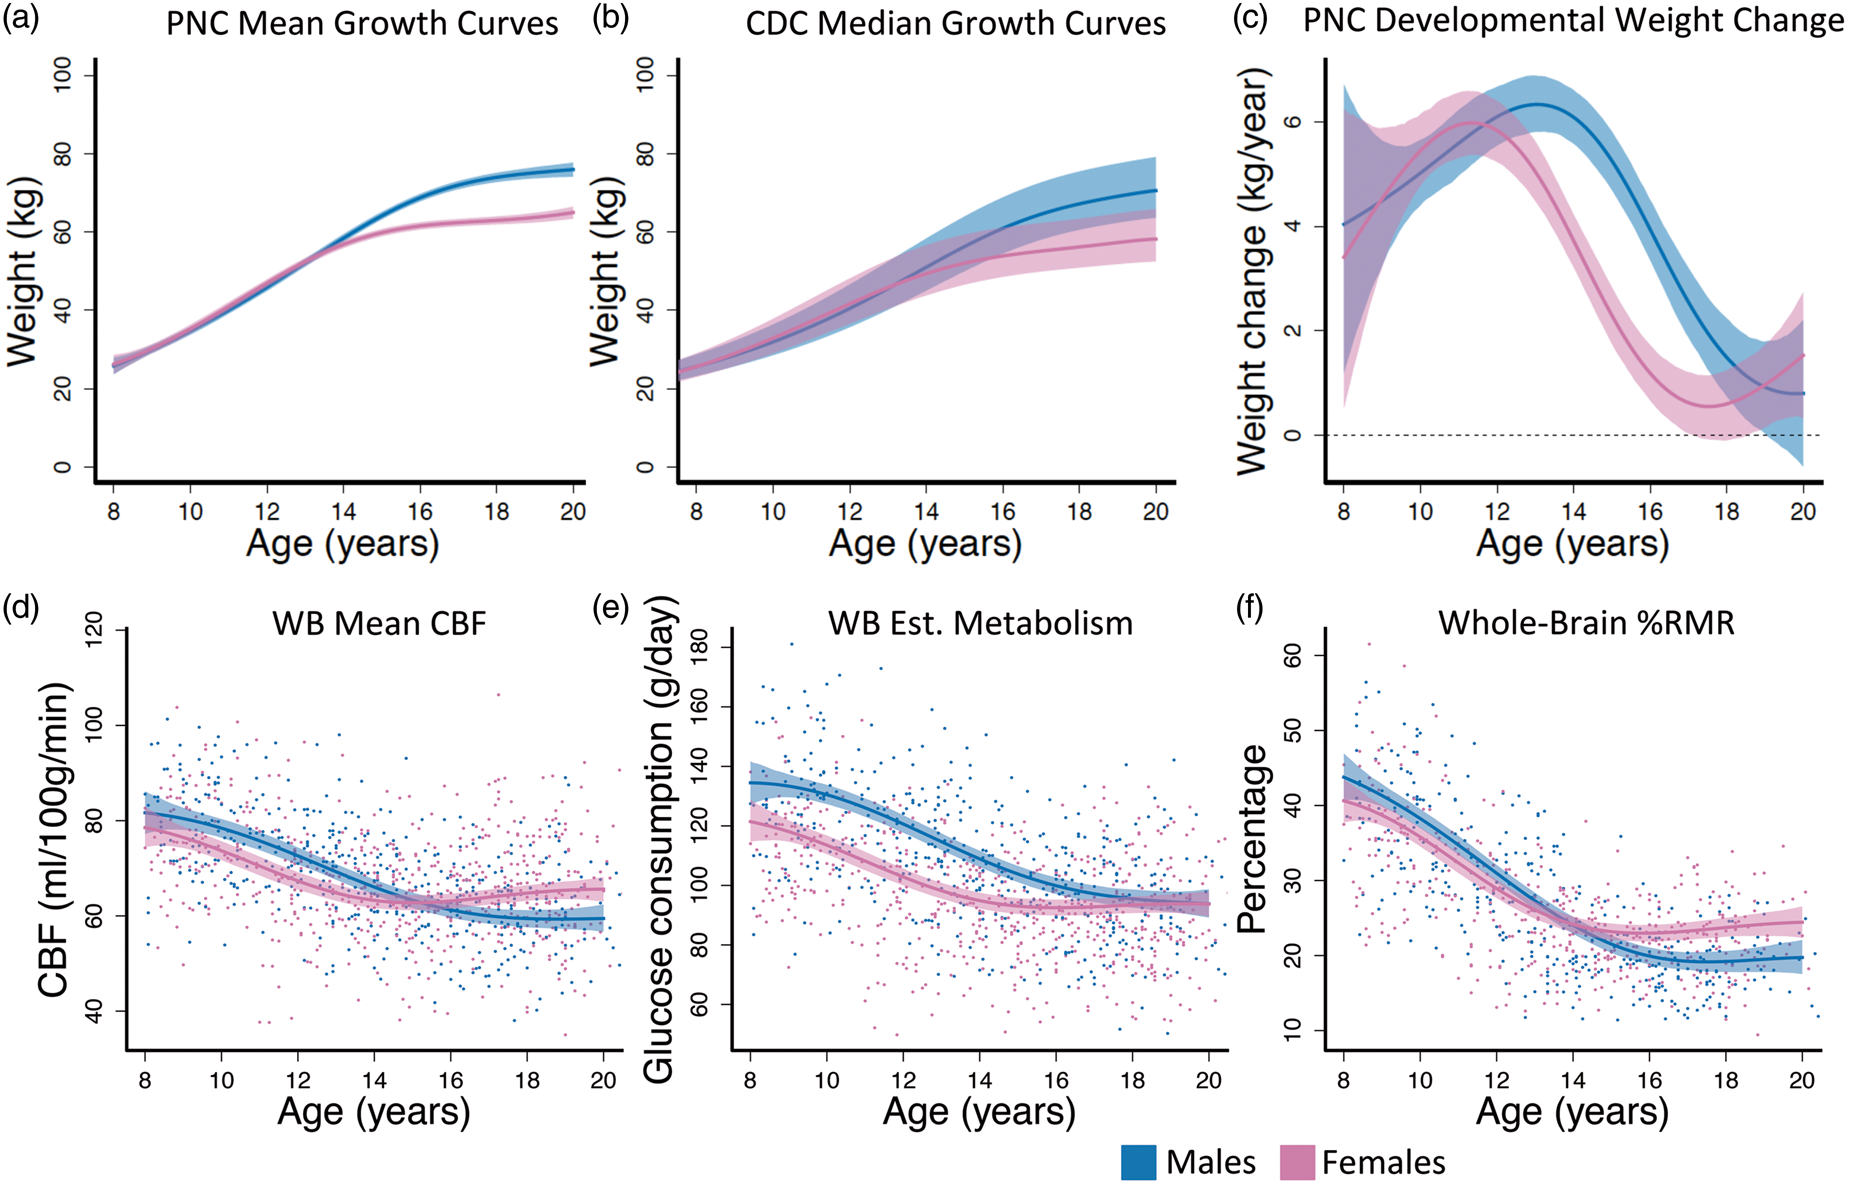
CBF and %RMR development-related changes
Hypothesis tests for sex differences in development-related changes of whole-brain CBF, brain glucose consumption, and the percentage of resting metabolic rate attributable to the brain (%RMR).
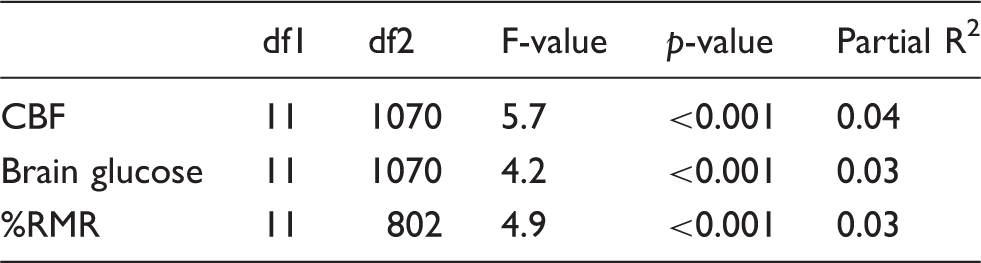
Note: df1 and df2 indicate numerator and denominator degrees of freedom for the F-statistic. p-values are Holm adjusted.
%RMR percentage of resting metabolic rate; CBF: cerebral blood flow.
The age curves of whole-brain glucose consumption estimated using ASL-derived CBF were approximately 20% lower than those obtained using PET by Kuzawa et al. 6 These differences were consistent across sexes (Table S1), but by age 20, MRI-derived values closely matched PET-derived levels in males. MRI-derived %RMR showed a similar relationship to PET-derived %RMR, and the %RMR plateau at age 20 in males and females closely matched adult levels in Kuzawa et al. 6 (Table S2).
Regional hypothesis tests for sex differences in development-related changes of CBF, brain glucose consumption, and the percentage of resting metabolic rate attributable to the brain (%RMR).
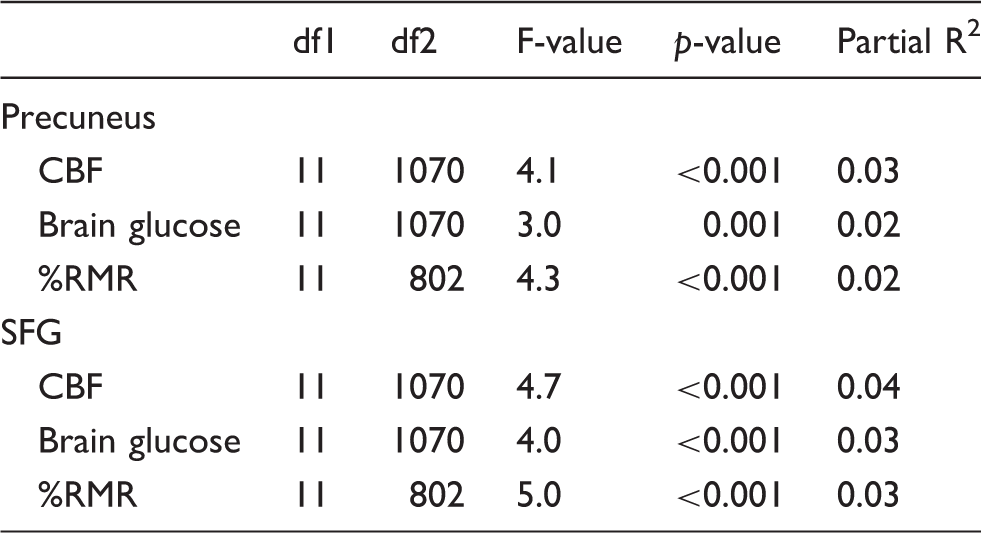
Note: Precuneus and superior frontal gyrus (SFG) were selected as representatives of early and late developing regions, respectively. p-values are Holm adjusted.
%RMR percentage of resting metabolic rate; SFG: superior frontal gyrus; CBF: cerebral blood flow.
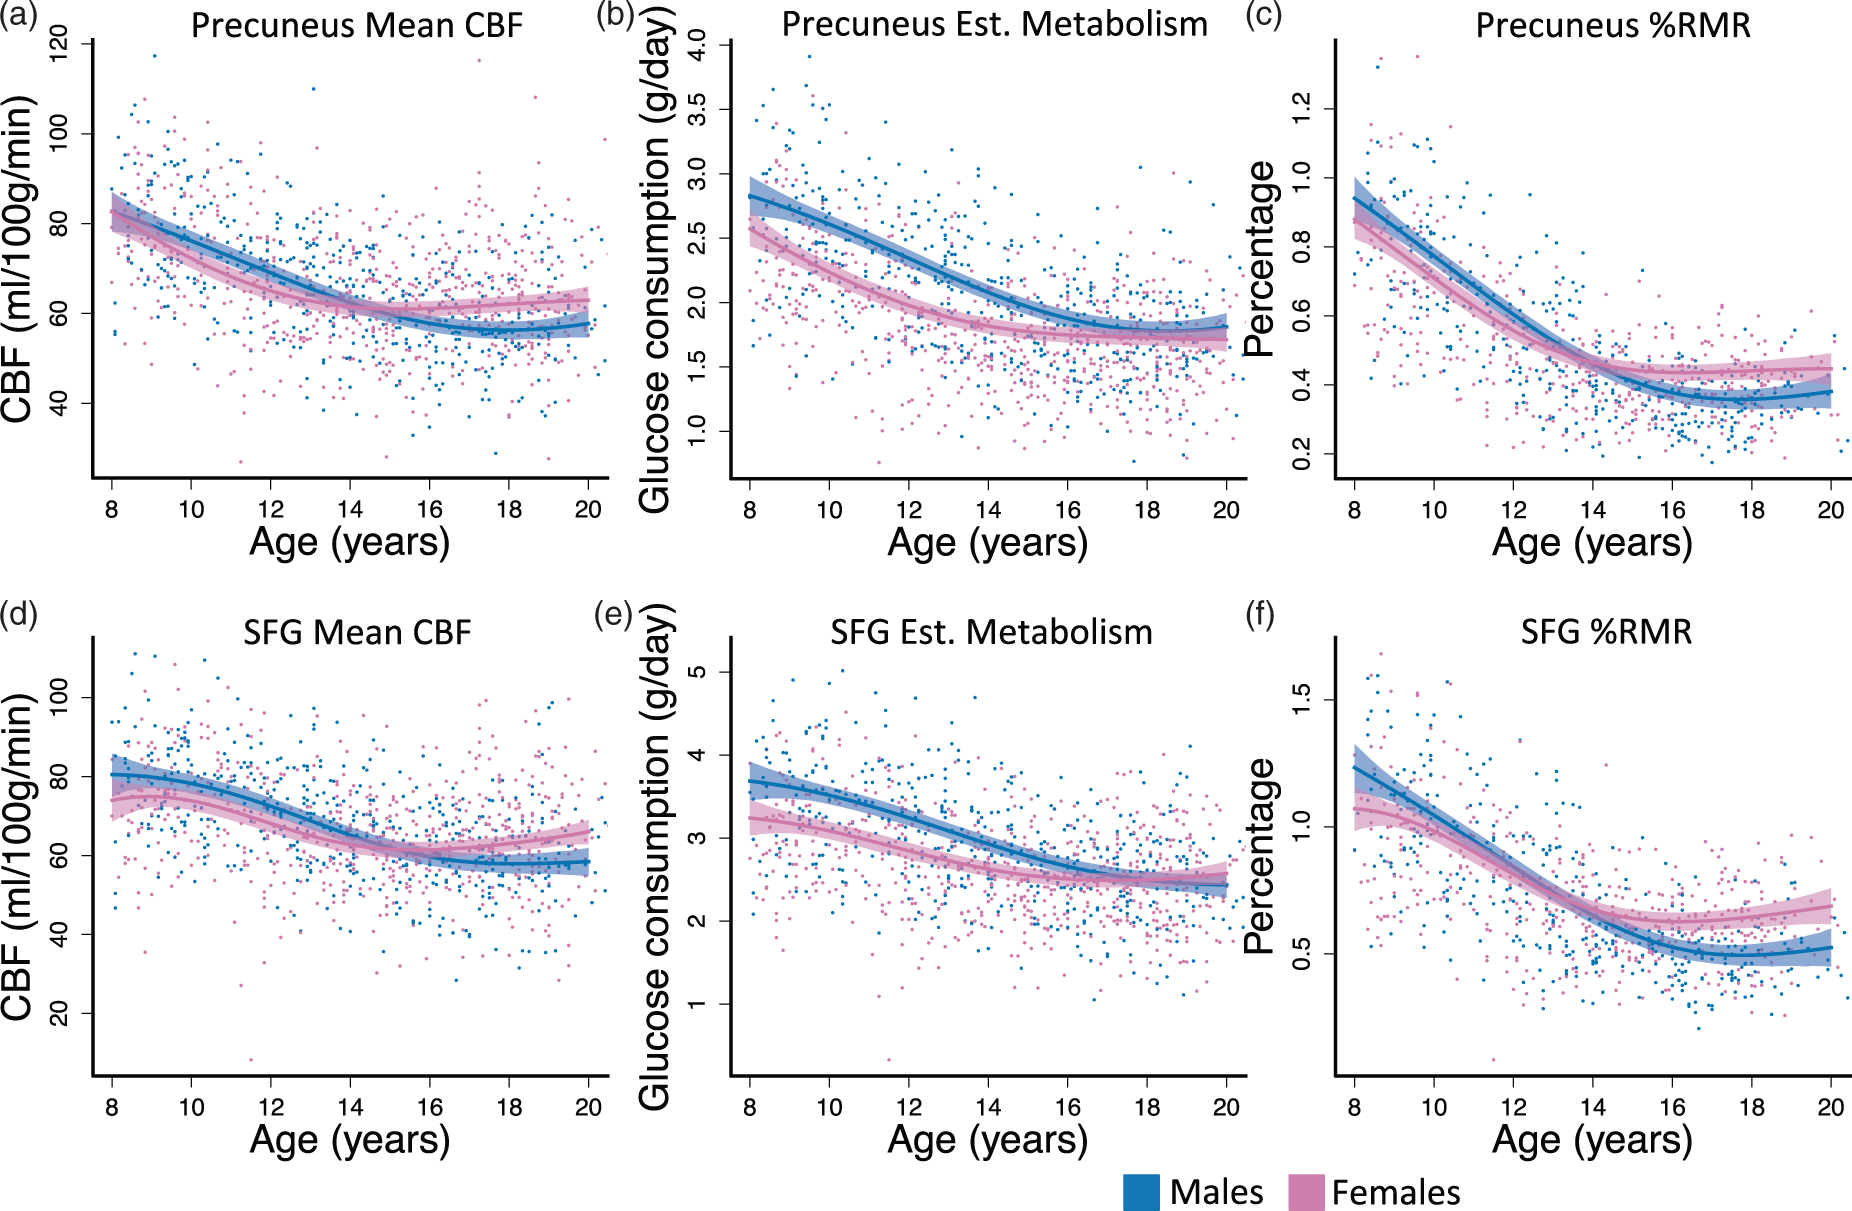
Development-related changes in brain for two select structural ROIs. (a, d) CBF reached adult levels at approximately the same time in precuneus and SFG; however, SFG had a later peak CBF in childhood at approximately age 8 or 9. The peak for precuneus was not detectable in this age range. (b, e) Regional glucose consumption declined in both regions until reaching approximately the same level in adulthood for males and females. (c, f) %RMR decreases in both sexes for both regions. Female’s curves leveled at a higher resting value by age 15. Fitted curves are estimated with generalized additive models (GAMs). Dashed lines are 95% simultaneous confidence intervals; Est: estimated.
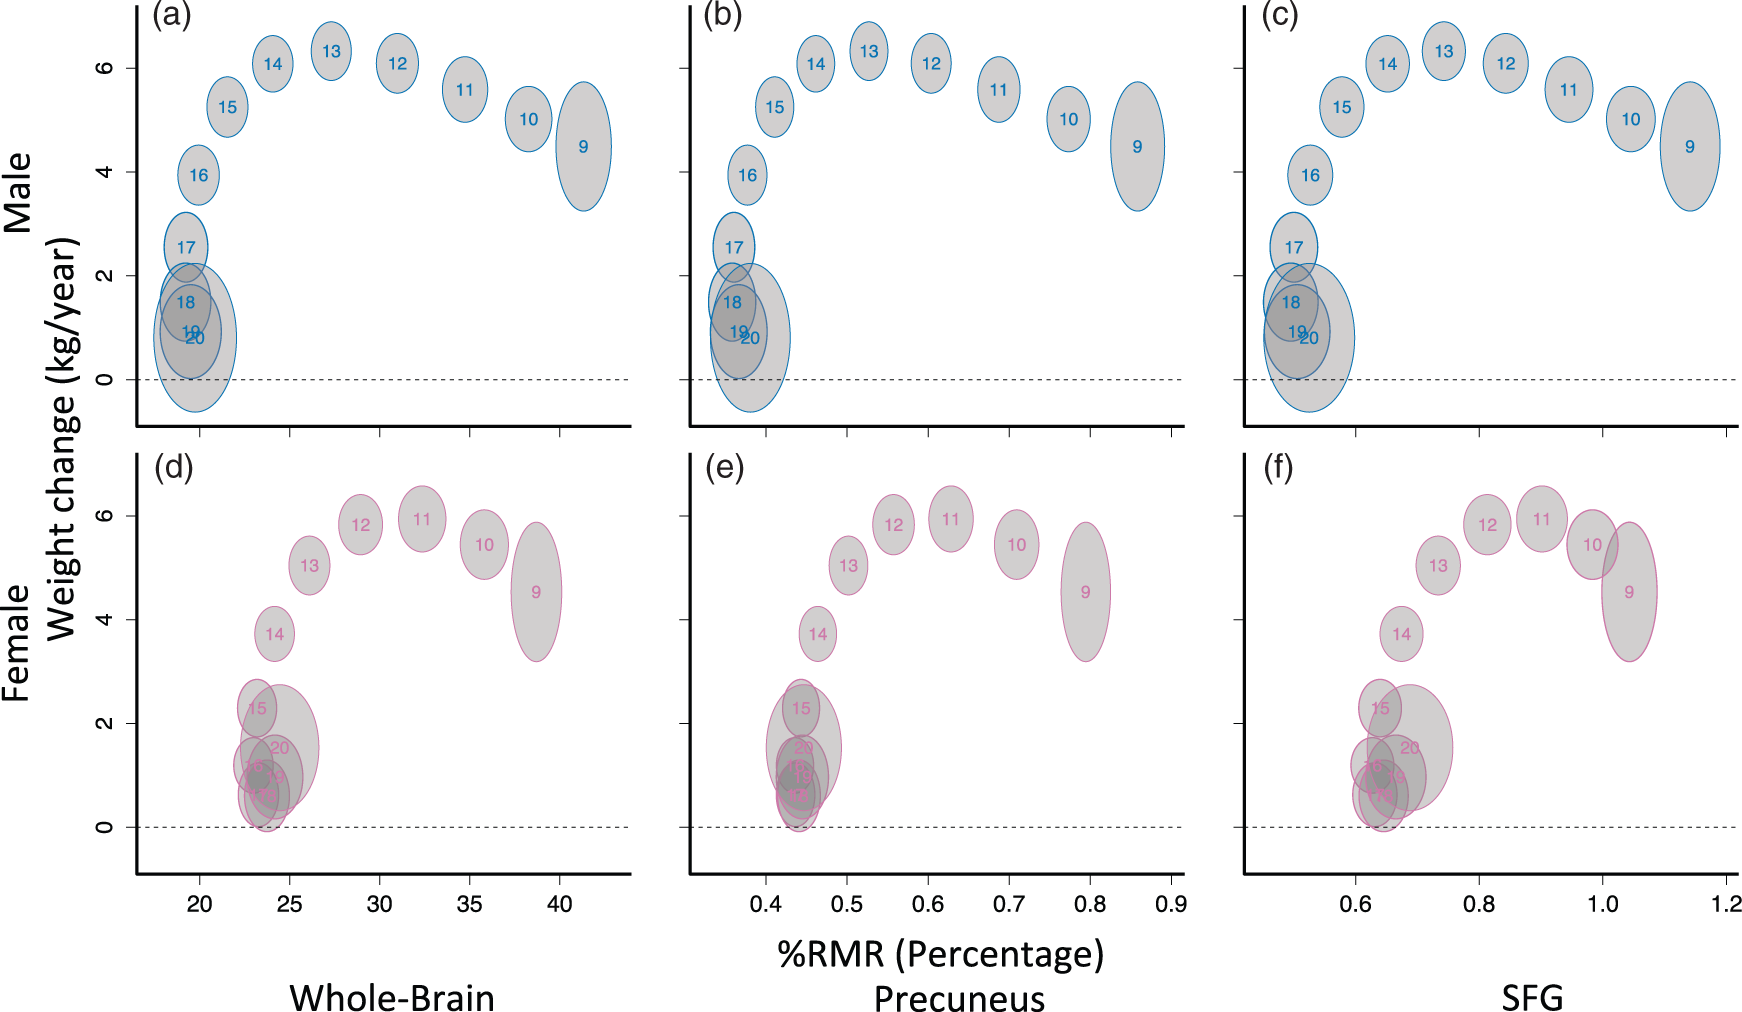
Whole-brain (a, d) and regional (b, c, e, f) %RMR weight-change curves differ by sex. Each curve was fit separately as a function of age using generalized additive models (GAMs), and the location for each age was plotted. Each number on the plots indicates a corresponding age; gray bubbles are 95% marginal confidence regions. Larger bubbles are due to noisier estimates toward the edges of the sample range. The bivariate relationship between weight-change and whole-brain %RMR appeared shifted forward temporally for females relative to males; however, after peak weight change, female %RMR was higher in all regions. %RMR reaches adult levels before weight-change reaches zero.
Joint weight-change and CBF curves differ in males and females
To assess the evidence supporting brain metabolism and body growth competition, we constructed 95% confidence regions for each age level using the weight-change and %RMR curves shown in Figures 1 and 2. Whole-brain bivariate curves corroborated and extended previous findings for both sexes 6 (Figure 3). Specifically, in males, there was a negative association between %RMR and weight-change prior to peak weight-change at age 13 as indicated by a modest negative slope between age bubbles in ages less than 13 (Figure 3(a)). Similarly, for females there was also a negative slope between age bubbles prior to peak weight-change, which occurred at approximately age 11 (Figure 3(b)). At younger ages, female bivariate curves appeared to be shifted forward temporally relative to males by approximately one to two years. For example, the mean for 11-year-old females is at approximately the same position as the mean of 12-year-old males on the whole-brain bivariate plots (Figure 3(a) and (d)).
While an inverse relationship between brain metabolism and weight-changes was not present after childhood (Figure 3), observed sex differences in body growth rates did appear to be reflected in brain metabolism trajectories. Around age 14, when female growth rate was clearly declining (Figure 1(c)) and body weight was stabilizing (Figure 1(a)), female brain glucose consumption (Figure 1(e)) and %RMR (Figure 1(f)) stabilized near adult levels. The onsets of these changes were shifted to around age 16 in males.
Discussion
We used estimated brain metabolism in a large developmental cohort to examine sex differences in the relationship between brain and body metabolism. Using the CBF-derived estimates of %RMR obtained noninvasively with MRI, we found evidence to support the hypothesis that brain and body growth are inversely related in childhood and further demonstrated that this inverse relationship occurs only prior to peak weight-change. After that, %RMR and body growth rates decline together. Furthermore, this developmental shift occurs significantly earlier in females than in males, and is associated with sex differences in the transition from declining to plateau values of %RMR.
Developmental curves of brain glucose consumption and %RMR derived from ASL MRI data matched previously published results based on PET data.6,7 MRI-derived glucose consumption and %RMR values in childhood and early adolescence were approximately 20% lower than PET-derived values, while the two measures were in much closer agreement for adults. MRI-derived estimates of %RMR reached adult levels by age 15–17, which is consistent with previous PET reports measuring brain glucose metabolism directly. 7 Importantly, CBF-based brain glucose consumption and %RMR derived from ASL MRI are completely noninvasive, and readily obtained in large cohorts. In contrast, due to the paucity of more costly and invasive PET measures of brain glucose consumption during development, the approach of Kuzawa et al. 6 only allowed for estimation of %RMR at discrete ages across subjects, after combining PET and MRI data from separate cohorts. Because the MRI-derived %RMR data provided a within-subject measure of relative brain energy consumption (i.e. both CBF and body weight were derived from the same subject), it is possible that the MRI-derived %RMR estimates obtained in this study are more accurate than prior estimates, despite not measuring glucose metabolism directly. The concordance between CBF- and PET-based measures of brain metabolism across development also provides additional support for the notion that CBF and metabolism are closely coupled in the brain.
Postnatal human brain development can be characterized by an initial phase of synaptic proliferation followed by a subsequent phase of synaptic pruning and the myelination of brain networks. This process begins with sensorimotor networks in childhood and concludes with higher order association cortex, most notably the prefrontal cortex in young adulthood. Brain energy utilization was initially thought to primarily support synaptic activity, 49 and consistent with this, human brain metabolism is maximal at approximately age 5 in childhood 6 when rapid brain growth and particularly synaptogenesis are occurring. The younger ages of our sample likely capture the end of this earlier developmental stage, which is characterized by a reduction in %RMR and increasing body weight-change. Sex differences in the %RMR and weight-change relationship at younger ages are due to an earlier peak body-growth in females.
While the onset of adolescence is characterized by hormonally mediated changes in the body, the end of adolescence primarily reflects changes in cognitive functions associated with identity, motivation, goals, and social interactions related to transition to adulthood. 50 After peak weight-change, both female and male %RMR were observed to decline and then asymptote to approach adult values. This transition occurs approximately two years earlier in females than in males, and %RMR values in females also appear to increase slightly after body growth rates reach zero. This late increase in relative brain metabolism may reflect neuroplastic changes associated with cognitive skill development that largely follows the development of adult physical traits in adolescence. While most of brain energy utilization has been attributed to synaptic activity, more recent estimates suggest that non-signaling processes represent a larger fraction of total brain energy consumption than was previously thought. 51 The elimination and reorganization of prefrontal synaptic connections 17 and the maturation of frontal networks involved in cognitive control that occurs in adolescence is likely also energetically demanding. A similar increase may occur in males, but is not captured in the age range of these data, since male body growth rates reach zero later.
In addition to evaluating mean CBF, estimated glucose consumption, and estimated %RMR in whole brain, we also measured these values in selected ROI to assess for regional variations. Based on prior work examining the developmental trajectory of CBF, 27 we selected precuneus, which showed an early CBF peak, and SFG, which showed a later CBF peak in that study. We observed subtle differences in the developmental trajectories of mean CBF and %RMR between precuneus and SFG, but these differences were not statistically significant. However, sex differences between these trajectories remained significant in each ROI. Accordingly, the observed sex differences in developmental trajectories of whole brain CBF and %RMR probably do not simply reflect effects of underlying regional differences in global brain metabolism.
While the observed developmental changes in regional brain function roughly parallel previously documented sex differences in brain volume changes observed in a large longitudinal cohort, wherein females reached peak cerebral volume at age 10.5 and males at age 14.5, 13 the approximately three year delay between peak cerebral volume and %RMR stabilization suggests that the observed changes in brain metabolism also do not simply reflect sex differences in underlying brain structure. Furthermore, we observed corresponding sex differences in the CBF curves while controlling for underlying brain structure by including regional gray matter density as a covariate.
There are several limitations of this study that should be noted. Firstly, a fundamental assumption of our method is that the ratio of brain glucose metabolism to CBF is roughly constant across sex, brain regions, and development in healthy subjects. This assumption reflects the widely held notion that CBF and glucose metabolism are normally coupled. 52 The constant ratio between glucose metabolism and CBF we used was derived from a recent PET study in adult males, but is comparable to the ratio that can be computed from values in an earlier source in males and females. 53 As noted above, the values we obtained for estimated brain glucose metabolism are consistent with published values based on FDG-PET data. While further validation of MRI-derived estimates of brain glucose metabolism against FDG-PET in the same subjects would be highly desirable, there are challenges in exposing healthy children and developing adolescents to ionizing radiation. This type of validation would be more realistic in healthy adults and can be obtained with concurrent ASL MRI and FDG-PET. 54 Note, that in estimating brain glucose metabolism from CBF, we also assume that brain density is constant across age, sex, brain regions, and development. Secondly, the cross-sectional nature of our analyses limits our ability to make strong conclusions about individual trajectories. Our fitted weight-change and CBF age curves may be descriptive only of the population curves. Furthermore, the use of cross-sectional data also did not allow us to statistically investigate associations between %RMR, weight-change, and cognitive measures available within the PNC neuroimaging cohort, though developmental sex differences in cognition were observed in the much larger overall PNC cohort. 55 Longitudinal data in which individual differences in weight-change, %RMR, and cognitive performance could be assessed would be required to better establish whether these individual trajectories are related. 50 Further, there are opportunities to improve the accuracy of CBF measured using ASL MRI, including improved acquisition schemes and improved modeling of CBF based on ASL MRI data. 56
Our results support the hypothesis that brain and body growth compete for resources during childhood development and further suggest that a diverging temporal sequence of body growth between males and females in adolescence is associated with sex differences in the trajectories of brain metabolism as well. The notion that brain and body compete for metabolic resources during development has implications for human health. While it may be tempting to speculate that sufficient caloric intake could eliminate brain and body competition for substrate, obesity has been shown to blunt cerebral insulin suppression, 57 a key mechanism by which metabolic substrate is diverted from the body to the brain. Existing data also suggest that childhood obesity is associated with impairments in cognitive function 58 as well as reductions in gray matter volumes. 59 Elevated BMI in childhood is also associated with earlier pubertal changes, particularly in females, 60 and could alter the normal trajectory of functional development in the adolescent brain, potentially resulting in suboptimal maturation of cognitive circuits. While changes in brain and body metabolism appear to be linked throughout development, metabolic competition is likely complex as the brain is responsible for the allocation and intake of resources that may contribute to changes in body growth and nutrient intake. 61 Our findings documented sex differences in these processes through critical stages in human development.
Footnotes
Funding
The author(s) disclosed receipt of the following financial support for the research, authorship, and/or publication of this article: The PNC was supported by RC2 grants from the National Institute of Mental Health MH089983 and MH089924. TDS was supported by R01MH107703; RTS was supported by R01NS085211, R21NS093349 and R01MH107235; DRR was supported by K01MH10260; SNV was supported by T32MH065218-13; RCG was supported by R01MH107235; REG was supported by P50MH096891. JAD was supported by R01MH080729 and P41EB015893.
Acknowledgements
The authors would like to thank Drs. Emily Falk and Allyson Mackey for their helpful comments. Thanks to the PNC acquisition and recruitment team (Monica Calkins, Jeff Valdez, Ryan Hopson, Raphael Gerraty, Marisa Riley, Jack Keefe, Elliott Yodh, and Rosetta Chiavacci); data processing (Ryan Hopson); data management (Chad Jackson); help with hypothesis testing in general additive models (Fabian Scheipl); advice on implementation of the general additive model (Aaron Alexander-Bloch and Phil Reiss).
Declaration of conflicting interests
The author(s) declared no potential conflicts of interest with respect to the research, authorship, and/or publication of this article. REG served on the Advisory Board Member for Otsuka Pharmaceuticals.
Authors’ contributions
Concept and design: JAD, REG, RCG, TDS, DRR, MAE. Acquisition of data: REG, RCG, CD, KR, MAE. Analysis and/or interpretation of data: SNV, HS, JAD, RTS, TDS, DRR, AKM, CD, AR, EDG. Drafting and/or revising the manuscript: JAD, SNV, HS, RTS, TDS, REG, RCG, AKM, DRR, KR, EDG, AR, MAE, CD.
References
Supplementary Material
Please find the following supplemental material available below.
For Open Access articles published under a Creative Commons License, all supplemental material carries the same license as the article it is associated with.
For non-Open Access articles published, all supplemental material carries a non-exclusive license, and permission requests for re-use of supplemental material or any part of supplemental material shall be sent directly to the copyright owner as specified in the copyright notice associated with the article.