
Abstract
Viscoelastic properties of the brain reflect tissue architecture at multiple length scales. However, little is known about the relation between vital tissue functions, such as perfusion, and the macroscopic mechanical properties of cerebral tissue. In this study, arterial spin labelling is paired with magnetic resonance elastography to investigate the relationship between tissue stiffness and cerebral blood flow (CBF) in the in vivo human brain. The viscoelastic modulus, |G*|, and CBF were studied in deep gray matter (DGM) of 14 healthy male volunteers in the following sub-regions: putamen, nucleus accumbens, hippocampus, thalamus, globus pallidus, and amygdala. CBF was further normalized by vessel area data to obtain the flux rate q which is proportional to the perfusion pressure gradient. The striatum (represented by putamen and nucleus accumbens) was distinct from the other DGM regions by displaying markedly higher stiffness and perfusion values. q was a predictive marker for DGM stiffness as analyzed by linear regression |G*| = q·(4.2 ± 0.6)kPa·s + (0.80 ± 0.06)kPa (R2 = 0.92, P = 0.006). These results suggest a high sensitivity of MRE in DGM to perfusion pressure. The distinct mechano-vascular properties of striatum tissue, as compared to the rest of DGM, may reflect elevated perfusion pressure, which could explain the well-known susceptibility of the putamen to hemorrhages.
Introduction
Brain function and neural health are related to the biophysical properties of cerebral tissues at a large number of scales. Biophysical properties include viscoelastic constants and fluid flow properties such as tissue perfusion—two properties which in the brain possibly influence each other.
Biological tissue is composed of multiple phases, one of which being the blood which flows through dispersed micro vessels embedded in solid tissue fractions.1–3 Even though the total brain volume occupied by blood vessels is less than 3%, the average distance between a neuron and a microvessel in brain gray matter (GM) is about 20 µm. 4 Hence, viscoelastic parameters of in vivo brain tissue reflect effective medium properties which integrate both solid and vascular properties as well as the interactions thereof.5–11
Rheological models based on poroelasticity or micro-vascular flow can predict the macroscopic mechanical response of multiphasic soft tissues such as the brain by taking into account altered fluid properties. Fluid transport in the brain refers to different phenomena measured in different units and at different temporal-spatial scales including water diffusion in white matter (WM) (∼0.8 × 10⁻³ mm2/s), 12 cerebrospinal fluid (CSF) flow through the aqueduct (∼4.3 ml/min), 13 cerebral arterial blood flow (∼650 ml/min) 14 and tissue perfusion which is normally quantified by the parameter of cerebral blood flow (CBF) in units of volume/min normalized for 100 g tissue. The scale of perfusion relates to the topology and geometry of micro vessels 15 which have been postulated to significantly influence the global shear modulus of soft biological tissues. 3 As such, CBF which ranges from 40 and 100 ml/min/100 g in human gray matter 16 potentially influences the macroscopic viscoelastic response of brain tissue in particular with regard to ex vivo methods 17 and in vivo magnetic resonance elastography (MRE). 18
Despite these intriguing relationships, CBF and viscoelasticity of the human brain have not yet been analyzed together. Here we present the first investigation pairing high-resolution, spatially resolved maps of both CBF and viscoelasticity. Both maps can be acquired in vivo using MRI without contrast agents. Arterial spin labelling (ASL) 19 is used for acquiring CBF maps. Viscoelastic maps are created by propagating mechanical waves into the brain and analyzing the resulting wave patterns with the method of MRE, 20 which has been successfully applied in studies of different neurological disorders, such as multiple sclerosis, 21 amyotrophic lateral sclerosis, 22 dementia, 23 as well as stroke24,25 and brain tumors. 26
ASL and MRE are not equally effective for imaging all brain tissues: MRE faces challenges imaging cerebral gray matter (GM) due to partial-volume effects near brain external boundaries. Quantifying white matter (WM) perfusion with ASL remains challenging due to approximately three times reduced perfusion rate than in GM 27 and roughly two times longer arterial transit times (ATT), 28 which greatly reduce signal-to-noise ratio (SNR). Consequently, this study focused on the relationship between CBF and |G*| in deep gray matter (DGM) regions containing sufficient volume to ensure statistical robustness. The present study correlated the results obtained by ASL and MRE, aiming for a synergetic biophysical-based quantification of tissue-structural differences among DGM tissues.
Material and methods
Fourteen healthy male subjects were investigated in a 3T MRI scanner (Siemens Magnetom Trio, Erlangen, Germany) after written informed consent was obtained. The study was approved by the Ethics Committees of the Charité – Universitätsmedizin Berlin in conformity with the Declaration of Helsinki. A Magnetization Prepared Rapid Acquisition Gradient Echo (MPRAGE) scan with 1 mm isotropic resolution was acquired for T1-weighted anatomical reference prior to MRE and ASL.
Multifrequency MRE
MRE was performed utilizing a head cradle actuator connected to a piezo-electrical vibration generator as detailed by Guo et al. 34 Three vibration frequencies of 30, 40 and 50 Hz were consecutively applied. Image acquisition was performed in a 12-channel radio-frequency (RF) coil using a single-shot spin-echo echo planar imaging (EPI) sequence sensitized to motion by a single-cycle bipolar motion encoding gradient (MEG). 6 Full wave field data were acquired in 40 contiguous transversal slices of 2 mm isotropic resolution. Further imaging parameters: echo time TE = 82 ms, repetition time TR = 8.49 s, matrix size 88 × 100, 20 ms single-cycle flow compensated MEG of 35 mT/m amplitude, eight acquisitions over a wave cycle. Total scan time for MRE was approximately 10 min.
MRE images were processed by a multi-frequency MRE processing pipeline to generate high-resolution maps of viscoelastic properties as outlined by Streitberger et al.
35
In short, high-resolution elastograms were obtained after the following steps: a) derivative-based unwrapping
36
after 2D Gaussian denoising of complex MRI data with 5 pixel edge size and σ = 0.65. As result, two images of in-plane strain components are obtained for each field component, i.e.
Arterial spin labelling
A pseudo-continuous arterial spin-labelling (pCASL) sequence 29 and a 32-channel RF head coil were used for perfusion imaging with 2.5 mm isotropic voxel resolution. A total of 120 volumes (60 controls and 60 labels) were acquired with a repetition time of 4.7 s resulting in an acquisition time of 10 min. The label duration of τ = 1.5 s was followed by a post-labeling delay (PLD) of w = 1.2 s and a gradient echo EPI readout covering the whole brain with 32 ascending transversal slices (0.25 mm gap), matrix size 72 × 80, echo time TE = 18 ms, and echo spacing 0.47 ms.
In order to optimize SNR and ASL scan time, we chose a label duration and PLD within the range of parameters optimized to avoid intravascular artifacts in healthy-subject ASL studies similar to ours with voxel volumes roughly six times smaller 30 than recommended for conventional clinical studies. 16 It is worth noting that the effective PLD in our study is around (2.0 ± 0.7) s in DGM resulting from the 2-s long high-resolution EPI readout with slices acquired in ascending order. The PLD should be just longer than the longest arterial transit time present in the brain varying between 500 ms and 1500 ms for gray matter of healthy subjects depending on the tissue location. 16 Properly selected longer PLDs should be used for the applications in patient populations with increased transit times. 16
ASLtbx
31
was used without smoothing for quantifying CBF in units of ml/100 g/min from the pCASL signal difference ΔM of control and label images using the formula16,32

For the present work, the following parameters were used: T1 = 1664 ms for the longitudinal relaxation time of the blood at 3 T, α = 0.85 for the labeling efficiency. M0 is the equilibrium magnetization of the local tissue element in the control image. The brain–blood water partition coefficient λ = 0.9 ml/g calibrates CBF to units of ml/mg assuming instantaneous exchange of labeled water protons between blood and tissue—an assumption which has been discussed in the literature since long.
61
Although typically λ is used with the dimension of ml/g, it can be given as dimensionless ratio λ′ in g/g and it changes with the type of tissue (from 0.96 g/g whole brain to 1.04 g/g in gray matter.
62
We henceforth considered the cerebral blood flow in the dimension 1/s which represents the rate of transport of unit blood volume, i.e.

Flux rate and perfusion pressure gradient
To account for the local perfusion pressure gradient, CBF values were normalized to the mean area of the transport pipelines A obtained from non-invasive vessel size imaging employing hypercapnia in healthy subjects.
33
As a result, the flux rate q through the capillary bed in 1/s was obtained

A relates to the density N of capillaries (number per mm2) and mean radii r of the micro vessels as measured by vessel size imaging.
33
q is the specific transport velocity of blood through the area of the vessels, i.e. discharge per unit area. Since we accounted above for CBF' as flow of unit volume and A as normalized vessel area, q is the flux rate of blood through the normalized vessel area. This model resembles fluid flow through porous media. In poroelasticity theory, Darcy's law relates the fluid flux rate through a porous material with the pressure gradient

We adopted this relationship by taking κ as the hydraulic conductivity within the capillary system of DGM and
Opposed to equation (4), the flux rate q given in equation (3) and used throughout the paper has a scalar value since we did not consider any directionality of A which would require analysis of the components of q along the normals of the area through which the blood traverses. In further distinction to Darcy’s law, we only considered vascular spaces in A and did not account for the total tissue area. Hence, the CBF signal normalized by the vessel size A gave us a measure of vascular flux rate q of blood driven by the magnitude perfusion pressure gradient

As example, a CBF of 45 ml/min/100 g as measured in the putamen in our study, a mean vessel radius of 6.2 µm, 33 λ′ = 0.96 g/g, and an approximated vessel density52,63 of N = 400/mm2 gave q = 0.17 s−1.
Post-processing of CBF- and MRE-maps
All images were post-processed using Matlab (MathWorks, Natick, MA, USA), SPM12 (Wellcome Trust Centre for Neuroimaging, London, UK) and the FMRIB Software Library (FSL v. 5, Oxford Centre for Functional MRI of the Brain, Oxford, UK) for correcting motion and field distortion artifacts.
Before parameter quantification, subject motion and geometric distortions induced by B0 inhomogeneities were corrected with a pipeline increasing the spatial precision for both magnitude-based contrasts (e.g. ASL) and phase-based contrasts (e.g. MRE).
40
In order to allow for inter-subject statistics, all individual CBF and MRE maps were normalized to fit the dimensions of the Neuromorphometrics atlas of brain regions (neuromorphometrics.com) delivered by SPM12 in the anatomical standard space defined by the Montreal Neurological Institute brain template (MNI)
41
by employing the combined spatial normalization and segmentation algorithm included in SPM12. For morphing the individual maps to the template space, the default of 1176 parameters was employed by the SPM routine for optimizing the non-linear 3D deformation field based on linear combinations of discrete cosine transform basis functions. The tissue probability map of CSF was used to eliminate voxels in the vicinity (within a radius of 2 mm) of CSF in order to avoid partial volume effects
42
influencing the analysis. The combination of co-registration and removal of CSF boundary pixels resulted in small numbers of remaining voxels in some DGM tissues which threatened statistical robustness. We therefore analyzed only those regions in which more than 30% of all pixels were preserved after the removal of boundary pixels. Overall six regions fulfilled this criterion (see Figure 1): putamen (Pu), nucleus accumbens (Ac), hippocampus (Hi), thalamus (Th), globus pallidus (Pa) and amygdala (Am). Average |G*|, ϕ, and CBF values of all subjects were calculated in each region separately.
Analyzed deep-gray matter regions of the Neuromorphometrics Atlas in MNI space. Red: Nucleus Accumbens (Ac), yellow: Putamen (Pu), green: Hipplocampus (Hi), pink: Amygdala (Am), orange: Thalamus (Th), blue: Globus Pallidus (Pa).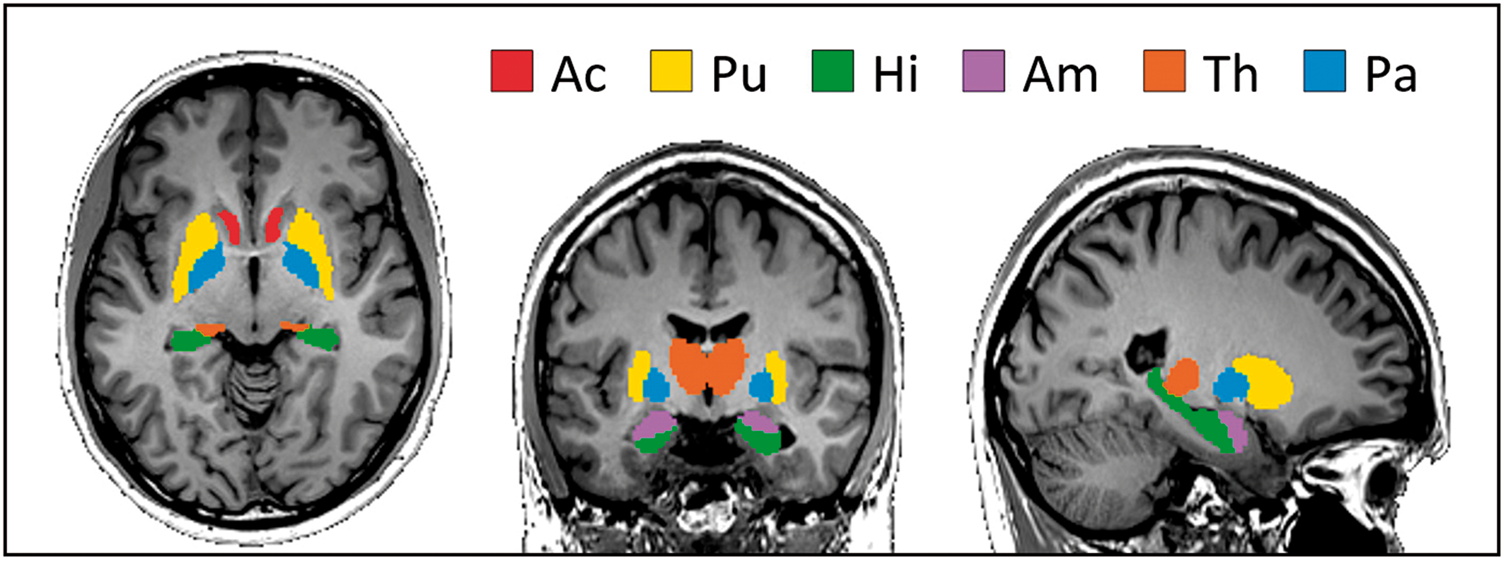
A two-tailed t-test with a 5% significance level was applied to the regional comparisons of |G*|, ϕ and CBF. The Holm-Bonferroni method 43 was used to detect DGM areas that can be significantly separated. The correlation between parameters was tested by Pearson’s pairwise linear correlation coefficient. All coefficients of determination R2 of linear regressions were adjusted for the number of observations and the number of variables. Cluster analysis for the |G*|-CBF space was performed by a post-hoc silhouette analysis. 44 Clusters and silhouettes were generated in Matlab using the kmeans and silhouette functions.
Results
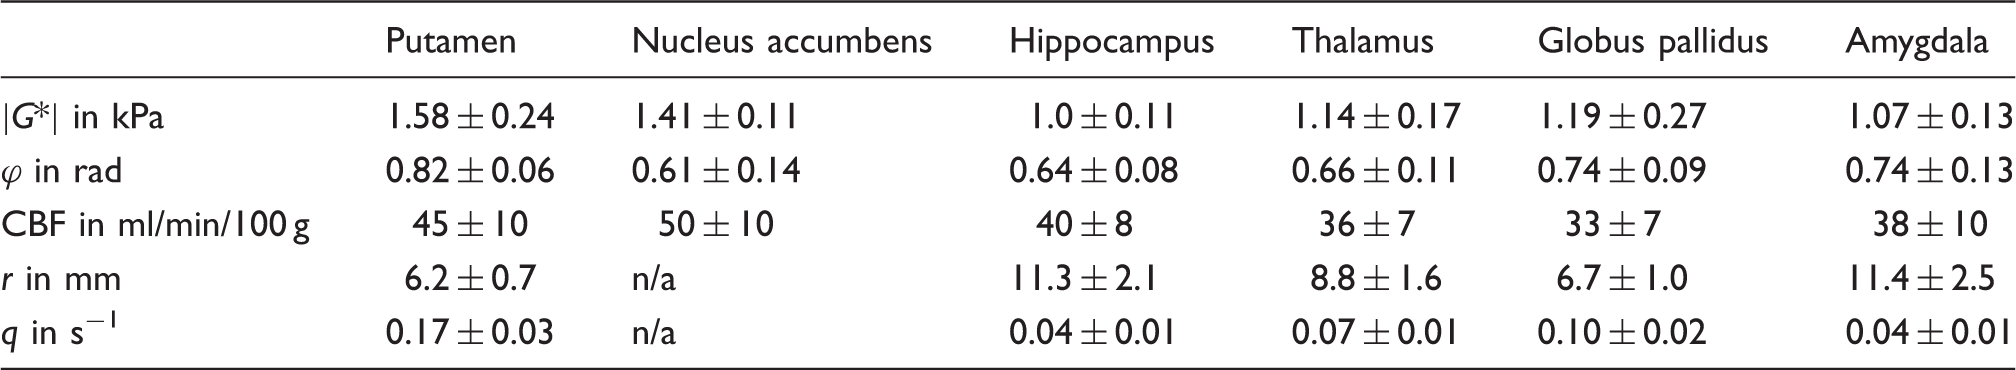
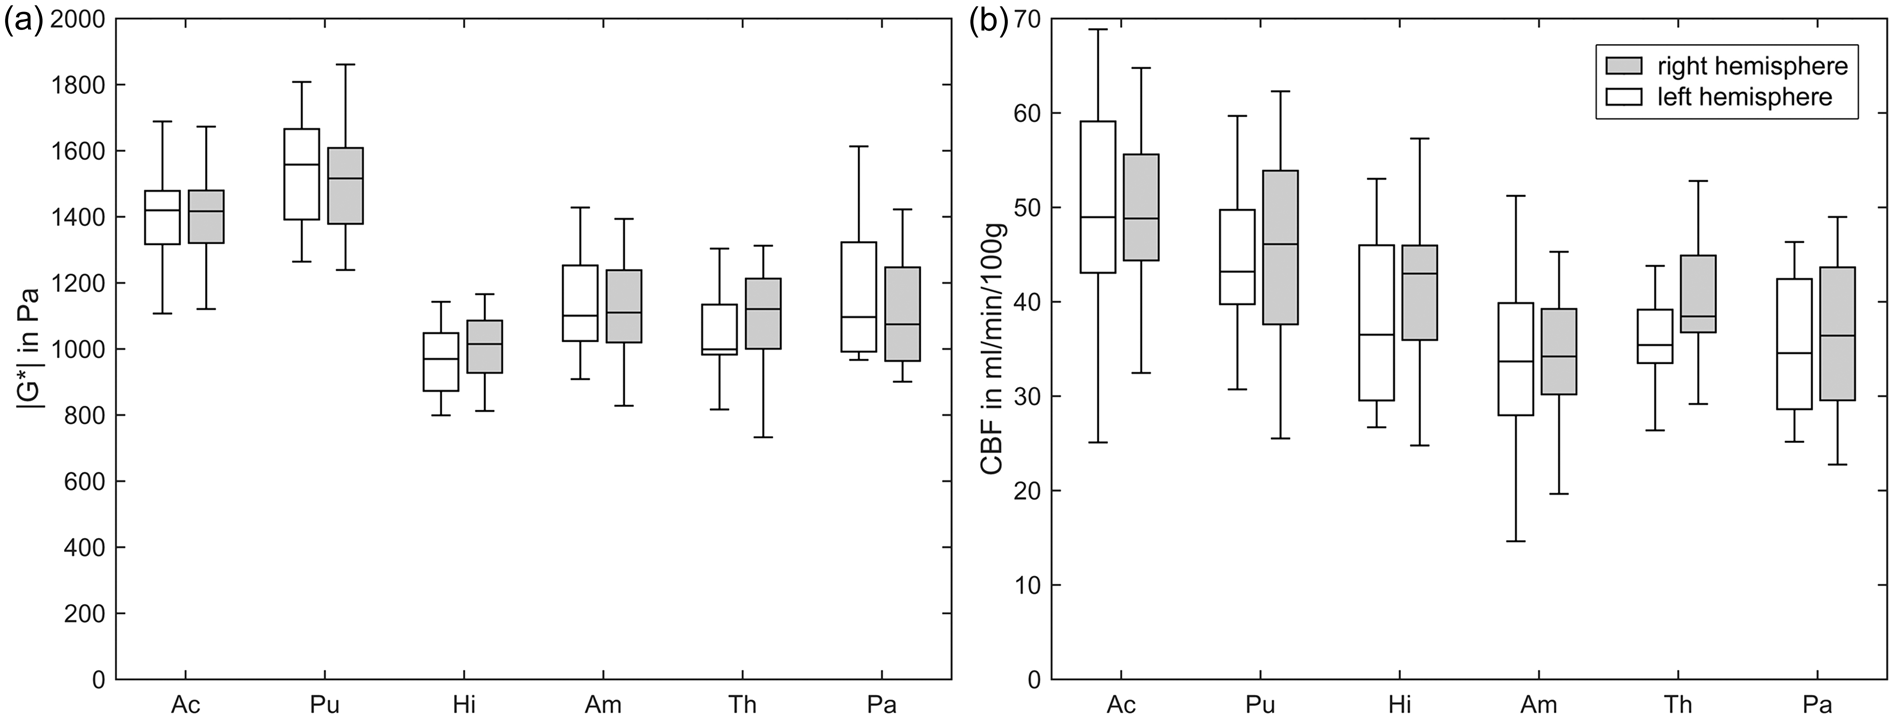
Figure 2 shows three group-mean |G*|- and CBF maps and corresponding T1-weighted anatomical scans with the six analyzed DGM regions corresponding to the regions shown in Figure 1 and according to the Neuromorphometrics Atlas. Group mean |G*| and CBF values are listed in Table 1. Figure 3 additionally shows values independently obtained from the right and left hemisphere indicating the consistency of values with respect to inter-hemispherical symmetry. Therefore, the analysis proceeded using the values averaged over both contra lateral regions.
Six slices of the three-dimensional |G*| map (a) and CBF map (b) averaged over 14 volunteers and corresponding T1-weighted anatomical scans with the six analyzed DGM regions (c). Note that apparently high stiffness values in putamen (yellow) are associated with relatively high CBF values. Color codes correspond to Figure 1. Characteristic values for the analyzed deep gray matter regions. Note: Shear-modulus magnitude |G*|, shear-modulus phase angle ϕ, cerebral blood flow (CBF), vessel radius r from literature
33
and the corresponding flux rate q in deep gray matter regions. Tolerance values reflect the inter-subject variability. Stiffness |G*| (a) and cerebral blood flow CBF (b) obtained by MRE and ASL in six DGM regions (sorted by average CBF value) analyzed in both hemispheres, indicating the consistency of values with respect to inter-hemispherical symmetry: no significant differences were observed between the hemispheres in all regions. Note high stiffness and perfusion values of the striatal DGM areas (Pu and Ac).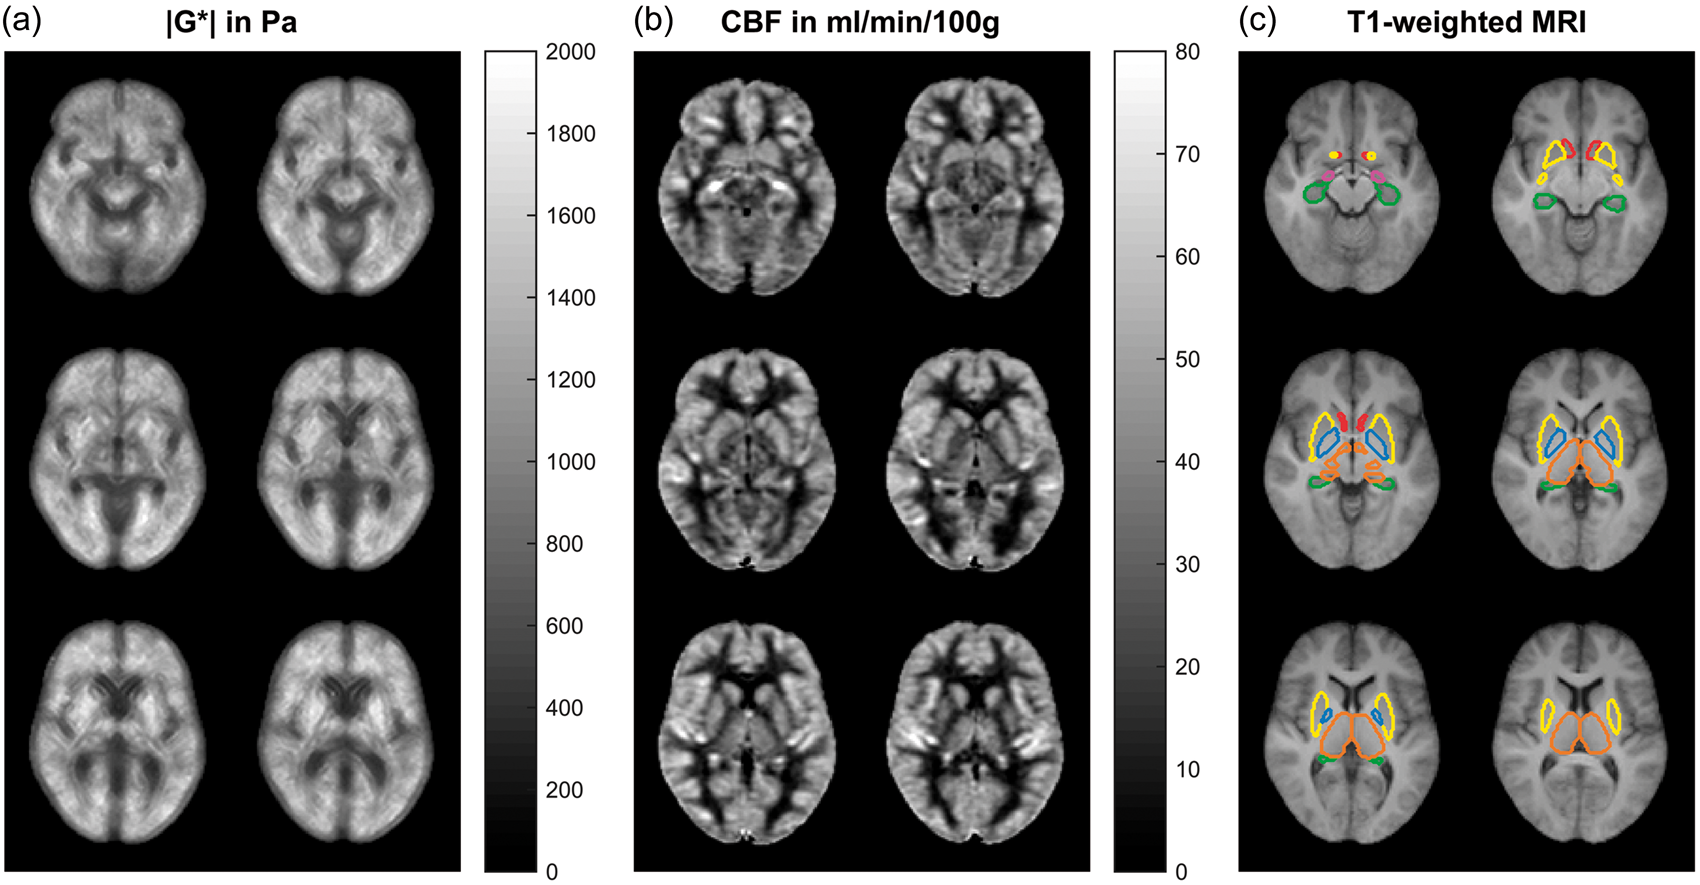
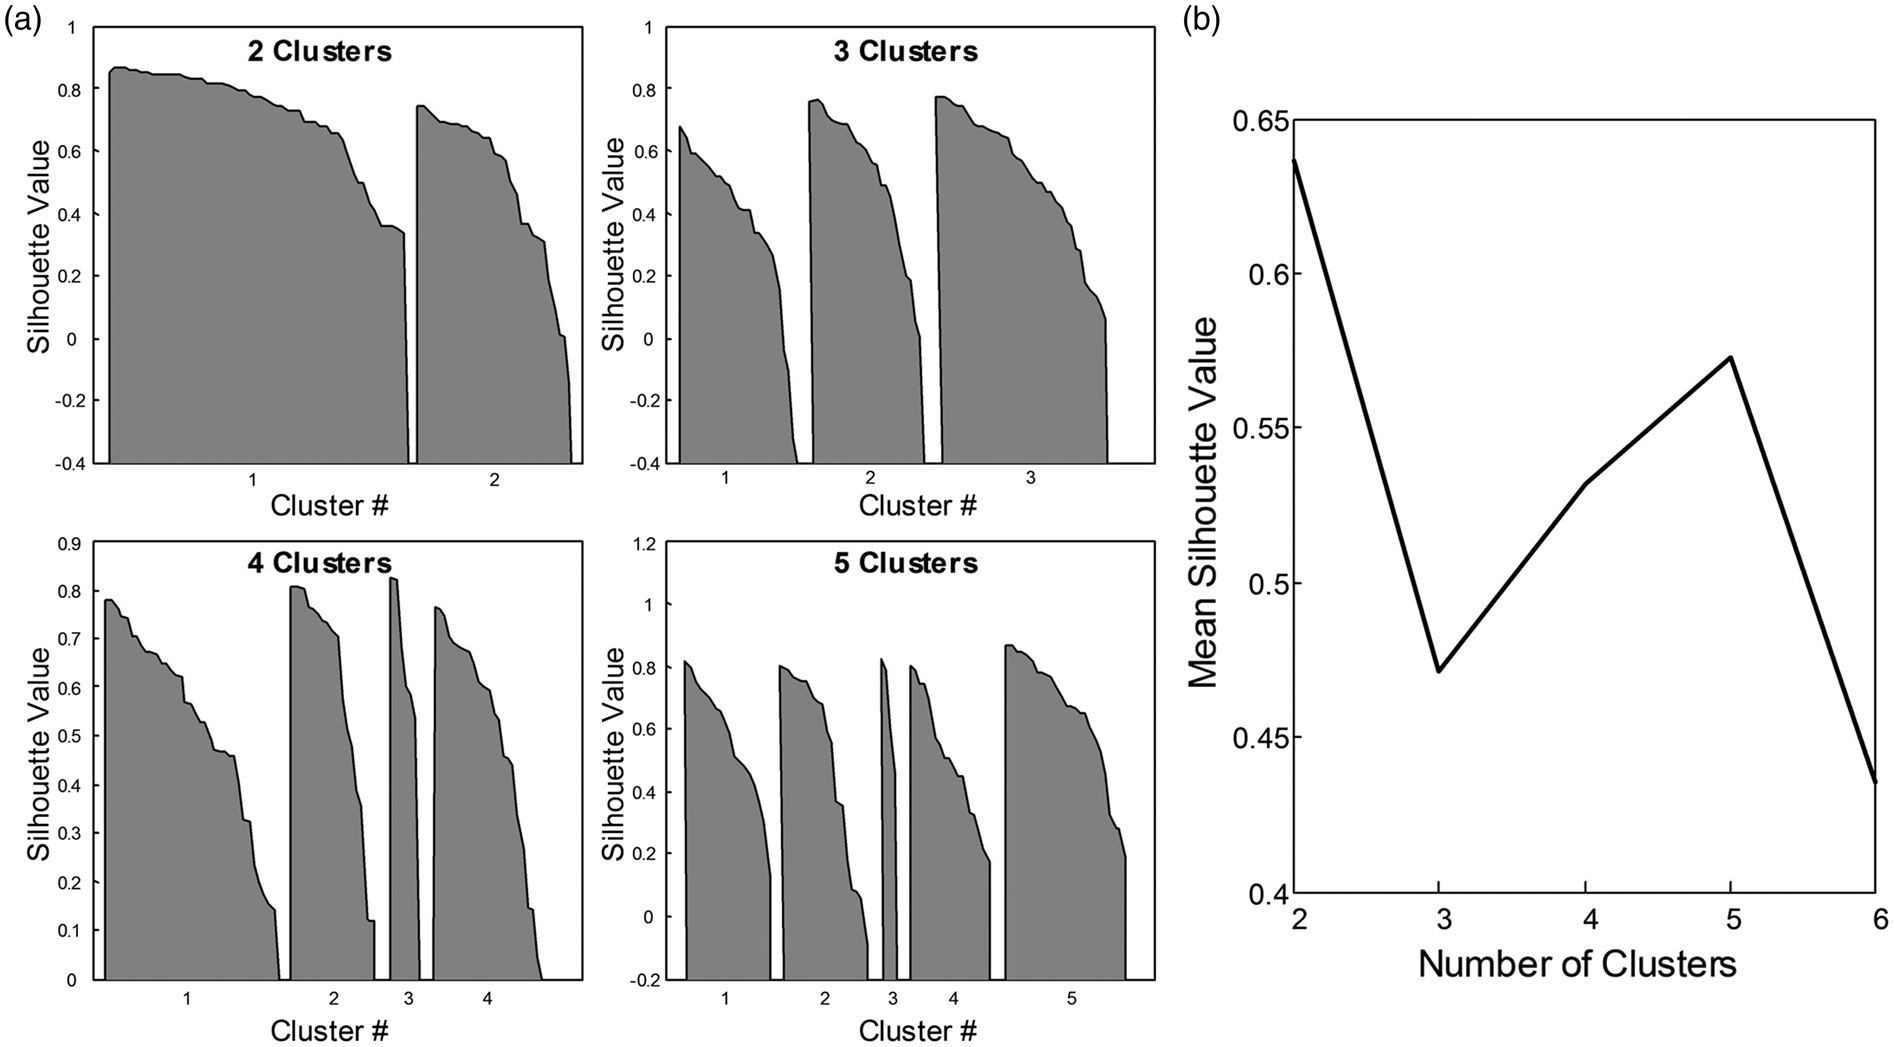
By group analysis, the striatum region (represented by Pu and Ac) displayed higher |G*| and CBF values than the rest of DGM (|G*| = 1.49 ± 0.16 vs. 1.10 ± 0.14 kPa, P = 8.7 × 10⁻¹¹; CBF = 47 ± 10 vs. 37 ± 7 ml/100g/min, P = 3.0 × 10⁻⁶). The significance of discriminating between DGM regions based on MRE and ASL is indicated by the plot of P-values in Figure 4. Interestingly, MRE separates putamen (Pu) from all other regions while CBF exhibits a larger overlap as demonstrated by silhouette plots for |G*| and CBF by region shown in Figure 5(a). There it can be seen that a two-cluster partition of striatum tissue (Pu, Ac) versus the rest of DGM (Pa, Th, Am, Hi) produces the highest separation values quantified as the highest mean silhouette value for the chosen partition (0.63 mean silhouette distance).
P-values based on paired Student's t-tests for discriminating regions by |G*| and CBF with MRE below and ASL above the matrix diagonal. In contrast to ASL, putamen (Pu) can be significantly separated from all other regions by MRE. Significant values after Holm-Bonferroni correction for multiple tests are marked by a red star. K-means silhouette analysis for |G*|-CBF data. In panel (a), silhouette values (distance of each value in a cluster from all other clusters) are shown for choices of 2, 3, 4, and 5 partitions, respectively. The mean silhouette value for a choice of partition is commonly used to identify best fit of partition choice. Panel (b) shows that a partitioning of the data into two clusters produces the best separation of the |G*|-CBF data as indicated by the highest mean silhouette value.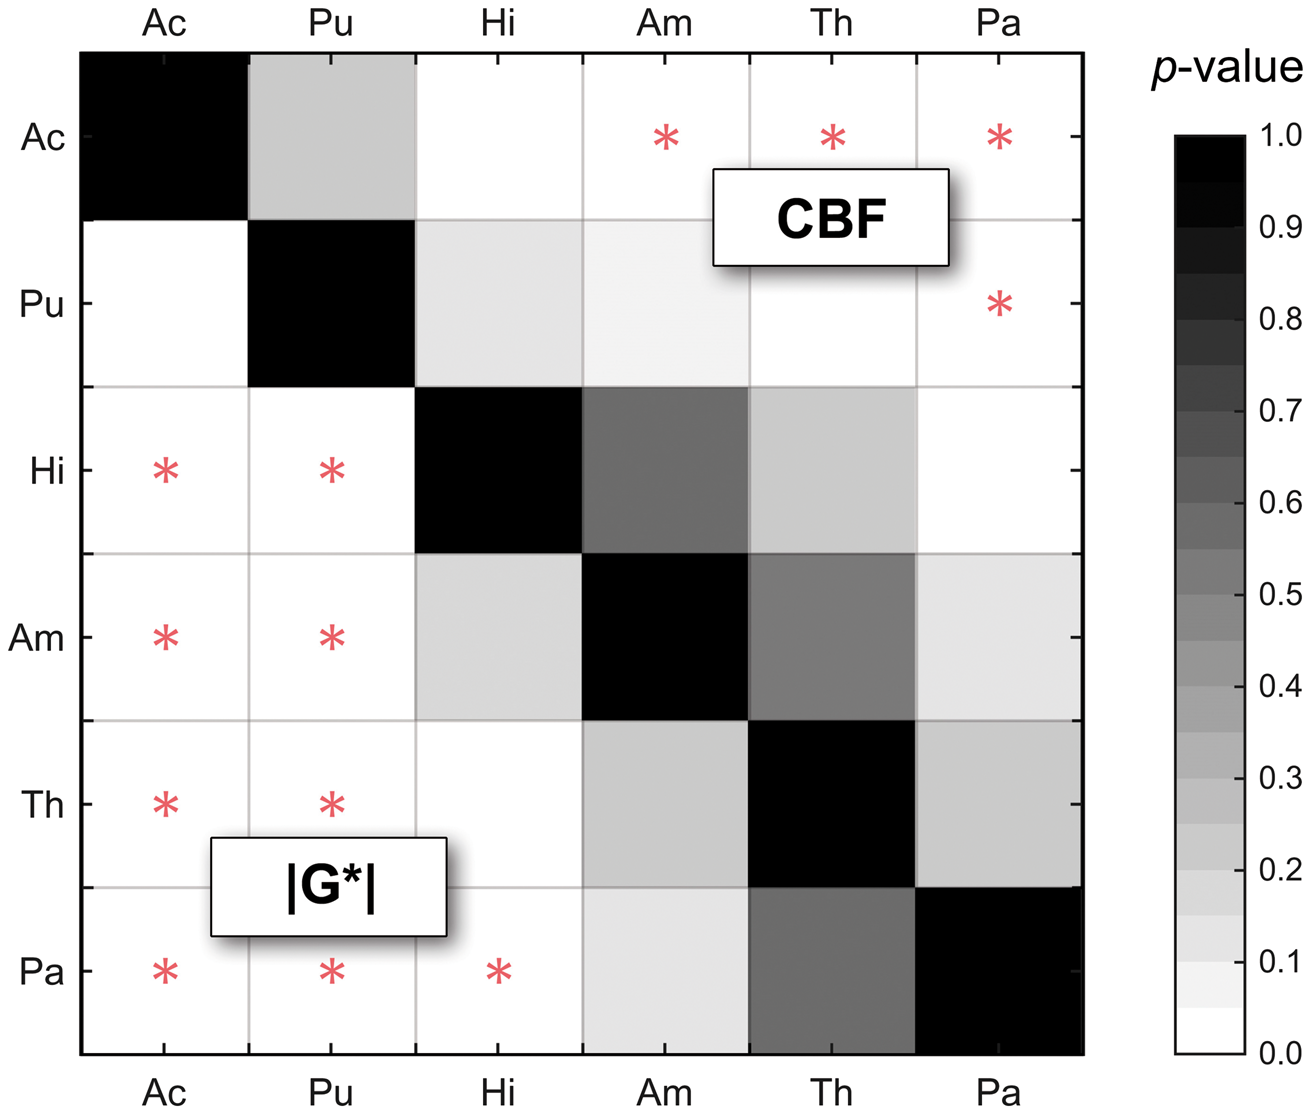
While the group-analysis based on pooled data showed no significant linear correlation between |G*| and CBF (R2 = 0.28, P = 0.16), the non-striatal cluster showed a strong inverse correlation (R2 = 0.93, P = 0.02). This linear decrease of |G*| with increasing CBF is well demonstrated in Figure 6(a) by the Hi, Th, Pa and Am regions. In this |G*|-CBF space, the striatum regions appear well separated from the rest of DGM. Notably, the clustering of two distinct regions is not perceivable on either of the two parameters’ axes alone. No correlation between phase angle ϕ and CBF was observed (R2 = 0.04, P = 0.71 for pooled data; R2 = 0.02, P = 0.44 for non-striatal DGM regions).
In vivo DGM of the human brain characterized by MRE and ASL. (a) The cluster of non-striatal DGM (Pa, Th, Am, Hi) reveals an inverse correlation between tissue stiffness (|G*|) and perfusion (CBF) in these regions. (b) When normalizing CBF by the mean cross-sectional vessel area (according to the five r-values given in Table 1), stiffness of all DGM areas including the putamen can be predicted from the flux rate q based on a linear regression model. Error bars reflect the standard error of the mean.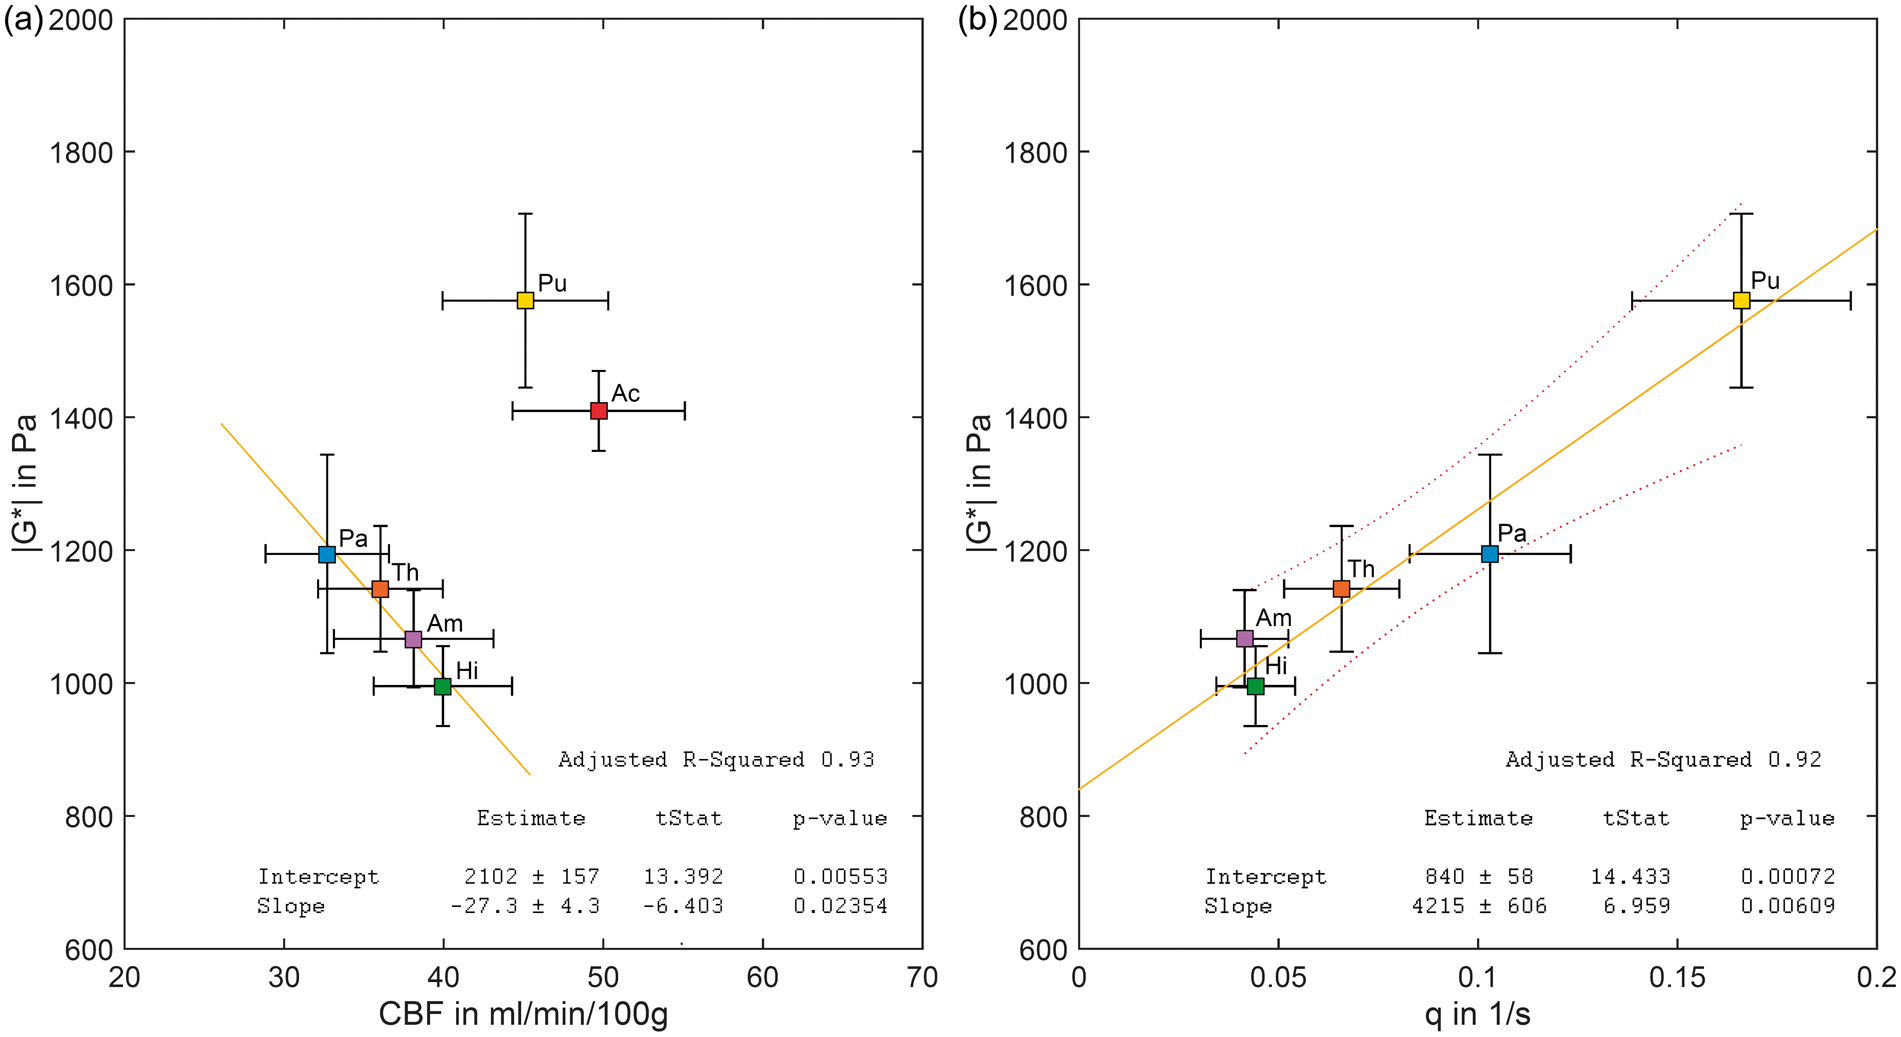
To further analyze the origin of the two clusters in Figure 6(a) which separate the striatum from the rest of DGM, we derived the flux rate q, that is CBF normalized to the vessel size area A (see equation (3)) based on values reported in the literature. 33 Figure 6(b) shows, when normalizing CBF by A, the previously observed inverse correlation within non-striatal DGM regions changes to a positive correlation between |G*| and q, now covering all DGM regions for which A values could be calculated, including the putamen. Linear regression showed that |G*| in DGM is strongly correlated to flux rate (R2 = 0.922) resulting in |G*| = (0.80 ± 0.06) kPa + q · (4.2 ± 0.6) kPa·s. While the offset (P = 0.0007) has the physical unit of elasticity, the slope (P = 0.0061) of this linear equation has the physical unit of viscosity. No significant correlation between phase angle ϕ and q was observed (R2 = 0.52, P = 0.11). Table 1 summarizes regional MRE and ASL values measured in this study as well as vessel size data from the literature and derived flux rates q.
Discussion
Effective-medium physical properties of biological tissues are becoming increasingly relevant for a quantitative clinical diagnosis based on medical imaging. In the brain, tissue perfusion and viscoelastic parameters have been shown to be highly sensitive to physiological effects and disease.45,46 Our study shows that perfusion alters the effective medium properties in the brain similar to recent findings in abdominal organs after water intake. 47 Dittmann et al. reported an increase of stiffness of the liver with increased blood volume after water ingestion while stiffness reduced with increasing blood volume in the pancreas and spleen. 47 The authors discussed the opposite behavior of pancreas/spleen tissue versus liver based on the increased solid-to-fluid fraction in compliant tissue such as pancreas/spleen as opposed to the encapsulated liver which yields an increased perfusion pressure after water intake. This demonstrates the intricate relationship between blood perfusion and effective stiffness of in vivo tissue that may also play a role in DGM: Scenario 1 in our study is reflected by the inverse correlation of |G*| with CBF suggesting the softening of tissue at higher fluid volume fractions (Figure 6(a)). Scenario 2 is reflected by the positive correlation of |G*| and q, which takes into account that CBF is transmitted through different mean vessel areas A (Figure 6(b)). The difference between the two could be related to the intravascular pressure which is higher in smaller vessels or in vessels confined by non-compliant tissue.
The distinction between striatum and the other analyzed DGM regions within the |G*|-CBF space suggests a distinct microstructure of the striatum. The medium-spiny neurons which make up 95% of the neuronal population of the striatum 48 are supplied by blood through a tight meshwork of capillaries with, on average, smaller mean vessel sizes than other DGM regions. It has been considered that this anatomical peculiarity constitutes a reason for the high prevalence of putaminal hemorrhages, that account for half of the brain hemorrhage cases.49,50 The steepest pressure gradient is located in the capillary bed that offers the largest hemodynamic resistance to the cortical blood supply 51 and is thus most vulnerable to vascular rupture, e.g. in hypertension. 49 Our data demonstrate the feasibility of using MRE in DGM as an imaging marker for characterizing tissue with elevated vascular pressure. Pressure-related tissue parameters seem to be better addressed by MRE which measures modulus values in kPa than by ASL which needs further information such as vessel size and vessel density. Specifically, the mean vessel density is difficult to resolve locally by MRI as suggested by the large variety of data in the literature. For this reason, we used an averaged mean vessel density of N = 400/mm2 since no significant differences were found in N among DGM regions. 52
As a limitation of our study, details in cortical gray matter were not resolved by MRE, since in MRE, cortical GM is considered prone to artifacts due to abundant tissue boundaries and has thus been excluded from many studies.34,42,53,54
A further limitation is that we report only ground truth values measured in the autoregulatory regime in healthy volunteers. This means that the hydraulic conductivity κ (or vascular resistance) in equation (4) is highly regulated in order to maintain a constant blood flow despite variation in
Furthermore, we expected ϕ, as a measure of intrinsic viscosity, to be sensitive to CBF. However, previous analysis has shown ϕ to be highly sensitive to tissue heterogeneities when obtained via algebraic inversion in a way that |G*| is not.55,56 The correlation between ϕ and CBF was likely lost to noise using the present approach, and analysis methods not limited by homogeneity assumptions may in future reveal significant differences in ϕ of DGM which elude the present study. 57
In summary, a correlation of tissue stiffness (|G*|) and average perfusion per vessel size area (flux rate, CBF/A) was observed in deep gray matter when accounting for structurally and functionally distinct areas. In the |G*|-CBF space, globus pallidus, hippocampus, thalamus and amygdala clearly cluster from putamen and nucleus accumbens which indicates intrinsic differences in the perfusion pressure gradient. These differences in the microstructural hemodynamic function between the striatum and other deep gray matter regions are not detectable by ASL alone. MR elastography appears to be a promising imaging method for future clinical neuroimaging studies that investigate, for example, the dynamics of stroke 25 or disorders with striatal involvement such as schizophrenia, 58 obesity, 59 or substance addiction. 60
Footnotes
Funding
The author(s) disclosed receipt of the following financial support for the research, authorship, and/or publication of this article: IS and JB received funding from the German Research Foundation (grant no. Sa 901/16). Furthermore, IS received funding from the German Federal Ministry of Education and Research (BMBF 01GQ1408) and from the European Union's Horizon 2020 Programme (ID 668039, EU FORCE – Imaging the Force of Cancer).
Acknowledgements
The authors would like to thank Martin Weygandt, Thomas Christophel and Christian Labadie for the helpful discussions.
Declaration of conflicting interests
The author(s) declared no potential conflicts of interest with respect to the research, authorship, and/or publication of this article.
Authors’ contributions
SHe and IS conceived and designed the experiments. SHe, PB, AF, Shi, and FD performed the experiments. SHe, IS, and PB were involved in the analysis and interpretation of the data, alongside AF, EB and JB. IS and SHe wrote the manuscript and all authors provided critical revisions.