
Abstract
Positron emission tomography (PET) imaging of the translocator protein (TSPO) is widely used as a biomarker of microglial activation. However, TSPO protein concentration in human brain has not been optimally quantified nor has its regional distribution been compared to TSPO binding. We determined TSPO protein concentration, change with age, and regional distribution by quantitative immunoblotting in autopsied human brain. Brain TSPO protein concentration (>0.1 ng/µg protein) was higher than those reported by in vitro binding assays by at least 2 to 70 fold. TSPO protein distributed widely in both gray and white matter regions, with distribution in major gray matter areas ranked generally similar to that of PET binding in second-generation radiotracer studies. TSPO protein concentration in frontal cortex was high at birth, declined precipitously during the first three months, and increased modestly during adulthood/senescence (10%/decade; vs. 30% for comparison astrocytic marker GFAP). As expected, TSPO protein levels were significantly increased (+114%) in degenerating putamen in multiple system atrophy, providing further circumstantial support for TSPO as a gliosis marker. Overall, findings show some similarities between TSPO protein and PET binding characteristics in the human brain but also suggest that part of the TSPO protein pool might be less available for radioligand binding.
Keywords
The 18-kDa translocator protein (TSPO), previously known as peripheral benzodiazepine receptor, 1 was initially described as the high affinity binding site in peripheral tissues, e.g. kidney for the atypical benzodiazepine Ro5-4864. 2 This binding site was also found in healthy brain of animals (e.g. rats) though of a much lower concentration than that in peripheral organs.3,4 A variety of animal models of brain injury was found to have a marked increase in levels of the binding site in the damaged brain, assessed with tritium-labelled Ro5-4864 and/or the prototypical TSPO ligand PK11195,5–11 which was associated with activated glial cells, in particular, microglia.5,10–12 Although TSPO function is not understood and continues to be debated,13–19 over the past 30 years, brain imaging with positron-labelled radioligands binding to TSPO by positron emission tomography (PET) has been extensively employed as a biomarker of microglial activation or more generally, often ill-defined “neuroinflammation”. A number of PET radiotracers for TSPO have been developed and employed in clinical research of different neuropsychiatric conditions. Examples include [11C](R)-PK11195, the first generation TSPO ligand,20,21 but limitations of its lower sensitivity and higher non-specific binding in vivo led to development of many second generation ligands with improved affinity and specificity, e.g. [11C]PBR28,22,23 [18F]-FEPPA,24–28 [18F]DPA-714,29,30 [18F]-PBR111,31,32 and [18F]GE-18033,34 (see literature35,36 for reviews).
Despite TSPO’s wide use as a PET microglial imaging target, some basic questions remain: thus, it is surprising that actual levels of TSPO protein in healthy human brain are still uncertain. In this regard, our knowledge on TSPO abundance in human brain has been largely derived from radioligand binding assay and autoradiography using [3H]Ro5-4864, 37 [3H]PK1119537–46 or the stereo-specific [3H](R)-PK1119547–50 and more recently also the second generation ligands [3H]DAA110648,49 and [3H]PBR28. 46 However, these assays have produced inconsistent results on estimates of concentrations of the TSPO binding site in postmortem human brain (see Supplementary Table 1 for a review and the Discussion37–50; see also Cumming et al. 35 for a general discussion on the discrepancy between in vitro and in vivo TSPO binding measures). There has also been no systematic examination of the extent of correlation between regional brain TSPO levels and in vivo PET outcome measures of TSPO binding. Therefore, it is unknown whether the outcome measures of PET TSPO binding obtained at tracer dose of a radioligand by kinetic modeling are quantitatively related to actual levels of its target protein in brain. It is also uncertain whether human aging is associated with increased levels of the biomarker of microglial activation, with inconsistent findings in the PET literature.32,51–56 Finally, in comparison to the extensive literature on PET TSPO binding in human brain disorders, there is still only limited information on the behavior of brain TSPO protein assessed quantitatively in degenerative conditions in which gliosis is known to be present.5,9,20,41,44,49,50,57–60 The present study was designed to address the above literature deficiencies by employing quantitative immunoblotting and recombinant TSPO to measure TSPO protein in normal (including regional distribution) and developing/aging human brain and in degenerating brain of persons with multiple system atrophy (MSA), a movement disorder associated with brain gliosis.61–64 For the regional and aging studies, we also employed glial fibrillary acid protein (GFAP), a widely used, arguably the most specific, astroglial marker for comparison with TSPO, a putative microglial marker that was shown to be also expressed in astrocytes, perhaps to a minor extent, in normal human brain 65 (see also Guilarte 66 ). GFAP also served as a control protein, with its levels calibrated in postmortem human brain by a sandwiched ELISA assay. 67
Materials and methods
Subjects
All procedures were approved by the Research Ethics Board of the Centre for Addiction and Mental Health (Toronto, Canada) and performed in accordance with the TriCouncil Policy Statement: Ethical Conduct for Research Involving Humans (TCPS 2) and Personal Health Information Protection Act (PHIPA 2004). Informed consent was obtained from all donors or their next of kin. A total of six (4M/2F) autopsied brains from neurologically normal subjects [age: 48 [0.8] (47–49) years; postmortem interval (PMI): 16 [7] (5.25-23) hours; mean [SD] (range)] were used in the TSPO regional distribution study (see Table 2 for a full list of the cortical and subcortical regions sampled). To evaluate age and development related changes of TSPO and GFAP, frontal cortex (Brodmann area 10) from a total of 69 subjects (42M/27F) was used, with age ranging from 21 hours to 99 years old and a mean PMI of 13 [6] (3–27) hours (see Tong et al. 68 for details including causes of death. Neuropathological examination of the fixed half brain did not disclose any obvious pathological changes in these subjects). For evaluation of TSPO as a marker of microgliosis, autopsied brains (putamen) were obtained from patients with multiple system atrophy (MSA, n = 9) and matched controls (n = 16). No significant difference was found in postmortem interval (hours) (control: 12 [5]; MSA: 14 [6]; mean [SD]) or age (years) (control: 71 [8]; MSA: 65 [10]) among the two groups. The causes of death for the aged controls were cardiovascular illnesses (10), bronchopneumonia (2), pulmonary edema (2), breast cancer (1), and natural death (1). One half-brain was used for neuropathological examination, whereas the other half was frozen for neurochemical analyses. Neuropathological findings of neuronal loss by routine haematoxylin-eosin stain and assessments of the pathological hallmarks including Lewy bodies, glial cytoplasmic inclusions and neurofibrillary tangles in brains of patients with MSA were previously reported.62,69,70
Tissue sample preparation, SDS-PAGE, and Western blotting
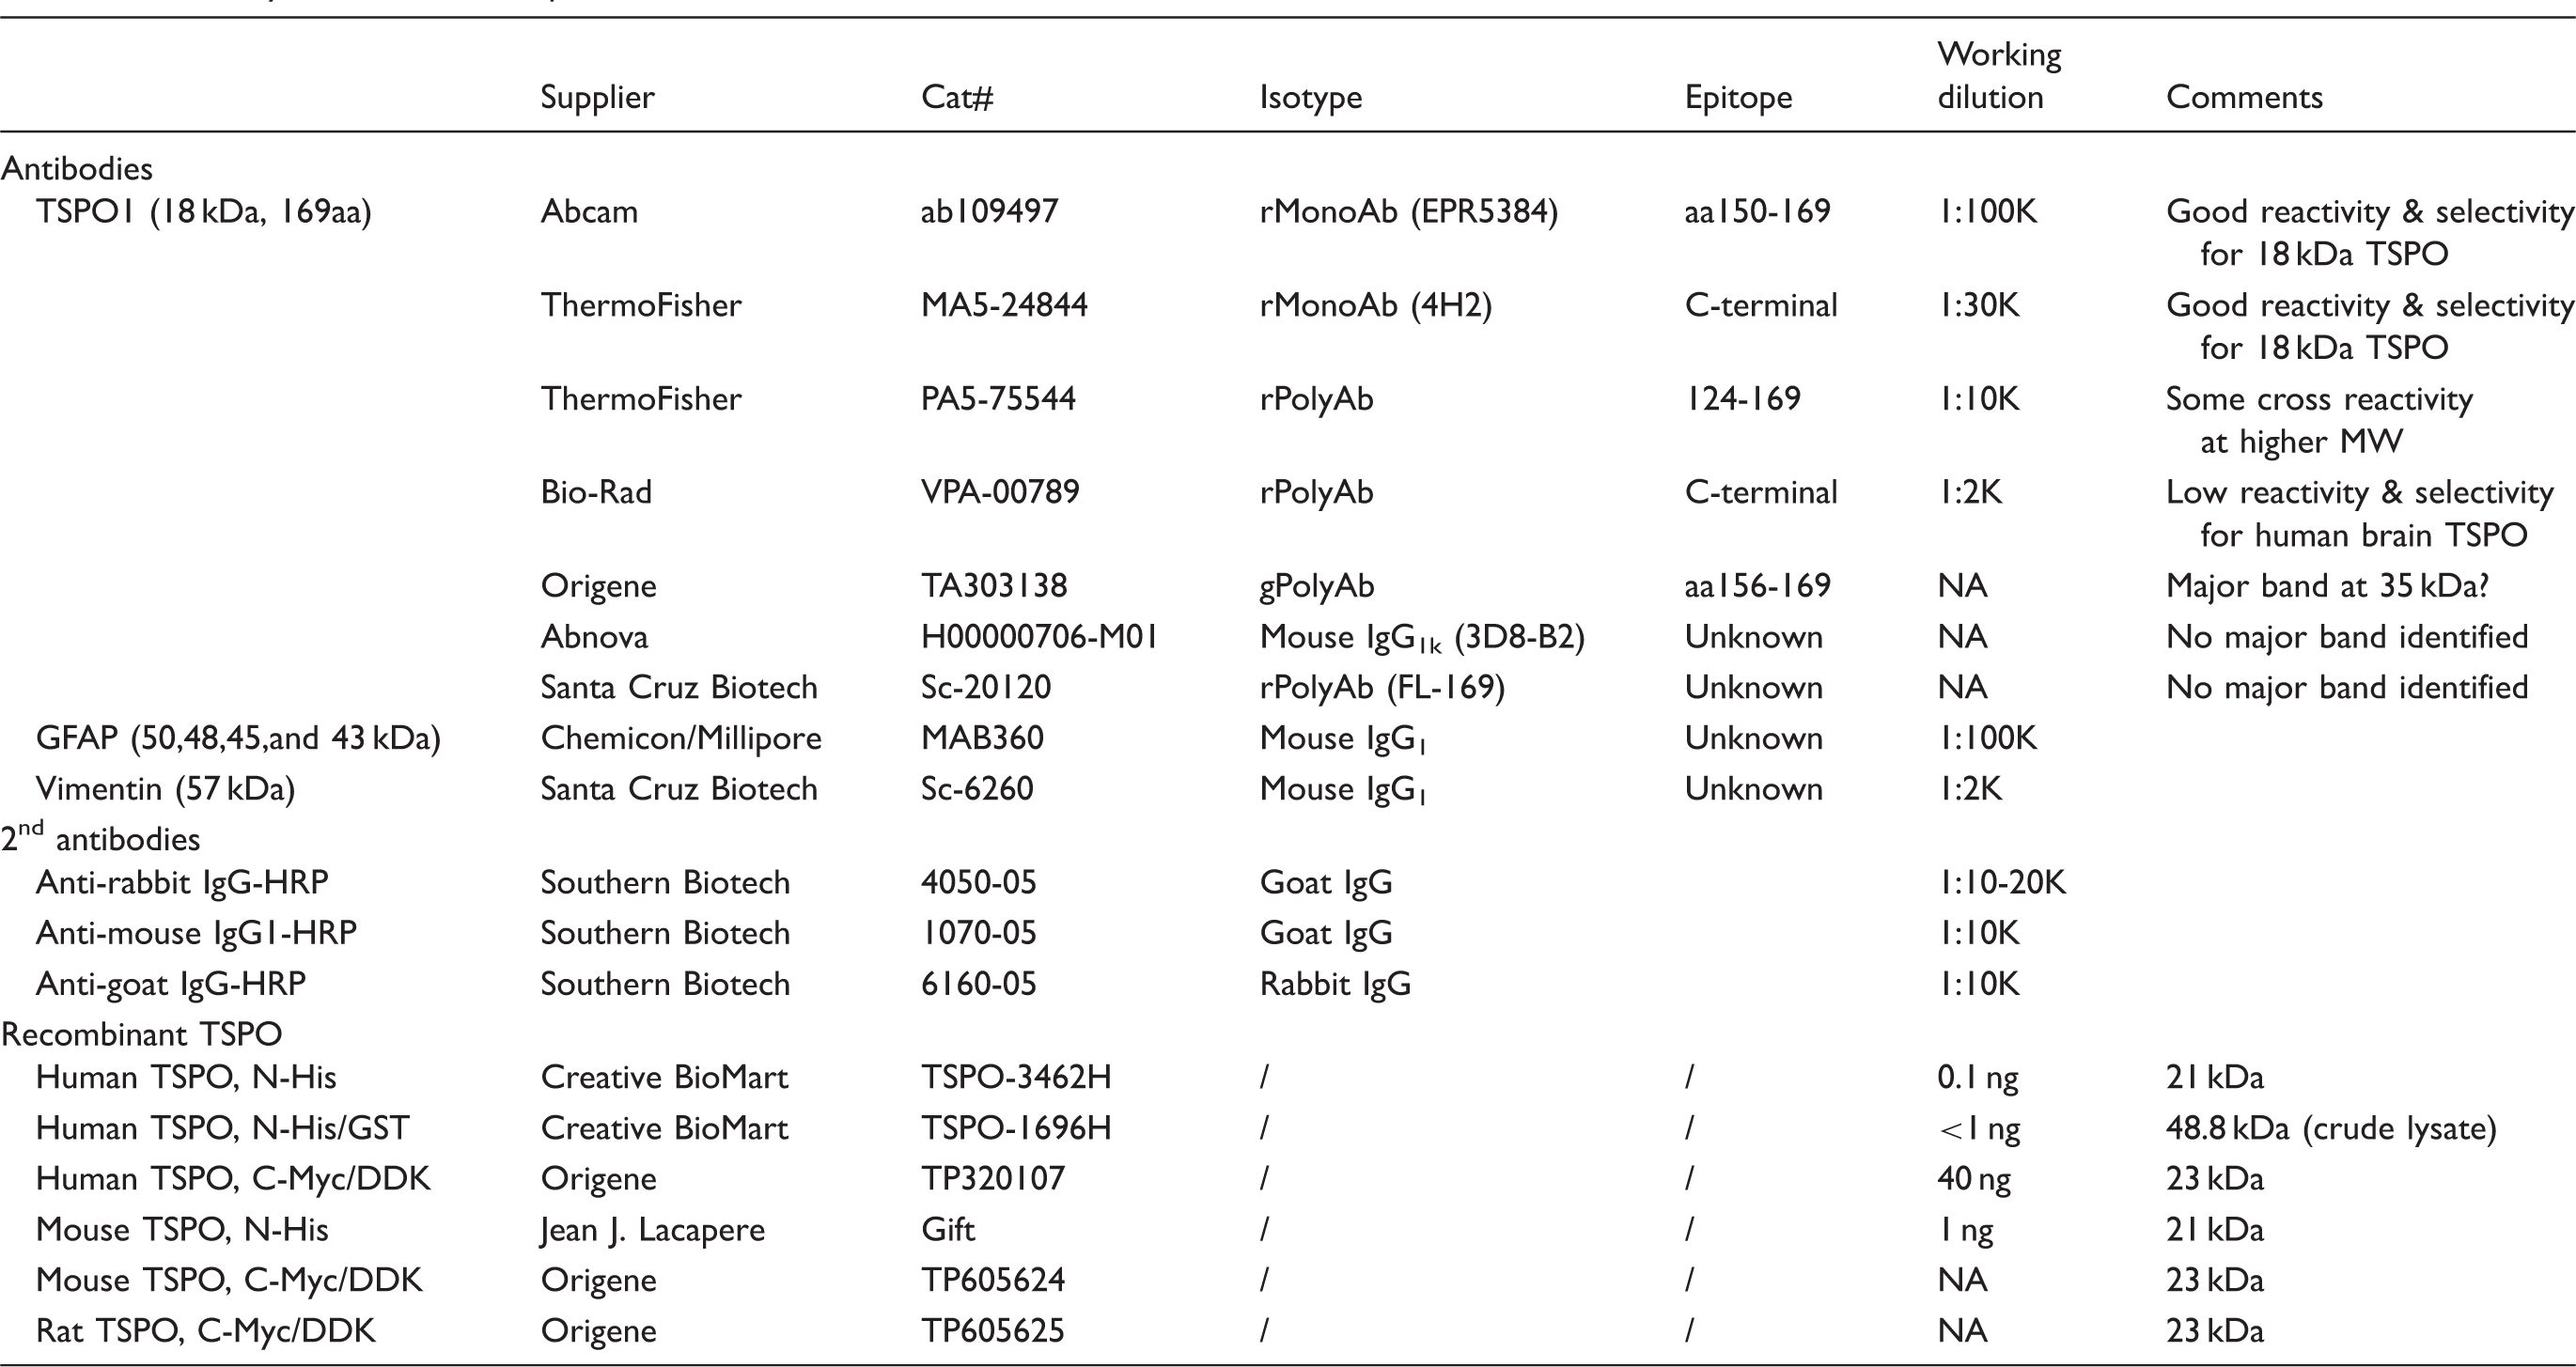
Antibody and recombinant protein sources and conditions used.
Regional distribution of TSPO, as compared to GFAP, in autopsied human brain.
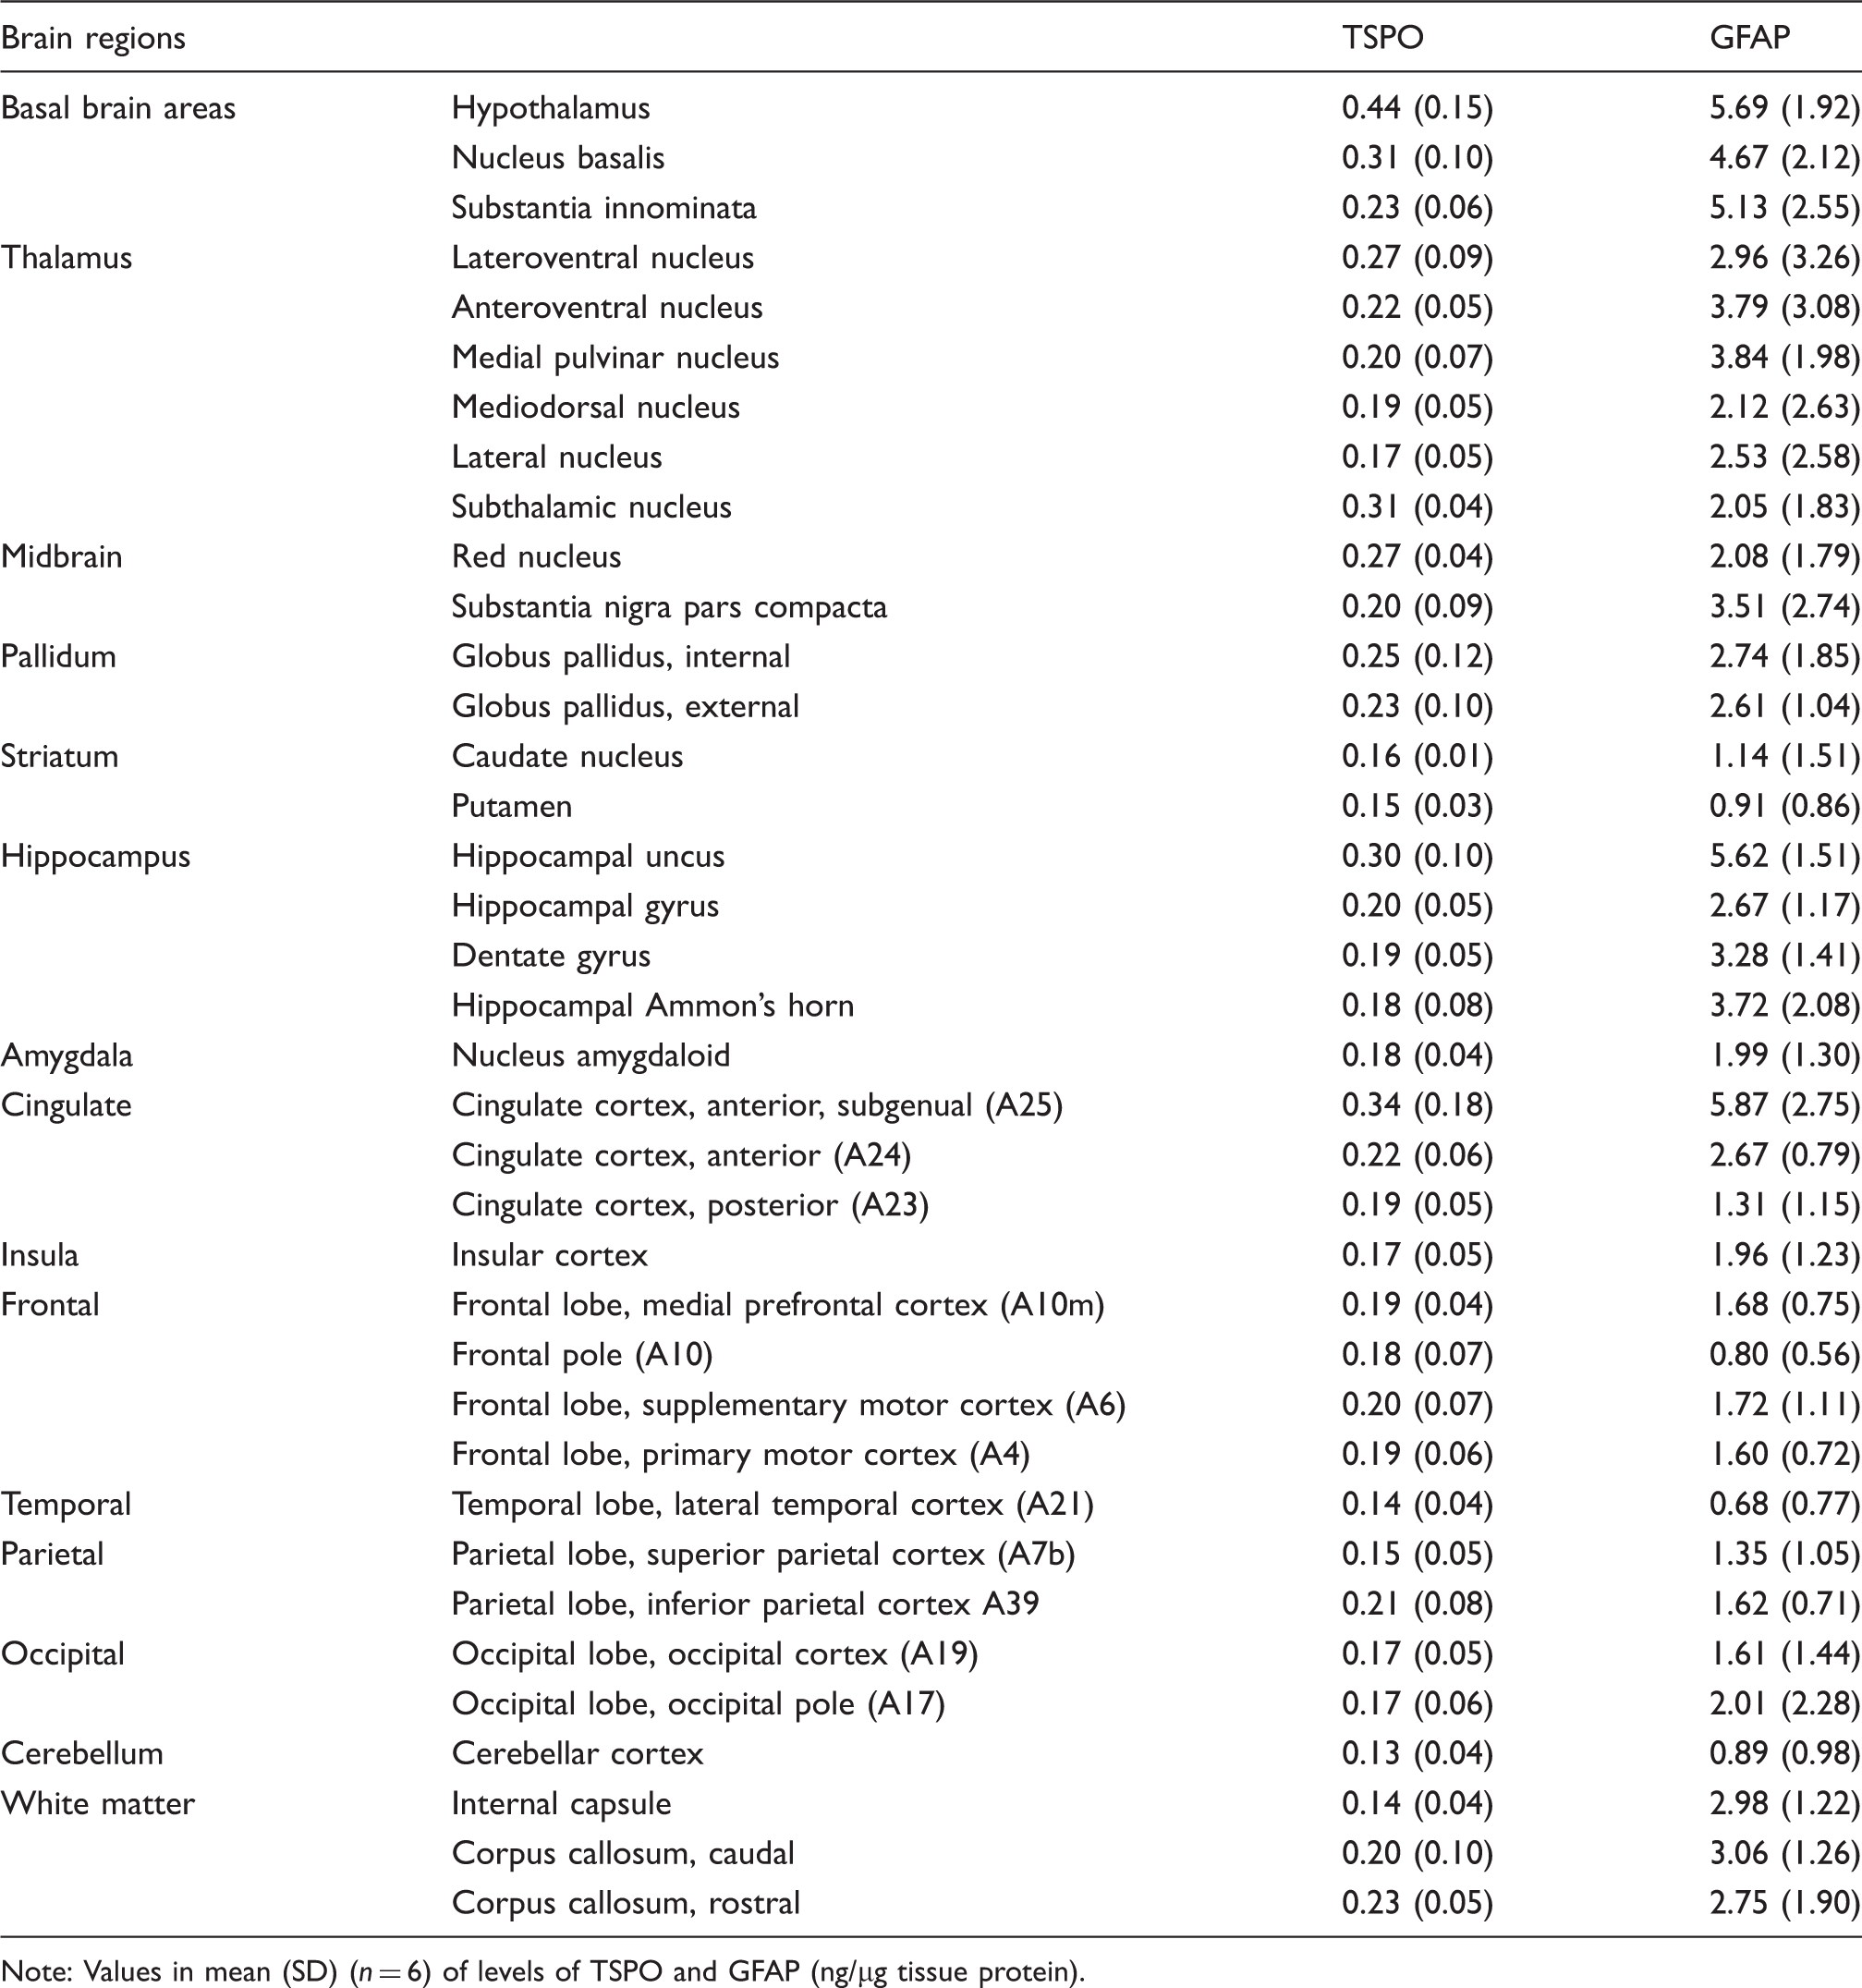
Note: Values in mean (SD) (n = 6) of levels of TSPO and GFAP (ng/µg tissue protein).
Data analyses
All quantitative immunoblotting data are expressed in ng/µg protein of tissue homogenates. On average, the white matter regions (corpus callosum and internal capsule) had a protein concentration per mg tissue weight 23% lower than the grey matter regions sampled including frontal cortex, hippocampus, and substantia nigra pars compacta; therefore, levels of protein of interest in the white matter regions as determined above were multiplied by 0.77 to correct for the difference in total protein concentration between white and grey matters. This correction was necessary for meaningful comparison of regional PET binding (per volume) with TSPO protein levels (per total protein). There was no significant difference in total protein levels (mg protein/mg wet tissue) among the cortical and subcortical grey matter regions sampled. Statistical analyses were performed by using StatSoft STATISTICA 7.1 (Tulsa, Oklahoma, USA). TSPO/GFAP regional distribution was examined by one-way ANOVA. The 37 brain regions examined were also grouped into 15 brain areas (see Table 2) and the mean values were also examined by one-way ANOVA followed by post hoc LSD (Least Significant Difference) tests. Possible correlations between TSPO and GFAP levels vs. age of the subjects and between regional protein levels vs. literature data of TSPO binding were examined by Pearson product-moment correlation. To assess correlations between TSPO protein vs. TSPO binding amongst the different brain grey matter areas, the following regions were employed, with subregional averages calculated if necessary: thalamus, midbrain, globus pallidus, hippocampus, amygdala, cerebral cortical areas (cingulate, insula, frontal, temporal, parietal and occipital cortices), cerebellar cortex, and striatum (caudate and putamen). The white matter was excluded from the correlation analysis because of its different kinetic characteristics, e.g. blood supply, 73 from the grey matter in in vivo PET imaging. F-tests of the null-hypotheses, y-intercept = 0 or two slopes are equal for the linear correlations were performed by using GraphPad Prism 4.0.
Results
Characterization of TSPO antibodies for Western blotting in human brain
Several TSPO antibodies were tested in homogenates of autopsied human brain and adrenal samples together with recombinant TSPO proteins from different sources (Table 1; see Supplementary Results for more details). As shown in Figure 1(a), the rabbit monoclonal antibody EPR5384 was found to have the optimal specificity and sensitivity for Western blotting in human brain homogenates; the rabbit monoclonal (MA5-24844, 4H2) and polyclonal (PA5-75544) antibodies were also suitable for the brain but with lower sensitivity, with the latter having more non-specific reactivity and not suitable for the adrenal; several other antibodies were found not suitable for the brain mainly because of much non-specific reactivity (Supplement Figure 1B-D). The N-His tagged TSPO-3462H was found to be of sufficient purity for TSPO calibration whereas the N-His/GST tagged TSPO-1696H (crude extract) or the C-Myc/DDK tagged TSPO of human, rat and mouse origin (epitope interference) were not suitable. N-His tagged TSPO proteins, both TSPO-3462H and recombinant mouse TSPO (from Dr. J. J. Lacapere),
74
had a small amount of aggregates, likely dimers, trimers and tetramers of TSPO,
75
which was also detected by the antibodies (Figure 1(a) and Supplement Figure 1A). However, no TSPO polymer was detectable in the human brain SDS-PAGE sample preparation.
Quantification of TSPO protein in autopsied human brain. (a) Immunoblots of TSPO in the pooled tissue standards, in the commercial N-His-tagged recombinant human TSPO-3462H and in human adrenal samples with monoclonal (EPR5384, 1:100K and MA5-24844, 1:30K dilution) and polyclonal (PA5-75544, 1:10K) antibodies. (b) Standard curves for the recombinant TSPO. Note more abundant TSPO in adrenal than in brain for both EPR5384 and MA5-24844, polymer protein bands of the recombinant TSPO, high molecular weight non-specific reactions for PA5-75544, and detection of a TSPO fragment but not 18 kDa TSPO by PA5-75544 in human adrenal samples.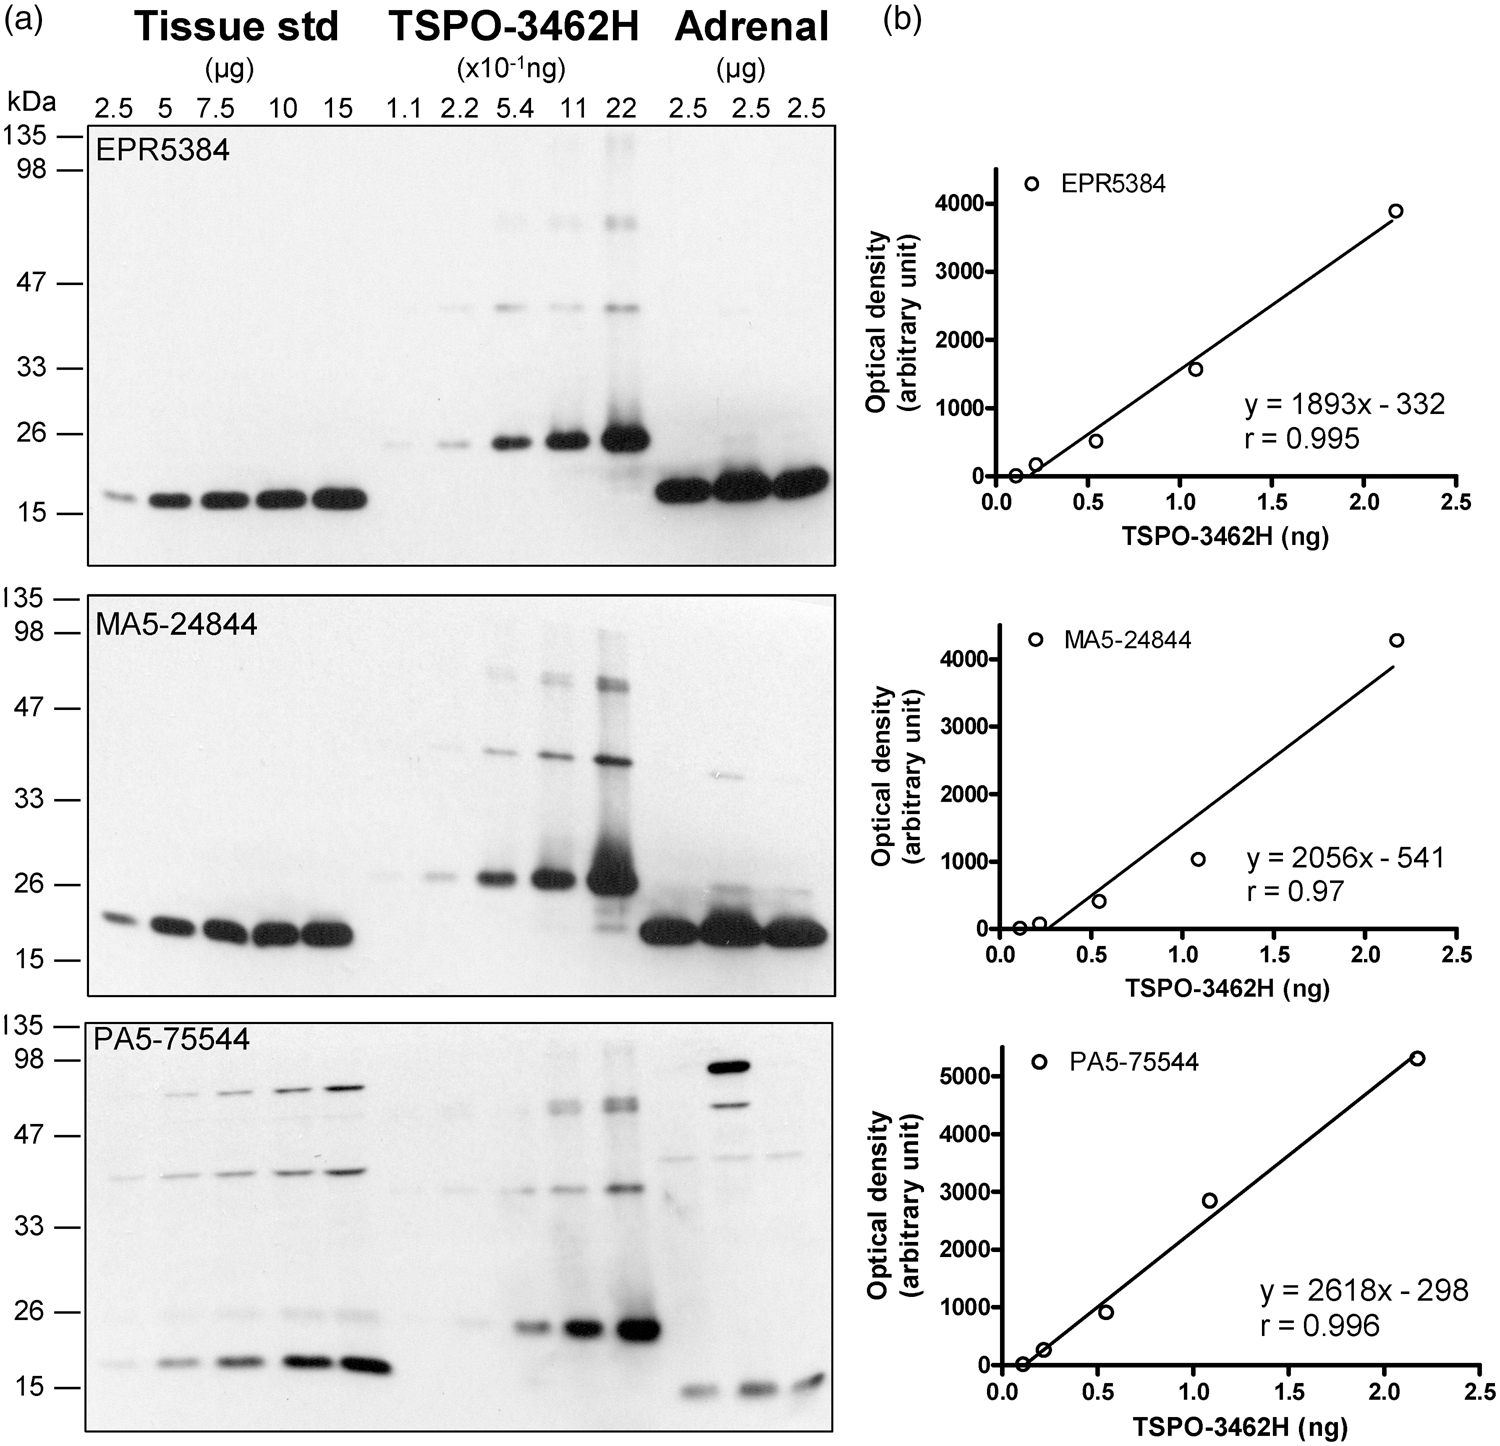
TSPO levels in normal human brain
Given the high specificity and sensitivity of the rabbit monoclonal antibody EPR5384, it was selected for the following quantitative measurement in human brains. TSPO protein levels in the commercial partially purified recombinant TSPO-3462H were first calibrated with BSA standard and were determined to be 2.17 (0.31) µg/µg protein (eight determinations). Afterwards, TSPO-3462H was used to calibrate TSPO levels in the pooled tissue standard employed in quantitative Western blotting assays, which was determined to be 0.147 (0.012) ng/µg protein by EPR5384 (Figure 1(b)). Similar levels were also obtained with the rabbit monoclonal (4H2) antibody MA5-24844 (0.149 [0.019] ng/µg protein) although a lower level was obtained with the rabbit polyclonal antibody PA5-75544 (0.082 [0.012] ng/µg protein), likely because of slightly higher immunoreactivity of the polyclonal antibody to detect recombinant TSPO than the native TSPO in human brains. For comparison, levels of TSPO protein in human adrenal tissue samples (n = 3) were 1.34 (0.19) ng/µg protein using the rabbit monoclonal antibodies.
Regional brain distribution of TSPO and GFAP protein in the human
Brains from six middle aged (47–49 years) subjects were examined for regional distribution of TSPO as compared to that of the commonly used astrocyte marker GFAP (see Figure 2 for representative immunoblots). Upon longer exposure, regions with higher levels of GFAP also showed high and low molecular weight GFAP immunoreactive species (see Tong et al.
70
), which were not included in the quantification. One-way ANOVA revealed significant differences among the 37 brain regions in levels of both TSPO (F36,180 = 4.3, p < 0.0001) and GFAP (F36,180 = 3.6, p < 0.0001) (Table 2). However, the heterogeneity was mainly driven by higher levels of both proteins in a few small brain areas including hypothalamus, subgenual prefrontal cortex (Brodmann A25), hippocampal uncus, and nucleus basalis. In analysis of 15 grouped and averaged brain areas (TSPO [F14,75 = 4.2, p < 0.0001] and GFAP [F14,75 = 5.4, p < 0.0001]), although differences among major brain regions of thalamus, hippocampus/amygdala, cerebral/cerebellar cortices, and striatum were small (Table 2), the average thalamic values of both proteins were significantly higher than those of striatum and cerebellar cortex (p < 0.05, post hoc LSD tests). White matter regions had a level of TSPO similar to those of the grey matter regions. In contrast, GFAP levels in the white matter regions were significantly higher than those of the striatum, cerebellar cortex, and many of the cerebral cortices (frontal, temporal and parietal) (p < 0.05, post hoc LSD tests). There was a significant positive correlation between levels of TSPO and GFAP among the brain regions examined (r = 0.72, p < 0.0001). In particular, brain regions including hypothalamus, subgenual prefrontal cortex, hippocampal uncus, and nucleus basalis had high levels of both proteins whereas the opposite was observed for regions like cerebellar cortex and striatum.
Representative immunoblots of the regional distribution of TSPO and GFAP in autopsied human brain. A23: cingulate gyrus posterior; A24: cingulate gyrus anterior; A25: paraolfactory/subgenual gyrus; CCc: corpus callosum caudal; CCr: corpus callosum rostral; cereb: cerebellar cortex; CN: caudate; CNA: hippocampal Ammon’s horn; CSTH: subthalamic nucleus; GD: dentate gyrus; GH: hippocampal gyrus; GPe: globus pallidus external; GPi: globus pallidus internal; GUNC: gyrus of uncus; hypothal: hypothalamus; ICr: internal capsule rostral; MDTH: mediodorsal thalamus; NAM: amygdala; NAV: anterior ventral nucleus of thalamus; N. basalis: nucleus basalis; NL: nucleus lateralis of thalamus; NLV: lateral ventral nucleus of thalamus; NPM: medial pulvinar of thalamus; PUT: putamen; RN: red nucleus; SBI: substantia innominata; SNpc: substantia nigra pars compacta.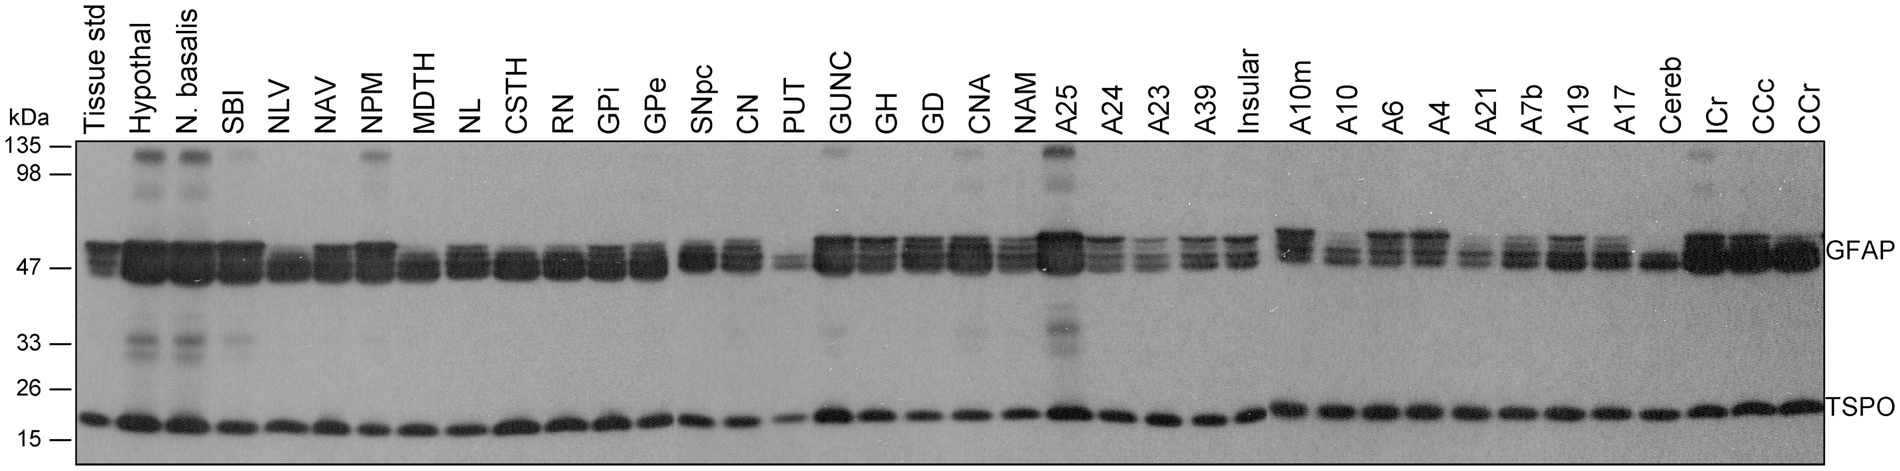
Correlations between regional TSPO protein concentrations and binding levels reported in in vitro and in vivo studies in the literature
Postmortem brain comparisons
We first examined the correlations between our regional TSPO protein distribution data and those of regional binding density determined by autoradiography or radioligand binding assay using the prototypical TSPO ligands [3H]PK1119537,38,43 or [3H]Ro5-4864
37
in autopsied human brain reported in the literature. No significant correlation was observed (e.g. see Figure 3(a) for the correlation with binding data by Doble et al 1987:
38
y = 827-120.5x, r = −0.02, p = 0.93, n = 18). Notably, higher levels of binding were reported for cerebral cortical areas, despite lower TSPO protein levels, as compared to some subcortical regions including globus pallidus and midbrain (substantia nigra and red nucleus)37,38,43; the subgenual prefrontal cortex, i.e. the parolfactory subcallosal area, had a high concentration of TSPO protein but was reported to have a low level of binding for [3H]PK11195.
38
In addition, the white matters had significant levels of TSPO protein but were reported to have only non-specific binding for [3H]PK1119538 (but see Banati et al.
20
). One study reported regional autoradiography binding data using a second generation TSPO ligand [125I]desmethoxy-DAA1106, with lowest binding observed in the thalamus whereas a high level of binding in the white matter,
76
contrary to our observation for TSPO protein, although it should be noted that TSPO distribution in sub-nuclei of thalamus can be heterogeneous (Table 2; see also Doble et al.
38
).
Correlations (Pearson) between regional protein levels of TSPO determined in this study vs. outcome measures of binding reported in the literature (p < 0.05 for solid lines and p > 0.05 for dashed lines). To assess the correlation between TSPO protein vs. TSPO binding amongst different brain areas, the following regions were employed, with subregional averages when necessary: thalamus, midbrain, globus pallidus, hippocampus, amygdala, cerebral cortical areas (cingulate, insula, frontal, temporal, parietal and occipital cortices), cerebellar cortex, and striatum (caudate and putamen). (a) TSPO protein versus [3H]PK11195 binding density determined by autoradiography in autopsied human brain reported by Doble et al.
38
and [11C](R)-PK11195 binding potential acquired by positron emission tomography (PET) reported by Cagnin et al.
21
Note the lack of correlation between the regional distribution of TSPO protein in our autopsied human brain study vs. the regional distribution of binding of the first generation TSPO tracer, PK11195. (b, c) TSPO protein regional distribution in autopsied human brain versus PET total distribution volume (VT) of five second generation TSPO radiotracers that are influenced by the single nucleotide genetic polymorphism (rs6971, HAB-high affinity binder and MAB-mixed affinity binder), including [
18
F]-FEPPA reported by Atwells et al.,
27
[11C]PBR28 reported by Rizzo et al.,
23
[18F]DPA-714 reported by Lavisse et al.,
30
[18F]PBR-111 reported by De Picker et al.,
32
and [18F]GE-180 reported by Fan et al.
34
Note that in contrast to the lack of correlation with the first generation ligand, there was positive (r = 0.72–0.79, p < 0.05) or a trend for a positive correlation (r = 0.45–0.55, p = 0.10–0.16) between the regional distribution of TSPO protein in autopsied brain vs. those of binding of the second generation tracers in PET imaging studies, with the exception of [11C]PBR28 in MAB (r = −0.09, p = 0.82).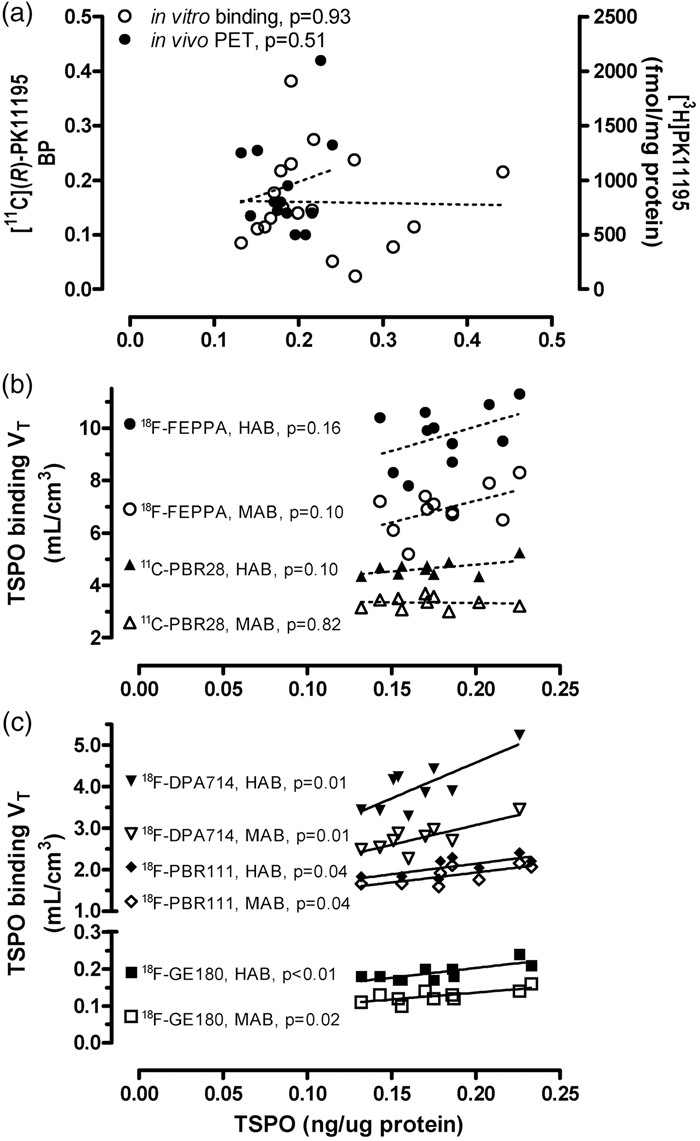
PET imaging comparisons
The commonly used PET outcome measure for the first generation TSPO ligand [11C](R)-PK11195 is binding potential, determined with different reference tissue models. Correlations between reported regional [11C](R)-PK11195 binding potential and TSPO protein levels were generally poor (e.g. see Figure 3(a) for the correlation with PET data by Cagnin et al.: 21 y = 0.086 + 0.55x, r = 0.20, p = 0.51, n = 13). In particular, most of the studies reported higher [11C](R)-PK11195 binding potential in the putamen (0.08–0.26) as compared to the hippocampus (0.05–0.14) and cerebral cortical areas (0.03–0.16),21,53,77–79 which is in contradistinction with that for TSPO protein levels in which the putamen had among the lowest levels of TSPO protein.
Imaging the second generation TSPO radiotracers is dependent on a single nucleotide genetic polymorphism (rs6971, high binder HAB vs. mixed binder MAB, with low binder LAB generally not scanned).80,81 Among the many second generation TSPO ligands, we examined those PET studies reporting the binding parameter VT (total distribution volume) that was assessed in a wide range of brain regions in both HAB and MAB and observed that the common pattern of binding ranking order in major grey matter areas follows the rank of thalamus, midbrain > hippocampus, cerebral cortices >striatum,23,27,30,32,34 in general agreement with TSPO protein distribution in autopsied brain. As shown in Figure 3(b) and (c) for five representative TSPO ligands with different brain binding characteristics, correlations between VT and regional TSPO protein levels were significant and positive for [18F]DPA-714 30 (HAB: y = 1.1 + 17.2x, r = 0.79, p = 0.01; MAB: y = 1.2 + 9.53x, r = 0.79, p = 0.01; n = 9), [18F]-PBR11132 (HAB: y = 1.1 + 5.1x, r = 0.72, p = 0.04; MAB: y = 0.97 + 4.8x, r = 0.72, p = 0.04; n = 8), and [18F]GE-180 34 (HAB: y = 0.098 + 0.52x, r = 0.77, p = 0.009; MAB: y = 0.06 + 0.38x, r = 0.74, p = 0.015; n = 10), with some non-significant trends for [18F]-FEPPA 27 (HAB: y = 6.3 + 18.7x, r = 0.45, p = 0.16; MAB: y = 3.9 + 16.4x, r = 0.52, p = 0.10; n = 11) and [11C]PBR2823 (HAB: y = 3.70 + 5.55x, r = 0.55, p = 0.10; MAB: y = 3.46-0.67x, r = −0.09, p = 0.82; n = 10). There was no significant difference between HAB and MAB in the slope of these correlations. Notably, TSPO PET imaging generally underestimated regional differences in TSPO protein levels (all y-intercept > 0 with the exception of [18F]DPA-714 in HAB 30 ).
Changes in levels of TSPO and GFAP in human brain development and aging
As shown in Figure 4, TSPO levels were high in the newborn brain (0.74 [0.10] ng/µg protein, within 10 days of birth) but declined approximately exponentially during the first three months of age and remained at a low level until early adulthood, at which TSPO brain levels increased slowly but significantly with adult aging and senescence. The rate of TSPO increase was 0.0014 ng/µg protein/year or 10% per decade (18 to 99 years, r = 0.47, n = 35, p = 0.004). In contrast, levels of the astroglial marker GFAP were low in the newborn brain (0.07 [0.02] ng/µg protein, within 10 days of birth) but increased steadily throughout life. Five subjects aged 6 months to 4 years, for unknown reasons, had a GFAP level (2.5–7.4 ng/µg protein) more than six standard deviations above the mean value of the rest of the subjects under 4 years of age (n = 24) and thus were excluded from the correlation analysis (Figure 4) [note: the five subjects had a TSPO level that was not unusual]. During adulthood, the rate of GFAP increase was 0.034 ng/µg protein/year or 30% per decade (18–99 years, r = 0.44, n = 35, p = 0.009). GFAP had a significantly greater rate of increase during adult brain aging and senescence than that of TSPO (p < 0.05). We found no significant correlation between levels of TSPO and GFAP during adult brain aging (p > 0.05). Given some PET findings of diurnal changes of TSPO binding with increased VT from morning to afternoon in the same day test–retest setting,82,83 we examined the possible confound of time of death on TSPO protein levels. As shown in Supplement Figure 2, there was no clear pattern of circadian changes of either TSPO or GFAP in the 24 adult cases having information on time of death.
Aging and neonatal developmental changes of levels of TSPO and GFAP in autopsied human brain. The inset shows enlarged portion below 1 year of age for TSPO. The linear correlations are for adults (18–99 years). The dashed line in the GFAP graph shows the linear correlation in the full age range (21 hours to 99 years of age) excluding five outliers (solid circles). Note high levels of TSPO during first three months of birth, its exponential drop thereafter, and slow increase during adult aging and senescence; in contrast, GFAP levels were low at birth, other than in the five outliers, and increased steadily throughout life.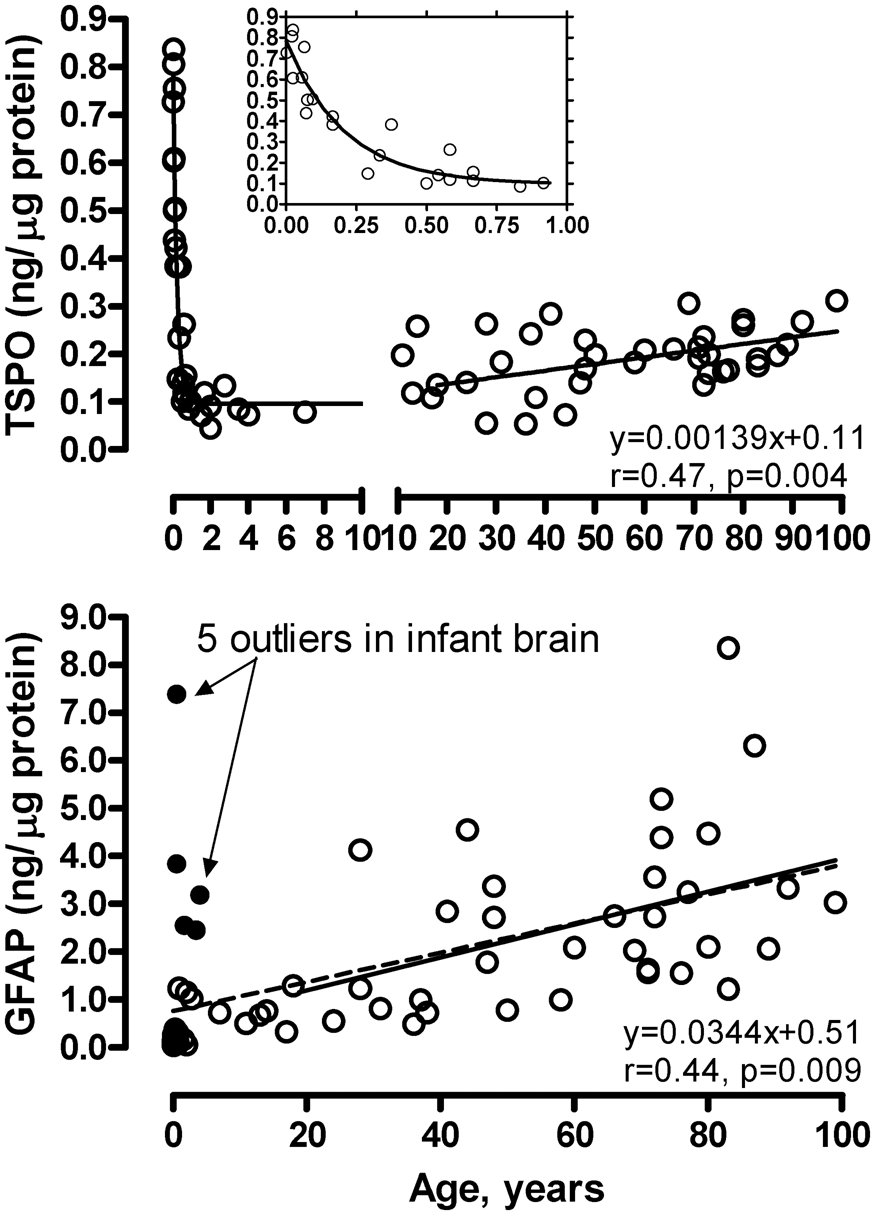
Increased TSPO levels in putamen of patients with MSA
As shown in Figure 5, levels of TSPO were, as expected, significantly increased on average by 114% (95% CI 61–166) in the degenerating putamen of patients with MSA (0.43 [0.14] ng/µg protein), employed as a positive control in which brain gliosis is present, as compared to the controls (0.20 [0.04] ng/µg protein) (two-tailed independent t-test, Hedges’ g = 2.6, 95% CI 1.5–3.7). However, among the MSA patients, there was no significant correlation between increased TSPO levels and those of other markers of microglia including HLA-DRα (TAL.1B5, + 678%), HLA-DR/DP/DQβ (CR3/43, + 712%) and glucose transporter-5 (+28%) or astrocytes including GFAP (+163%), vimentin (+1614%; see also Figure 5 for representative blots), heat shock protein-27 (+455%) and monoamine oxidase-B (+83%). Indeed, no significant correlation was observed among increased levels of the microglial markers (TSPO, HLA-DRα, HLA-DR/DP/DQβ and GLUT5) in MSA putamen whereas significant positive correlations amongst increased levels of astroglial markers (GFAP, vimentin, HSP-27 and MAO-B) were reported previously.61,62,67,70
Increased levels of TSPO protein in putamen of patients with multiple system atrophy (MSA) as compared to control subjects. ***p < 0.001 (two-tailed t-test). Also shown are representative immunoblots of TSPO and an astroglial marker vimentin probed at the same time. Note greater increases in levels of vimentin as compared to that of TSPO in MSA (M1 and M2) versus controls (C1 and C2).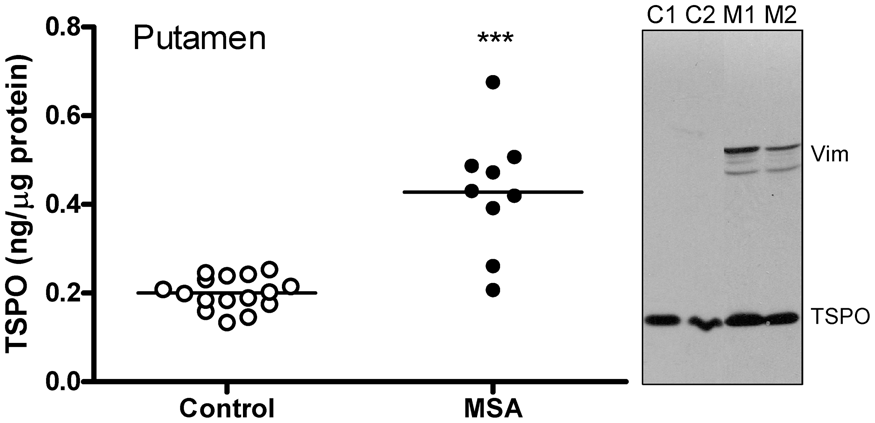
Discussion
To our knowledge, this is the first detailed quantitative examination of several TSPO protein characteristics (concentration, aging, regional distribution) in autopsied human brain.
TSPO is an abundant protein in the human brain
As the major component of the peripheral benzodiazepine binding site, TSPO is reported to be less abundant in the brain than in the peripheral organs, e.g. kidney and adrenal gland.3,4,7,39,84 However, the absolute level of TSPO protein in brain is uncertain, with reported concentrations of the peripheral benzodiazepine binding site in the human brain estimated by saturation binding assays varying between <100 and ∼4000 fmol/mg tissue protein (assuming a membrane to homogenate protein ratio of 0.5 for data reported in fmol/mg membrane protein and assuming a protein/tissue ratio of 0.05 for data reported in fmol/mg wet tissue 85 ; see Supplementary Table 1).37–50 The variation possibly reflects actual differences in the binding sites for the different ligands (e.g. [3H]Ro5-4864 vs. [3H]PK11195), 37 the uncertainty in non-specific binding of the probes employed (mostly by [3H]PK11195; but also by second generation ligands [3H]DAA110648,49 and [3H]PBR2846), different experimental binding protocols employed with the same probe (e.g. 4 vs. 37℃ 46 or room temperature 39 incubation; see Supplementary Table 1 and also 46 ), and also variable conditions of the postmortem human tissue preparations for radioligand binding. We employed a quantitative immunoblotting approach with specificity of the antibody confirmed by several criteria including mass of the protein band detected, subcellular and regional distribution, cross-examination with several antibodies of different immunoreactivities, purified recombinant proteins, and positive control of MSA putamen with well-known microglial activation. One limitation of using recombinant TSPO protein for calibration is that the recombinant protein could have different immunoreactivities due to different post-translational modifications than the native TSPO. Indeed, the polyclonal PA5-75544 gave a TSPO concentration 44% lower than that obtained with the monoclonal antibodies, apparently due to its relatively higher reactivity to the recombinant TSPO. PA5-75544 also showed different immunoreactivities against TSPO from brain versus that from adrenal gland, again suggesting organ specific post-translational modification of TSPO protein, which warrants further detailed studies. However, two different monoclonal antibodies provided similar results and the obtained TSPO protein concentrations (0.13–0.44 µg/mg protein homogenate, equivalent to 7,000–24,000 fmol/mg protein or 350–1200 nM assuming a protein/tissue ratio of 0.05 and a unit weight of 1 g/mL) 85 are 2 to 70 fold higher than expected from previous binding assays in the human brain (<100–4000 fmol/mg tissue protein; Supplementary Table 1). The reason for the discrepancy between the TSPO protein concentration and Bmax estimates by binding of the TSPO ligands could be explained by TSPO being only one part of the ligand binding site on the outer membrane of mitochondria as suggested for Ro5-4864, 86 with several other proteins including the voltage-dependent anion channels and the adenine nucleotide carrier possibly also involved (but see Joseph-Liauzun et al. 87 ). Alternatively, oligomers of TSPO 75 might provide a binding site for a single molecule of PK11195 or congener—or possibly not all TSPO proteins might be available for binding because of endogenous substrate/ligand occupying the binding sites, 88 a denatured state of TSPO due to loss of mitochondrial membrane potential postmortem, or presence of a reserve pool of TSPO, reminiscent of the situation in reconstituted TSPO proteoliposome. 89 The apparent temperature sensitivity of the in vitro [3H]PK11195 binding assay in human brain tissue (Supplementary Table 1; but see Benavides et al. 4 for the lack of temperature sensitivity in rat brain), with decreased affinity but also higher Bmax obtained at higher incubation temperature (unlike that for serotonin transporter binding), 90 may suggest that TSPO alone is in a dynamically unstable state under physiological temperature; self-association, interaction with other proteins, or engagement of endogenous substrates might stabilize its structure and thus influence ligand binding, similar to the situation of receptor-G protein interaction. 91
One potential limitation of our study is the lack of rs6971 genotype for our subjects therefore it is unknown whether the genetic variation that affects binding of many second generation TSPO ligands80,81 also influences TSPO protein levels in the brain. A recent study suggested that rs6971 might slightly destabilize TSPO protein in cultured human fibroblast cells. 92 Although the low and high affinity binders did not show significant difference in Bmax or Kd for [3H]PK11195 in human brain, 46 further studies would be required to confirm whether rs6971 does or does not influence brain TSPO protein levels.
TSPO in human brain development and aging
The high levels of TSPO in neonatal brain and its precipitous decline within the first few months of birth are remarkable. There is still no consensus on the physiological role of TSPO although many functions have been proposed throughout the years including cholesterol and porphyrin transportation into mitochondria, regulation of mitochondria respiration, permeability, free radical production and apoptosis.1,13–17 Many of these functions were studied in cultured cells of gonadal and adrenal/renal origin, with the role of TSPO in brain much less examined. Recent data show that TSPO is also highly expressed in neural stem and neuronal precursor cells in embryonic and neonatal brain of mice, 93 suggesting that TSPO might be involved in brain development and neuronal differentiation. However, this does not “explain” the substantial postnatal loss of TSPO within a few months of birth when the brain is still growing rapidly. For comparison, GFAP, the intermediate filament protein also expressed by neuronal precursor cells that are of astroglial origins, follows a different expression trajectory from TSPO in neonatal brain. Given a putative key role of TSPO in the regulation of mitochondria respiration and free radical production94,95 and unusual oxidative stress faced by the newborn,96,97 it is not unreasonable to predict that a high level of TSPO in newborn brain might perhaps have a neuroprotective function. Future studies will be needed to examine more carefully the localization of TSPO in the neonatal human brain, which may reveal more details about the functions of TSPO in the brain. In this respect, it appears that the transient high levels of TSPO in newborn brains might not reflect changes in numbers of a particular population of neural cells including microglia. 98
Unlike the situation in neonates, aging of the brain is associated with increasing protein levels of TSPO and GFAP although the magnitude of age-related increase is modest and less for TSPO than for GFAP in our study. Our finding on TSPO protein is also in agreement with a report of an age-related increase in TSPO gene expression in human dorsolateral prefrontal cortex, 99 which was also less prominent than that for GFAP. The observation of a significant positive correlation between age and GFAP levels in the frontal cortex confirms and extends our previous report in other brain regions in adult brains.61,67 For TSPO, PET imaging studies with different radiotracers have produced mixed results (no-significant change32,55,56 and increase51–54) on age-related changes in TSPO binding in the human. One possible explanation for the ambiguity is the small effect size of age-related increase we found for TSPO protein and generally limited number of subjects and sometimes also limited age range32,53,54 examined in PET imaging studies.
TSPO protein vs. PET regional brain distribution
Interestingly, the regional distribution of TSPO is generally similar to that of GFAP in adult human brain, suggesting co-regulation of the activities of microglia and astrocytes. This is not surprising given their important orchestrated roles in maintaining brain homeostasis and synaptic function. 100 Limited data also suggest that astrocytes can express TSPO in both normal and pathological human brains. 65 Further immunohistochemical studies would be needed to address the regional extent of this co-localization in normal conditions.
Comparison of the regional distribution of TSPO protein and PET TSPO binding showed that the second generation TSPO ligands generally performed similarly to each other and better than that of the first generation prototypical ligand [11C](R)-PK11195 in the in vitro vs. in vivo correlations, despite a narrow window of TSPO protein distribution in major brain areas of thalamus, hippocampus, cerebral/cerebellar cortices, and striatum; this provides some further “validation” of the new generation of TSPO radiotracers. The modest correlations and general underestimation of regional contrast by PET TSPO binding should be interpreted with caution given many technical limitations. For example, regional distribution correlations were difficult to achieve given the limited extent of differences in TSPO protein levels amongst the different brain areas. This might also be related to relatively low brain uptake of the TSPO radiotracers in healthy control subjects (with peak standard uptake values generally less than 2), making it less reliable to establish a normal distribution pattern, limited PET spatial resolution and partial volume effects (e.g. cerebral vs. cerebellar cortices), combined with noise sensitivity of the particular radiotracer and modeling approach. Another contributing factor might be the free and non-specific binding component (VND) of the two-tissue compartment model. Blocking studies showed that VND accounts for 12% (HAB) to 23% (MAB) of total whole brain binding of [11C]DPA-713, 101 46% (HAB) to 67% (MAB) of [11C]PBR28102 (see also Sridharan et al. 103 ) assuming the same level of VND in HAB and MAB (note: lower VND was reported for [11C]PBR28 by using a different modelling approach 104 and by a recent study using a different blocker 105 ), 43% (HAB) to 80% (MAB) of [18F]GE-180 in patients with multiple sclerosis, 103 and 57% (HAB and MAB) of [11C](R)-PK11195, 101 suggesting that non-specific binding explains at least part of the contrast loss in vivo. Other factors might include inherent in vivo vs. in vitro differences so that not all TSPO proteins are available for in vivo binding of the ligand at a tracer dose, e.g. by engagement of an endogenous TSPO ligand, differential post-translational modification, and dynamic state of TSPO polymerization and association with other proteins. PET outcome measures (BP or VT) obtained at a single tracer dose are determined by both target concentration (Bmax) and affinity (Kd) of the radiotracer, i.e. Bmax/Kd, which can be influenced by the many above-mentioned in vivo variables. Thus, a regional difference in Kd may not be unexpected in vivo. It should also be acknowledged that our immunoblotting study was limited in anatomical extent of tissue sampling, in particular in sub-regionally heterogeneous brain areas, e.g. thalamus and hippocampus. The subregions are not equal in volume; thus, simple mathematical average of protein levels in the subregions may not represent the actual overall concentration. Nevertheless, our previous studies of serotonin transporter and monoamine oxidase-A and -B with similar approaches showed that brain regional PET radiotracer binding in vivo can correlate well and in proportion to the target concentrations determined in vitro by Western immunoblotting.68,106
TSPO and MSA
Our finding of increased (by 114%) levels of TSPO in degenerating putamen of patients with MSA, used as a positive disease control in which brain gliosis and increased number of microglia and astrocytes 107 are present, adds to the literature support for the usefulness of TSPO as a marker of gliosis and is consistent with the PET finding in MSA using [11C](R)-PK11195. 108 Interestingly, there was no significant correlation among elevated levels of the microglial markers including TSPO, HLA-DRα, HLA-DR/DP/DQβ and GLUT5 or between microglial and astroglial markers, despite significant positive correlations among increased expression of astroglial markers (GFAP, vimentin, HSP-27 and MAO-B) 62 ; this suggests the possibility of individual heterogeneity in microglial response and that TSPO may label a different subset of activated glial cells. The magnitude of TSPO change (+114%) was smaller than that of HLA-DRα (+678%), HLA-DR/DP/DQβ (+712%), vimentin (+1614%), and heat shock protein-27 (+455%), at a similar level to that of GFAP (+163%) and monoamine oxidase-B (+83%), and larger than that of glucose transporter-5 (+28%). This might be related to baseline levels of the glial markers, with those abundant in healthy controls (GFAP, MAO-B, GLUT5, and TSPO) expected to be less sensitive to detect an increase in pathological conditions than those rare at baseline. Further detailed immunohistochemical investigation would be needed to address the cellular and subcellular localization of TSPO protein in MSA and to establish the extent TSPO is selectively associated with activated microglia in this condition.
Implications for TSPO brain imaging
The TSPO PET imaging literature has suggested that TSPO levels in normal human brain are low to absent (e.g. see literature20,77,109–111); this was perhaps driven by observations of generally low PET TSPO binding in healthy human brain and by very low PET TSPO binding and barely detectable TSPO protein levels in healthy rodent brains. 112 Although there may be different explanations for the low brain TSPO binding in vivo in the human for the available TSPO radiotracers, our findings raise the possibility of the existence of a large reserve pool of TSPO protein that is normally not available for tracer binding. Speculatively, activation or deactivation of the TSPO reserve pool could be another mechanism for TSPO binding changes observed in some neuropsychiatric conditions. The observed regional brain correlations, albeit modest, between TSPO protein levels and binding of multiple second generation TSPO ligands of different chemical structures, unique non-specific binding profiles, and variable brain availabilities, also point to a reconfirmation of their common target.
In summary, we determined TSPO protein concentrations in human brain and its developmental and aging changes. The correlation between regional brain distribution of TSPO protein determined postmortem and binding of the second generation TSPO radiotracers in living humans provides further validation of the PET outcome measures of TSPO binding. Our finding of higher than expected brain TSPO protein concentrations suggests that not all TSPO protein might be available for ligand binding.
Supplemental Material
Supplemental material for Concentration, distribution, and influence of aging on the 18 kDa translocator protein in human brain: Implications for brain imaging studies
Supplemental Material for Concentration, distribution, and influence of aging on the 18 kDa translocator protein in human brain: Implications for brain imaging studies by Junchao Tong, Belinda Williams, Pablo M. Rusjan, Romina Mizrahi, Jean-Jacques Lacapère, Tina McCluskey, Yoshiaki Furukawa, Mark Guttman, Lee-Cyn Ang, Isabelle Boileau, Jeffrey H Meyer and Stephen J Kish in Journal of Cerebral Blood Flow & Metabolism
Footnotes
Funding
The author(s) disclosed receipt of the following financial support for the research, authorship, and/or publication of this article: This study was supported by grants from NIH NIDA DA040066 and DA07182.
Declaration of conflicting interests
The author(s) declared no potential conflicts of interest with respect to the research, authorship, and/or publication of this article.
Authors’ contributions
JT, IB and SJK designed the study; JT, BW and TM were responsible for data collection and analysis; JT, JHM and SJK drafted the initial manuscript; PMR, RM, JJL, TM, YF, MG, LCA made substantial contribution to the data interpretation. All authors critically revised the article. All authors approved the final version.
References
Supplementary Material
Please find the following supplemental material available below.
For Open Access articles published under a Creative Commons License, all supplemental material carries the same license as the article it is associated with.
For non-Open Access articles published, all supplemental material carries a non-exclusive license, and permission requests for re-use of supplemental material or any part of supplemental material shall be sent directly to the copyright owner as specified in the copyright notice associated with the article.