
Abstract
Measurement of the ability of blood vessels to dilate and constrict, known as vascular reactivity, is often performed with breath-holding tasks that transiently raise arterial blood carbon dioxide (PaCO2) levels. However, following the proper commands for a breath-holding experiment may be difficult or impossible for many patients. In this study, we evaluated two approaches for obtaining vascular reactivity information using blood oxygenation level-dependent signal fluctuations obtained from resting-state functional magnetic resonance imaging data: physiological fluctuation regression and coefficient of variation of the resting-state functional magnetic resonance imaging signal. We studied a cohort of 28 older adults (69 ± 7 years) and found that six of them (21%) could not perform the breath-holding protocol, based on an objective comparison with an idealized respiratory waveform. In the subjects that could comply, we found a strong linear correlation between data extracted from spontaneous resting-state functional magnetic resonance imaging signal fluctuations and the blood oxygenation level-dependent percentage signal change during breath-holding challenge (R2 = 0.57 and 0.61 for resting-state physiological fluctuation regression and resting-state coefficient of variation methods, respectively). This technique may eliminate the need for subject cooperation, thus allowing the evaluation of vascular reactivity in a wider range of clinical and research conditions in which it may otherwise be impractical.
Keywords
Introduction
Measuring vascular reactivity (VR) provides insights into vascular health and assists in the diagnosis and treatment planning of cerebrovascular diseases such as carotid stenosis and Moyamoya disease.1–3 VR studies quantify the ability of vessels to respond to a vasodilatory stimulus, such as a change in arterial carbon dioxide (PaCO2) levels. While many different modalities, including transcranial Doppler, single photon emission computed tomography, positron emission tomography, and xenon-enhanced computed tomography, have been used to assess VR, magnetic resonance imaging (MRI) is an ideal method, given its lack of radiation, spatial resolution, and multitude of potential contrast mechanisms. It can also be used in functional MRI (fMRI) studies to account for vascular variability between different populations. 4 Currently, MR-based VR experiments are often carried out using breath-holding tasks, administration of CO2 enriched gas, or use of vasodilatory pharmaceuticals, such as acetazolamide. These methods, however, require specific equipment and impose certain requirements on study subjects, and as such, may not be suitable or feasible for many research and clinical studies.
Breath-holding increases arterial CO2, resulting in vasodilation of resistance arterioles leading to increased cerebral blood flow. In the absence of a compensatory increase in the brain’s neuronal activity, this produces a global increase in the blood oxygenation level-dependent (BOLD) signal.5,6 It can be viewed as the response of the brain’s vasculature to an externally imposed change in PaCO2. However, even in the absence of an external challenge, in the so-called resting-state, the BOLD signal fluctuates. The majority of these fluctuations occur in response to internal challenges such as pulsation of blood induced by the heartbeat, changes in PaCO2 level induced by respiration, and baseline neuronal activity. Therefore, these fluctuations potentially contain information about the vasculature’s capacity to dilate and constrict, providing information about cerebrovascular autoregulatory and reactivity mechanisms.
Spontaneous fluctuations in the BOLD signal measured in resting-state fMRI (rs-fMRI) experiments have been widely used to map the intrinsic functional architecture of the brain.7,8 It has been shown that the instantaneous fluctuation in partial pressure of end-tidal CO2 has a strong influence on the rs-fMRI signal.9,10 Recently, these fluctuations have also been used to obtain information about cerebrovascular functions such as arterial delay11,12 and small vessel disease in white matter (WM). 13 The potential of spontaneous fluctuations rs-fMRI to obtain cerebrovascular reactivity information has also been proposed in a number of previous works.14–19 Some of these techniques17,19 require measurement of the end-tidal CO2 and despite their great potential for estimating cerebrovascular reactivity from rs-fMRI data, due to the need for specialized equipment and requirements, they may not always be practical for clinical applications. In this study, we focus on methods that do not require additional equipment and recording of additional data (i.e., breath-holding and rs-fMRI). The standard deviation of the rs-fMRI time-course14–17,19 and global signal regression 19 also have been suggested for extracting VR information from rs-fMRI data without the need for additional data. These methods have shown moderate correlation with the breath-holding method. We propose that new features inferred from rs-fMRI can improve the agreement between VR information obtained from the rs-fMRI and breath-holding approaches.
Since the ultimate goal of this project was to use the rs-fMRI methods for clinical applications, we evaluated these methods in a group of older adults with chronic kidney disease. It has been shown that healthy aging 20 and chronic kidney disease 21 are each cause associated with attenuated VR compared to a healthy young population and therefore may be more challenging populations in which to measure VR. 14
Methods and materials
MRI data
This prospective study was approved by the Stanford University’s internal review board and was Health Insurance Portability and Accountability Act (HIPAA) compliant. Written informed consent was obtained prior to all human studies. The Stanford University’s internal review board approved the consent procedure.
There were 28 older adults (69 ± 7 years; range 56–83; 11 females) included in this study; 20 of these subjects were participating in the Systolic Blood Pressure Intervention Trial (SPRINT) Mind the Kidneys ancillary study, a neuroimaging study of patients with hypertension and chronic kidney disease. 22 Major exclusion criteria included diabetes mellitus, history of clinical stroke, eGFR < 20 mL/min/1.73 m2, or proteinuria equivalent to > 1 g/day. The remaining eight subjects were recruited from the community with similar age range and the same exclusion criteria as the SPRINT participants.
All subjects were scanned at 3T (MR750, GE Healthcare, Waukesha, WI) using an 8-channel head coil. BOLD signal changes for the rs-fMRI and breath-holding task were performed with the same imaging parameters: a two-dimensional gradient-echo echo-planar imaging (EPI) sequence (FOV = 22 cm, matrix = 64 × 64, slice thickness/slice spacing = 3.5/0 mm, number of slices = 35 covering the whole-brain, TR = 2 s, TE = 25 ms, flip angle = 75°, number of time points = 120 for rs-fMRI and 105 for breath-holding experiments). A three-dimensional T1-weighted image was acquired for anatomic reference using an IR-SPGR sequence (TR/TE/TI = 8.18/3.2/900 ms, matrix = 256 ×256, in-plane resolution = 0.94 × 0.94 mm, slice thickness/slice spacing = 1/0 mm, 176 sagittal slices). Cardiac and respiratory waveforms were recorded from the scanner’s built-in photoplethysmograph and respiratory belt placed around the upper abdomen. The cardiac and respiratory recordings were automatically synced with the fMRI data on the scanner.
Breath-holding experiment
The breath-holding paradigm consisted of four cycles of 26 s of normal breathing followed by 4 s of exhalation and 16 s of breath-hold (Figure 1(a)). At the end of the breath-holding cycles, there was 26 s of normal breathing. The breath-holding paradigm was cued using textual instructions on a projector.
(a) Schematic of the breath-holding paradigm. Each block was cued using a video projector, and repeated four times, followed by 26 s of normal breathing for a total scan time of 210 s. (b) Simulated respiratory volume and respiratory variation (RV) time series representing the situation in which the subject ideally complies with the breath-holding task.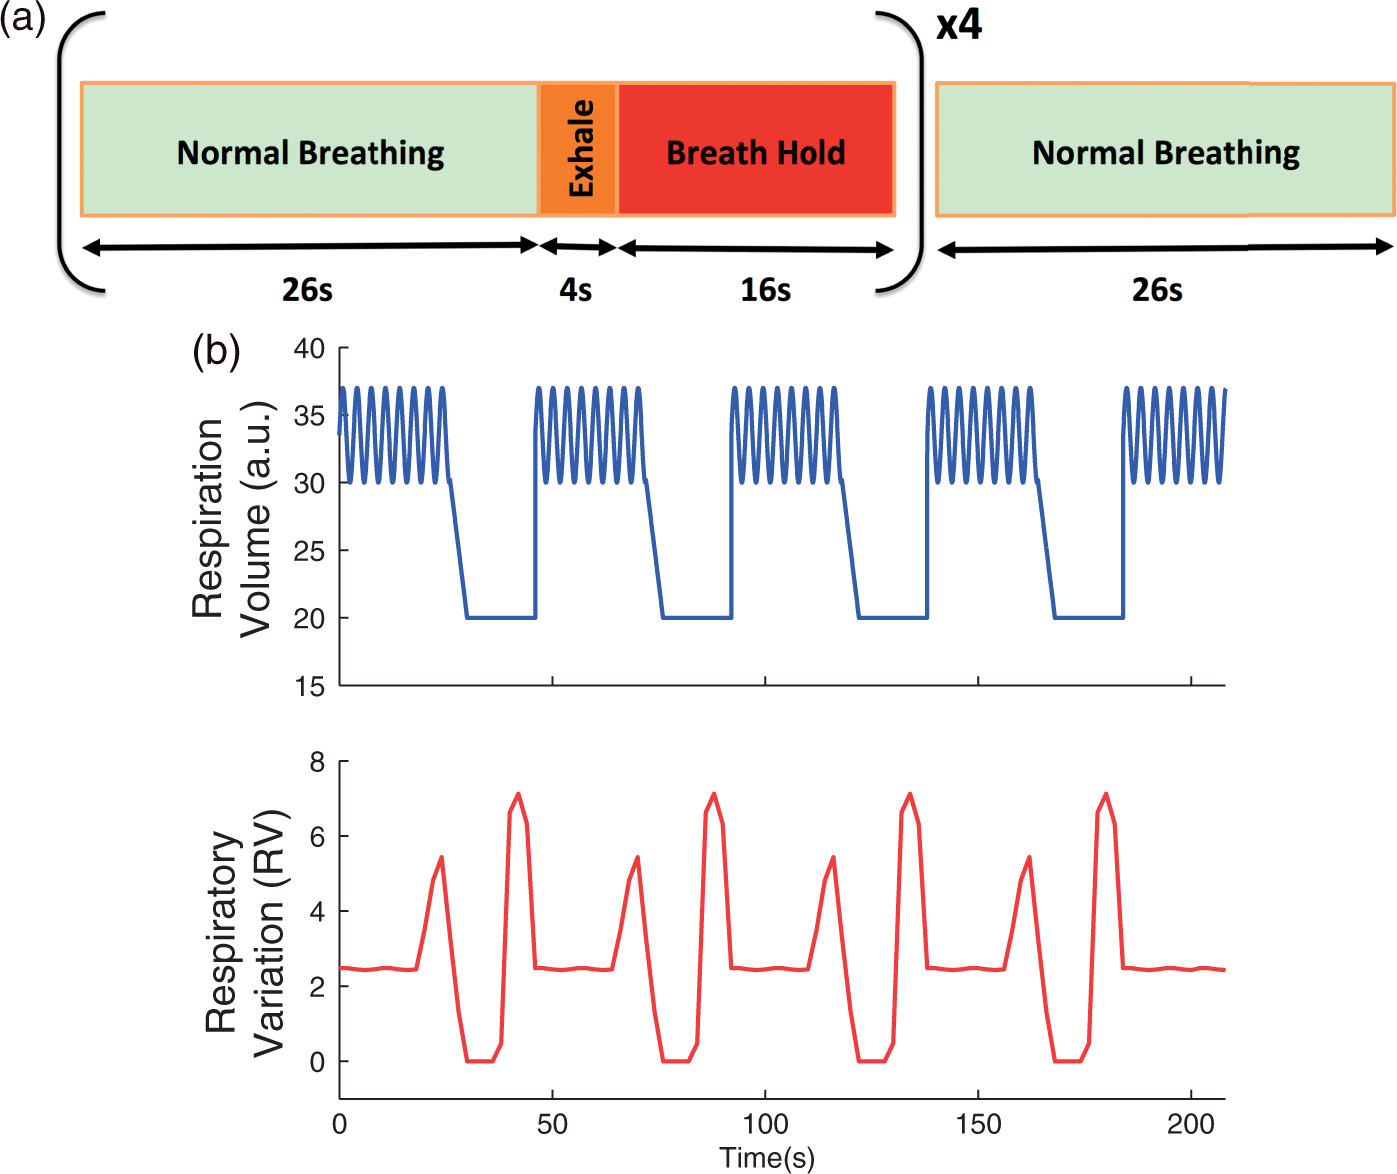
Since adherence to the instructions of the breath-hold task was not perfect in this group of older adults, we inspected the respiratory signal recorded from the respiratory belt during scanning to ensure that the subjects performed the breath-holding task properly. We computed the respiratory variation (RV) time series—defined as the standard deviation of the respiration waveform across a 6-s sliding window for each subject. 23 We then computed the correlation coefficient between the obtained RV time series and that of a simulated reference respiratory time series representing perfect compliance with the breath-holding challenge (Figure 1(b)).
Breath-holding data were analyzed using a general linear model (GLM) approach implemented in the FEAT FSL software package (http://www.fmrib.ox.ac.uk/fsl). As shown in Figure 2(a), a 16-s ramp delayed by 8 s convolved with the standard SPM (http://www.fil.ion.ucl.ac.uk/spm/), double gamma variate hemodynamic response function24,25 was used as a predictor in the model. This is based on data from,
26
in which the BOLD response to breath-holding challenge was measured, and shown to be well-described by a delayed ramp pattern.26,27 The temporal derivative of this predictor was also included in the model to allow for temporal shifts between the model and the breath-holding data. Results were then converted to percentage signal change. To this end, average BOLD signal averaged over normal breathing periods between the breath-holding challenges provided the baseline for normalization for each subject.
Processing steps for (a) breath-holding and (b) rs-fMRI data. Breath-holding data were analyzed employing a 16-s ramp regressor delayed by 8 s and convolved with the standard SPM double gamma variate hemodynamic response function. rs-fMRI data were analyzed using two approaches: (1) Physiological fluctuation regression using GLM analysis of the average CSF signal (rs-PFR) and (2) voxel-based coefficient of variation (CV) of the signal fluctuation (rs-CV).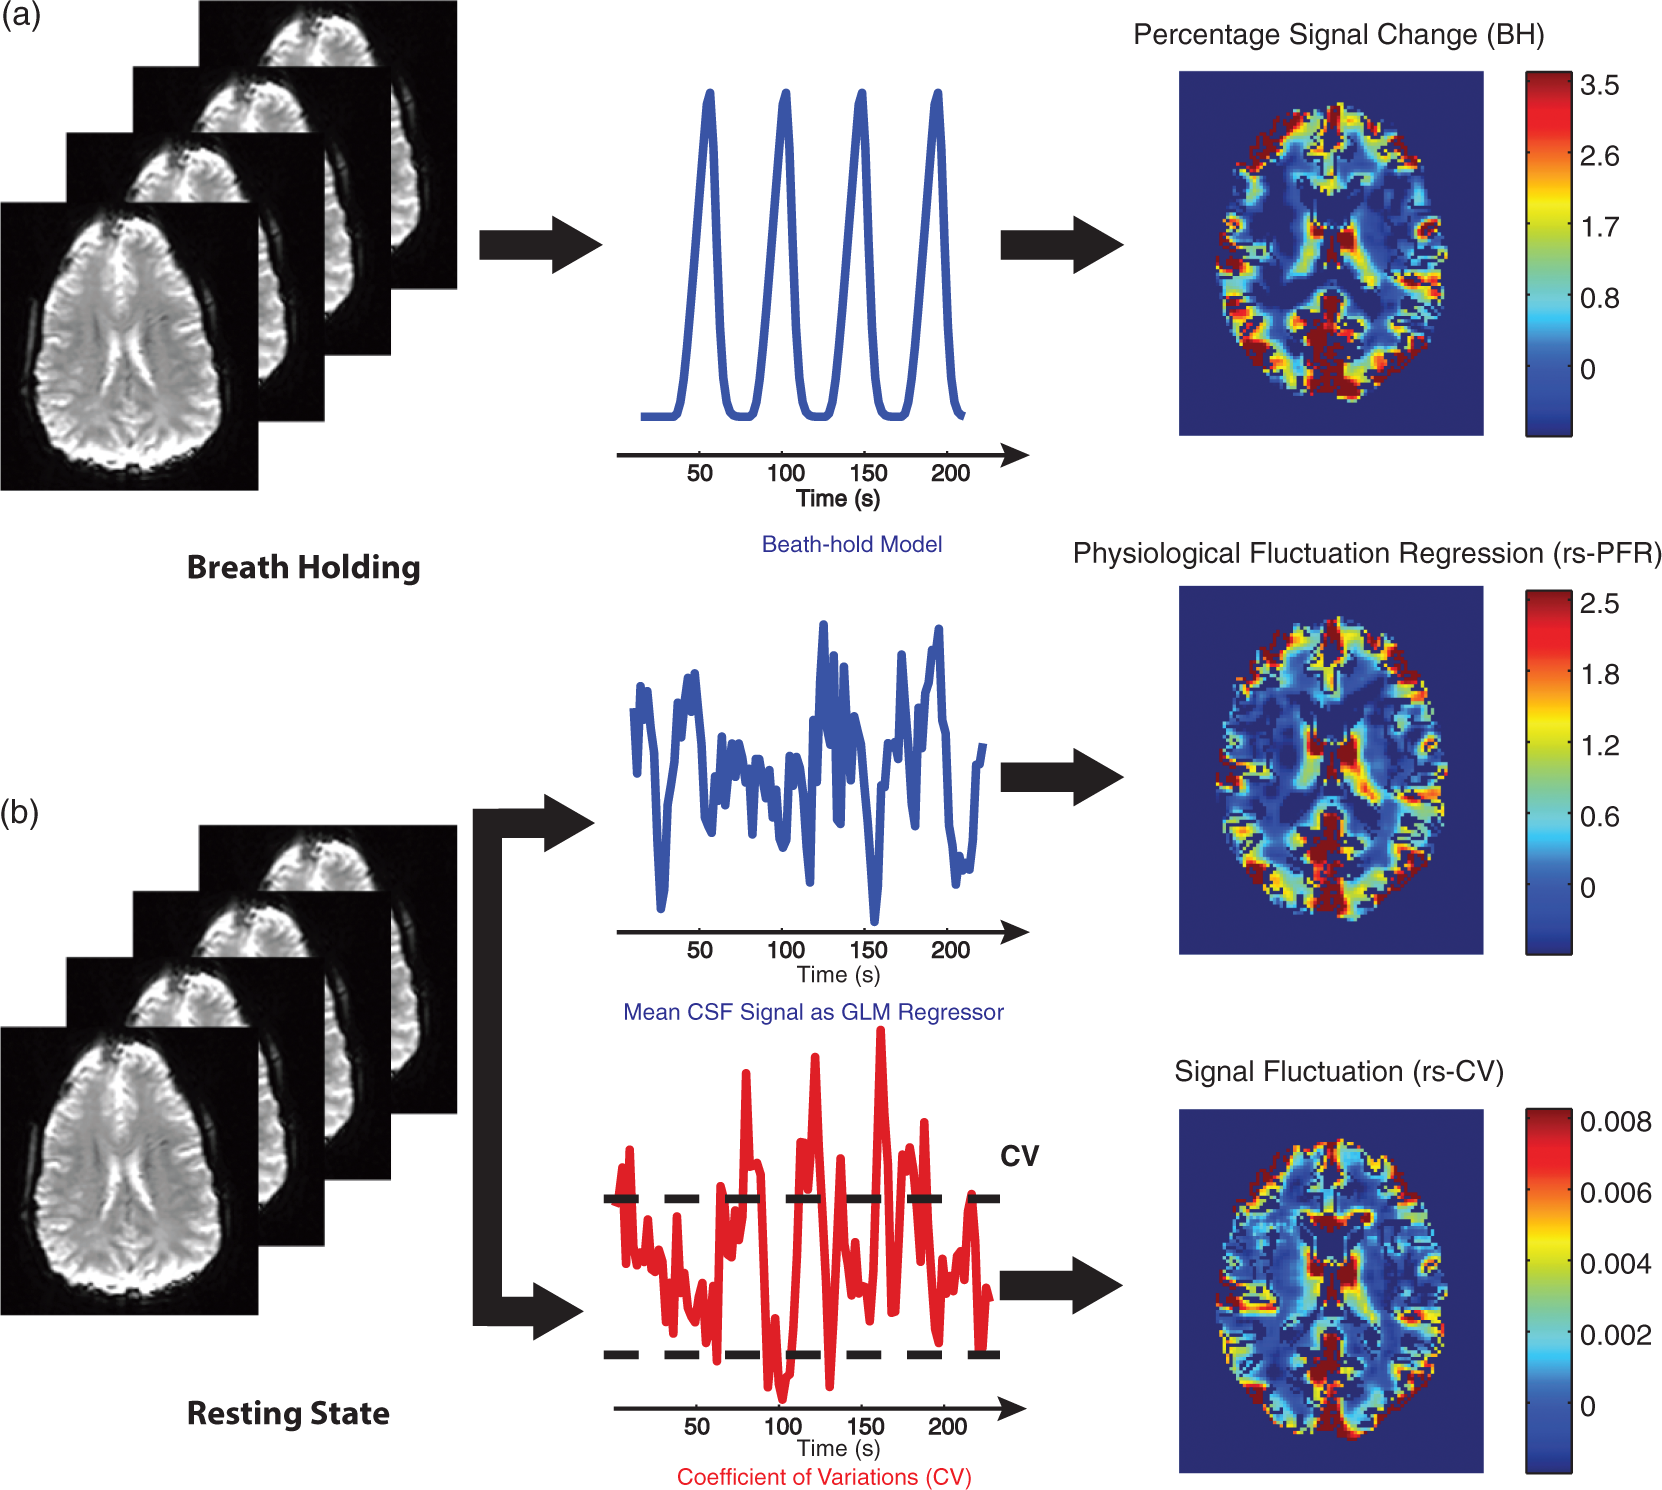
Resting-state fMRI
rs-fMRI data were analyzed using two approaches: (1) We considered the mean BOLD signal in cerebrospinal fluid (CSF) to be an indicator of internal physiological fluctuation and stimuli to the vascular system.
28
We computed the degree to which each voxel responded to this stimulus using a GLM (Y = X
Image pre-processing
Both the rs-fMRI and breath-holding EPI images were realigned and co-registered to the Montreal Neurological Institute (MNI) atlas using the FSL software package. Baseline scanner drift was estimated and removed from the EPI images by a first-order polynomial detrending. A high-pass filter was also applied to remove any residual higher order low-frequency signal drifts (<0.01 Hz) from the data. For the rs-fMRI data, to further reduce any signal changes related to movement, rigid body motion estimated with six parameters was removed from the data by linear regression. We did not perform this step for the breath-holding data because movement in these scans often correlates with the breath-holding paradigm.
Structural regions of interest
Gray matter (GM), WM, and CSF masks were generated from the GM, WM, and CSF estimation maps based on the T1-weighted structural images using FSL (FAST). All VR measurements were calculated within GM and WM masks. CSF mask was used to calculate the regressor in the rs-PFR method as described earlier. Only voxels with a probability threshold of >0.8 were included in the GM, WM, and CSF masks to minimize partial volume effects. For the CSF mask, this threshold resulted in the majority of voxels comprising the ventricular CSF space with minimal contribution of the subarachnoid space. VR measurements were also calculated in 16 anatomical-structural regions defined in MNI space. Eight of these regions consisted of cerebellum, four GM lobes (frontal lobe, occipital lobe, parietal lobe, and temporal lobe), and three subcortical structures (insula, putamen, and thalamus) based on the International Consortium for Brain Mapping template. 30 Supratentorial WM was subdivided equally into eight regions of interests (ROIs) with respect to the center of the brain.
Statistical analysis
We used linear least-squares regression to compare the rs-fMRI and breath-holding measures within the 16 structural ROIs as well as in GM and WM. We also calculated the voxel-wise correlation (R2) across all GM and WM voxels between rs-PFR vs. BH (breath-holding) and rs-CV vs. BH for each subject separately.
Results
Breath-holding performance evaluation
Recorded respiratory waveforms along with their corresponding RV time series for two representative subjects are shown in Figure 3(a) and (b). The subject shown in Figure 3(a) properly adhered to the breath-holding task, while the subject shown in Figure 3(b) did not. The corresponding VR maps (thresholded at z > 2.3) are also shown in Figure 3(c) and (d).
Respiratory volume and respiratory variation (RV) time series shown for two representative subjects: (a) a subject with good compliance with the breath-holding task and (b) a subject with poor compliance with the breath-holding task. The corresponding vascular reactivity maps, thresholded at z > 2.3, for these subjects are shown in (c) and (d).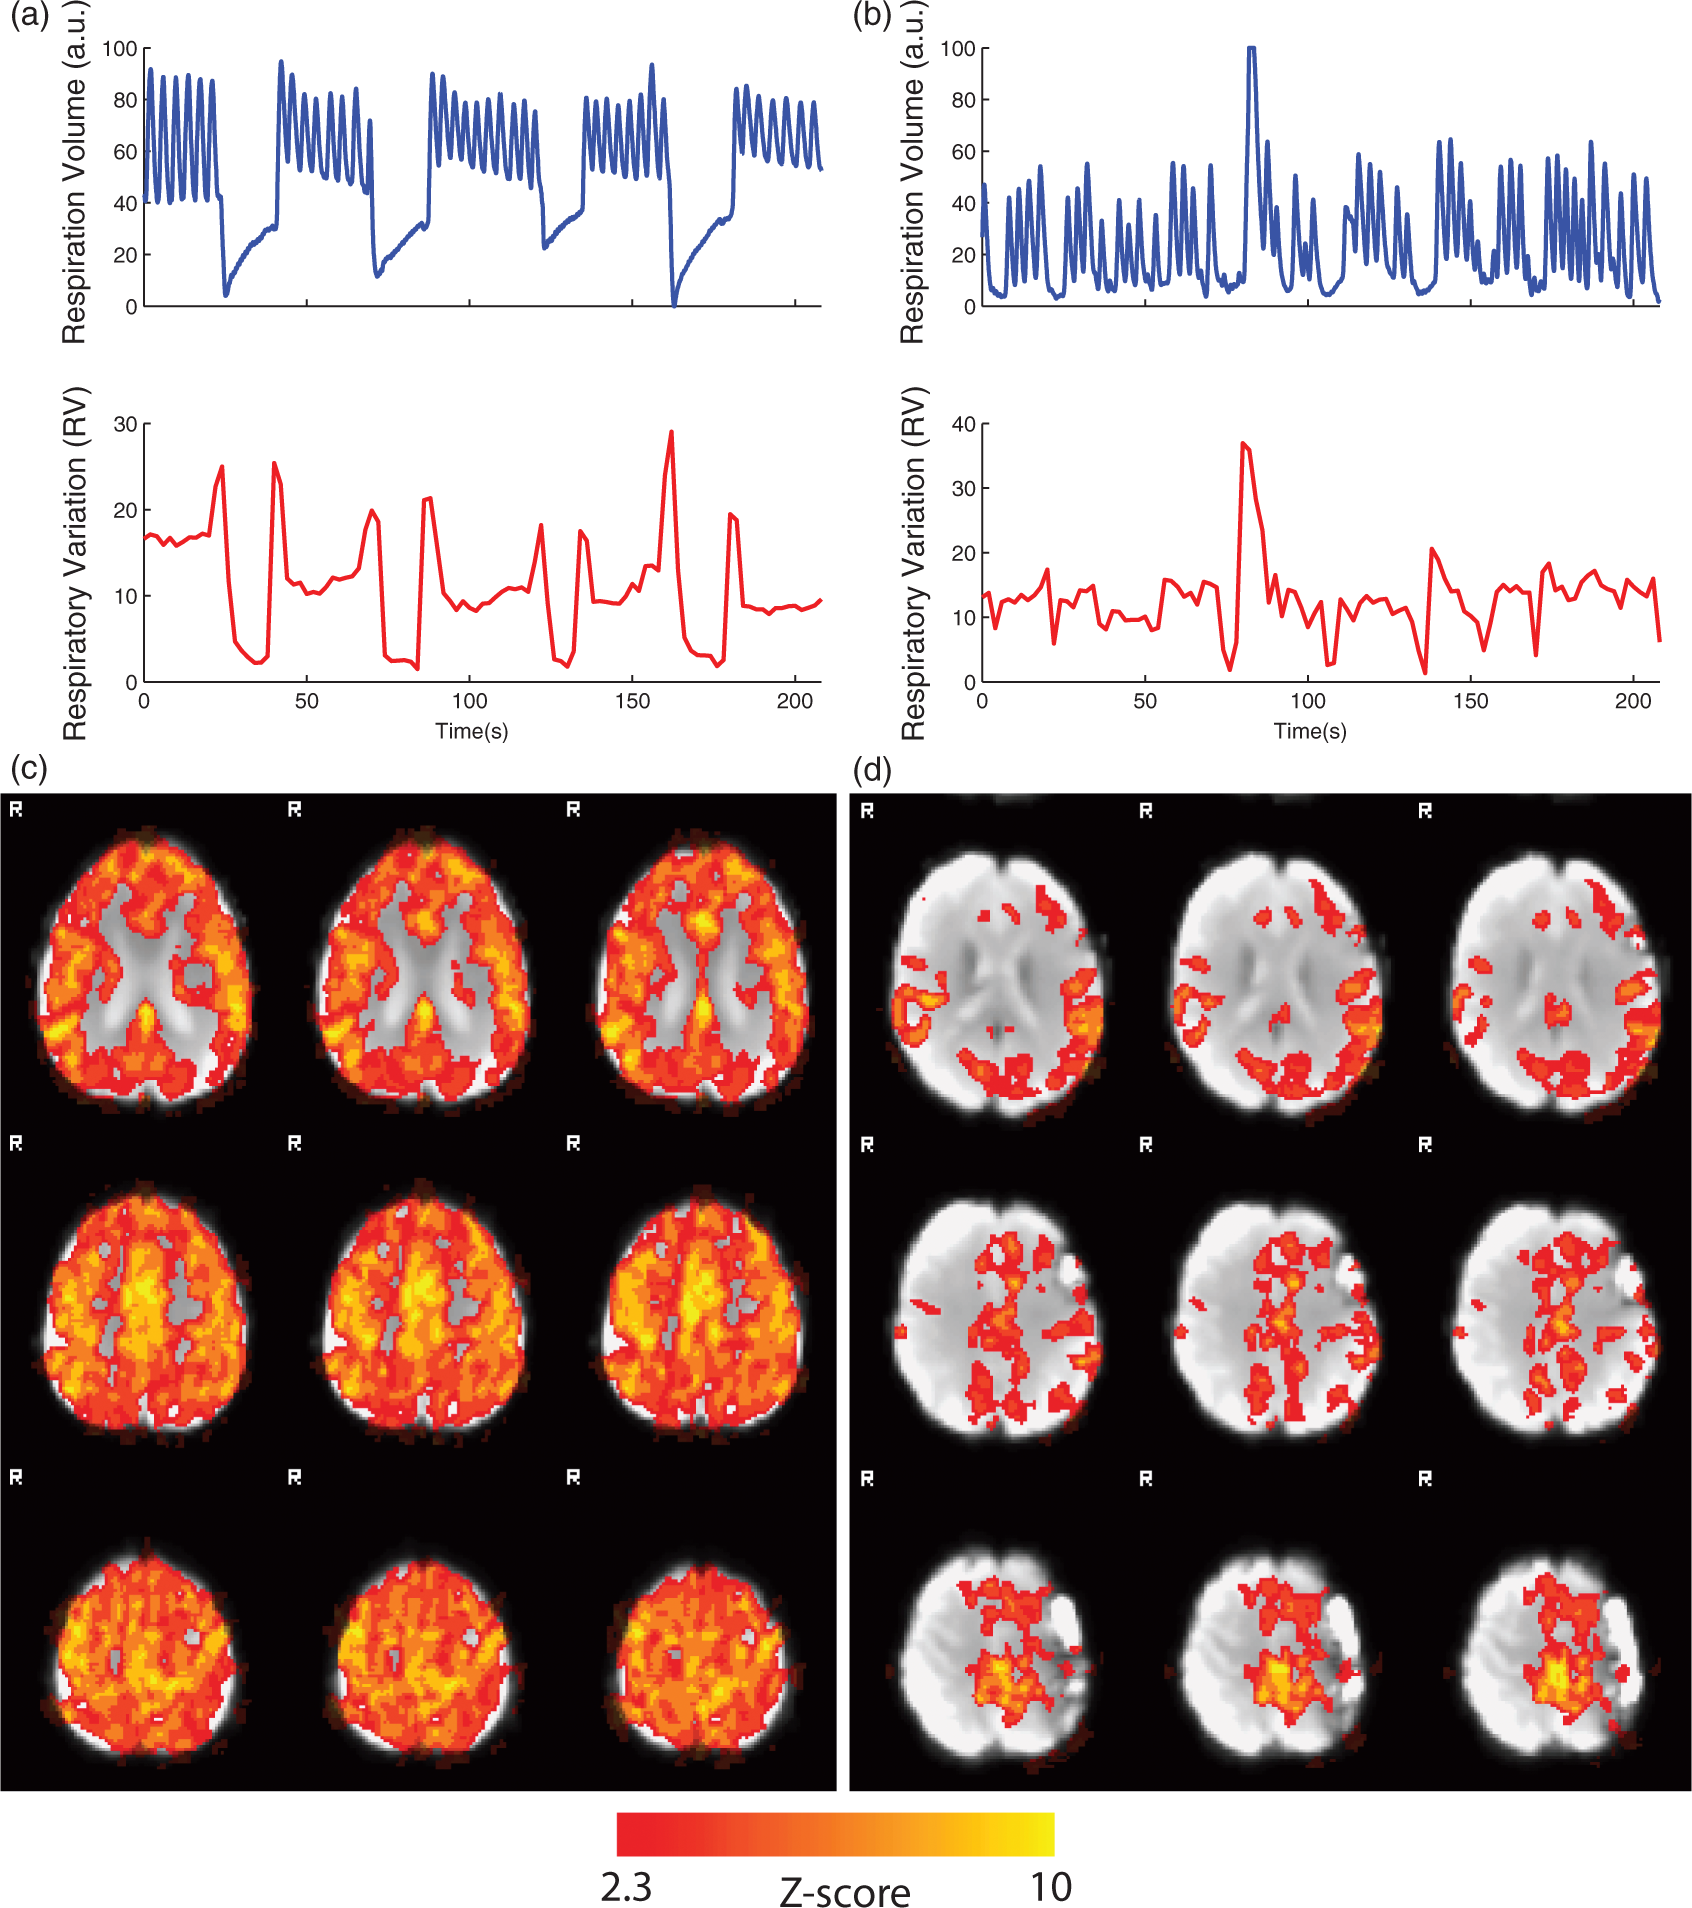
The calculated correlation coefficients between the simulated reference and experimental RV time series for all subjects are presented in Figure 4(a). Points are overlayed upon a 95% confidence interval in red and one standard deviation in blue and the red line represents the mean. As can be seen, 6 of the 28 subjects (21%), marked with red circles, had correlation coefficients below 0.2, demonstrating that they could not adequately comply with the breath-holding task. VR maps estimated using BH, rs-PFR, and rs-CV methods for one of these subjects are shown in Figure 4(b) to (d), respectively.
The correlation coefficient values between the simulated and measured RV time series for all subjects are shown in (a). 6 of the 28 subjects, marked with red circles, had correlation coefficients below 0.2, demonstrating poor compliance with the breath-holding task. VR maps estimated using BH (b), rs-PFR (c), and rs-CV (d) methods for one of these subjects are presented. Only subjects with correlation coefficient > 0.2, marked with blue circles were included in comparative analyses.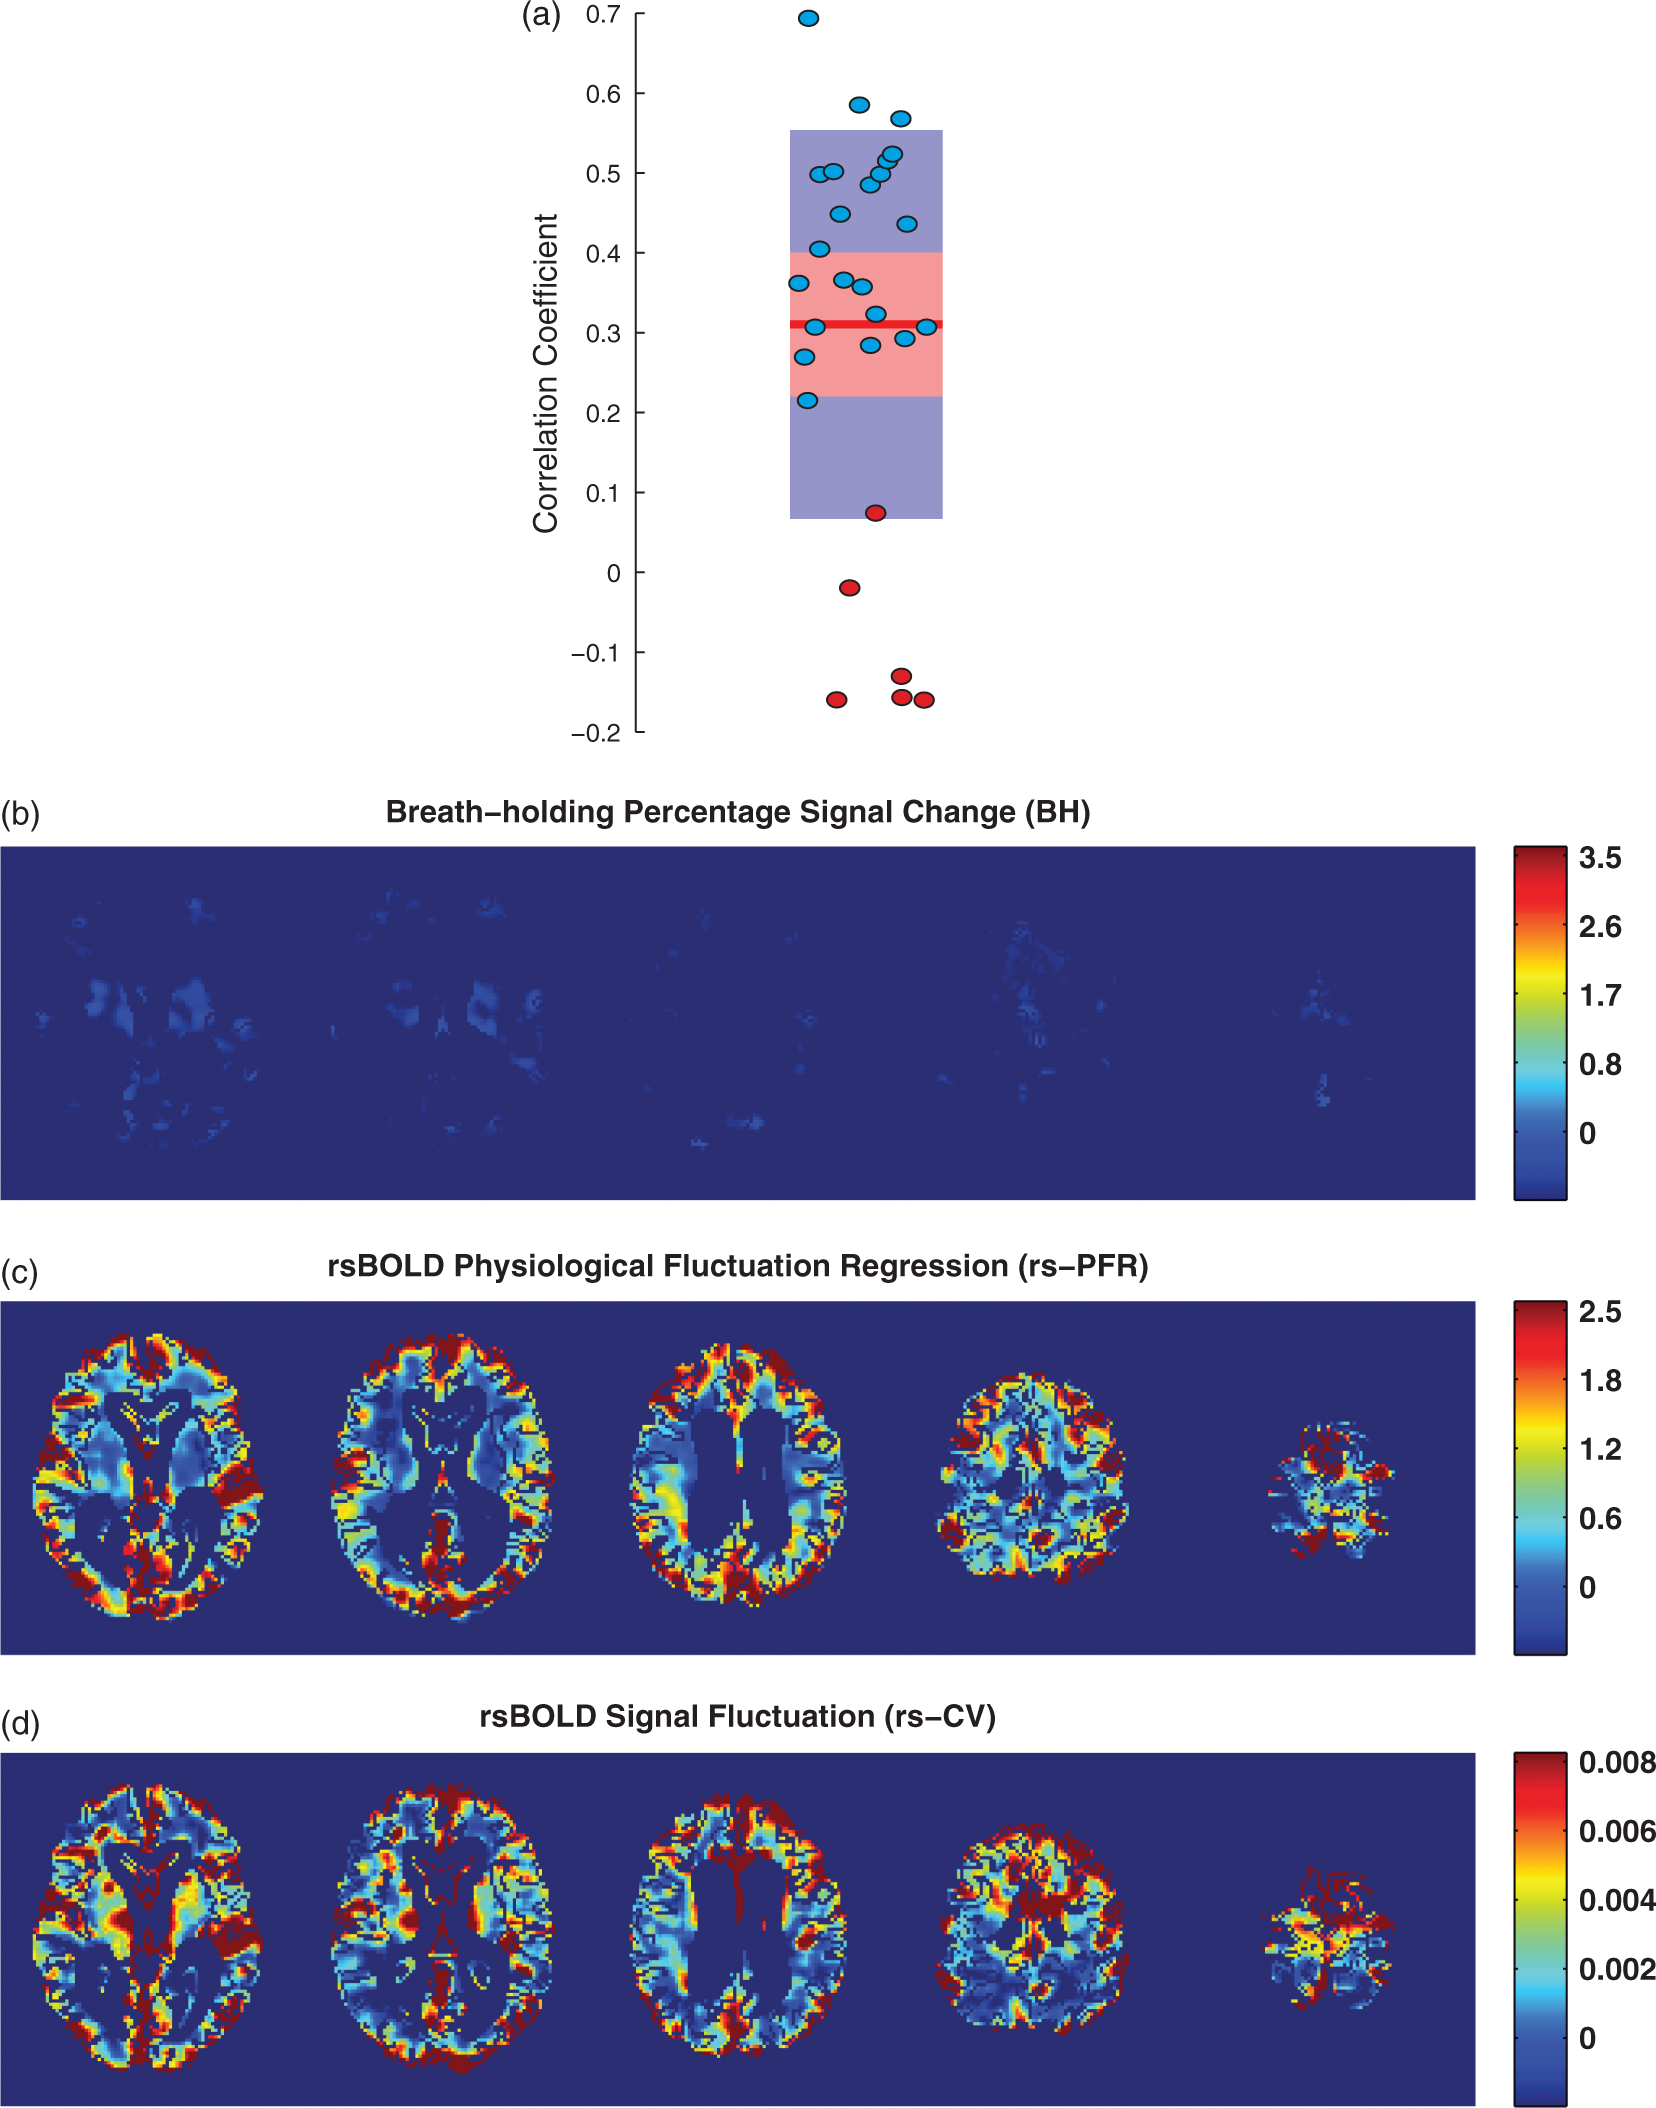
Breath-holding vs. rs-fMRI
An example of the maps obtained from each VR method in a representative subject is presented in Figure 5. Of note are the common areas of VR detected using all three methods. Voxel-wise correlation values measured in all GM and WM voxels in each subject separately between BH versus the rs-fMRI methods (rs-PFR and rs-CV) are presented in Figure 6, demonstrating a significant correlation between the two types of VR measurements (rs-PFR vs. BH: R2 = 0.50 ± 0.08, p < 0.0001; rs-CV vs. BH: R2 = 0.54 ± 0.07, p < 0.0001; rs-PFR vs. rs-CV R2 = 0.52 ± 0.09, p < 0.0001). The correlation between the respiratory time course convolved with hemodynamic response function (the standard SPM double gamma variate24,25), and the mean CSF signal was 0.23 ± 0.07 (mean ± SD).
Vascular reactivity maps measured using: (a) breath-holding percentage signal change (BH), (b) resting-state physiological fluctuation regression (rs-PFR), and (c) resting-state coefficient of variation (rs-CV) techniques in a representative subject. CSF is masked in these images. Voxel-wise correlation values (R2) across all subjects between vascular reactivity as calculated with BH versus and the two rs-fMRI methods: (a) rs-PFR and (b) rs-CV, both of which were strongly statistically significant (P < 0.001). Additionally, the correlation between rs-PFR and rs-CV (c) was also significant (P < 0.001). Correlation values were calculated separately over the whole GM and WM voxels for each subject. The red line and whiskers, respectively, represent first and third quartiles, median, and minimum/maximum of the results in each individual.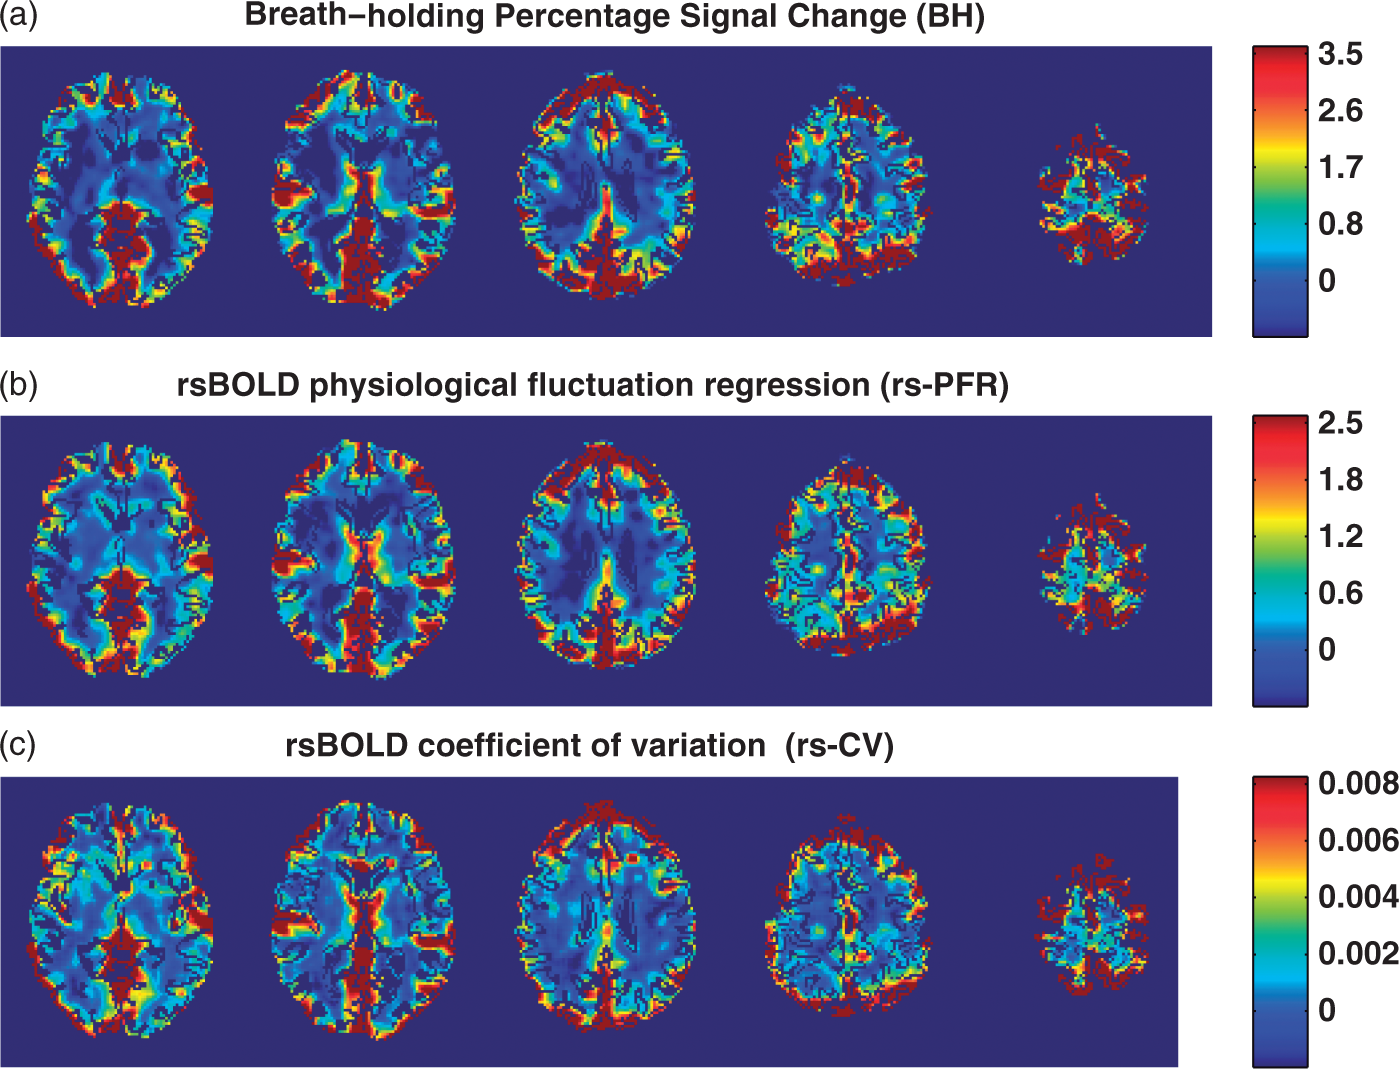
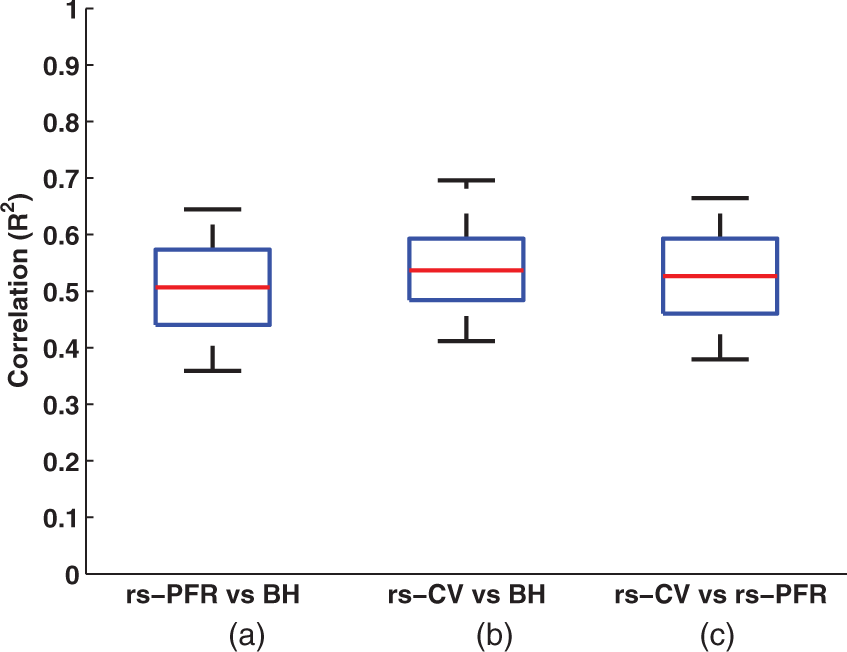
Figure 7 includes plots of the BH percentage signal change versus the rs-PFR and rs-CV resting-state measures calculated within 16 structural ROIs as well as the GM and WM masks. Similarly, a comparison of rs-PFR and rs-CV is also presented. As expected, the VR was lower in WM compared to GM in all three methods.
Vascular reactivity measurements in different regions of interests (ROIs). rs-PFR and rs-CV versus BH measurements in 16 pre-defined structural ROIs are shown in (a) and (b), respectively, along with a color-coded map of their locations. A comparison of rs-PFR and rs-CV is shown in (c). Similarly, rs-PFR and rs-CV versus BH measurements in the GM and WM masks are shown in (d) and (e), respectively. A comparison of rs-PFR and rs-CV in the GM and WM ROI’s is also shown in (f). Both rs-PFR and rs-CV demonstrated statistically significant correlations with BH-derived VR, but the correlations for the rs-CV method tended to be higher.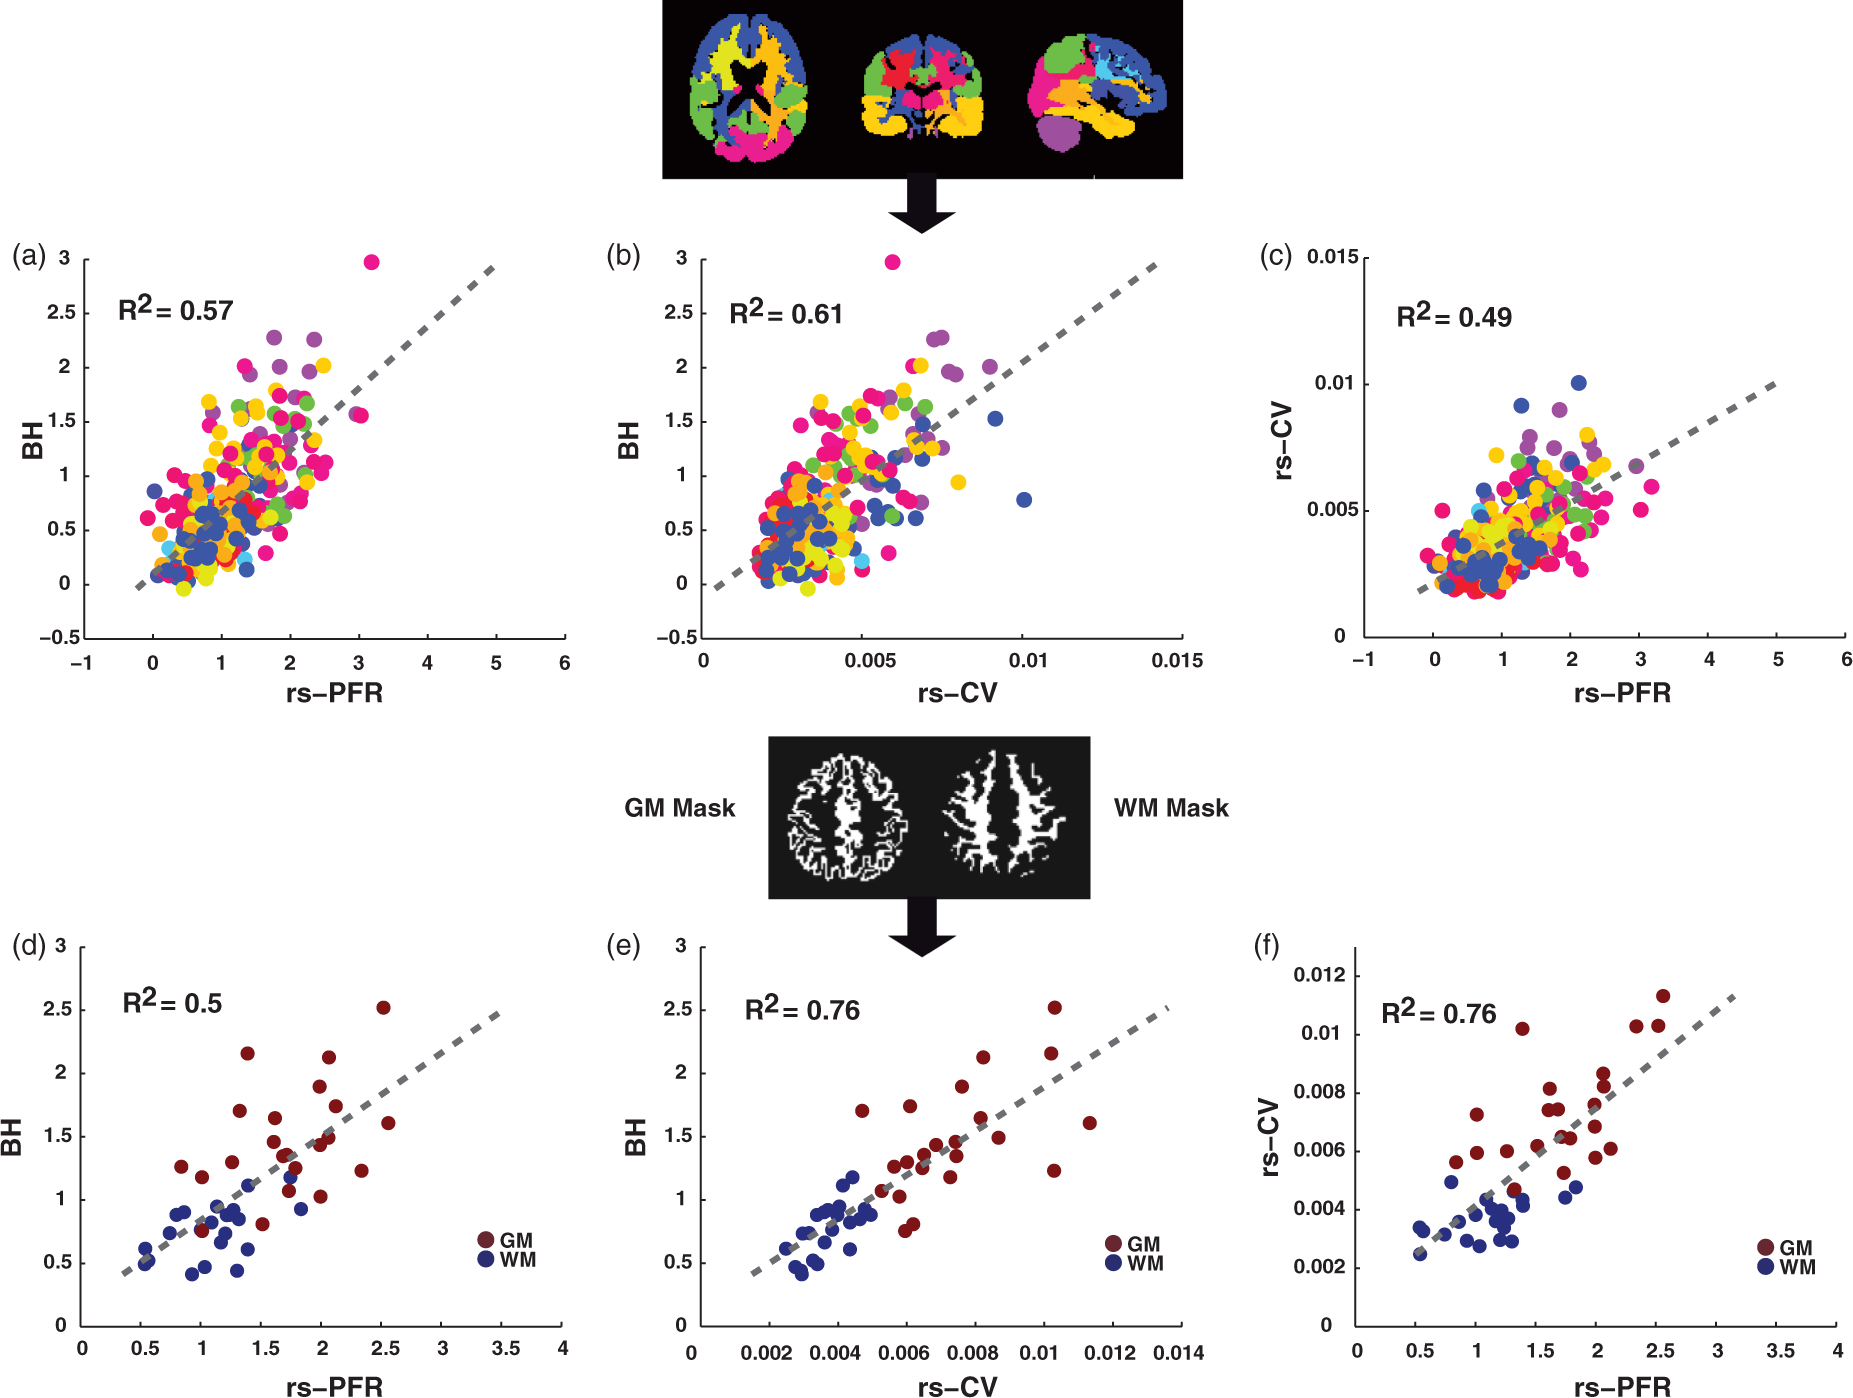
We also explored the possibility of using standard deviation (STD) instead of CV but found a weaker correlation between STD and BH compared to that of CV (see Supplemental Figure S1). As can be seen, rs-CV provides a higher correlation value demonstrating its improved assessment of VR as compared to the simpler STD approach. We also evaluated GM, WM, and mean global signals as alternative regressors for the rs-PFR approach. These measures produced biased estimates, as indicated in Supplemental Figure S2. In the plots, where WM or GM is considered as regressors individually (Figure S2(a) and (b)), correlation points in the corresponding tissue type (WM in (a) and GM in (b)) demonstrate a clearly different linear relationship with respect to BH percentage signal change suggesting these are not appropriate regressors.
Discussion
In this study, we showed that rs-fMRI BOLD signal fluctuations are positively correlated with cerebrovascular reactivity based on breath-holding experiments. We evaluated two rs-fMRI based metrics: (1) Parameter estimate maps obtained from a GLM analysis of the rs-fMRI data using the CSF signal as a predictor of physiological fluctuations (rs-PFR) and (2) the CV of the rs-fMRI time series (rs-CV). We compared the results of these two approaches to VR measured during a BH challenge in a population of older adults.
The population of older adults studied here is expected to have an attenuated VR range compared to a healthy young population.20,21 Except for one study, 14 other studies comparing the breath-holding and resting state based VR measurement approaches have studied healthy young subjects. This study is the first to compare different rs-fMRI approaches in older adults.
Measuring the end-tidal CO2 enables the quantification of VR values with units of %ΔBOLD/Δ mmHg CO2, which has been used for quantification of both breath-holding and resting-state VR maps.17,19,27 It normalizes the percentage change in the BOLD signal by the respective percentage change in the partial pressure of end-tidal CO2 and therefore reduces the effect of differences in partial pressure of end-tidal CO2 changes between rest and BH across subjects. Incorporating the end-tidal CO2, signal may also reduce the effect of breath-holding performance of the subject. 27 For example, in our study, we may have obtained better VR maps in those patients who were not able to perform the task properly. However, as reported by Lipp et al., 17 end-tidal CO2 measurement errors can be an additional source of variability, potentially impacting the reliability and repeatability of the VR results. While we did see a strong relationship between rs-fMRI measures and %BOLD signal in response to the BH challenge, this could represent a source of variability in our comparisons. Although CO2 based methods have great potentials in quantifying and measuring VR using resting-state and breath-holding data,17,19 because they require specialized equipment and requirements, they may not always be practical for clinical applications. Therefore, in this study, we focused on breath-holding and rs-fMRI methods that do not require additional equipment and recording of additional data.
Six subjects could not perform the breath-holding tasks properly and were excluded. Although it is possible to estimate VR from the rs-fMRI data for these subjects, there is no reference standard from BH scans with which to compare them; therefore, the data from these subjects (marked with red circles) were excluded from any comparative analyses.
Kannurpatti et al.14–16 used the STD of BOLD signal as an indicator of VR to scale the task-induced fMRI BOLD response for the motor and cognitive tasks. They observed a high correlation between temporal standard deviation of the BOLD signal time series obtained during resting-state, breath-holding, or a CO2 challenge (modulating CO2 level by administration of CO2 enriched gas).15,16 They also compared the percentage signal change during a BH task and compared it to the STD of the BOLD signal in two populations of healthy younger and older adults in regions with motor- and cognitive-task activation. 14 They reported a significant correlation between BH and STD only within the motor-task activated area in the healthy younger subjects, but not in the older subjects. 14 Lipp et al. 17 also measured the STD of the resting-state BOLD time series and compared it to breath-holding challenge, reporting highly variable agreement between resting-state and breath-holding methods. Recently, Golestani et al. 19 also estimated the VR using STD of the resting-state BOLD signal and global BOLD signal regression in a group of healthy younger adults. They compared these resting-state-based VR measurements to a CO2 challenge, showing a wide range of within-subject spatial correlation between the VR maps obtained using STD and global signal regression method.
In the current study, we also examined the STD and as can be seen in Supplemental Figure S1, and observed that using CV rather than STD leads to a better correlation with the BH results in our older subject population (mean/std age: 69 ± 7 years). This improvement is probably due to eliminating the influence of the baseline BOLD signal when using CV as compared to STD and may explain why we were able to observed significant correlation between rs-CV and BH results in our older population.
The CSF signal is often considered to be related to physiological noise and is commonly removed from the data using linear regression to improve the specificity of detected functional connectivity networks in rs-fMRI experiments.31,32 Besides CSF, global BOLD signal fluctuations in rs-fMRI data are also believed to have non-neuronal origins9,33–35 and have a strong association with partial pressure of end-tidal CO2 36 and therefore can also be used as the regressor for rs-PFR analysis. However, the nature of the global signal has been a controversial issue. 37 It has also been shown that the global signal also contains neuronal information. 38 Global signal as well as mean signal in WM and GM were also considered as regressors in this study. However, as can be seen in Supplemental Figure S2, we observed clear biases in the measurements in GM or WM. Therefore, we do not recommend the use of these regressors or their combination (e.g., global signal) for obtaining VR information.
Our results indicate a statistically significant linear relation between BH% signal change and proposed methods based on rs-fMRI fluctuations calculated in 16 structural ROIs. Significant spatial correlation was also observed between the individual maps obtained from these techniques. This is generally consistent with previous studies suggesting that information about cerebrovascular function can be obtained from rs-fMRI.14–19 Golestani et al. report a significant within-subject correlation within a set of 32 ROIs between VR maps obtained from CO2 challenge (as the gold standard) and resting-state-based methods including fluctuation amplitude as well as global signal regression but did not report the whole-brain voxel-wise correlations and therefore cannot be readily compared to our within-subject results. Although we have used a different reference VR method (BH challenge instead of a CO2 challenge), the correlation value they reported for the fluctuation amplitude method in GM mask (R2 = 0.36) is very close is that of our rs-CV (R2 = 0.32). However, unlike our rs-PFR results their global signal regression method did not reach a significant level of agreement with their reference VR method (the CO2 challenge). Lipp et al. 17 found a significant within-subject voxel-wise agreement between the resting-state STD method and BH using a Pearson cross correlation (median r = 0.63) which is in the range reported in this study (median R2 = 0.55). However, any comparison of the results of different VR studies must consider that there are many confounding variables that affect the correspondence between rs-fMRI and the reference method. The reference method (BH vs. CO2 challenge) and the exact analysis method will affect the results.17,26 In addition, the acquisition technique and parameters used for functional MRI 19 as well as differences in physiological noise for different subjects (e.g., age, blood pressure, or caffeine intake) could affect the comparison results. Thus a thorough, empirical, side-by-side comparison is required to fairly assess the advantages and disadvantages of these methods.
In contrast to rs-CV signal, which contains some contribution from the neuronal activity signal, the mean CSF signal reflects essentially fluctuations in the signal within the ventricles, and is presumably of purely non-neuronal origin. Therefore, compared to rs-CV, one might expect the rs-PFR results to be more closely correlated with the BH results. However, since the rs-CV and rs-PFR approaches are fundamentally different, the differences in their results (which is not significant) cannot readily be attributed to the contribution from neuronal activity. CV estimates the VR in each voxel separately where rs-PFR approach uses the CSF time course as an indicator of internal vascular stimuli for all the voxels. The better performance of the CV could possibly be due to the fact that the vascular stimulus is not necessarily the same for all the voxels, which can induce some errors in the regression approach. In this study, we used a strict CSF mask (probability threshold of > 0.8) to minimize partial volume effects from GM and WM, which would result in contribution from different physiological noise sources. For the CSF mask, this threshold resulted in the majority of voxels within the ventricular CSF space with minimal contribution of the subarachnoid space.
The BOLD signal change in response to BH challenge is larger than the spontaneous rs-fMRI signal fluctuations. In this study, we assumed that VR in response to smaller signal fluctuations is linearly related to larger signal changes in response to BH. Although our results suggest that this assumption is valid, further studies are required to investigate the linearity of VR and its relation to the BOLD signal. If this linear relation is not valid, it suggests that the proposed methods explore VR over a range that has not been investigated before and may provide new clinically relevant information.
Besides the vasodilatory hypercapnia-based techniques, hypocapnia challenges such as controlled hyperventilation protocols leading to vasoconstriction have also been employed to measure the VR.39–42 However, as shown in post-stroke patients, they do not provide equivalent measurements and might exhibit different aspects of VR.40,42 Therefore, the relationship between the rs-fMRI based VR measurements and those obtained from the hypocapnia challenges needs to be studied in the future.
Significant arterial delays (e.g., in some Moyamoya or stroke patients) can induce a lag in the spontaneous BOLD signal fluctuations with respect to the global signal.11,12 Such delays will also affect the BH values, though this is typically not accounted for using standard BH processing methods. The correction strategy for delays in BH experiments could involve estimation of these temporal delays, probably using a separate scan, either with rs-fMRI, 12 dynamic susceptibility contrast, or arterial transit time mapping with arterial spin labeling, complicating the BH method. An alternative approach would be the use of advanced processing methods such as Fourier modeling. 43 Significant arterial delays (e.g., in stroke and Moyamoya patients) may also affect the rs-PFR values and lead to underestimation of the VR within the delayed areas. The CV approach, however, is not sensitive to temporal delays and therefore may be a better choice in these patient populations, and in fact, does appear to show better correlation with BH in these older adults.
The present study suffers from several limitations. First, the repeatability of results was not explored. Second, in this study, we did not record the partial pressure of end-tidal CO2 that could provide a better evaluation of the subjects’ compliance with the task and enable quantitative measurement of VR using a wider range of methods. Third, we studied a relatively small sample over a restricted age range that limits the power and generalizability of this study, though it is probably a more clinically relevant population than younger healthy adults. Fourth, the linearity of the BOLD response to smaller and larger stimuli (internal or external) was not investigated. Future work could also include evaluating the VR measurements using the proposed approaches in a larger cohort and also in patients with other pathologies.
BH tasks require specialized hardware (i.e., video projectors, glasses, etc.) and are optimally suited to actively participating subjects who can adhere to the task. There may also be language barriers that limit widespread clinical use. Even subjects who are elderly but do not have any acute illnesses, such as the cohort in our study, may have difficulty with the task. For example, we found that a significant fraction of subjects in our study could not perform the task properly. In these subjects, if only BH had been performed, it might be have been erroneously assumed that the patient had reduced VR, when in fact, the low values was only a reflection of their inability to comply with the BH task. Similar to our experience, others have suggested that the degree of cooperation for breath-holding varies significantly in patients with neurologic diseases, limiting its utility. 44 In fact, this could be one of the factors contributing to the discrepancies we observe in the results of the proposed approach compared to that of BH. The proposed approach based on rs-fMRI, by eliminating the need for cooperation from the subjects, circumvents this problem. This application of rs-fMRI techniques may allow the evaluation of VR in a wider range of conditions (clinical or research) where it may have otherwise been impractical. Administration of CO2 enriched gas 45 or use of acetazolamide injection also eliminates the need for subject cooperation; however, these methods require specific setups, are more expensive, and may also not be feasible for all research and patient scenarios. Another attractive feature of the proposed approach is that the rs-fMRI images can be used to study many features at the same time, among them VR, arterial arrival lags, and brain connectivity. The proposed method can be used to obtain information about VR retrospectively in situations in which rs-fMRI data were acquired. This method can potentially be used in task-activation and rs-fMRI studies to account for vascular variability between different populations.4,14–16
In conclusion, the findings of this study suggest that rs-fMRI may potentially be used to evaluate VR without the need for a BH challenge, particularly in experiments in which the BH challenge, administration of CO2 enriched gas, or use of acetazolamide injection is not appropriate or feasible.
Footnotes
Funding
The author(s) disclosed receipt of the following financial support for the research, authorship, and/or publication of this article: The Systolic Blood Pressure Intervention Trial is funded with Federal funds from the National Institutes of Health (NIH), including the National Heart, Lung, and Blood Institute (NHLBI), the National Institute of Diabetes and Digestive and Kidney Diseases (NIDDK), the National Institute on Aging (NIA), and the National Institute of Neurological Disorders and Stroke (NINDS), under Contract Numbers HHSN268200900040C, HHSN268200900046C, HHSN268200900047C, HHSN268200900048C, HHSN2682 00900049C, and Inter-Agency Agreement Number A-HL-13-002-001. It was also supported in part with resources and use of facilities through the Department of Veterans Affairs. The SPRINT investigators acknowledge the contribution of study medications (azilsartan and azilsartan combined with chlorthalidone) from Takeda Pharmaceuticals International, Inc. All components of the SPRINT study protocol were designed and implemented by the investigators. The investigative team collected, analyzed, and interpreted the data. All aspects of manuscript writing and revision were carried out by the coauthors. The content is solely the responsibility of the authors and does not necessarily represent the official views of the NIH, the U.S. Department of Veterans Affairs, or the United States Government. For a full list of contributors to SPRINT, please see the supplementary acknowledgement list:
Declaration of conflicting interests
The author(s) declared no potential conflicts of interest with respect to the research, authorship, and/or publication of this article.
Authors’ contributions
HJ and GZ conceived the study. MT, TC, MM, NP, and CW contributed to the overall work design and data interpretation. HJ collected and analyzed data. HJ prepared the manuscript with input from GZ, TC, MM, MT, NP, and CW.
References
Supplementary Material
Please find the following supplemental material available below.
For Open Access articles published under a Creative Commons License, all supplemental material carries the same license as the article it is associated with.
For non-Open Access articles published, all supplemental material carries a non-exclusive license, and permission requests for re-use of supplemental material or any part of supplemental material shall be sent directly to the copyright owner as specified in the copyright notice associated with the article.