
Abstract
Cerebrovascular dysfunction is a critical component of Alzheimer’s disease (AD) pathogenesis. Oligomeric amyloid-β42 (oAβ42) is considered a major contributor to AD progression. However, data are limited on the role of oAβ42 in brain endothelial cell vessel degeneration/angiogenesis, including the interaction with angiogenic mediators. Thus, the current study determined the effect of oAβ42 on angiogenesis in vitro, utilizing single brain endothelial cell cultures and triple cultures mimicking the microvascular unit (MVU: brain endothelial cells, astrocytes, and pericytes). oAβ42 dose-dependently reduced angiogenesis and induced vessel disruption. Critically, epidermal growth factor prevented oAβ42-induced deficits, implicating angiogenic pathways as potential therapeutics for AD.
Introduction
Cerebrovascular (CV) dysfunction is emerging as a critical component of Alzheimer’s disease (AD). 1 AD risk factors and pathogenic pathways can exert detrimental effects on the CV in humans, transgenic models that recapitulate some biological aspects of AD, and in vitro. However, the topic of CV dysfunction in AD is controversial 2 including the extent, consequence for neuronal function and the therapeutic significance.3,4 An important question is whether AD pathways induce detrimental effects on the length of the CV, which is dependent on vessel degeneration and/or angiogenesis. Amyloid-β (Aβ), particularly oligomeric Aβ42 (oAβ42), is considered a major contributor to AD progression. Thus, one approach to address the issues in the field is to determine the effect of Aβ on vessel length in vitro. Unfortunately, in vitro studies have not produced a clear consensus on the role of Aβ in vessel degeneration/angiogenesis, and work focused on the effect of oAβ42 using single brain endothelial cell (BEC) cultures or in triple cultures designed to mimic the microvascular unit (MVU: BECs, astrocytes and pericytes) is limited. 5 A further important question is how angiogenic growth factors (GFs) interact with oAβ42 to modulate vessel length. Key soluble angiogenic GFs include vascular endothelial growth factor (VEGF), epidermal growth factor (EGF), and fibroblast growth factor-β (FGFβ). A number of studies support that these mediators can prevent detrimental Aβ-induced changes in ECs; however, data on vessel length are lacking, with the exception of a beneficial effect for VEGF and conflicting results with FGFβ.6–9 Further, current evidence for GF-induced effects on angiogenesis is derived from studies utilizing non-BECs, and Aβ40 or Aβ42 rather than oAβ42. Therefore, the goal of this manuscript was to determine the effect of oAβ42 and angiogenic GFs on tube formation and disruption in single BEC cultures, and triple cultures mimicking the MVU.
Materials and methods
Cells, oAβ42 and GFs
hCMEC/D3 cells (BECs) were a kind gift from Pierre-Olivier Couraud (Inserm) and cultured as described previously. 10 Twenty-four hours before experiments, BECs were serum- and GF-starved. Primary human pericytes and astrocytes (Sciencell) were cultured according to manufacturer protocol between passages 2 and 5. oAβ42 was prepared as previously described 11 and used at the indicated concentrations (0–100 nM). GFs (Shenandoah) were utilized at 100 nM.
Cell viability assays
Cell viability was assessed in hCMEC/D3 cells with oAβ42 ± GFs (24 hr) via the MTT assay 12 (ThermoFisher).
Tube formation and disruption assays
BEC single cultures
Matrigel® was added to 96-well angiogenesis μ-plates (Ibidi) and allowed to set for 1 h at 37℃. At t = 0 h, BECs preloaded with CellTracker™ green (30 min 37℃, ThermoFisher) were added at 10,000 cells/well.
Paradigm 1, simultaneous – All treatments; GFs, oAβ42, vehicle controls (VCs) and combinations were added to the cells immediately following the addition of cells to the plate (t = 0 h).
Paradigm 2, spike/protection – GFs or VCs were added to the cells immediately following the addition of cells to the plate (t = 0 h). After 4 h incubation at 37℃, oAβ42 or VCs were added (t = 4 h).
Paradigm 3, reversal – oAβ or VC were added to the cells immediately following the addition of cells to the plate (t = 0 h). After 4 h incubation at 37℃, GFs or VCs were added (t = 4 h).
MVU triple cultures
Angiogenesis plates were prepared as described above. At t = 0 h, BECs preloaded with CellTracker™ green (ThermoFisher) were plated ± GFs or VCs. The following were added sequentially: at t = 4 h, pericytes (2000 pericytes/well) preloaded with CellTracker™ blue (ThermoFisher), at t = 7 h, astrocytes (10,000 astrocytes/well) preloaded with CellTracker™ orange (ThermoFisher), and at t = 11 h, oAβ42 or VC. The BEC:pericyte:astrocyte cellular ratio was 5:1:5.
Immunocytochemistry and imaging analysis
All angiogenesis plates were fixed in 4% paraformaldehyde at t = 24 h. Fluorescent images of BECs in each well were captured at × 1.6 magnification and analyzed using the ImageJ angiogenesis plug-in.
13
Immunocytochemistry (ICC) was then performed as described previously
10
using the Aβ specific antibody MOAB-2 (1:400, Biosensis). To image BECs, astrocytes and pericytes, high magnification images were captured on a Zeiss Axio Imager M1 under identical capture settings at × 5 or × 10 magnification. Aβ and pericyte coverage were assessed using × 5 magnification images in imageJ (Figures 1 and 2).
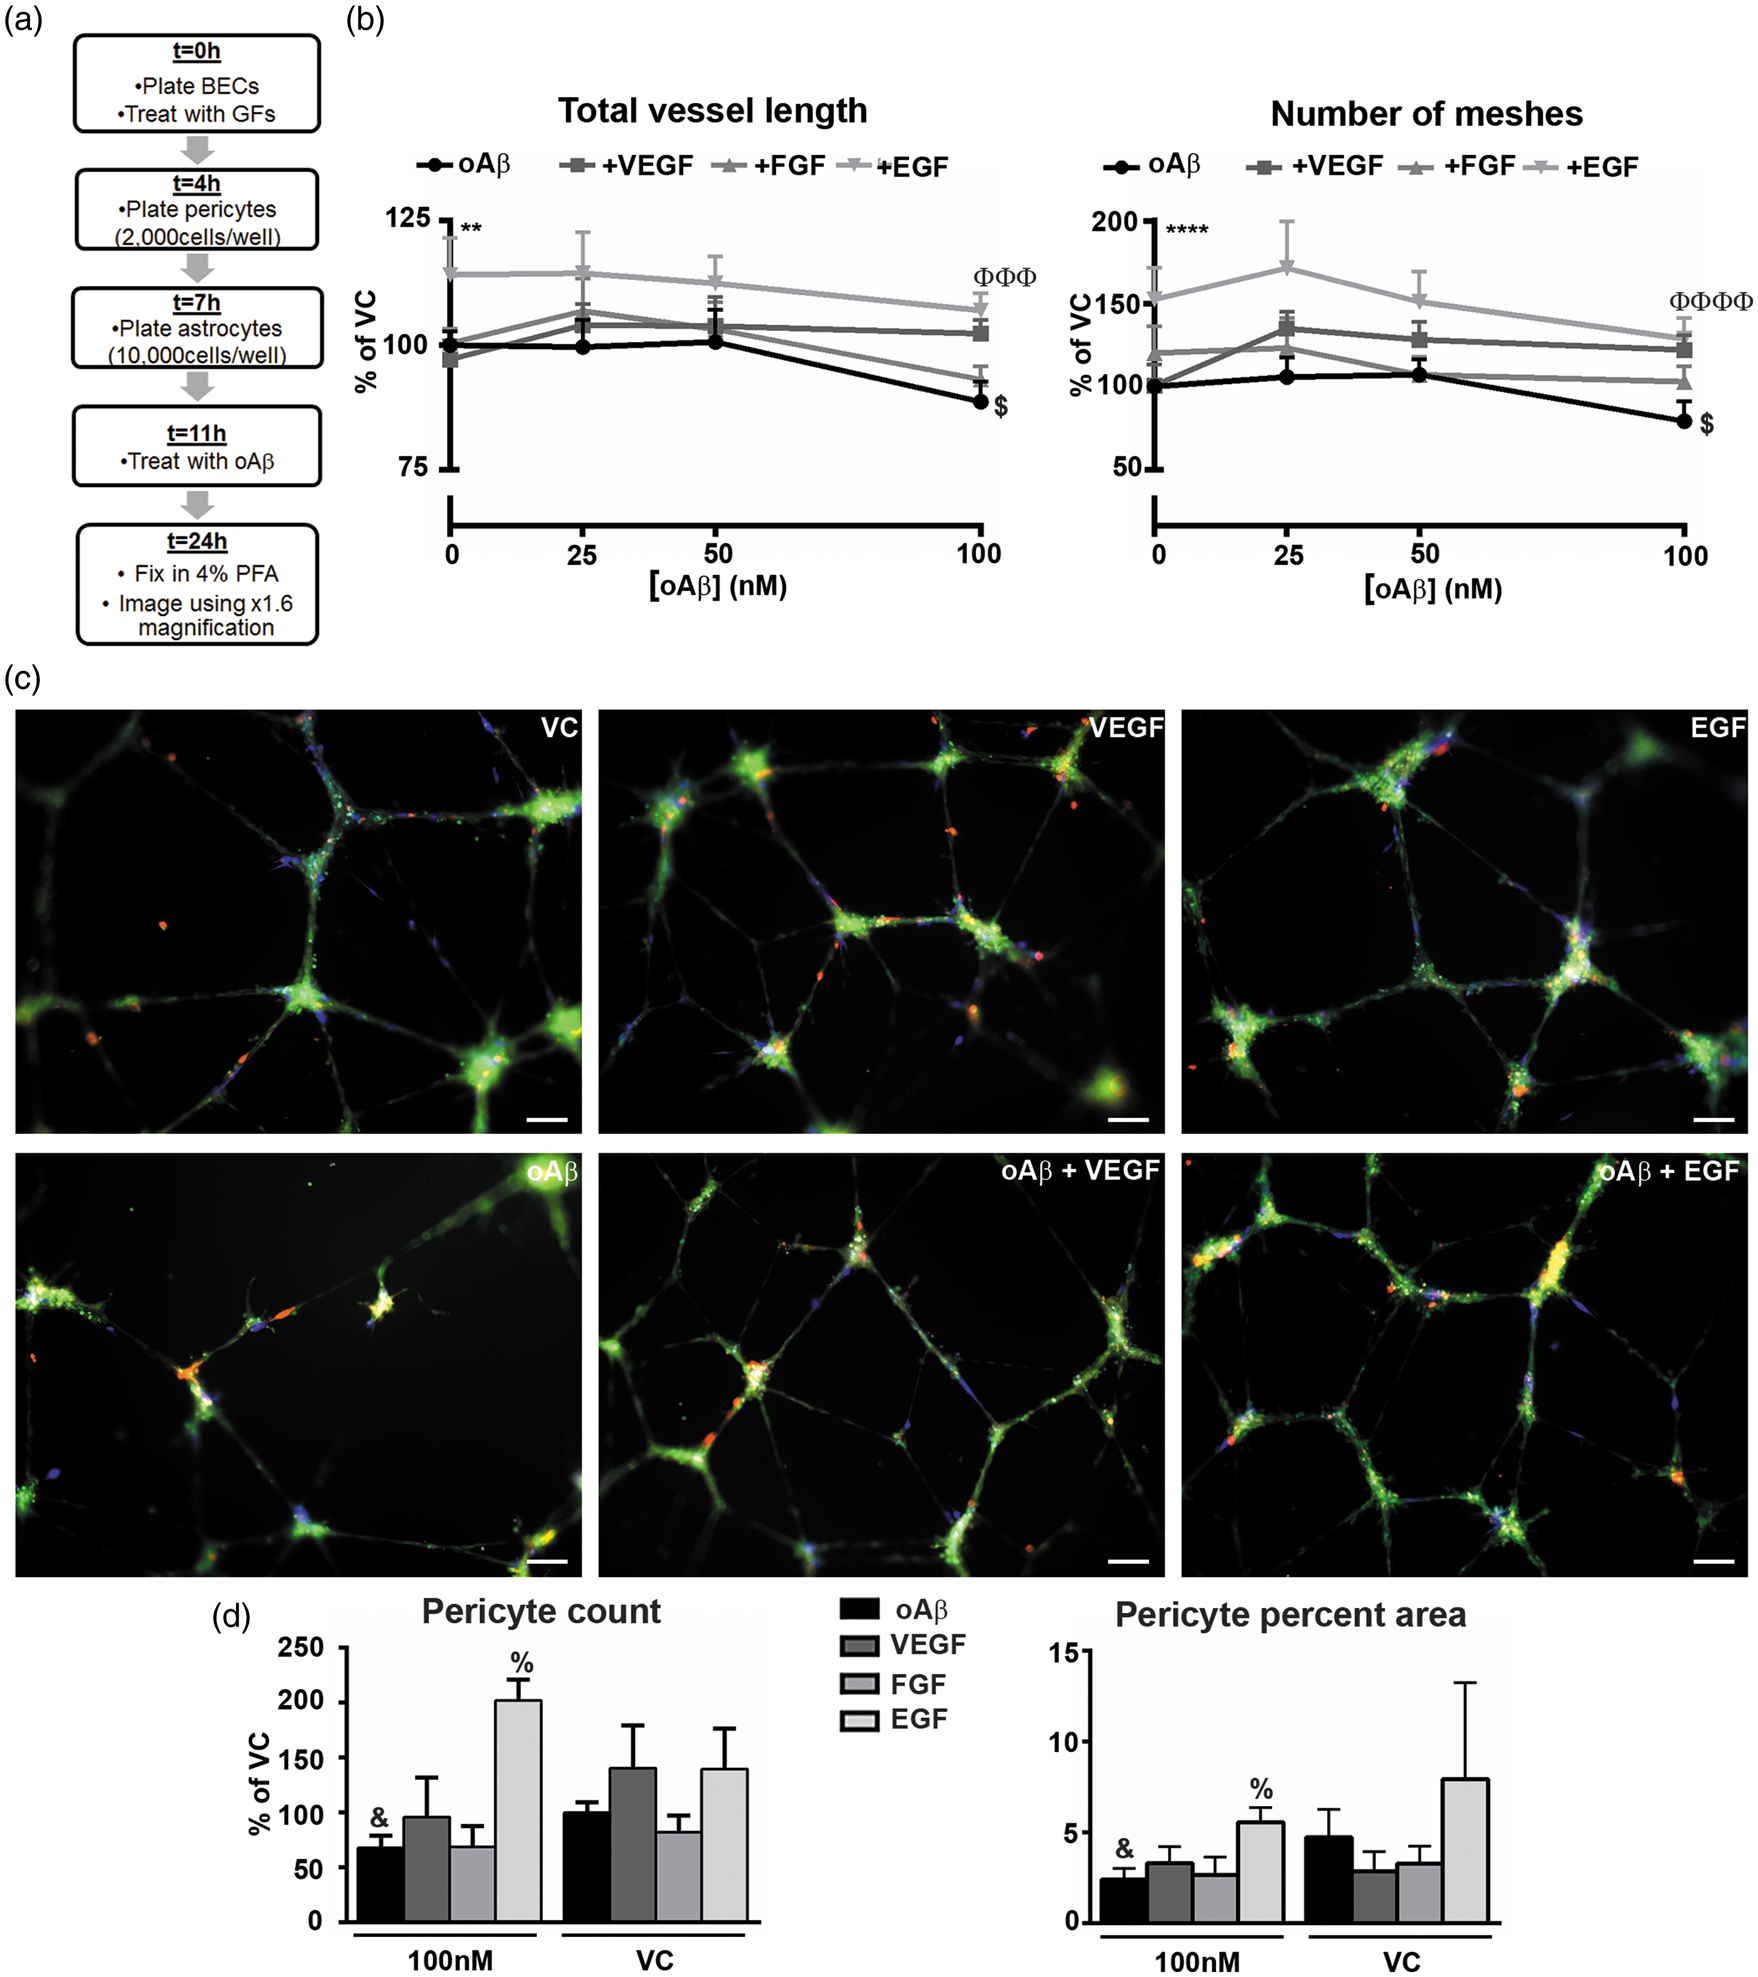
oAβ42 inhibits tube formation and induces vessel disruption in BEC cultures, prevention by EGF. (a–e) Treatment Paradigm 1 – Simultaneous. (a) hCMEC/D3 viability in response to oAβ42 at 0, 100 nM, and 5μM with and without GFs, as assessed by MTT assay (****p < 0.0001 by two-way ANOVA, main effect of concentration). (b) Schematic representation of the workflow. BECs were plated and treated with oAβ42 (0–100 nM) alone or in combination with VEGF (100 nM), FGFβ (100 nM), or EGF (100 nM). (c) Total vessel length and number of meshes formed by BECs quantified using × 1.6 magnification images (n = 3 with 2–4 replicates, *p < 0.05, ****p < 0.0001 by standard two-way ANOVA, main effect of treatment group; Φp < 0.05 by Dunnet’s multiple comparison vs. oAβ42 group. #p < 0.05 by ANOVA for both oAβ42 50 and 100 nM vs. VC, $p < 0.05 by ANOVA for oAβ42 100 nM vs. VC). (d) Representative × 10 images of VC, VEGF, and EGF treatments (from left to right, top) and oAβ42, oAβ42 plus VEGF, and oAβ42 plus EGF (from left to right, bottom. All images at 100 nM oAβ42. Green = BECs; red = Aβ42). (e) Percent area occupied by Aβ42 (100 nM, n = 3 with 2–4 replicates). (f–i) Treatment paradigm 2 – spike/protection. (f) Schematic representation of the workflow. In the spike/prevention treatment paradigm, BECs were treated with VEGF (100 nM), FGFβ (100 nM), or EGF (100 nM) and oAβ42 (0–100 nM) spiked into the culture. (g) Quantification of total vessel length and number of meshes formed by BECs quantified using × 1.6 magnification images (n = 4 with 2–4 replicates, ****p < 0.0001 by standard two-way ANOVA, main effect of treatment group; Φp < 0.05, ΦΦΦp < 0.001 by Dunnet’s multiple comparison vs. oAβ42 group. #p < 0.05 by ANOVA for both oAβ42 50 and 100 nM vs. VC). (h) Representative × 10 images of VC, VEGF, and EGF treatments alone (from left to right, top) and oAβ42, oAβ42 plus VEGF, and oAβ42 plus EGF (from left to right, bottom. All images at 100 nM oAβ42. Green = BECs; red = Aβ42). (i) Percent area occupied by Aβ42 (100 nM, n = 4 with 2–4 replicates). (j) Schematic representation of the workflow for the reversal paradigm. (k) Total vessel length and number of meshes formed by BECs quantified using × 1.6 magnification images (n = 5 in triplicate, #p < 0.05 by ANOVA for both oAβ42 50 and 100 nM vs. VC, $p < 0.05 by ANOVA for oAβ42 100 nM vs. VC, + p < 0.05 by Student’s t-test vs. oAβ42 50 nM). (l) Representative × 10 images of oAβ42, and oAβ42 plus EGF (from left to right. All images at 100 nM oAβ42. Green = BECs). All data are expressed as mean ± s.e.m compared to oAβ42 VC. Scale bar represents 100 µm. oAβ42 induces vessel disruption in MVU cultures, prevention by EGF. (a) Schematic representation of the workflow for the treatment paradigm in MVU cultures, treated with oAβ42 (0–100 nM) alone or in combination with VEGF (100 nM), FGFβ (100 nM), or EGF (100 nM). (b) Total vessel length and number of meshes formed by BECs quantified using × 1.6 magnification images (n = 3 in triplicate, **p < 0.01, ****p < 0.001 by standard two–way ANOVA, main effect of treatment group; ΦΦΦp < 0.001, ΦΦΦΦΦΦΦp < 0.0001 by Dunnet’s multiple comparison vs. oAβ42 group. $p < 0.05 by ANOVA for oAβ42 100 nM vs. VC). (c) Representative × 10 images of VC, VEGF, and EGF treatments alone (from left to right, top) and oAβ42, oAβ42 plus VEGF, and oAβ42 plus EGF (from left to right, bottom. All images at 100 nM oAβ42. Green = BECs; red = astrocytes; blue = pericytes). (d) Quantification of pericyte count and percent area occupied (n = 3 in triplicate, &p < 0.05 compared to oAβ42 VC; %p < 0.05 compared to oAβ42 100 nM by Student’s t-test). All data are expressed as mean ± s.e.m compared to oAβ42 VC. Scale bar represents 100 µm.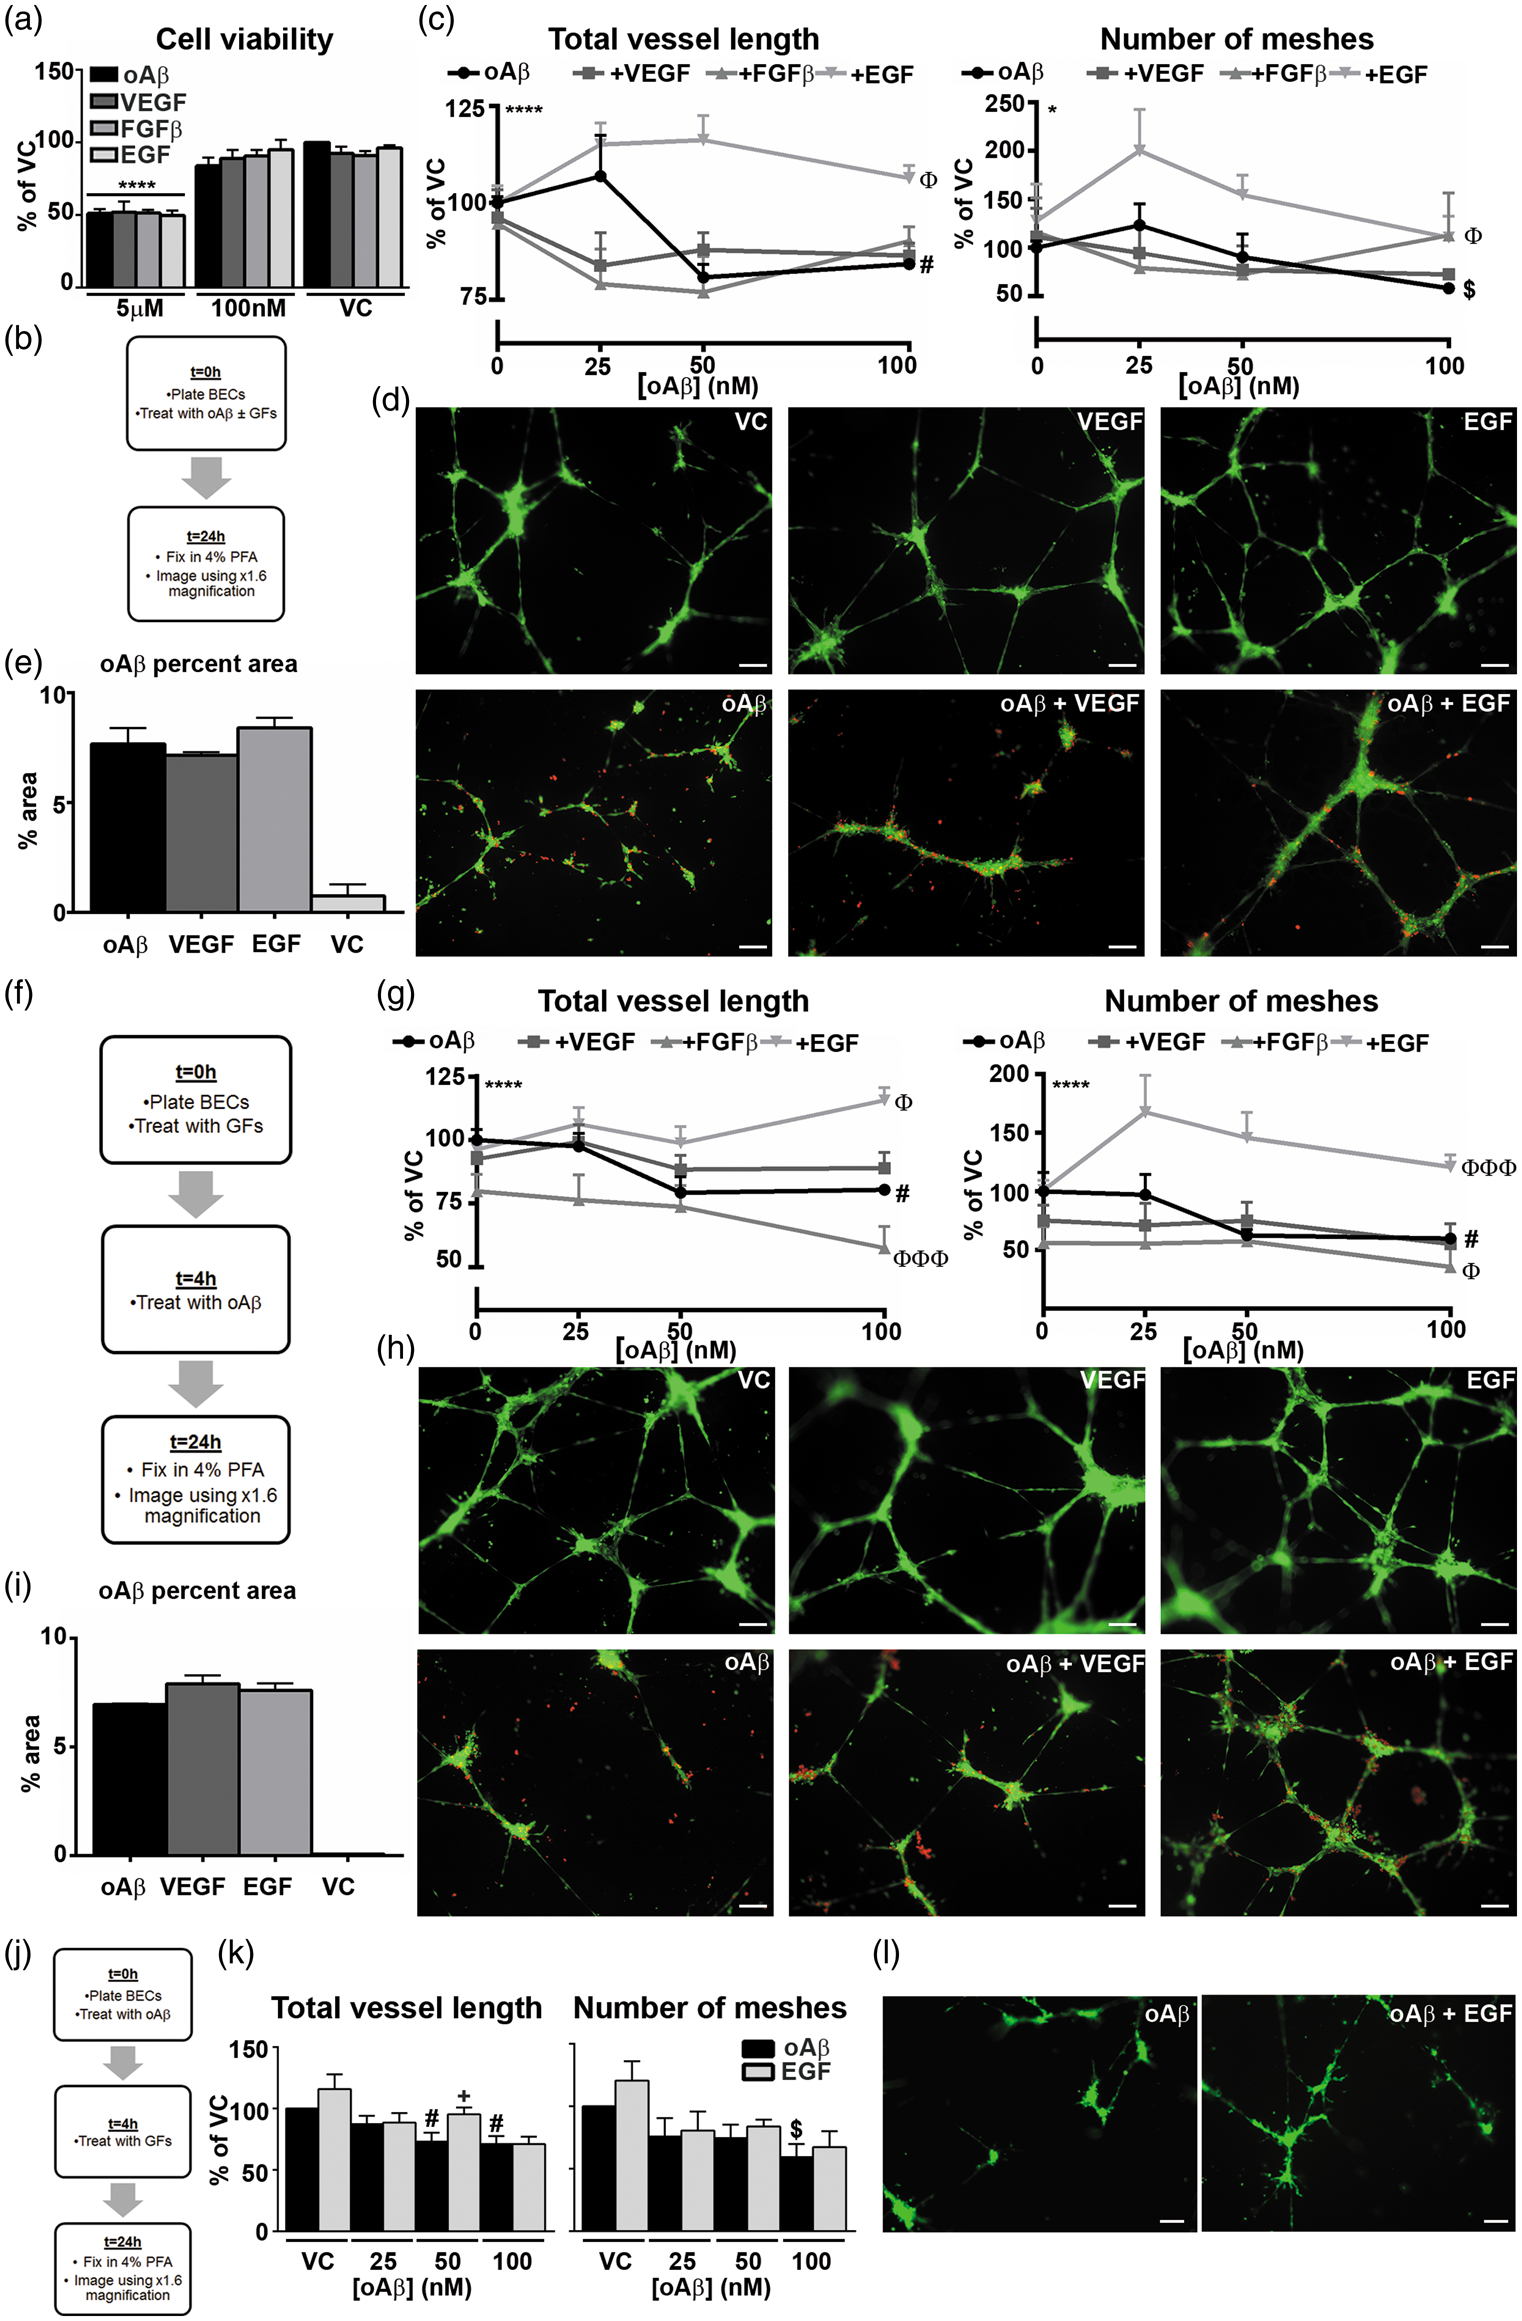
Statistical analysis
Summary of statistics from all paradigms.
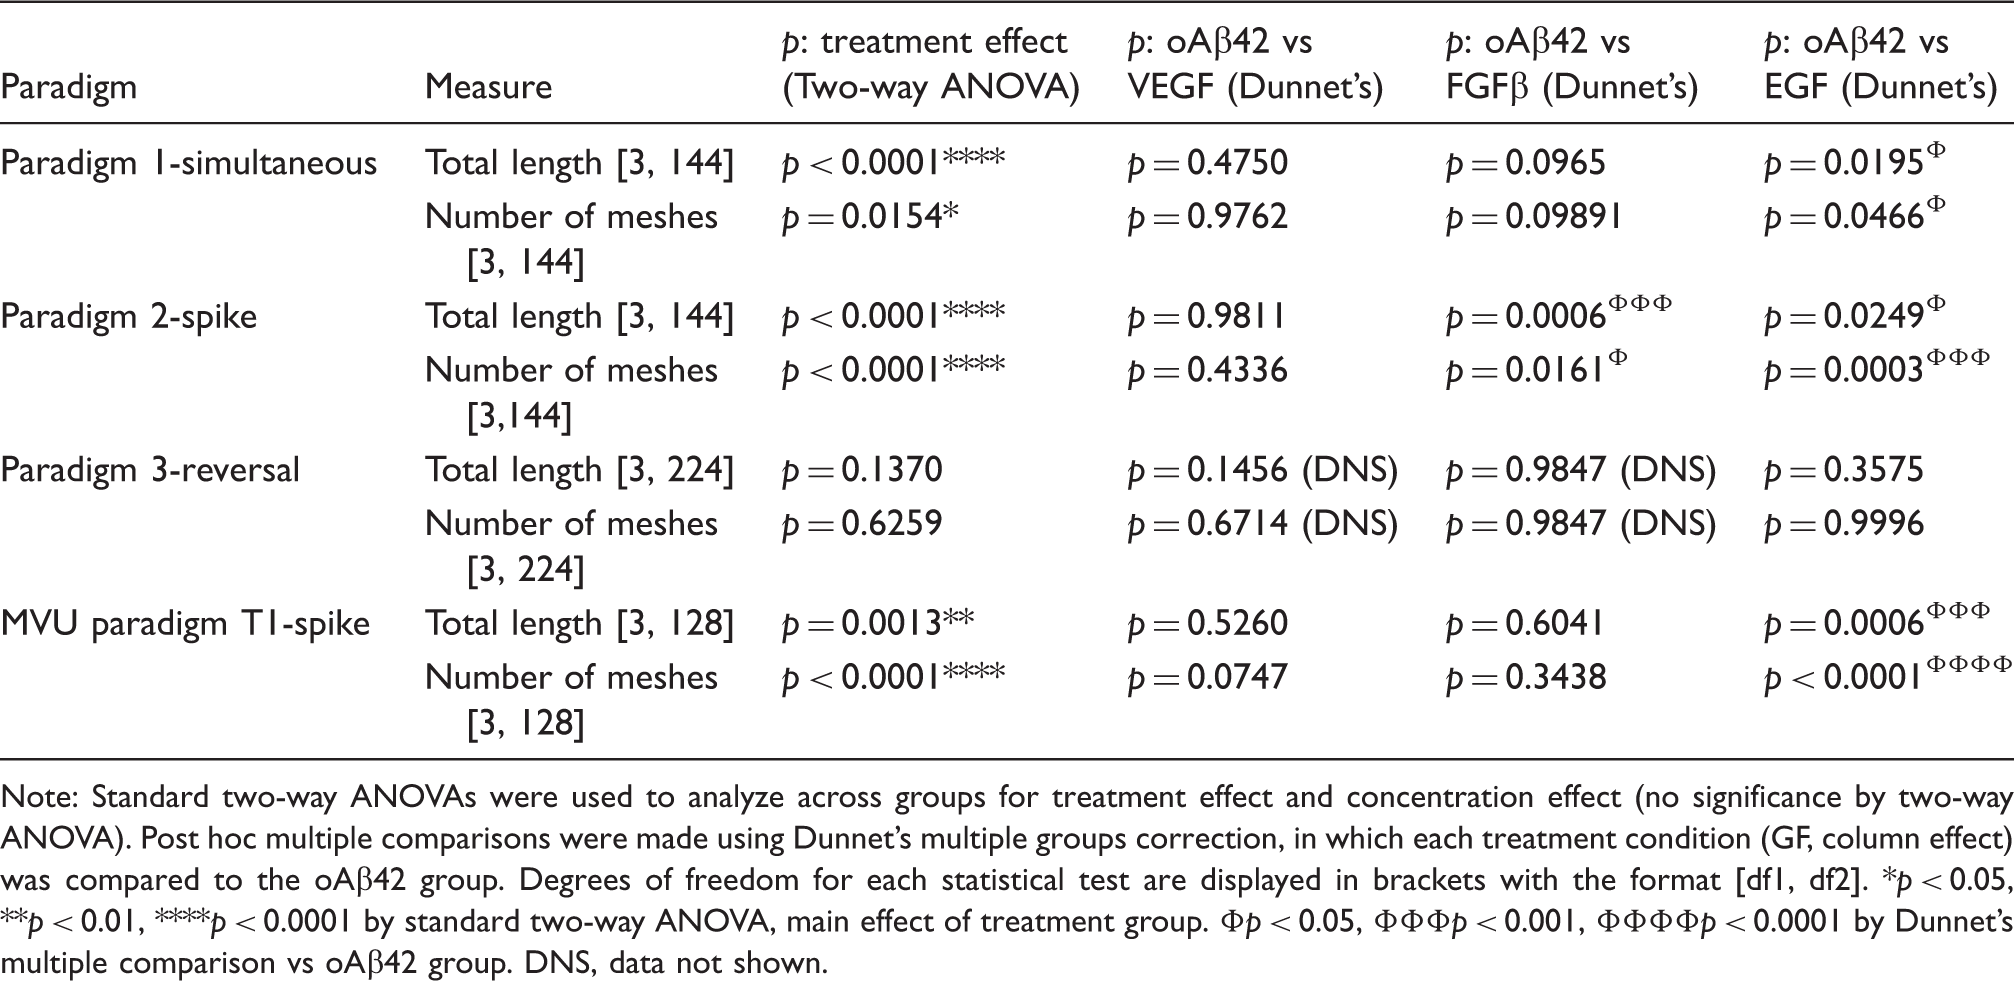
Note: Standard two-way ANOVAs were used to analyze across groups for treatment effect and concentration effect (no significance by two-way ANOVA). Post hoc multiple comparisons were made using Dunnet’s multiple groups correction, in which each treatment condition (GF, column effect) was compared to the oAβ42 group. Degrees of freedom for each statistical test are displayed in brackets with the format [df1, df2].
p < 0.05, **p < 0.01, ****p < 0.0001 by standard two-way ANOVA, main effect of treatment group. Φp < 0.05, ΦΦΦp < 0.001, ΦΦΦΦp < 0.0001 by Dunnet’s multiple comparison vs oAβ42 group. DNS, data not shown.
Results
EGF prevents direct oAβ42-induced disruption of tube formation in single BEC cultures (paradigm 1)
Initially, the effect of non-toxic oAβ42 concentrations (identified by MTT assay, Figure 1(a)) on tube formation was assessed in single cultures of immortalized human BECs (hCMEC/D3 cells) by simultaneously adding cells +/−oAβ42 (VC, 25 nM, 50 nM, 100 nM) for 24 h to a Matrigel® matrix (Figure 1(b)). At non-toxic doses, oAβ42 dose-dependently disrupted tube formation (Figure 1(c)). Compared to the VC, total vessel length was 20% and 16% lower with 50 and 100 nM oAβ42, respectively. Further, the number of meshes was 10% (50 nM) and 40% (100 nM) lower with oAβ42. Next, the effect of simultaneous oAβ42 (0–100 nM) and GF treatment was determined (Figure 1(b)). EGF (100 nM), but not VEGF, FGFβ, or IGF (data not shown) ameliorated oAβ42-induced disruption of tube formation (Figure 1(c) and (d)). For example, compared to the VC, total tube length was 110% for combined oAβ42-EGF treatment (Figure 1(c)). Interestingly, EGF-induced protection was not due to changes in oAβ42 accumulation in the BECs (Figure 1(e)). These data support that direct oAβ42 signaling prevents tube formation and EGF ameliorates this effect.
EGF prevents oAβ42-induced tube disruption in single BEC cultures (paradigm 2)
To determine whether oAβ42 causes tube degeneration, BECs were incubated for 4 h to form vessel networks, and oAβ42 was spiked into the media for a further 20 h (Figure 1(f)). oAβ42 reduced total vessel length by 20% and the number of meshes by ∼40% at both 50 and 100 nM (Figure 1(g)). EGF prevented the oAβ42-induced vessel disruption to BECs (Figure 1(g) and (h)). Indeed, compared to 50 and 100 nM oAβ42, total vessel length values were 20% and 35% higher with combined oAβ42-EGF treatment, respectively. Further, with combined EGF and oAβ42 treatment, the number of meshes were 88% (50 nM oAβ42) and 61% (100 nM oAβ42) higher compared to oAβ42 alone (Figure 1(g)). As for tube formation, the beneficial effects of EGF were not related to alterations in oAβ42 uptake or degradation (Figure 1(i)). For other GFs, there was a non-significant trend for VEGF to prevent oAβ42-induced tube disruption and interestingly, FGFβ in combination with oAβ42-induced more robust vessel disruption compared to oAβ42 alone (Figure 1(g)).
EGF does not reverse oAβ42-induced disruption of tube formation in single BEC cultures (paradigm 3)
To determine whether EGF could reverse oAβ42-induced tube formation disruption, BECs were incubated ± oAβ42 from 0–4 h and GFs spiked into the media for a further 20 h (Figure 1(j)). As in paradigm 1, oAβ42 (0–100 nM) disrupted tube formation (Figure 1(k)). However, with the exception that EGF appeared to reverse oAβ42-induced disruption in total vessel length at 50 nM oAβ42, EGF was largely unable to reverse oAβ42-induced tube disruption in this paradigm (Figure 1(k) and (l)).
EGF prevents oAβ42-induced tube disruption in MVU cultures
Although our data demonstrates that oAβ42 induces detrimental effects on tube formation directly in BECs, it is important to conduct complementary analysis using the main cell types of the MVU, which can respond to oAβ42 to collectively determine vessel length. Therefore, we next investigated the effects of oAβ42 and GFs in cultures containing BECs, primary human pericytes and primary human astrocytes. We focused on the oAβ42-induced effects on preformed vessels to mimic the in vivo scenario of oAβ42 accumulation with an established CV (Figure 2(a)).
oAβ42 treatment resulted in tube disruption only at the highest dose (100 nM) causing a 20% reduction in number of meshes and 13% reduction in total tube length (Figure 2(b)). As 50 nM oAβ42 caused disruption in single BEC cultures, these data imply that BECs are more resistant to insult within the MVU (proposed in Itoh et al. 14 ). At high magnification, pericyte coverage at tube junctions and tube projections appeared lower in oAβ42-treated triple cultures (Figure 2(c)). Indeed, when quantified, 100 nM oAβ42 reduced the percent area occupied by pericytes by 49% compared to VC (Figure 2(d)).
As observed in BEC cultures, EGF protected against 100 nM oAβ42-induced tube disruption, with a 20% higher total tube length and a 50% greater number of meshes compared to oAβ42 treatment alone (Figure 2(b)). Interestingly, treatment with 25 and 50 nM oAβ42 in combination with EGF resulted in higher in total length and number of meshes, despite oAβ42 treatment alone at the same concentrations not causing any direct disruption. Further, EGF prevented the 100 nM oAβ42-induced decrease in the number of and percent area covered by pericytes, while VEGF and FGFβ had no effect (Figure 2(d)). These data suggest a direct link between pericyte health/coverage and the ability of BECs to form viable networks that is disrupted in the presence of oAβ42. Mirroring data in single BECs, VEGF trended to protect against the oAβ42-induced disruption at 100 nM.
Discussion
Data are conflicted on whether vessel length is increased or decreased in AD and the mechanistic implications. There is evidence of reduced vessel density in AD patients 15 and in AD-mice, data supported in select in vitro studies. 16 Therefore, one proposal is that lower CV density contributes to AD progression by disrupting cerebral blood flow and the complex transport and metabolic systems of the CV. 17 The counter argument is that Aβ induces angiogenesis, causing hypersprouting, tight junction disruption, and increased CV permeability. 18 An important contributor to the in vitro discrepancies on the angiogenic effects of Aβ may be related to the method of preparation and use of varying species of Aβ. In the present study, oAβ42 treatment consistently reduced vessel formation and caused vessel disruption in both BEC and MVU cultures. These data are particularly significant as oAβ42 is considered the most active form of Aβ in AD.
Although the mechanisms are currently unknown, oAβ42-induced vessel/BEC disruption is likely the result of both direct and indirect signaling. Directly to BECs, Aβ can bind to a number of receptors, accumulate intracellularly, and induce senescence 16 to impact angiogenic signaling. Indirectly, oAβ42 activates pro-inflammatory signaling in astrocytes, 19 dysregulating the angiogenic signaling in BECs required to form and maintain healthy tubes. This process may also translate to pericytes (Figure 2). Thus, although complex and more research is required, one potential explanation is: Aβ induces signaling cascades consistent with increased angiogenesis; however, rather than inducing angiogenesis, Aβ halts the process, resulting in a failure to complete vessel formation in addition to causing direct damage. Dissecting the cellular signaling processes modulated both directly and indirectly by oAβ42 may lead to a deeper understanding of CV dysfunction in AD.
Pro-angiogenic GFs have shown promise for AD pathogenesis in vivo and in vitro. Our results demonstrate that EGF protects against oAβ42-induced disruption of vessel formation and vessel disruption in BEC cultures and protects against oAβ42-induced vessel and pericyte disruption in MVU cultures. Data are conflicted on whether EGF levels are higher or lower in AD. For example, higher plasma EGF levels have been reported in AD patients, 20 whereas recent data demonstrate that low EGF levels predict conversion from amnestic mild cognitive impairment to AD. 21 Potentially, lower EGF levels induce disrupted angiogenic signaling early in AD, causing an adaptive increase in EGF levels in a subset of patients and/or BECs to become unresponsive to EGF with age and pathological progression. Our ongoing research is focused on further dissecting the reversal potential of EGF in paradigms that more closely mimic the in vivo scenario. Evaluating the activity of EGF in AD-models and the cell-specific signaling cascades may lead to novel therapeutic approaches for AD.
Footnotes
Funding
The author(s) disclosed receipt of the following financial support for the research, authorship, and/or publication of this article: Leon M. Tai is supported by University of Illinois at Chicago start-up funds.
Declaration of conflicting interests
The author(s) declared no potential conflicts of interest with respect to the research, authorship, and/or publication of this article.
Authors’ contributions
KPK conducted experimental procedures and was involved in the preparation of the manuscript. RT contributed to experimental procedures and experimental setup.
AWJM conducted experimental procedures and was involved in the preparation of the manuscript.
LMT was responsible for project oversight, experiment planning, data interpretation, and manuscript submission.