
Abstract
Large amounts of energy are required when cells undergo cell proliferation and differentiation for mammalian neuronal development. Early neonatal mice face transient starvation and use stored energy for survival or to support development. Glycogen is a branched polysaccharide that is formed by glucose, and serves as an astrocytic energy store for rapid energy requirements. Although it is present in radial glial cells and astrocytes, the role of glycogen during development remains unclear. In the present study, we demonstrated that glycogen accumulated in glutamate aspartate transporter (GLAST)+ astrocytes in the subventricular zone and rostral migratory stream. Glycogen levels markedly decreased after birth due to the increase of glycogen phosphorylase, an essential enzyme for glycogen metabolism. In primary cultures and in vivo, the inhibition of glycogen phosphorylase decreased the proliferation of astrocytic cells. The number of cells in the G1 phase increased in combination with the up-regulation of cyclin-dependent kinase inhibitors or down-regulation of the phosphorylation of retinoblastoma protein (pRB), a determinant for cell cycle progression. These results suggest that glycogen accumulates in astrocytes located in specific areas during the prenatal stage and is used as an energy source to maintain normal development in the early postnatal stage.
Introduction
During development, cells must adapt to changes in the availability of nutrients and rapidly alter their metabolism in an attempt to regulate cell proliferation, differentiation, and migration.1,2 An important nutritional change for placental animals occurs upon birth due to separation from the placental energy supply. Early neonatal mice face transient starvation when they generate energy from stored energy sources because autophagy-deficient mice have been shown to die at the early neonatal stage. 3 Since systemic glucose levels decrease soon after birth in mice, 4 tissue energy sources are important for fulfilling metabolic demands. However, it currently remains unclear whether a particular energy source maintains postnatal brain development.
In the adult central nervous system (CNS), astrocytes and oligodendrocytes both metabolically support various aspects of neurons.5–7 Astrocytes predominantly store glycogen, a branched polysaccharide that is formed by D-glucose, in the adult CNS. Glycogen serves as an energy store that is mobilized for rapid events such as the clearance of synaptic neurotransmitters or to support the energy demands of CNS axons by astrocytes.8–10 Previous studies demonstrated that astrocytic glycogen also regulates memory formation and consolidation through the transfer of energy and nutrients to neurons.11–13 During development, radial glial cells, which act as neural stem cells, contain glycogen. 14 An in vitro study showed that differentiated astrocytes from neural stem cells have larger amounts of glycogen than those in an undifferentiated state. 15 Moreover, there is a report showing that glycogen phosphorylase inhibitor inhibits cell proliferation 16 ; therefore, glycogen may exert some regulatory effects on astrocyte development. Mice deficient for glycogen synthase show perinatal lethality, 17 which indicates that glycogen is an important energy source for neuronal development. However, ontogenic changes in glycogen localization in astrocytic cells and their functional significance have not yet been examined in detail.
In the present study, we investigated how glycogen is involved in perinatal forebrain development. We found that large amounts of glycogen accumulated in glutamate aspartate transporter (GLAST)+ cells located in the subventricular zone (SVZ) as well as the developing rostral migratory stream (RMS). We also demonstrated that glycogen levels decreased soon after birth. We concomitantly observed the increase of glycogen phosphorylase along the RMS. The inhibition of glycogen breakdown in primary cultured SVZ astrocytes and in vivo reduced astrocytic cell proliferation. The knockdown of brain glycogen phosphorylase induced the expression of p21 and p27, both of which act as cell cycle inhibitors. Furthermore, the inhibited breakdown of glycogen decreased the phosphorylation of retinoblastoma protein (pRB), indicating that cell cycle arrest occurred when glycogen-derived energy was not available. These results suggest that glycogen serves as an energy store for maintaining astrocyte cell proliferation in the postnatal telencephalon.
Materials and methods
Animals
Pregnant ICR mice were obtained from SLC (Shizuoka, Japan) and were housed under a 12 h light/dark cycle and had ad libitum access to water and foods. Regarding histochemical and biochemical analyses, pregnant or newborn mice were anesthetized using pentobarbital (100 mg/kg, intraperitoneal injection). Embryos from three pregnant mice at each stage were histochemically examined (see Figures 1 and 3). Four mothers with their newborn pups were used in primary culture experiments (see Figures 4 and 6). In an in vivo analysis of glycogen phosphorylase functions, 12 newborn pups from two dams were examined at each experimental time point (see Figure5(a) and (o)) and 8 newborn pups from two dams were examined in Figure 5(p) and (r) so that each treatment group include individuals from multiple litters. The unintended death of newborn mice occurred due to a failure to recover from anesthesia in the experiment shown in Figure 5. The percentage of unintended deaths was less than 5%. In order to label S-phase cells, 5-ethynyl-2′-deoxyuridine (EdU, Invitrogen, Carlsbad, USA) or 5-bromo-2′-deoxyuridine (BrdU, Wako, Osaka, Japan) was injected intraperitoneally one hour before sampling (2 mg/kg). All animal procedures were treated in compliance with the Guidelines for Proper Conduct of Animal Experiment and Related activities (Ministry of Education, Culture, Sports, Science and Technology of Japan) and were approved by the Animal Committee of Kyoto Prefectural University of Medicine. Reporting of this work complies with ARRIVE guidelines.
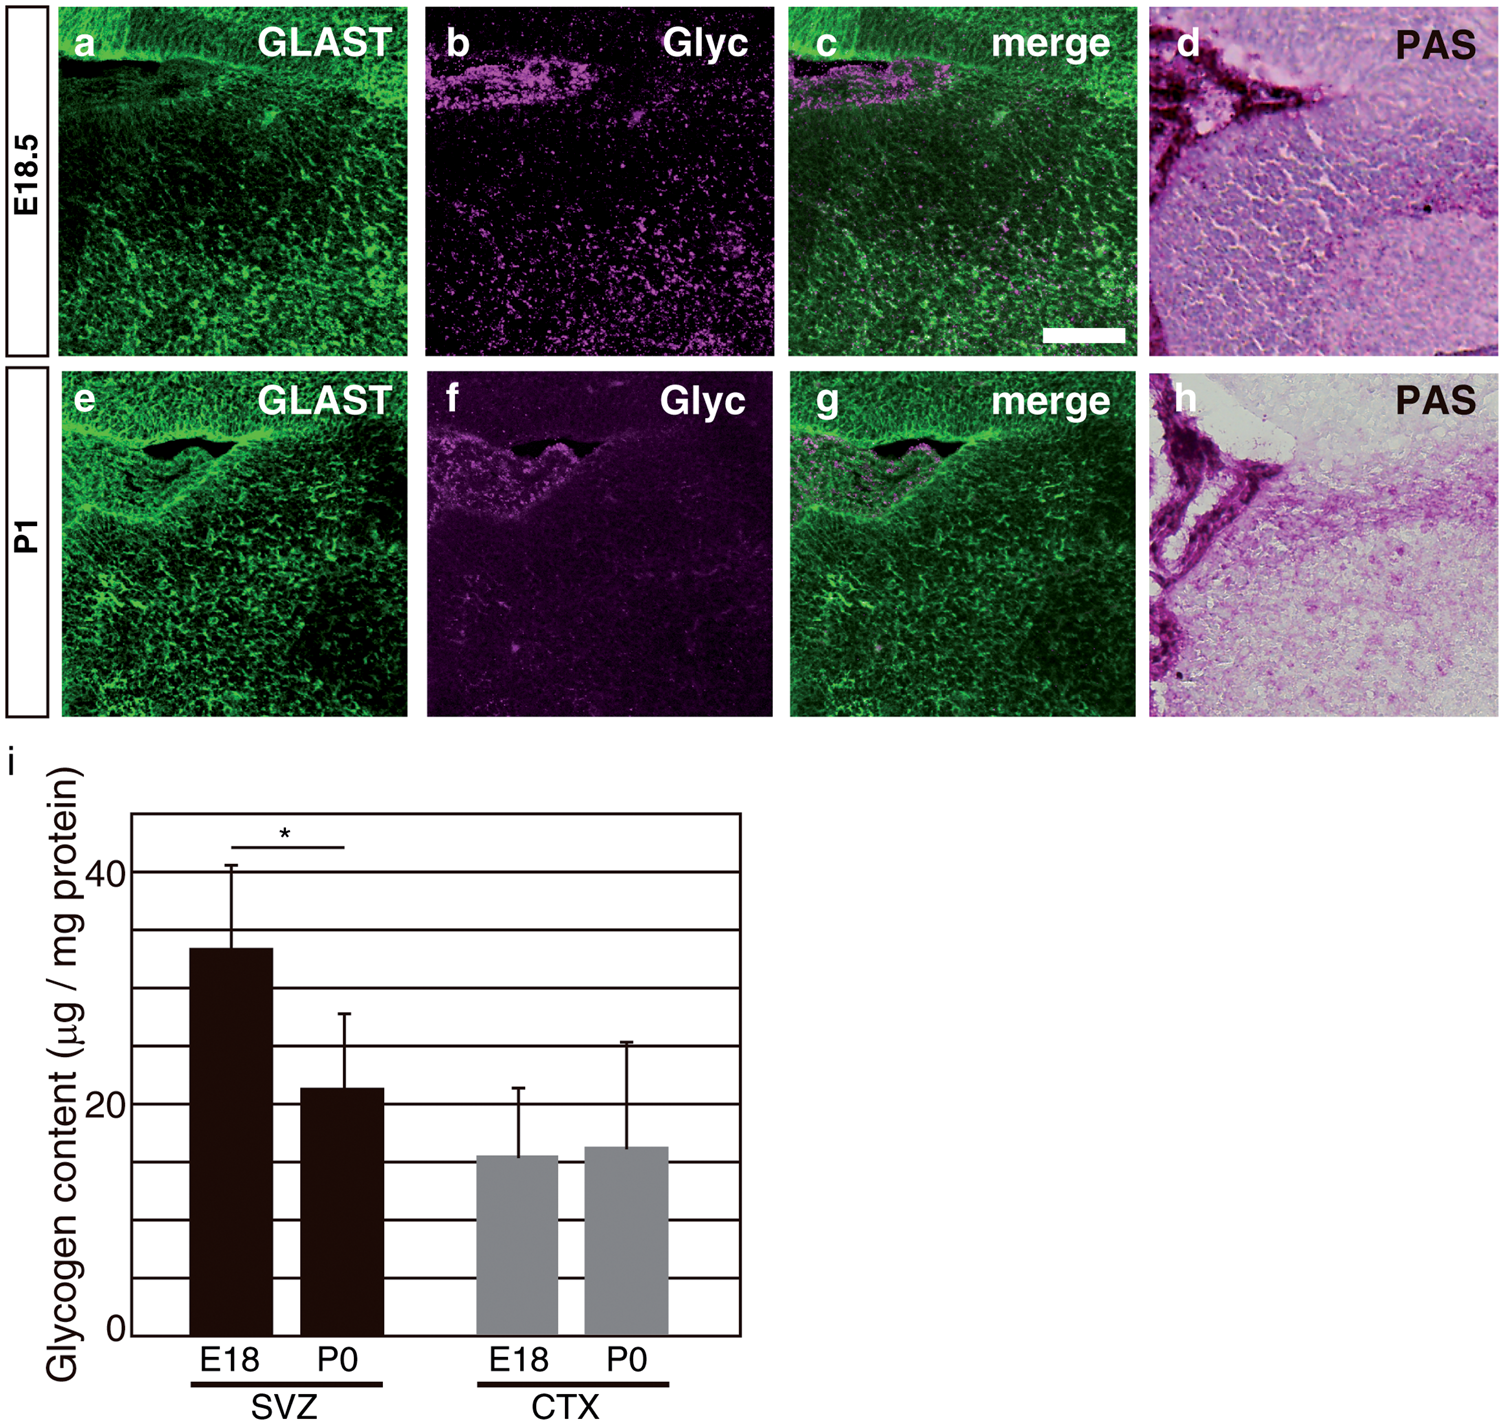
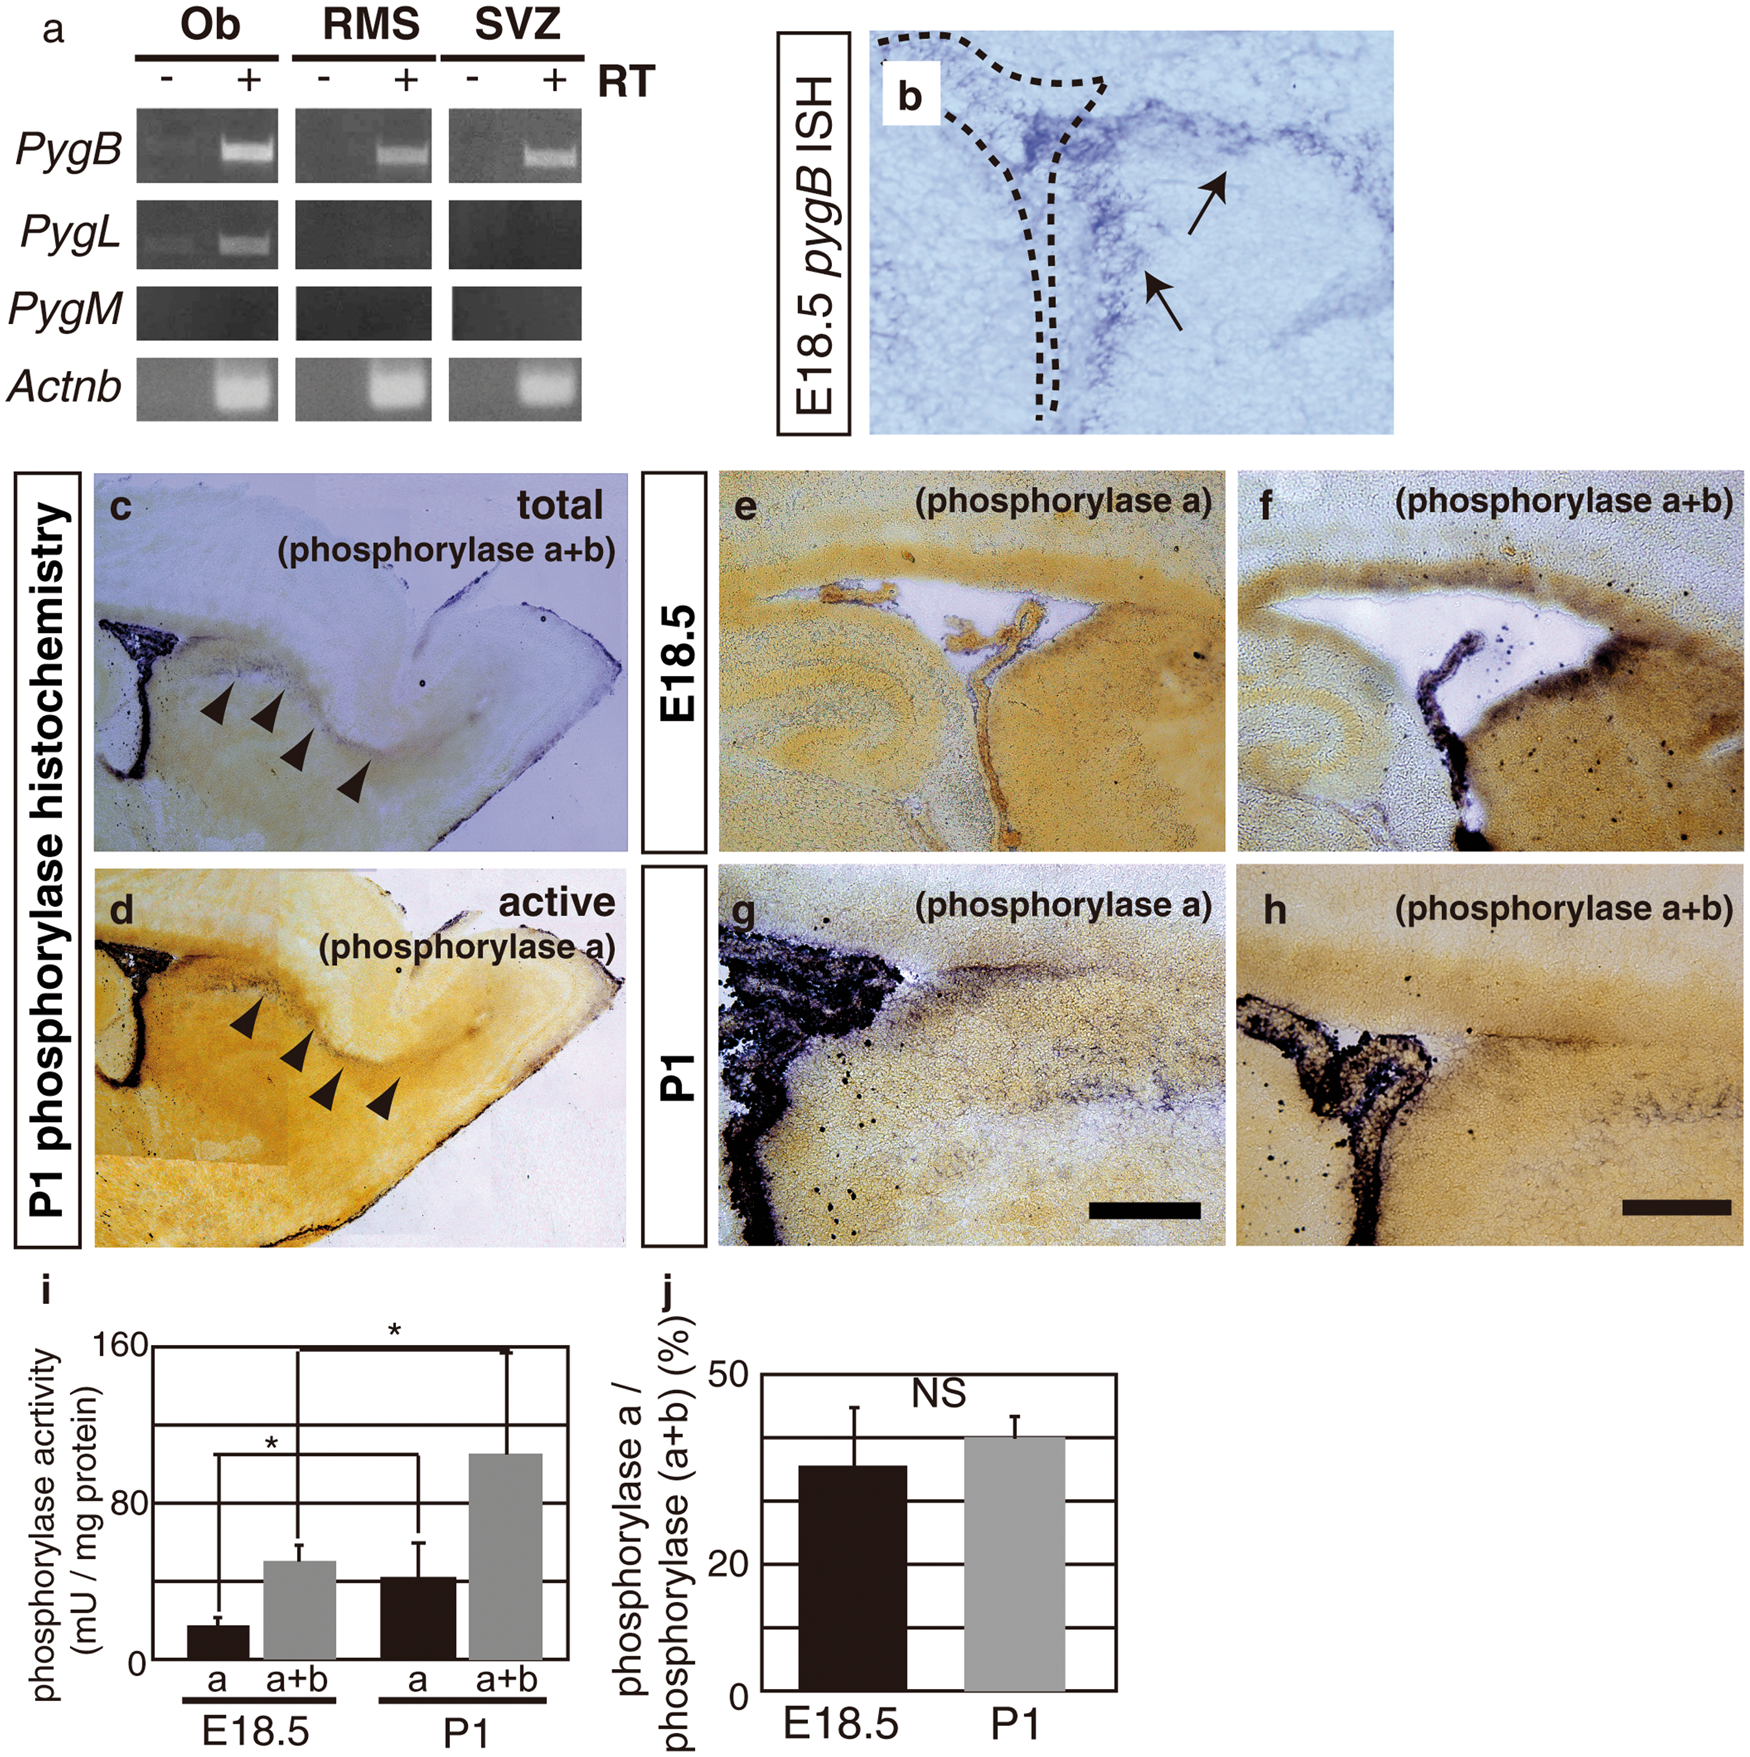
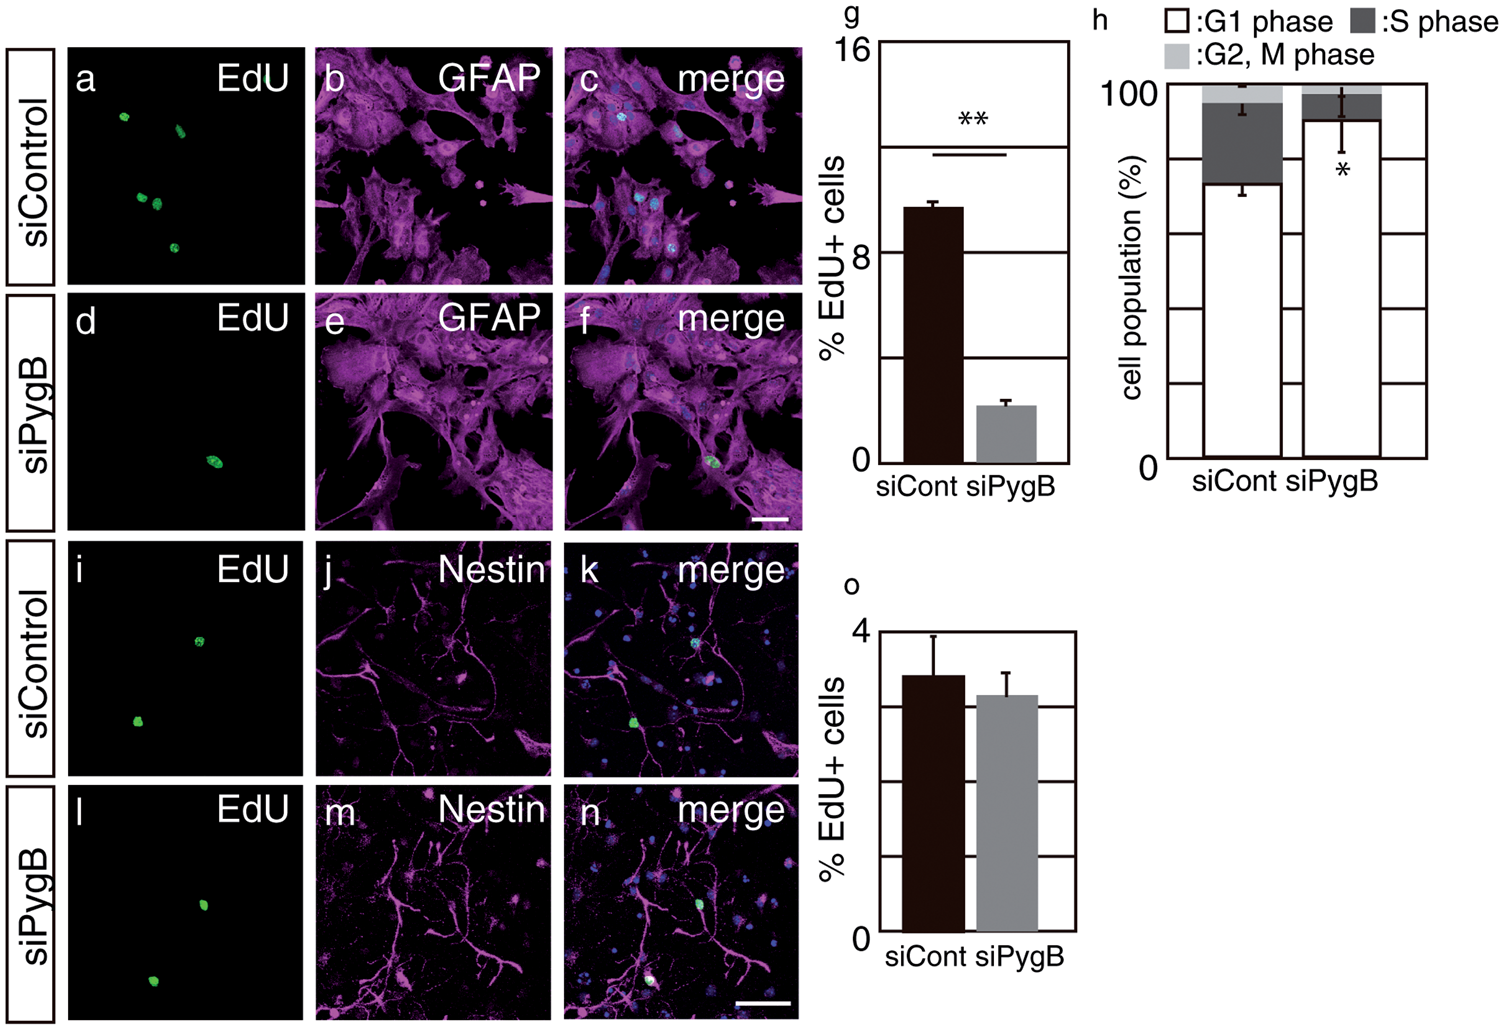
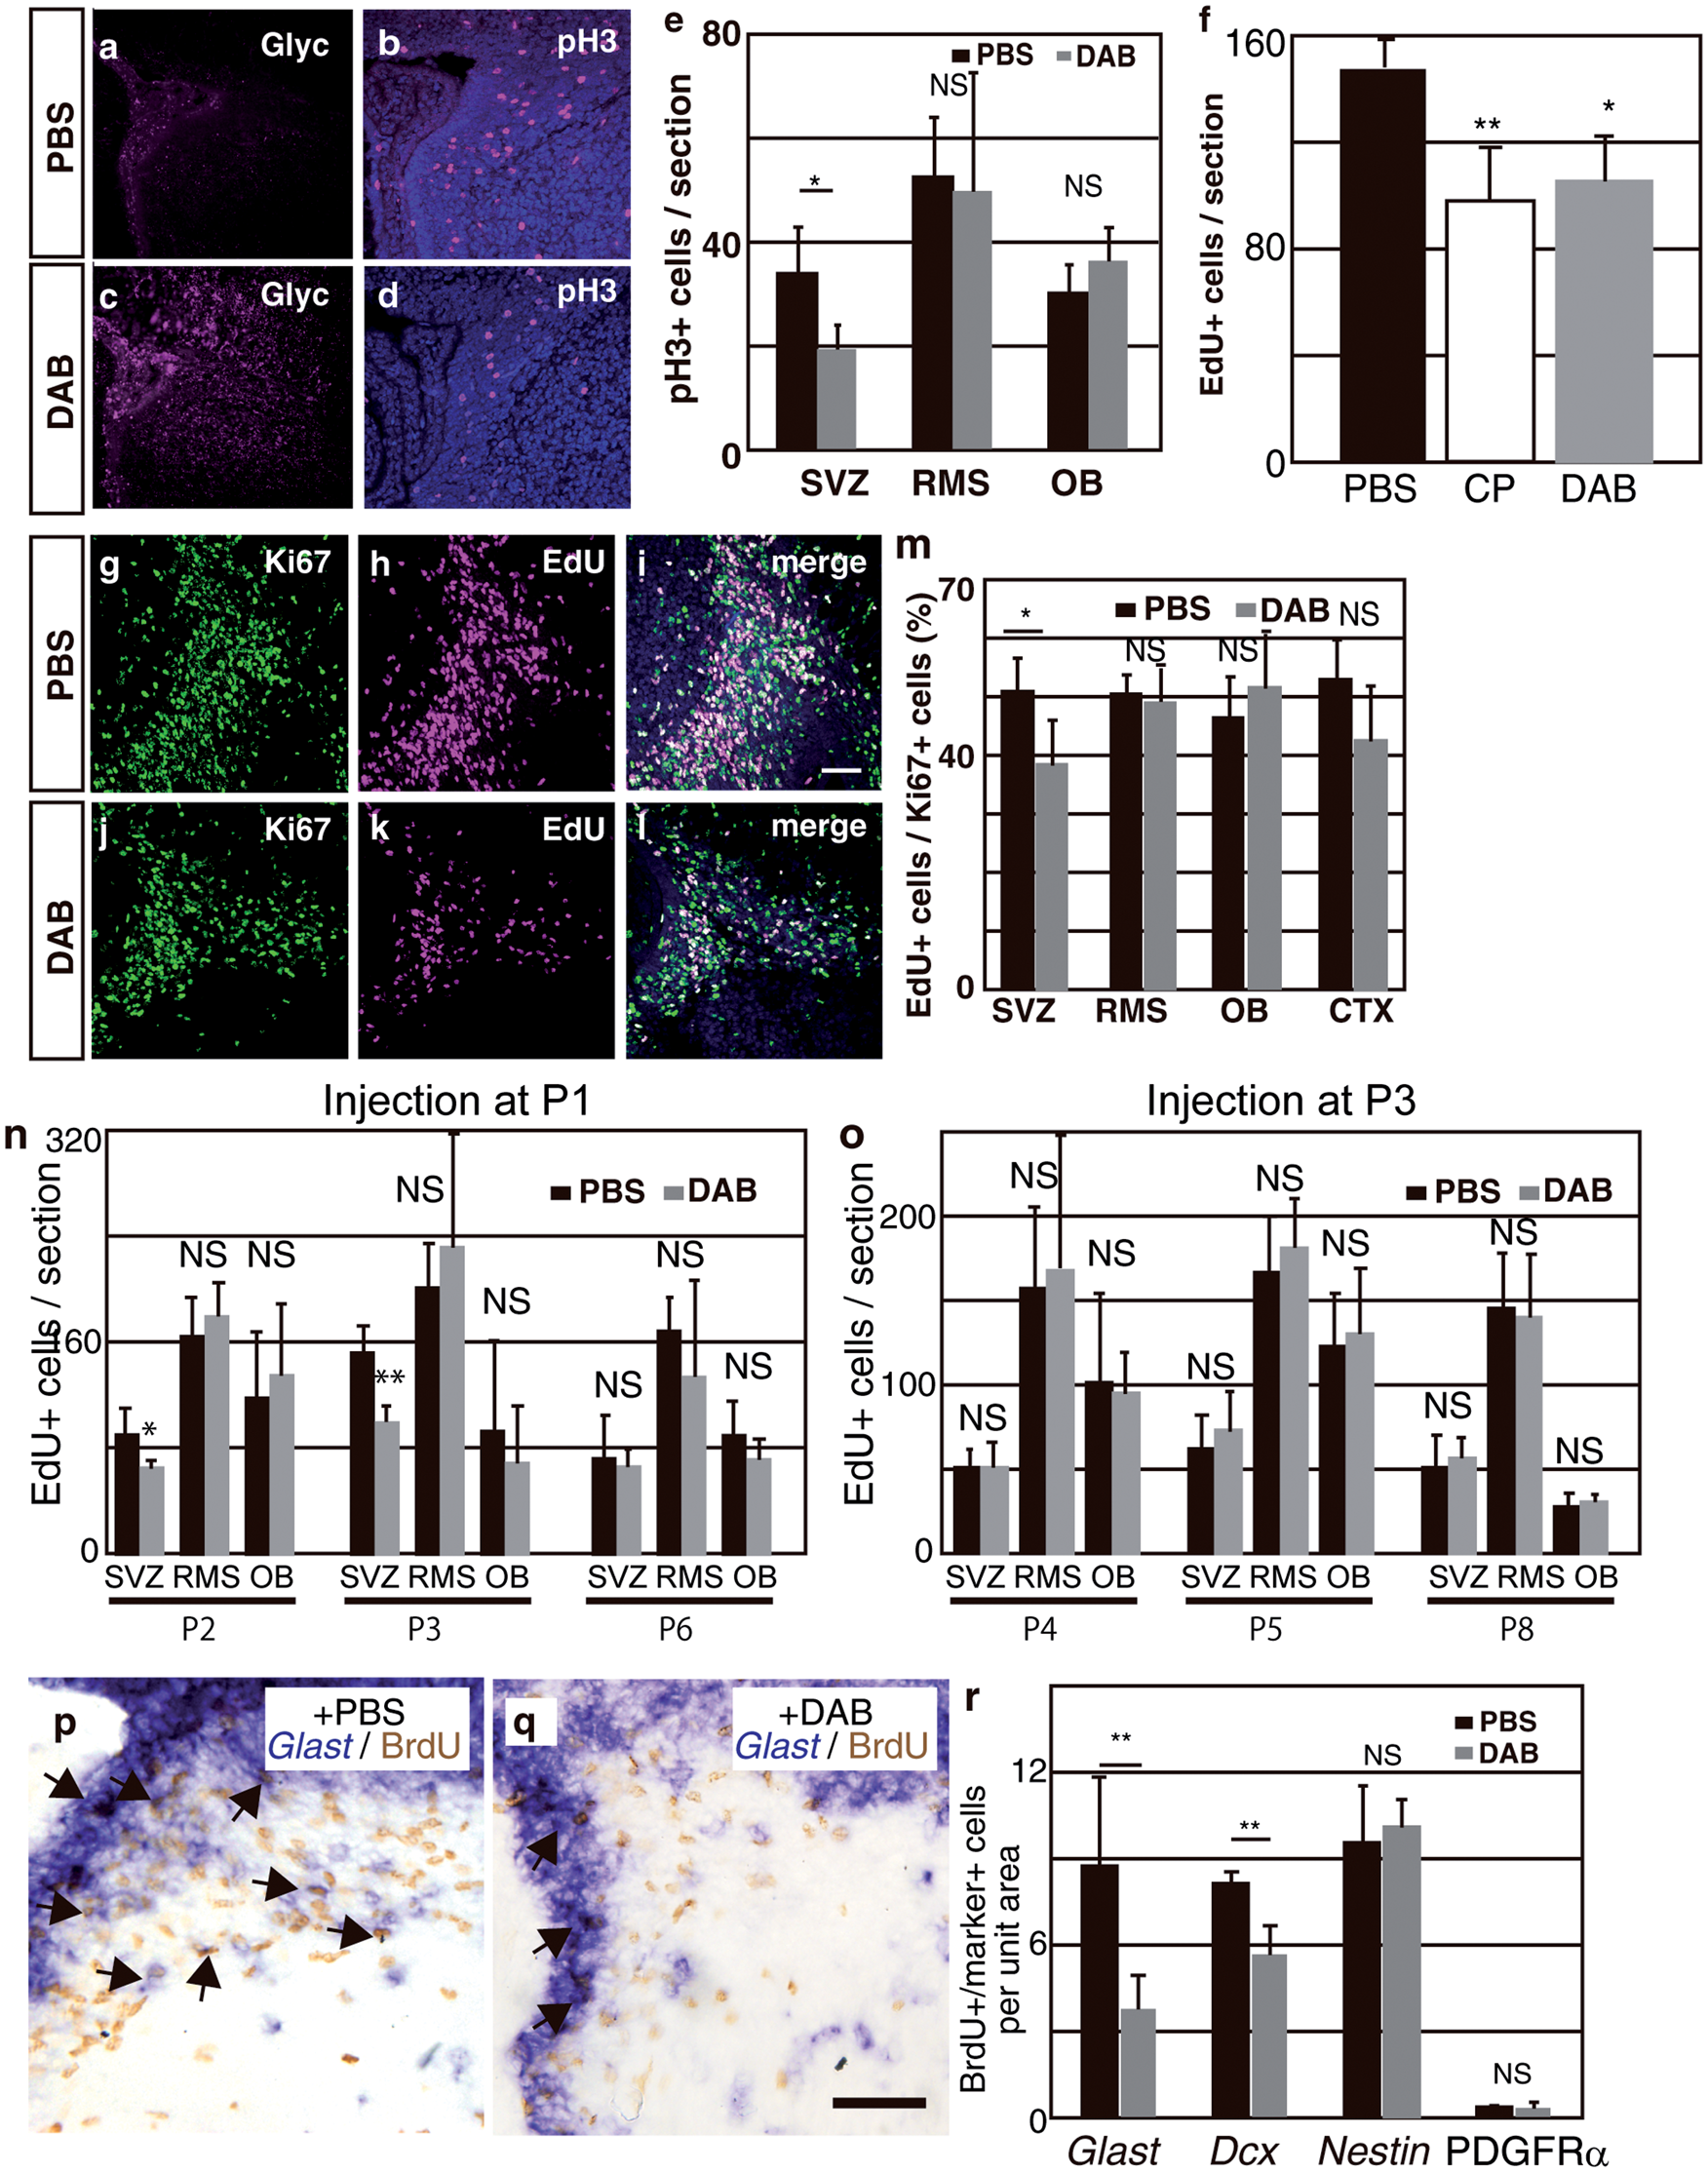
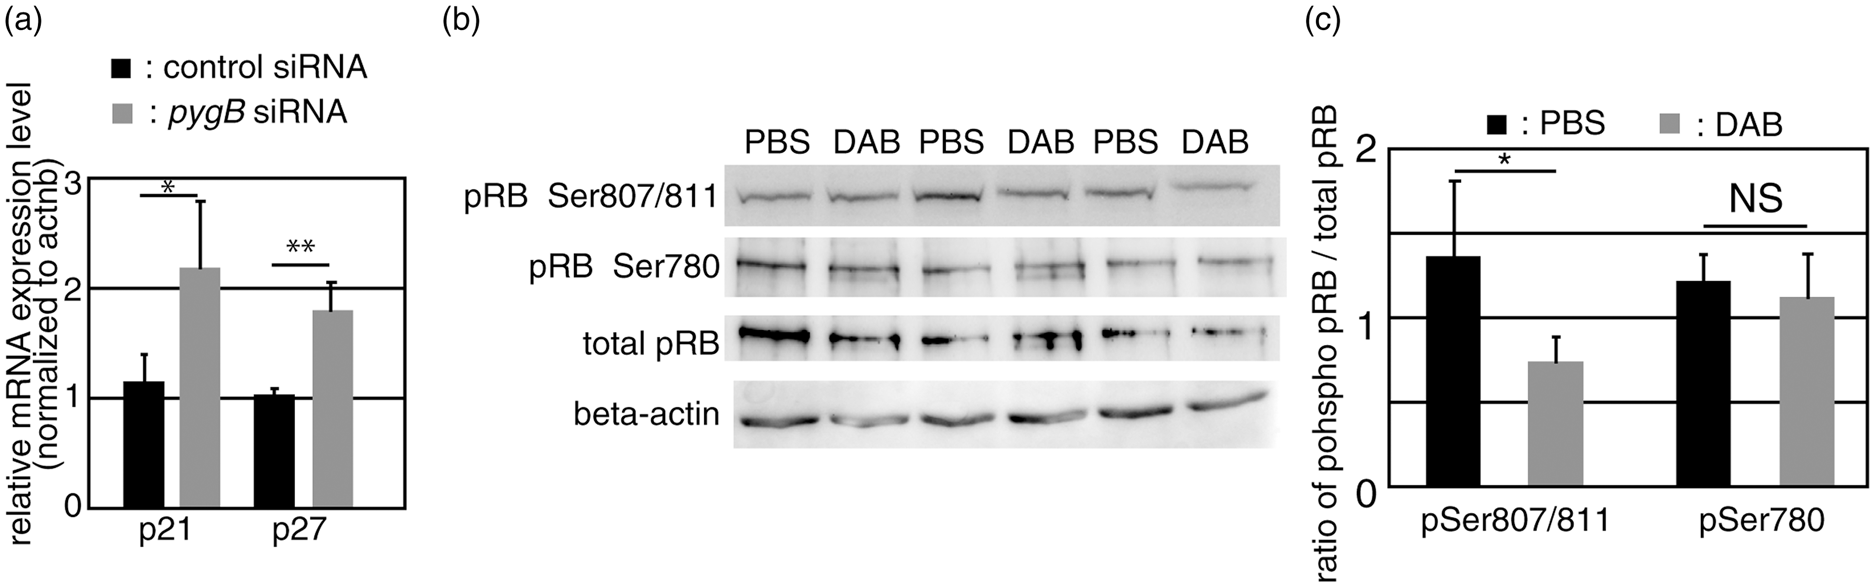
Localization of glycogen in the embryonic telencephalon. (a–c): Coronal sections were pretreated with dimedone and stained using periodic acid Schiff reagent. CX indicates the cerebral cortex and Str, the striatum. The bar indicates 100 µm. (d) In an E18.5 sagittal section, glycogen was observed along the rostral migratory stream (RMS). The bar indicates 100 µm. (e–g) The dorsal/ventral boundary region of a–c (subventricular zone, SVZ) was magnified. (h) The pretreatment of sections with amylase completely abolished the staining of PAS+ glycogen. The bar indicates 50 µm. (i) Sections at E18.5 were stained by glycogen (magenta) with βIII-tubulin (green). (j–k) Sections were stained by glycogen (k and n) with βIII-tubulin (j) or GLAST (m). The SVZ area corresponding to the dashed box in (i) is shown. Merged images are shown in (l) and (o), respectively. The GLAST+/Glyc+ cell in (o, arrow) was merged with Hoechst staining (blue) and shown in the inset. The bar indicates 50 µm. Decreased glycogen content in the postnatal SVZ. (a–c) E18.5 brain sections were double-stained with glycogen (b, magenta) and GLAST (a, green). A merged image is shown in (c). The bar indicates 50 µm. (d) Dimedone-PAS staining of the E18.5 SVZ is shown in (d). (e–g) P1 brain sections were double-stained as described above. (h) Dimedone-PAS staining of the P1 SVZ area. (i) Biochemical quantification of glycogen content in the SVZ (black bars) or cortex (gray bars). Glycogen content was normalized to protein concentrations. Error bars show S.D. and * indicates p < 0.05. Expression of PygB in the SVZ and its postnatal increase. (a) A RT-PCR analysis was performed using cDNA prepared from the E18.5 olfactory bulb (Ob), rostral migratory stream (RMS), and subventricular zone (SVZ). No reverse transcriptase controls were shown as –RT. (b) In situ hybridization of the PygB gene in an E18.5 sagittal section (purple, arrows). The dashed line shows the lateral ventricle. (c) The total activity of phosphorylase a (active form) + b (less active form) observed along the RMS (purple, arrowheads) at P1. (d) In the P1 brain, active glycogen phosphorylase was also detected along RMS (arrowheads). (e–h) Total phosphorylase activities and active phosphorylase were examined in E18.5 (e and f) or P1 (g and h). The bar indicates 50 µm. (i) A biochemical assay of glycogen phosphorylase activity at E18.5 or P1 SVZ. The activity of phosphorylase a + b was analyzed by adding AMP to the reaction solution. Phosphorylase activity was calculated as unit and normalized to mg protein. Error bars indicate S.D. and * indicates p < 0.05 (n = 3). (j) The ratio of phosphorylase a to phosphorylase a + b at E18.5 or P1 SVZ. NS represents no significant difference. Inhibition of glycogen phosphorylase led to cell cycle arrest in primary SVZ astrocytes Inhibition of glycogen phosphorylase decreased cell proliferation in the postnatal SVZ. (a–d): PBS or DAB was injected into the lateral ventricle of P0 mice and brains were sampled 48 h later. Sections were stained with glycogen (magenta; a and c). Mitotic cells at P2 were visualized using a phospho-histone H3 antibody (pH3, magenta) and merged images with Hoechst (blue) were shown (b and d). The bar indicates 50 µm. (e): Quantitative analysis of pH3+ cells per section. The black bars show PBS-injected samples and gray bars show DAB-injected samples. The error bar shows S.D., *indicates p < 0.05, and NS represents no significant difference (n = 6). (f) PBS (black bar), CP-91149 (white bar), or DAB (gray bar) was injected into the lateral ventricle, and S-phase cells were labeled by injecting EdU one hour before sampling. EdU-positive cells in the SVZ were quantified (n = 6). (g–l): PBS or DAB-injected mice were labeled with EdU and stained with Ki67 (green; g and j) and EdU (magenta; h and k). Merged images were shown in i and l. The bar indicates 50 µm. (m) The percentage of EdU+ cells among Ki67+ cells in various brain areas. (n and o) The effects of a glycogen inhibitor treatment on cell proliferation at different times. DAB were injected into P1 (n) or P3 mice (o), and EdU+ cells were examined one day, two days, or five days after the injection. Error bars show S.D., * indicates p < 0.05 and ** indicates p < 0.01 (n = 6). (p and q) In situ hybridization of Glast mRNA (purple) in combination with BrdU immunohistochemistry (Brown). Arrows indicate Glast+/BrdU+ cells and the bar indicates 50 µm. (r) Quantification of BrdU+/Marker+ cells in the SVZ region. The number of cells was divided by 104 µm2 as the unit area (n = 4). Inhibition of glycogen breakdown affected cell cycle inhibitors. (a) SVZ astrocytes were transfected with siRNA as indicated. The relative expression levels of p21 and p27 against beta-actin in control siRNA (black bars) or PygB siRNA (gray bars) transfected astrocytes are shown. Error bars show S.D., * indicates p < 0.05, and ** indicates p < 0.01 (n = 5). (b) A Western blot analysis of brain lysates injected with PBS or DAB. (c) The densities of bands were quantified using ImageJ and the ratio of phosphorylated pRB to total pRB was shown. The black bars show the ratio in PBS-treated brains and the gray bars show that in DAB-treated brains (n = 5).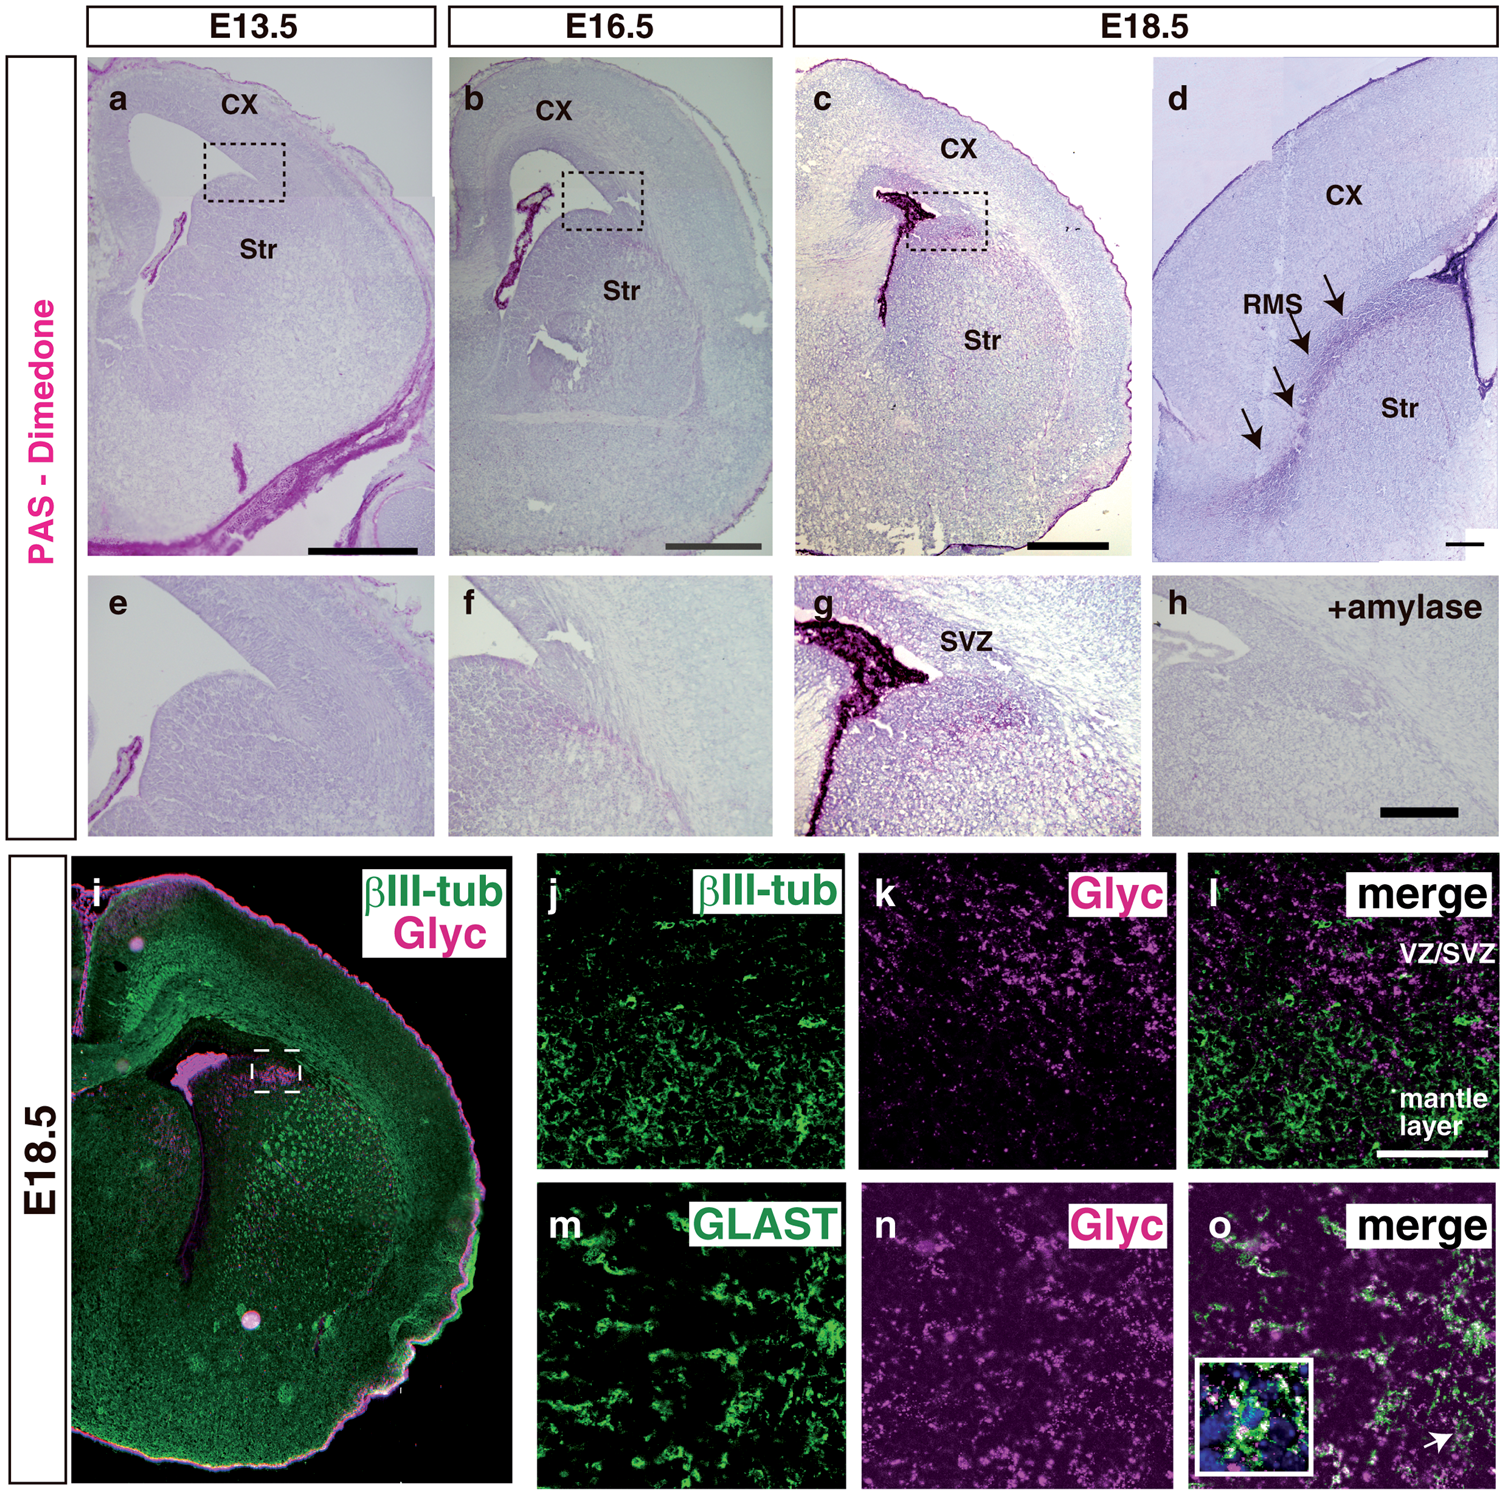
Dimedone-PAS staining
In order to visualize glycogen particles in sections, animals were anesthetized and transcardially perfused with 10% neutral buffered formalin followed by 24 h postfixation in the same fixative. Perfusion finished within 2 min after anesthesia and brains were immersed into the fixative within 5 min. Brains were dehydrated through a graded ethanol series, cleared in HemoD, and embedded in paraffin. They were cut into 6-µm-thick sections. After rehydration, sections were treated with 0.5% periodic acid for 10 min and then incubated with saturated dimedone at 65℃ for 10 min to block non-specific reactions. After a brief wash with water, sections were incubated with acid Schiff reagent at room temperature for 30 min. Sections were thoroughly washed with tapped water and counter-stained with hematoxylin.
Immunohistochemistry and in situ hybridization
Immunohistochemistry and in situ hybridization were performed as previously described. 18 Animals were anesthetized and transcardially perfused using 4% paraformaldehyde in PBS followed by 24 h postfixation in the same solution. Perfusion finished within 2 min after anesthesia and brains were immersed into postfixative solution within 5 min. Frozen brains were sectioned at a thickness of 20 µm with a cryostat at −18℃. The primary antibodies used in this study were: an anti-glycogen antibody (a generous gift from Dr. Otto Baba 19 ), anti-βIII-tubulin, anti-GFAP (Sigma, St Louis, USA), anti-GLAST (Frontier Bioscience, Hokkaido, Japan), anti-Ki67 (Abcam Japan, Tokyo, Japan), and anti-phospho-histone H3 (Millipore Japan, Tokyo, Japan). The PygB (NM_153781: nt 925–1930), Nestin (NM_016701: nt 4182–5212), Dcx (NM_001110224: nt 186–1131), and Glast (NM_148938: nt 571–1676) sequences were used for in situ hybridization.
Biochemical quantification of glycogen
Brains were quickly removed from skull and treated with microwaves for 30 s before freezing to avoid glycogen degradation. Lowry et al. 20 previously reported that glycogen levels remained stable for at least 2 min in young mice following decapitation under pentobarbital anesthesia. We started the microwave treatment within one minute of decapitation, and finished the entire treatment within 90 s so that glycogen levels were considered to be stable during tissue collection. Frozen brains were sectioned at a thickness of 400 µm and specific brain areas were punched out using a 20-gauge needle. Tissues were lysed in PBS containing 0.1% Triton X-100 and incubated at 70℃ for 5 min. After centrifugation, half of the lysate was digested by amyloglucosidase at 37℃ for 1 h, and glucose concentrations were then measured using a glucose assay kit (Sigma, St Louis, USA). Glycogen content was calculated by subtracting the glucose concentration of the lysate from that of the amyloglucosidase-treated lysate. Protein concentrations were measured by the Bradford method using bovine serum albumin as a standard.
Primary culture
In order to culture SVZ astrocytes, the SVZ area of P1 ICR mice was dissected under a microscope. Cells were seeded onto a poly-L-lysine (PLL)-coated flask and cultured in DMEM/F12 containing 10% FBS. After seven days, cells were detached using trypsin and seeded onto PLL-coated glass coverslips. In adherent neural progenitor cultures, the cortices of E14.5 ICR mice were trypsinized and seeded onto poly-L-ornithine- and fibronectin-coated dishes and cultured in DMEM/F12 containing 1% N2 supplement (Wako Pure Chemical, Osaka, Japan) and 10 ng/ml bFGF (PeproTech, Rocky Hill, USA). esiRNA against the glycogen phosphorylase brain type or control Mission esiRNA (Sigma, St Louis, USA) was transfected into primary cultured cells using Lipofectamine 2000 according to the manufacturer’s instructions. EdU staining was performed according to the manufacturer’s protocol. In the image cytometry analysis, cells were collected using a trypsin treatment and fixed with 4% paraformaldehyde. Cells were then stained with propidium iodide and 0.01 mg/ml RNAse in PBS containing 0.05% Triton X-100 for 30 min. After washing with PBS twice, cells were analyzed using a Tali image cytometer (Invitrogen, Carlsbad, USA).
Glycogen phosphorylase histochemistry and biochemical enzyme activity assay
The histochemical staining of glycogen phosphorylase was performed as previously reported.21–23 Briefly, brains were removed and immediately frozen in powdered dry ice within one minute after decapitation. Frozen brains were soon sectioned with a cryostat at −18℃ and sections were incubated with 25 mM sodium acetate (pH 6.0), 3.3 mM glucose-1-phosphate, 1 mM dextran, 5 mM EDTA, and 4 mM NaF at 37℃ for 30 min. In order to detect total phosphorylase (phosphorylase a + b), 3 mM 5′-adenosine-monophosphate (AMP) was added to the reaction solution. After being incubated, sections were briefly fixed with 40% ethanol and visualized using Lugol’s solution (Sigma, St Louis, USA).
A biochemical assay of glycogen phosphorylase activity was performed as previously described.24,25 Briefly, brains were removed and immediately frozen as above mentioned. Then tissues containing SVZ were cut out with a cryostat at −18℃. Tissues from three brains were lysed in PBS containing 0.1% TritonX-100 and cleared by centrifugation. Supernatans were mixed in enzyme assay buffer containing 50 mM potassium phosphate (pH 6.8), 0.2% glycogen, 1.3 mM MgCl2, 0.1 mM EDTA, 0.43 mM β-nicotinamide adenine dinucleotide phosphate, 3.0 × 10⁻⁴% glucose-1,6-diphosphate, 1 unit of glucose-6-phosphate dehydrogenase, and 1 unit of phosphoglucomutase. Absorbance at 340 nm was analyzed for enzymatic activity and the calculated unit was normalized to the protein concentration. The total activity of glycogen phosphorylase (glycogen phosphorylase a + b) was analyzed by adding 1.6 mM AMP to the reaction mixture. One unit of glycogen phosphorylase is defined as the amount of activity that produces 1 µmol NADPH/min at 30℃.
Intraventricular injection
Prior to the postnatal lateral ventricular injection, mice were anesthetized using hypothermia or isoflurane. In P0 mice, a glass needle was directly inserted into the lateral ventricle using fiberoptic light, which enables the visualization of the brain shape. In P3 mice, a small incision was made in the skin and a glass needle was injected into the lateral ventricle under fiberoptic light. The skin incision was closed using polyamide sutures (Ethicon, West Somerville, USA) soon after the injection. Approximately 2 μl of PBS, 50 μM 1,4-dideoxy-1,4-imino-d-arabinitol (DAB; Wako Pure Chemical, Osaka, Japan) solution, or 1 μM of CP-91149 (Sigma, St Louis, USA) solution was mixed with 0.2 μl of 0.1% Fastgreen dye and injected into the lateral ventricle of newborn mice under anesthesia. The location of the injected site was 1 mm anterior to the lambda and 1 mm lateral to the midline. After surgery, mouse pups were kept on a heated pad (37℃) for approximately 10 min before returning them to the home cage.
Real-time PCR
Freshly frozen embryonic brains were cut at a thickness of 400 µm and RNA was extracted from tissues punched out using 20-gauge needles. In order to extract total RNA, tissue punches were homogenized and total RNA was purified using a NucleoSpin RNA kit (Macherey-Nagel, Düren, Germany). The PCR primers used for real-time PCR were as follows; p21-sense: 5′-GCAGATCCACAGCGATATCC-3′, p21-antisense: 5′-CAACTGCTCACTGTCCACGG-3′, p27-sense: 5′-GATGAGGAAGCGACCTGCT-3′, p27-antisense: 5′-CAGTGATGTATCTAATAAACAAGGAAA-3′, beta-actin-sense: 5′-GGCTGTATTCCCCTCCATCG-3′, and beta-actin-antisense: 5′-CCAGTTGGTAACAATGCCATGT-3′.
Western blotting
Tissues containing the SVZ were cut out and lysed in RIPA buffer containing 20 mM Tris-HCl (pH 7.4), 150 mM NaCl, 1 mM EDTA, 1% Nonidet P40, 1% SDS, 0.1% deoxycholate, and 1 mM NaF with a protease inhibitor. After washing, the membranes were incubated with anti-phospho pRB ser780 or anti-phospho pRB ser807/811 (Cell Signaling Technology, Danvers, USA), followed by an incubation with HRP-labeled anti-rabbit IgG (Sigma, St Louis, USA). The membranes were incubated with Chemi-Lumi One Super (Nacalai Tesque, Kyoto, Japan) and analyzed using LAS-2000 (Fujifilm, Japan). After detection, membranes were treated with WB Stripping Solution (Nacalai Tesque, Kyoto, Japan) to strip antibodies and reprobed with anti-total pRB (Proteintech, Chicago, USA) or beta-actin (Abcam Japan, Tokyo, Japan). The densities of Western blot bands were quantified using ImageJ software.
Statistical analysis
In the biochemical quantification of glycogen, a one-way analysis of variance (ANOVA) and Tukey-Kramer’s post hoc test were applied to the statistical analysis (see Figure 2(i)). In order to compare the effects of glycogen phosphorylase inhibitors, we used a one-way ANOVA and Dunnett’s post hoc test (see Figure 5(f)). In other analyses, we used a two-tailed Student’s t-test. We performed five independent experiments for the Western blotting analysis and real-time PCR and four independent experiments for the other figures for statistical analyses.
Results
Glycogen accumulated in GLAST+ cells along the RMS
In order to analyze the localization of glycogen in the prenatal telencephalon, we performed periodic acid Schiff (PAS) staining coupled with a dimedone treatment. 26 PAS+ signals were observed from E13.5 in the choroid plexus, whereas detectable signals were not apparent in the telencephalon (Figure1(a) and (e)). PAS+ signals appeared near the dorsoventral border of the telencephalon from E16.5 (Figure 1(b) and (f)), and the most intense signal was observed at E18.5 and accumulated around the SVZ at the dorsoventral boundary of the telencephalon (hereinafter referred to as the SVZ: Figure 1(c) and (g)). More PAS+ signals were present in the ventral telencephalon than in the dorsal telencephalon throughout prenatal development. In the dorsoventral boundary region, specialized cell types form the RMS, in which neurons are generated and migrate toward the olfactory bulb throughout life. As expected, PAS+ signals were present along the developing RMS in sagittal sections (Figure 1(d)). The pretreatment of sections with amylase completely abolished PAS+ signals, indicating that these were glycogen signals (Figure 1(h)). We next examined which cells stored glycogen using the anti-glycogen antibody. The distribution of glycogen signals by immunohistochemistry was similar to that of the PAS reaction (Figure1(i)). In order to identify the cell types showing glycogen immunoreactivity, we performed double staining using the anti-glycogen antibody. Glycogen immunoreactivity was not present in βIII-tubulin+ immature neurons (Figure 1(j) to (l); boxed area in Figure 1(i)) or PDGFRα+ oligodendrocyte progenitor cells (data not shown). In an area corresponding to Figure 1(j) to (l), GLAST+ astrocytes contained glycogen in their cytoplasm (Figure 1(m) to (o) inset). We also observed GLAST+/glycogen+ cells within the ventricular zone in addition to astrocytic cells, which were distant from the lateral ventricle (data not shown). We attempted to stain for GFAP, another marker for astrocytes, but did not detect its expression in the SVZ at E18.5 (data not shown). These results demonstrated the presence of glycogen in radial glial and astrocytic lineage cells in the SVZ and RMS, and that it gradually accumulated during the prenatal developmental stage, suggesting specific cellular metabolism in astrocyte lineage cells.
Perinatal changes in glycogen content
Since the source of nutrients changes in the perinatal stage, we examined differences in glycogen levels between the late embryonic stage (E18.5, Figure 2(a) to (d)) and early postnatal stage (P0, Figure 2(e) to (h)). We found that glycogen immunoreactivities were significantly lower in the early postnatal telencephalon (Figure 2(f)) than in the prenatal stages (Figure 2(b)). We still observed similar patterns of PAS+ signals in the SVZ at E18 (Figure 2(d) and (h)). The antibody used in this study has been reported to recognize densely branched regions of glycogen exposed near the molecular surface 27 ; therefore, the amount of glycogen may have decreased soon after birth. In support of this, a biochemical analysis of glycogen revealed that the glycogen content significantly decreased soon after birth in the ventral telencephalon (Figure 2(i)). The decrease observed in postnatal glycogen levels was restricted to the SVZ, with no significant changes in the cortex. These results indicate that the glycogen that accumulated in the prenatal stages was degraded and used for cellular metabolism soon after birth.
Brain-type glycogen phosphorylase was involved in the degradation of glycogen in the early postnatal telencephalon
Glycogen phosphorylase catalyzes the release of glucose-1-phosphate from glycogen. There are three glycogen phosphorylase isoforms: brain, muscle, and liver types. We performed RT-PCR and in situ hybridization and found that the brain isoform of glycogen phosphorylase (a.k.a. PygB) was predominantly expressed in the SVZ as well as along the RMS (Figure 3(a) and (b)). In order to clarify whether the activation of glycogen phosphorylase is involved in early postnatal glycogen degradation, we performed enzymatic histochemistry to directly assess the active form of glycogen phosphorylase (phosphorylase a) on freshly frozen sections. In addition, net phosphorylase activity was analyzed by adding AMP to the reaction solution, resulting in a shift from the less active form (phosphorylase b) to the active form. Glycogen phosphorylase a + b and phosphorylase a were both detected along the developing RMS of P1 brains (Figure 3(c) and (d)). We also observed glycogen phosphorylase a in the P1 SVZ; however, it was not present in the E18.5 brain (Figure 3(e) and (g)). We confirmed the presence of glycogen phosphorylase a + b by detecting total phosphorylase activity (Figure 3(d) and (f)). Furthermore, we performed a quantitative biochemical assay on phosphorylase activity and found that glycogen phosphorylase a activity was higher in the postnatal than in the embryonic stages (Figure 3(i)). In addition, total glycogen phosphorylase activity was also increased in the postnatal stage (Figure 3(i)). The ratio of phosphorylase a to phosphorylase a + b between E18.5 and P1 was not different (Figure 3(j)), suggesting that the increased amount of phosphorylase a resulted in glycogen breakdown in early postnatal age. These results indicate that increased amount of total PygB as well as active PygB was involved in glycogen breakdown in the postnatal SVZ.
Glycogen phosphorylase was involved in regulating the cell cycle in primary cultured SVZ astrocytes
In order to clarify the functional significance of glycogen in the early postnatal brain, we established an in vitro SVZ primary astrocyte culture from P1 brain, and the PygB gene was knocked down by introducing pooled siRNA, which allows for the specific knockdown of target genes. 28 In PygB knockdown cells, the mRNA of PygB was down-regulated to 25.7%, as analyzed using real-time PCR (data not shown). We examined cell proliferation by pulse labeling of the S-phase using EdU. The proportion of EdU+/GFAP+ astrocytes was markedly less in PygB knockdown cells than in control siRNA-transfected SVZ astrocytes (Figure 4(a) to (g)). The number of cleaved caspase 3+ cells in PygB knockdown cells was similar to that of cells transfected with control siRNA (data not shown). We also analyzed the cell cycle of transfected astrocytes and found that the cell population in the G1 phase was higher than that in the control (Figure 4(h)). Nestin+ neural stem/progenitor cells are another class of proliferative cells within the embryonic SVZ. In order to analyze whether PygB knockdown also decreases the proliferation of Nestin+ cells, as was observed in GFAP+ cells, we cultured Nestin+ cells and then transfected them with siRNA against PygB. No significant changes were observed in the proportion of EdU+ cells among Nestin+ cells (Figure 4(i) to (o), suggesting that PygB specifically regulates the cell cycle in SVZ astrocytes.
Inhibition of glycogen phosphorylase decreased the proliferation of astrocyte lineage cells in vivo
In order to investigate whether glycogen breakdown is required for cell proliferation in the early postnatal brain, similar to primary cultured SVZ astrocytes, we injected DAB, a glycogen phosphorylase inhibitor, into the lateral ventricle of P0 mouse pups. As expected, glycogen accumulated in the SVZ more strongly in DAB-injected brains than in PBS-injected brains (Figure 5(a) and (c)). The number of phospho-histone H3 (pH3)+ cells in the SVZ area was 56% lower in inhibitor-injected animals than in control animals (Figure 5(b), (d), and (e)), suggesting that the inhibition of glycogen breakdown also reduced the number of M phase cells in vivo. No significant differences were observed between PBS-injected samples and inhibitor-injected samples in the RMS (Figure 5(e)). This may have been because the injected inhibitors did not fully inhibit glycogen phosphorylase activity in the RMS due to the infiltration rate to a distant location from the lateral ventricle into which the inhibitors were injected. In order to confirm that the DAB-induced decrease in cell proliferation was not due to non-specific effects, we injected another glycogen phosphorylase inhibitor, CP-91149, into the lateral ventricle of P1 mice. We injected EdU intraperitoneally one hour before sampling, labeled S-phase cells, and quantified proliferative cells in the SVZ. We again observed a decrease in cell proliferation in CP-91149 - and DAB-treated brains (Figure 5(f)). The results obtained using two different kinds of inhibitors indicated that glycogen breakdown is important for cell proliferation in the early postnatal SVZ. We co-immunostained EdU with anti-Ki67, the latter of which is a marker of all cells undergoing the cell cycle, and found that the ratio of EdU+/Ki67+ cells was decreased within the SVZ (Figure 5(g) to (l), and (m)), indicating that the proportion of cells in the S phase decreased among proliferative cells. These results support those obtained in vitro showing an increase in the cell population at the G1 phase upon the inhibition of glycogen phosphorylase (Figure 4). We then analyzed the time course of the inhibitory effects of glycogen phosphorylase on cell proliferation. We injected DAB into P1 brains and analyzed them at P2, P3, and P6. We found that the inhibition of glycogen phosphorylase at P1 decreased cell proliferation within two days only in the SVZ, but had no effect on cell proliferation five days after the injection in the SVZ (Figure 5(n)). In addition, the injection of the glycogen phosphorylase inhibitor at P3 had no effect on cell proliferation in the SVZ at any time (Figure 5(o)). We did not observe the inhibition of cell proliferation in the RMS and the Ob (Figure 5(n) and (o)). These results suggest that glycogen stores are used in early postnatal ages (P0 to P1). We then attempted to identify the types of cells showing decreased proliferation when glycogen breakdown is inhibited. We performed in situ hybridization to detect the expression of cell type markers in combination with anti-BrdU immunohistochemistry. We observed that Glast+ (Figure 5(p) to (r); astrocyte lineage marker), Dcx+ (Figure 5(r) and data not shown; immature neuron (neuroblast) marker), or Nestin+ (Figure 5(r) and data not shown; neural stem/ progenitor cell marker) cells incorporated BrdU. The percentage of BrdU+ cells was decreased in Glast+ cells and Dcx+ cells, whereas the incorporation of BrdU in Nestin+ cells was not significantly different between control and inhibitor-treated brains (Figure 5(r)). Furthermore, double immunostaining of BrdU and PDGFRα revealed that the number of BrdU+ oligodendrocyte progenitors was not altered (Figure 5(r)). These results suggest that astrocyte lineage cells as well as neuroblast cells are affected by glycogen inhibition. Since astrocytic glycogen is known to be degraded to lactate, and lactate is transferred to neurons through monocarboxy transporters (MCT) as an energy source, we examined whether the administration of lactate with DAB rescues decreased proliferation in the SVZ. However, the administration of lactate did not recover the decreased number of pH3+ cells in the SVZ (data not shown). In addition, we performed in situ hybridization on MCT families (Mct1-4), and found that only Mct1 was expressed in the SVZ and purely in vascular cells (data not shown), indicating that decreased cell proliferation is mediated in a cell autonomous manner. These results suggest that glycogen is degraded and used as an energy source in order to maintain neonatal cell proliferation in a cell autonomous manner.
Inhibition of glycogen breakdown up-regulated the expression of cyclin-dependent kinase inhibitors
In order to elucidate the molecular mechanisms underlying reductions in cell proliferation in SVZ astrocytes when phosphorylase is inhibited, we analyzed the expression of genes involved in the cell cycle. We focused on cyclin-dependent kinase inhibitors (CKI) because a previous study reported that nutrient deprivation induced the expression of these genes 29 and cell cycle arrest. There are two classes of CKI: the INK family and CIP/KIP family. We found no significant differences in the expression of the four INK family genes between astrocytes transfected with control siRNA or PygB siRNA. We then examined the expression of CIP/KIP family members and found that the expression of p21 and p27 was up-regulated when PygB was knocked down in SVZ astrocytes (Figure 6(a)), suggesting that the expression of CKI leads to cell cycle arrest. In order to investigate whether the inhibition of glycogen phosphorylase induces cell cycle arrest in vivo, we examined the phosphorylation levels of the pRB protein because the expression of p21 or p27 directly affected the phosphorylation of the CDK substrate pRB, which is required for G1-S transition. We found that the phosphorylation of pRB at Ser808/811 was significantly decreased when the inhibitor was injected into the brain, whereas the phosphorylation of Ser780 was not significantly affected (Figure 6(b) and (c)). Overall, the pRB of the inhibitor-injected brain was less phosphorylated than that of the PBS-injected brain, suggesting that the inhibition of CDK-pRB is also the core mechanism underlying cell cycle arrest in the inhibited breakdown of glycogen. These results suggest that glycogen is an important energy source for maintaining cell proliferation in the early postnatal brain and abnormal glycogen breakdown leads to cell cycle arrest through the up-regulation of cell cycle inhibitors, thereby disturbing normal development.
Discussion
Early perinatal malnutrition affects the normal developmental program, 30 and, thus, it is important to understand how nutrient conditions or the cellular metabolism of neonatal cells regulates perinatal development. We herein showed that glycogen levels decreased in the early postnatal brain through the activation of glycogen phosphorylase. Moreover, the inhibition of glycogen metabolism decreased cell proliferation and simultaneously up-regulated the expression of cell cycle inhibitors. This is the first study to show the importance of the glycogen metabolic pathway in maintaining the cell cycle in the early postnatal brain.
A previous study reported that early postnatal mouse pups face transient neonatal nutritional starvation 3 and utilize embryonically stored energy sources in order to maintain normal development. Systemic glucose levels have been shown to decrease during the early neonatal period, 4 suggesting that tissue energy reserves are relatively small, but are required for metabolic demands. Moreover, mice deficient in glycogen synthase show embryonic lethality, 17 suggesting that glycogen is an important energy reservoir. We found that glycogen levels increased during the prenatal stage and decreased in the telencephalon soon after birth (Figure 2), which is consistent with other findings obtained in the whole brain.31,32 We did not observe a significant decrease in glycogen in the dorsal cortex (Figure 2(i)). Since various secreted factors have been shown to regulate the development of the dorsal and ventral cortices,33,34 ventral-specific secreted factors may affect glycogen metabolism by changing the activity of regulatory kinases, such as glycogen synthase kinase or phosphorylase kinase. 35 Prior to the present study, it was unclear whether glycogen breakdown was of physiological significance. We showed that the activity of PygB increased upon birth (Figure 3), indicating that glycogen decreases are due to active metabolism rather than passive degradation in the early postnatal brain. We observed increase of both total and active form of glycogen phosphorylase (Figure 3(i)). However, the ratio of active form was not changed before and after the birth (Figure 3(j)). We could not exclude the possibility that the ratio of active/inactive form of this enzyme provides a rate-limiting factor for glycogen metabolism. However, we reasoned that the most probable mechanism of sudden decrease of glycogen contents is due to the massive increase in total amount of active form of phosphorylase, because both histochemical and biochemical assays confirmed that the increase of type a was observed in (1) specific timing: immediately after the birth, (2) specific region: at the SVZ, and both of which are consistent with the evidence that sudden reduction of glycogen amount in the SVZ immediately after the birth. There are several reports showing the continuous increase of glycogen phosphorylase activity during prenatal and postnatal brain.36,37 Our study also indicated the increase of phosphorylase a + b activity from prenatal to postnatal stages. Folbergrova reported that the percentage of active phosphorylase is approximately 6% at P7 cortex, whereas it dramatically increased to 35% at P18 cortex. 36 In contrast, our data about the proportion of phosphorylase a was much higher (35% at E18.5 and 39% at P1) than the data in the previous report. This discrepancy could be due to the difference in brain area, as cortex was collected in the previous report, while the SVZ was examined in our study. Consistently, the amount of glycogen and the expression of phosphorylase were much higher in the SVZ compared to those in the cortex (Figures 2(i) and 3). Therefore, we concluded that the increase of glycogen phosphorylase a and glycogen phosphorylase a + b is involved in the postnatal glycogen breakdown.
Regarding the physiological significance of glycogen metabolism, we showed that cell proliferation decreased in primary cultured astrocytes and also in Glast+ cells in vivo when glycogen metabolism was inhibited (Figures 4 and 5). A previous study reported that the cell cycle was inhibited when cells were treated with a glycogen phosphorylase inhibitor, 16 which supports the results obtained in the perinatal brain in the present study. We cannot exclude the possibility that a reduction in cell proliferation in the SVZ is due to the accelerated migration of cells from the SVZ. However, we performed an EdU incorporation analysis one hour after the injection of EdU. Since the migration speed of Nestin+ cells is approximately 40 to 70 µm/h, 38 our labeling time was too short for cells to leave the SVZ. Moreover, we showed that the number of pH3+ cells in the SVZ decreased in the DAB-treated brain, suggesting that the main effect of the inhibition of glycogen phosphorylase is due to reduced cell proliferation and not to accelerated migration from the SVZ. Pharmacological inhibitors of glycogen phosphorylase showed that a decrease in the breakdown of glycogen reduces cell proliferation in vivo. Since two different kinds of inhibitors for glycogen phosphorylase induced similar decreases in cell proliferation, we concluded that glycogenolysis is involved in cell cycle regulation. We observed that the inhibition of glycogen metabolism up-regulates the expression of cell cycle inhibitors. CKI binds to Cdk4/6-cyclin and the Cdk2-cyclin complex, and subsequently inhibits the phosphorylation of pRB, resulting in cell cycle arrest at the G1 phase. As expected, we found that the inhibition of glycogen phosphorylase down-regulated the phosphorylation levels of pRB in vivo, suggesting that cell cycle arrest at the G1 phase causes the inhibition of cell proliferation. These results indicate that glycogen is an essential energy store for maintaining cell proliferation in postnatal development.
We found that strong glycogen signals were present in GLAST+ astrocytes in the dorsal/ventral boundary area (SVZ) and RMS, in which neurogenesis occurs throughout the life of rodents.39–41 Since glycogen is also present in the SVZ and astrocytes along the RMS, including the adult brain (data not shown), a specific metabolic pathway using glycogen may be a feature of astrocytes in the neurogenic area. The inhibition of glycogen metabolism alters cell proliferation in Dcx+ neuroblasts in addition to astrocyte lineage cells. Since we did not find detectable levels of glycogen in Dcx+ neuroblasts using immunohistochemistry (data not shown), it is possible that a decrease in the proliferation of Dcx+ cells is due to cell non-cell autonomous effects. Alternatively, Glast is also present in radial glial stem cells; therefore, reductions in the proliferation of Glast+ cells may result in a decrease in the number of more differentiated Dcx+/BrdU+ cells derived from Glast+ cells.
In conclusion, we herein demonstrated that glycogen is an important energy source for the regulation of cell proliferation during the early postnatal stage because disturbances in glycogen metabolism lead to cell cycle arrest. Our results provide novel insights into glycogen metabolism during neonatal brain development. A previous study showed that abnormal glycogen metabolism in rats results in neonatal transient hypoglycemia. 42 Furthermore, neonatal hypoglycemia has been shown to exert long-term effects on brain development including neurological damage.43–45 Therefore, the long-term effects of transient neonatal glycogen metabolic abnormalities on adult brain function need to be examined in further studies.
Footnotes
Funding
The author(s) disclosed receipt of the following financial support for the research, authorship, and/or publication of this article: This work was supported by Uehara Memorial Foundation.
Acknowledgments
We are grateful to Drs. Otto Baba at Tokushima University and Hitoshi Ashida and Michiko Yasuda at Kobe University for providing us with the glycogen antibodies. We also thank Dr. Akiko Nishiyama at the University of Connecticut for her helpful comments. This work was supported by a research grant from the Uehara Memorial Foundation and by JSPS KAKENHI (Grant number: 16K18396).
Declaration of conflicting interests
The author(s) declared no potential conflicts of interest with respect to the research, authorship, and/or publication of this article.
Authors’ contributions
HG, TN, and KO designed the experiments. HG performed the experiments and data analysis.