
Abstract
Pathophysiologic mechanisms of secondary brain injury after intracerebral hemorrhage and in particular mechanisms of perihematomal-edema progression remain incompletely understood. Recently, the role of spreading depolarizations in secondary brain injury was established in ischemic stroke, subarachnoid hemorrhage and traumatic brain injury patients. Its role in intracerebral hemorrhage patients and in particular the association with perihematomal-edema is not known. A total of 27 comatose intracerebral hemorrhage patients in whom hematoma evacuation and subdural electrocorticography was performed were studied prospectively. Hematoma evacuation and subdural strip electrode placement was performed within the first 24 h in 18 patients (67%). Electrocorticography recordings started 3 h after surgery (IQR, 3–5 h) and lasted 157 h (median) per patient and 4876 h in all 27 patients. In 18 patients (67%), a total of 650 spreading depolarizations were observed. Spreading depolarizations were more common in the initial days with a peak incidence on day 2. Median electrocorticography depression time was longer than previously reported (14.7 min, IQR, 9–22 min). Postoperative perihematomal-edema progression (85% of patients) was significantly associated with occurrence of isolated and clustered spreading depolarizations. Monitoring of spreading depolarizations may help to better understand pathophysiologic mechanisms of secondary insults after intracerebral hemorrhage. Whether they may serve as target in the treatment of intracerebral hemorrhage deserves further research.
Keywords
Introduction
Spontaneous intracerebral hemorrhage (ICH) remains a devastating disease with high ICU-mortality and long-term morbidity. 1 Factors determining functional outcome include initial disease severity, hematoma location and volume, the presence of intraventricular hemorrhage (IVH) and the patients’ age.2,3 Despite promising results in animal studies, translational pharmacological and neuroprotective studies have failed to show any significant benefit regarding functional outcome in randomized controlled trials.2,3
Perihematomal edema (PHE) progression is a frequent complication of spontaneous ICH and is associated with neurologic deterioration and poor outcome.4–7 It is still unclear why some patients develop severe brain swelling resulting in a devastating clinical course with increased intracranial pressure (ICP) and herniation 4 while other patients remain unaffected. Prevention of PHE progression by minimal invasive surgery for hematoma evacuation plus recombinant tissue plasminogen activator (NCT01827046) and targeted temperature management8,9 (and NCT01866384) is currently in the focus of ongoing trials. However, pathophysiologic mechanisms of secondary brain injury including mechanisms contributing to PHE after ICH still remain incompletely understood.
Spreading depolarizations (SDs) were first described in the rabbit by Leao in 1944 as a depression of cortical activity. 10 SDs have now been recorded by electrocorticography (ECoG) in numerous patients with acute brain injuries including patients with traumatic brain injury (TBI) and stroke.11–16 SDs are associated with pathophysiologic changes such as inverse neurovascular coupling leading to hypoperfusion, brain tissue hypoxia and brain metabolic derangement.12,17 When the depolarizations occur on an ECoG background without ongoing cortical activity, they are termed isoelectric spreading depolarizations (ISDs). Recently, Hartings et al. 15 described an independent association of ISDs with unfavorable outcome in patients with severe TBI. 15 A prospective trial targeting patients with aneurysmal subarachnoid hemorrhage (SAH) is currently ongoing (http://www.schlaganfallcentrum.de/forschung/forschungsgruppen/ag-dreier/). So far, only a few patients with ICH have been studied concerning the incidence of SDs, and little is known about their association with secondary brain injury in ICH.16,18 Fabricius et al. 18 described a prospective cohort of 12 patients with acute brain injury, including 5 patients with spontaneous ICH. SDs were recorded in two out of five patients; however, these two patients had a bleeding from an arterio-venous malformation, and no SDs were recorded in any of the three other patients with hypertensive and/or amyloid associated ICH.
In this current prospective observational trial, we describe the incidence of SDs in a cohort of poor grade ICH patients in whom hematoma evacuation was performed. Furthermore, we describe the timing of SDs relative to the bleeding and PHE and compare the curve characteristics to those patients with other etiologies of acute brain injury.
Materials and methods
Study population and ethical approval
A total of 27 comatose (Glasgow Coma Score, GCS, < 9) ICH patients underwent brain ECoG monitoring between January 2013 and July 2015 in the neurointensive care unit (NICU) in Innsbruck, Austria, (N = 21) and at Rigshospitalet, Copenhagen, Denmark (N = 6) according to a standardized protocol. Inclusion criteria were the presence of supratentorial intraparenchymal hemorrhage diagnosed on a head-CT-scan with or without IVH, and the clinical decision to perform craniotomy for lesion evacuation and/or decompression at the discretion of the local interdisciplinary team of neurointensivists and neurosurgical specialists. Exclusion criteria included absence of brain stem reflexes, or Do-Not-Resuscitate status.
One of our patients included in the current analysis has been recently published as a case report. 19 All patients were comatose, mechanically ventilated and treated primarily with continuous infusion of one or more of the following: sufentanil, remifentanil, midazolam and propofol. In selected patients, continuous S-ketamine infusion was added at the discretion of the treating neurointensivist. CT was performed serially as clinically indicated.
All head-CT scans were evaluated by an independent neuroradiologist (PR) blinded to clinical course, ECoG data and patient outcome. Initial hematoma volume was calculated using the ABC/2 estimating technique in ellipsoid hemorrhages and the ABC/3 in nonellipsoid hemorrhages.20-22 All post-surgical brain CT-scans were graded for PHE progression by increases in midline shift and/or in edema volume. 22 The midline shift was expressed in millimeters (mm) as the largest distance between the ideal midline and the septum pellucidum. 23 CT scans were obtained for clinical management and were grouped based by day post bleeding (Day 0–2, Day 3–5, Day 6–9).
Ethics
This prospective observational study was approved by the Ethics Committee of the Medical University of Innsbruck, Innsbruck Austria and the Ethics Committee of Region Hovedstaden, Denmark (UN4089 292/4.4 and H-1-2014-059) in accordance with the Declaration of Helsinki. Written informed consent was obtained according to federal regulations.
Clinical management and outcome evaluation
All patients were treated according to a standardized management protocol. ICP was monitored, if clinically indicated, by a ventricular drainage catheter or an ICP parenchymal probe (NEUROVENT_P-TEMP, Raumedic, Münchberg, Germany or CODMAN ICP monitoring system, Johnson & Johnson Medical LTD, Ascot, Berkshire, England). A target ICP of <20 mmHg was maintained using a stepwise management strategy (cerebrospinal fluid drainage if available, deepening of sedation, optimization of cerebral perfusion pressure (CPP), short-term hyperventilation, bolus osmotherapy and mild hypothermia in one center).3,24 CPP was targeted at >60 mmHg, and all patients were ventilated to achieve an arterial oxygen saturation ≥ 95% and PCO2 of 35 to 45 mmHg. An external ventricular drain was inserted in patients with hydrocephalus and/or patients with severe intraventricular bleeding. ECoG recordings were terminated, and electrode strips were removed at the bedside when invasive neuromonitoring was no longer clinically required. Clinical outcome was assessed at three months post bleeding using the modified Rankin Scale (mRS).
Subdural strip placement, electrocorticography recordings and analysis
Subdural electrode strips were placed in the immediate vicinity of the injured cortex and in adjacent supposedly healthy tissue. Postoperative probe location was confirmed by routine CT-scan in every patient (Figure 1).
Serial axial brain computed tomography images on admission (a), after hematoma evacuation (b), after 10 days (c) and four weeks (d) of patients with (patient 2) an without (patient 1) perihematomal edema progression. Midline shift increased from 6 to 8 mm in patient 2. Panel E in patient 1 indicates a three dimensional reconstruction image showing the subdural electrode (black arrow) and intraperenchymal ICP probe (white arrow). ICP: intracranial pressure.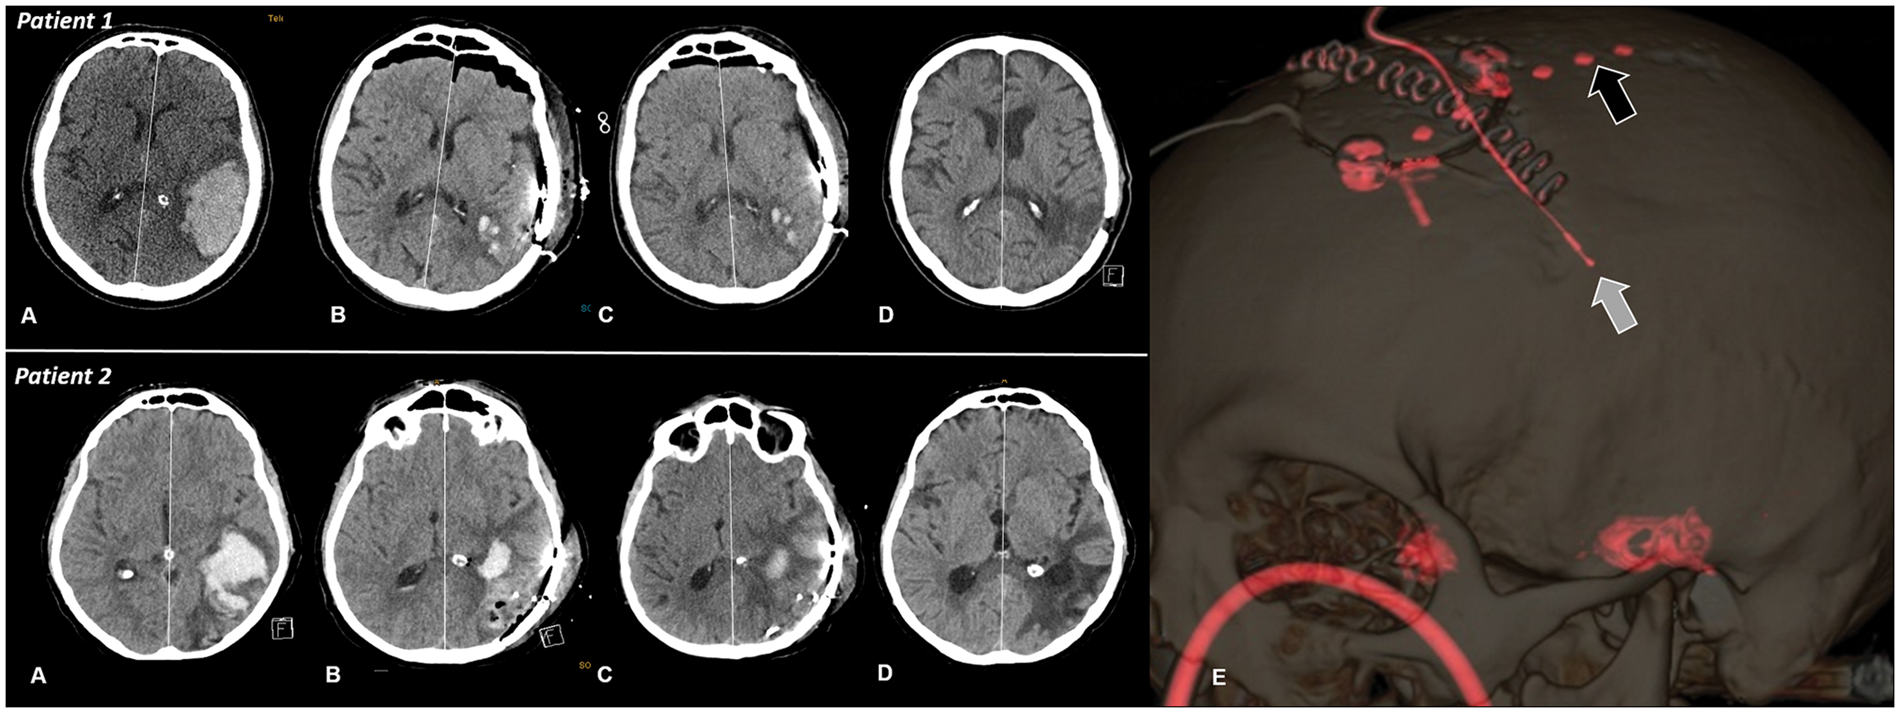
The subdural ECoG—strip (6 platinum contacts, 10 mm between contacts distance) was connected to six sequential bipolar channels (A[1-2], B[2-3], C[3-4], D[4-5], E[5-6] and F[6-1]) modified by a bio-signal amplifier (g.BSamp, g.tec Medical Engineering Gmbh, Austria) and recorded using PowerLab (Innsbruck) (ADInstruments, New South Wales, Australia) and LabChart Software (Version 7.2; ADInstruments; sampling rate: 200 Hz), or by using a CNS EEG & Multimodal Neuromonitor (Copenhagen) (Moberg Research, Inc., Ambler, Pennsylvania, USA) with subsequent data export to LabChart Software. An electrocardiogram patch placed on the patients shoulder and on the ICU-bed served as grounding, and a surface reference electrode (gold-plated silver) was glued with adhesive paste (SLE Colloidion Adhesive, South Croydon, UK) on the mastoid (Innsbruck); alternatively the electrode at the tip of the strip served as reference (Copenhagen). SDs were evidenced by a sequential onset of a negative direct current (DC) shift of more than 1-min duration 18 in adjacent channels. The event was scored as a spreading depression, if the negative DC shift was accompanied by a depression of ongoing activity in the 0.5–45 Hz ECoG band. If the SD occurred on a flattened “isoelectric” background in at least one channel, the event was scored as an ISD.15,16,18 The duration of the ECoG—depression was defined as the time (minutes) between depression onset and start of ECoG—recovery in the integral of power calculations of the band-pass filtered signal (0.5–45 Hz; 60 s time constant decay).13,25 Assuming an ideal linear spread of SD, propagation velocity was calculated by dividing 10 (separation in mm between adjacent contacts on the ECoG—strip) by the time interval in minutes between the onsets of the slow potential changes (SPC) in adjacent channels. Clusters were defined as the occurrence of at least three SDs within three or fewer consecutive recording hours.17,26,27
Mean arterial pressure (MAP), ICP, CPP and core temperature data for the duration of ECoG—monitoring were retrieved from the patient data management system (Centricity* Critical Care 7.0 SP2, GE Healthcare Information Technologies, Dornstadt, Germany or Phillips Intellivue MX800, Koninklijke Philips N.V, Holland) and averaged hourly. Epochs of 1 h were grouped according to the presence or absence of SDs, and vital data from these epochs were compared between groups.
Statistical analysis
Statistical analyses were performed using IBM SPSS V20.0 (SPSS Inc., Chicago, Illinois). Normally distributed data were reported as mean and standard error of mean (SEM), and nonparametric data as median and interquartile range (IQR) unless specified otherwise. Categorical variables were reported as count and proportions in each group. Mann–Whitney (MW) tests were used to compare medians and Chi-Square tests to compare frequencies between groups. Time series data of MAP, ICP and CPP at the time of ECoG monitoring (quartiles) were analyzed according to the occurrence of SDs and ISDs using a generalized linear model (GLM) using a normal distribution and identity-link function and were extended by generalized estimating equations (GEE) with an autoregressive process of the first order 28 to handle repeated observations within a subject.
A P value < 0.05 was considered as statistically significant.
In the figures time-point 0 indicates the calendar day of admission comprising a median of 9 h (ranging between 15 min and 23 h) and day 1 indicates the first full 24 h day.
Results
General characteristics and outcome
Baseline characteristics, complications and outcome.
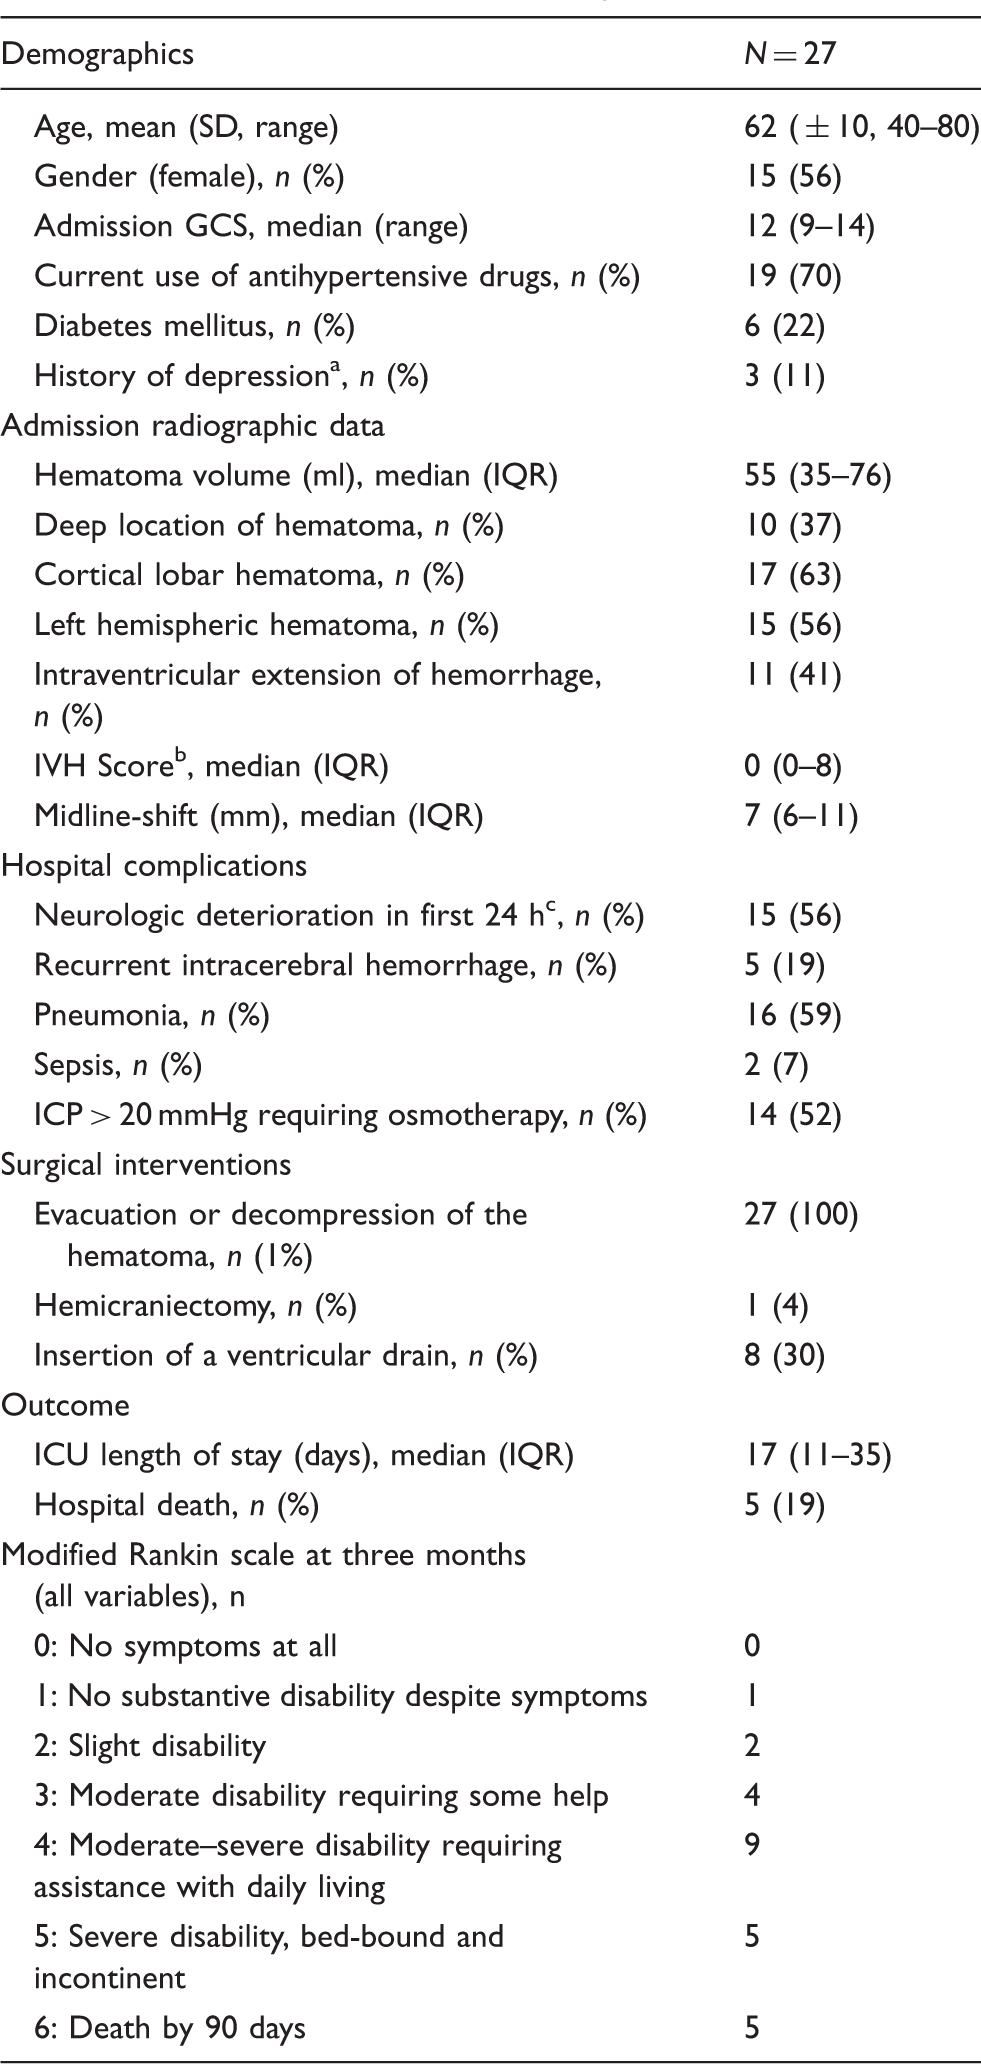
GCS: Glasgow Coma Scale; ICU: Intensive Care Unit; IVH: intraventricular hemorrhage.
As defined by the use of specific medication.
IVH sum score grades the amount of blood in the right and left lateral, third and fourth ventricle (0 = no blood, 1 = sedimentation, 2 = partly filled, 3 = completely filled) by adding each of the four individual ventricle scores (range 0–12).
Neurologic deterioration was defined as an increase from baseline to 24 h of two or more points on the GCS motor score.
Median hematoma volume on admission was 55 ml (IQR, 35–76 ml). Hematoma evacuation combined with hemicraniectomy for ICP control was performed in one patient; in all other patients, the bone flap was reinserted. Preoperative midline-shift (7 mm, IQR, 6–11 mm) significantly decreased postoperatively to 5 mm (IQR, 3–7 mm) (P = 0.002). Postoperative residual hematoma volume was 28 ml (IQR, 15–40 ml). Five patients (19%) died in the hospital.
ECoG monitoring in patients with ICH
Hematoma evacuation and subdural strip electrode placement was performed within the first 24 h in 18 patients (67%). Median time to surgery was 9 h (IQR, 3–49 h) after admission; one patient underwent surgery at day 6 due to secondary clinical deterioration and radiographically confirmed PHE progression. ECoG recordings were started 3 h (IQR, 3–5 h) after surgery. Median monitoring time per patient was 157 h, comprising a total of 4876 h for all 27 patients (median 7 days; IQR, 3–12 days). In one patient, ECoG was performed up to day 20 post ictus. The position of the ECoG—probe was confirmed by CT—scanning which showed that 2 of 6 electrodes (median; IQR, 0–2) were located above the damaged brain tissue.
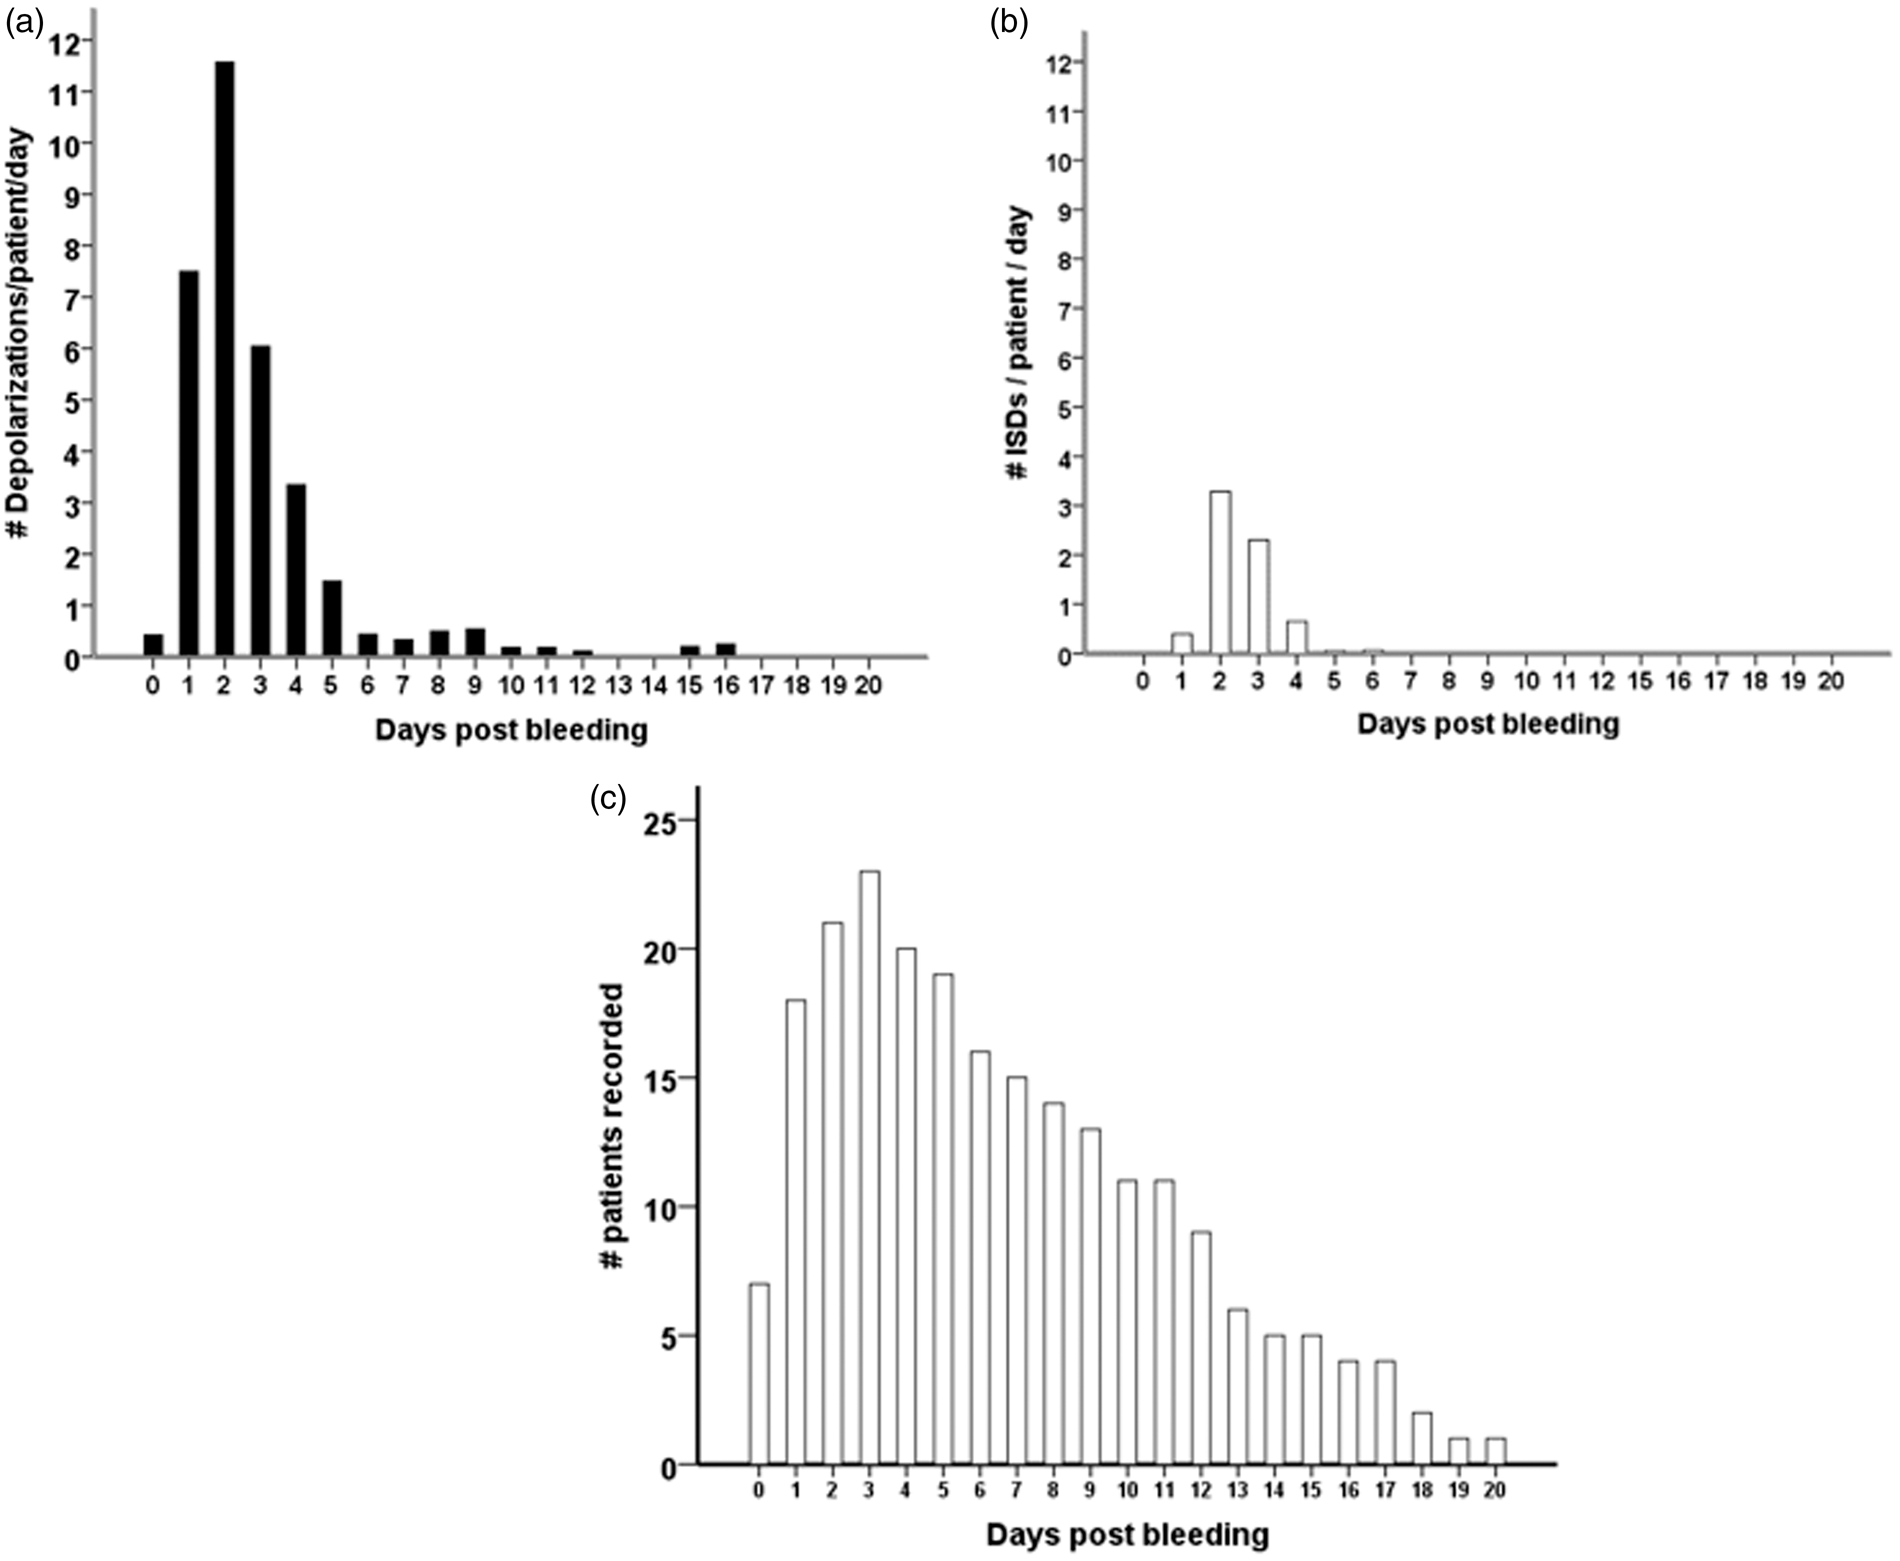
In 18 of the 27 patients (67%), a total of 650 SDs were observed. Of those, 506 (78%) were spreading depressions and 144 (22%) were ISDs. Figure 2 shows ECoG recordings of a representative series of SDs, either ISDs identified solely by repeated stereotyped negative DC shifts (Figure 2(a)) or spreading depressions, additionally identified by the accompanying depression of spontaneous activity (Figure 2(b) and (c)). Figure 3 displays the time course of SDs following primary ICH normalized by the number of patients recorded each day. We found an initial peak at days 2 and 3 with a significant decrease thereafter (P < 0.001); 97% of SDs occurred within the first five days of monitoring. Clusters of SDs were observed in 8/18 patients with SDs (44%) at a median of one day (IQR, 1–2 days) after hemorrhage.
Types of SDs: (a) ECoG indicates clusters of “ISDs” (n = 18 per 5 h) in a patient with significant PHE progression 24 h after hematoma evacuation; (b) Isolated spreading depolarization starting over channel D and spreading to channel A (c) ECoG during 5 h indicates clusters of stereotyped spreading depressions starting at channel D and spreading to channel A. ECoG: electrocorticography; ISD: isoelectric depolarization; SD: spreading depolarization; PHE: perihematomal edema. Incidence of SDs following primary intracerebral hemorrhage (a–c). All patients, with or without SDs, were included in the analysis. The total number of SDs by day was divided by the number of patients recorded in the corresponding time interval in order to obtain mean rates that can be compared across time. Black bars represent the number of all SDs (a). The subgroup of ISDs is shown to the right in white bars (b). Number of patients that underwent recording by day (c). ISD: isoelectric depolarization; SD: spreading depolarization.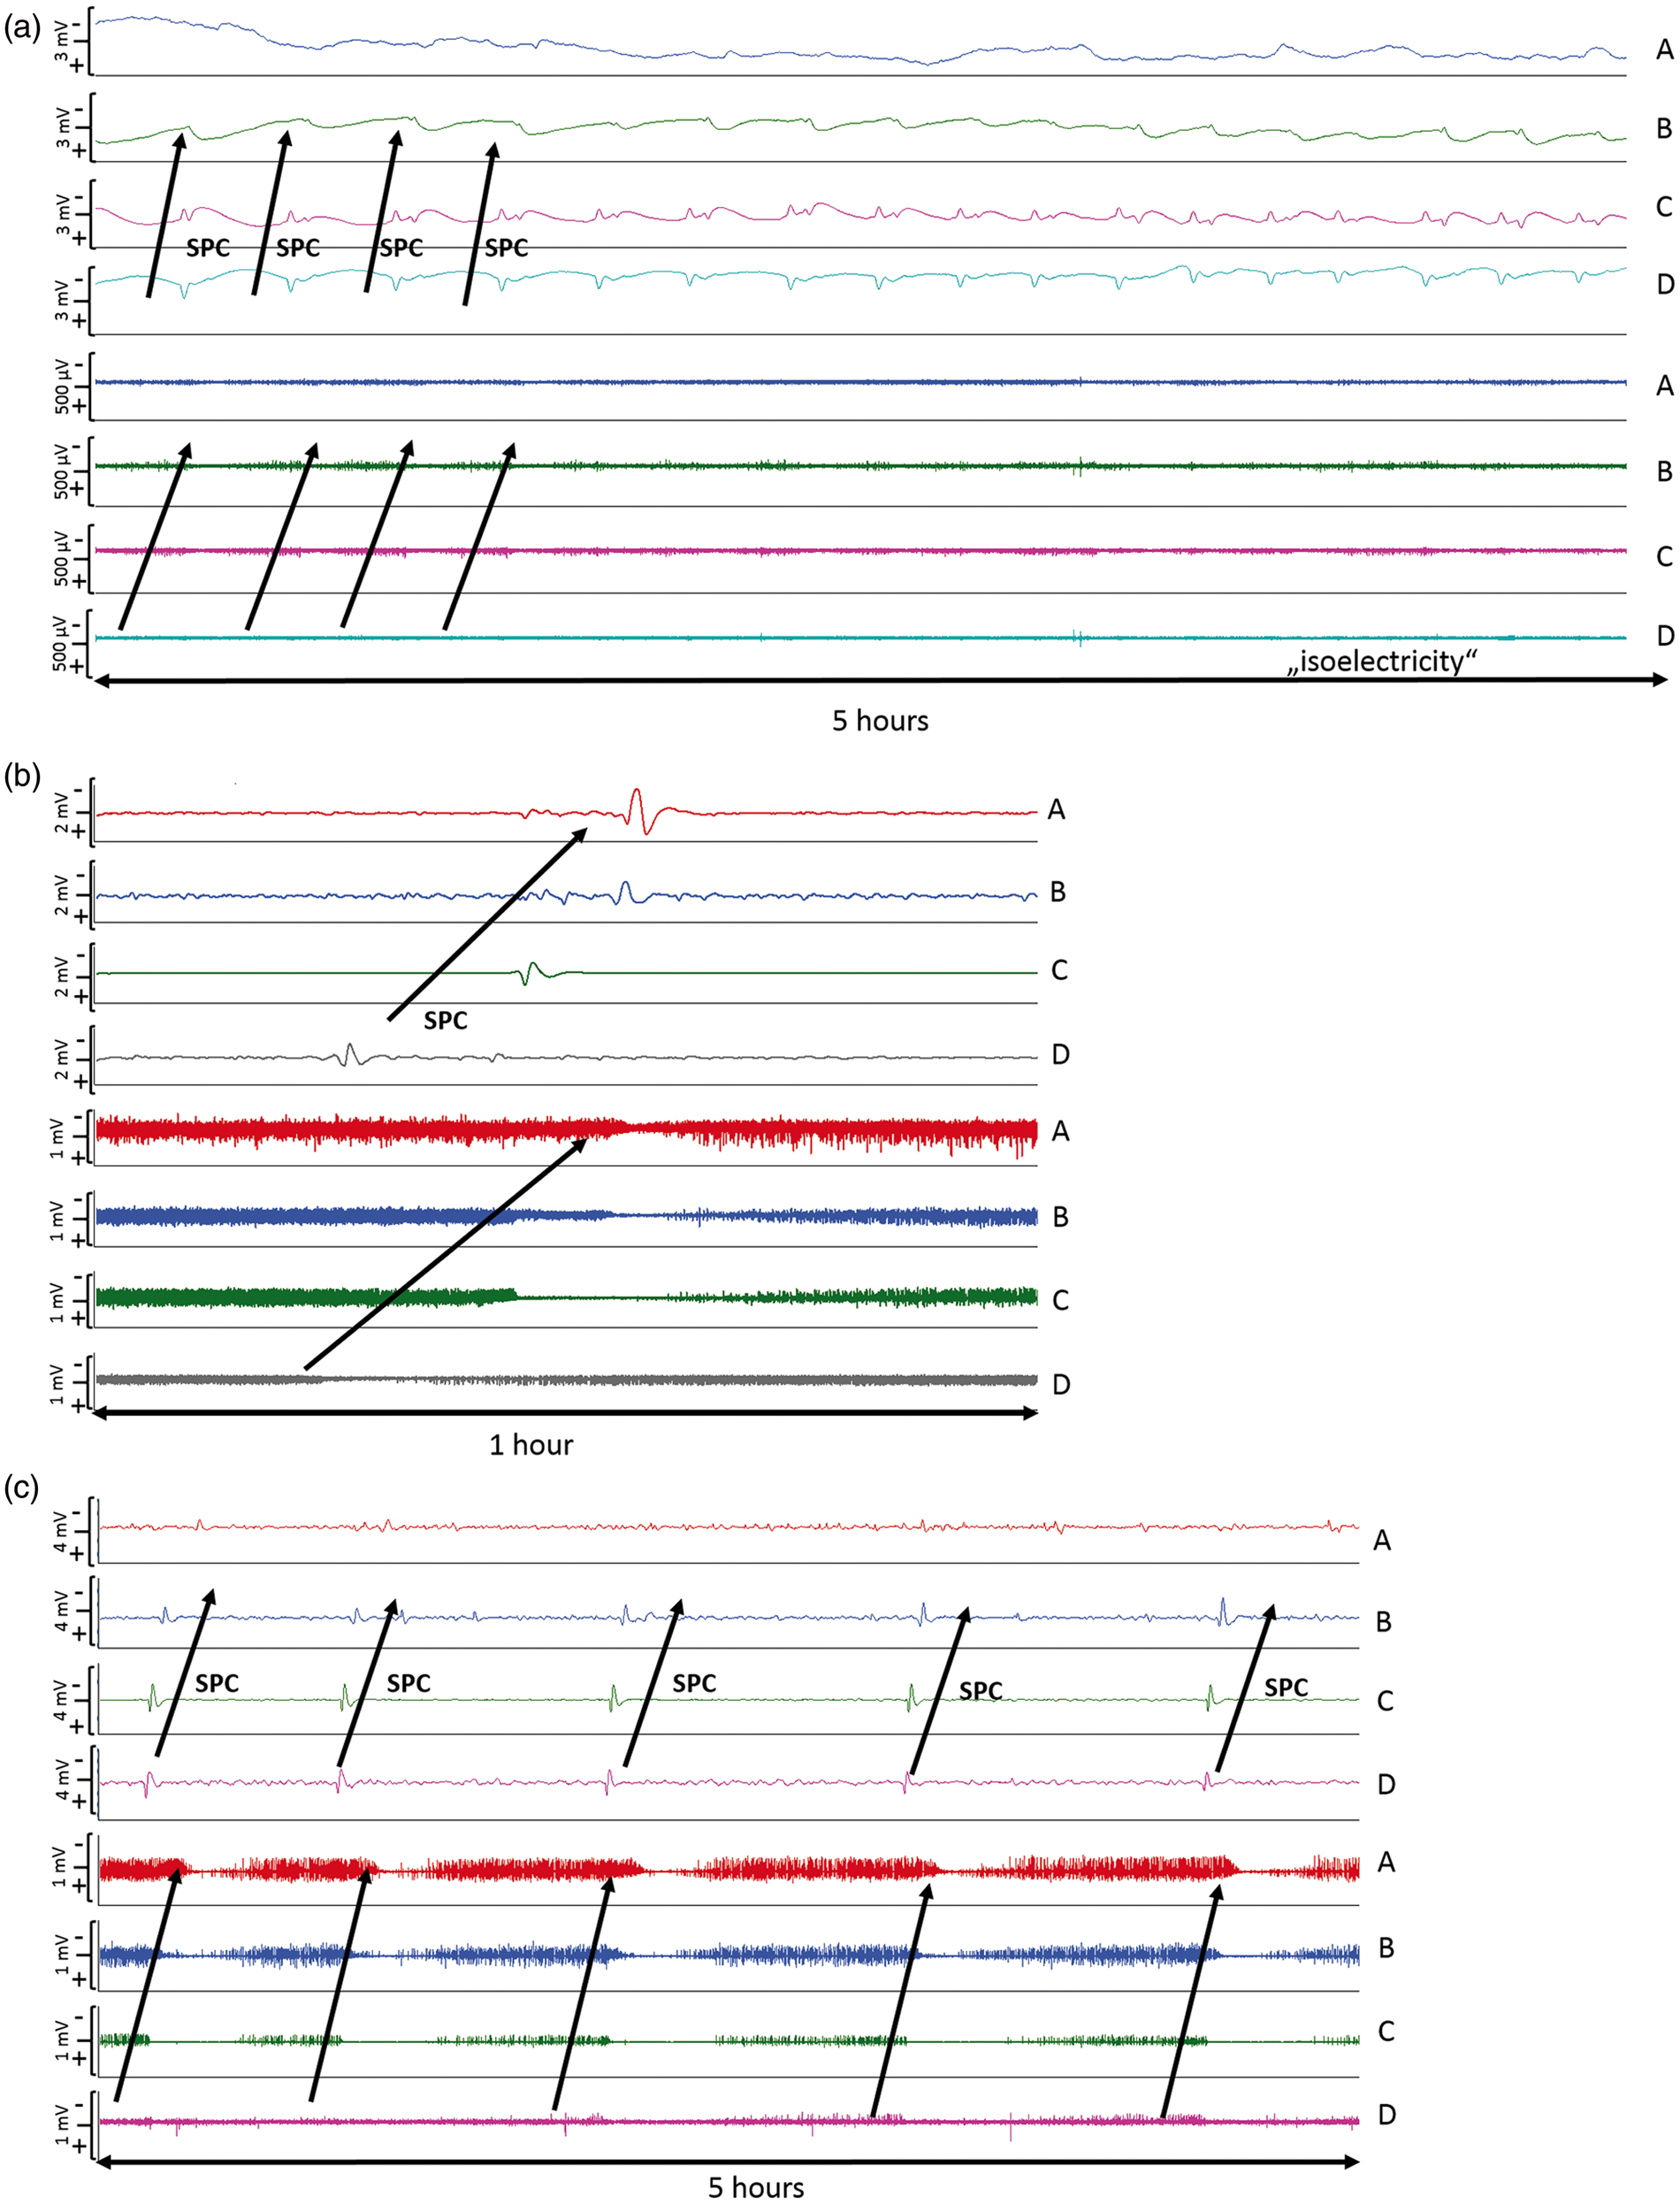
Median propagation velocity of the SDs was 4 mm/min (IQR, 4–5.5 mm/min). Median ECoG depression time was 14.7 min (IQR, 9–22 min; range 1.5–104 min) and a prolonged recovery time (>10 min) was found in 60% of SDs. Daily analysis of ECoG depression time accounting for the number of patients recorded revealed the longest depression of activity on days 5 to 6. The maximum time of depressed cortical activity was 5.5 h/24 h recorded in a patient on day 2 after hemorrhage.
There was no difference in MAP, CPP, ICP and body core temperature during the occurrence of SDs when compared to the hours without SDs (all P > 0.05, respectively), (MAP = 81 mmHg, IQR 77–87 mmHg versus 85 mmHg, IQR 78–92 mmHg; CPP = 73 mmHg, IQR 68–78 mmHg versus 73 mmHg, IQR 67–80 mmHg; ICP: 10 mmHg, IQR 5–15 mmHg versus 10 mmHg, 6–15 mmHg; core temperature 37.3℃, IQR 36.2–37.9℃ versus 37.3℃, IQR 36.9–37.7℃). ISDs were, however, significantly more common during hours of MAP < 77 mmHg (quartiles, Figure 4, P < 0.001).
Percentage of one hour intervals in which episodes of ISD occurred across quartiles of MAP. The multivariable general linear model (GLM) with a logistic link function using GEE showed an independent association between MAP and occurrence of ISDs (P < 0.001). MAP: mean arterial pressure; GEE: general estimated equations; ISD: isoelectric depolarizations.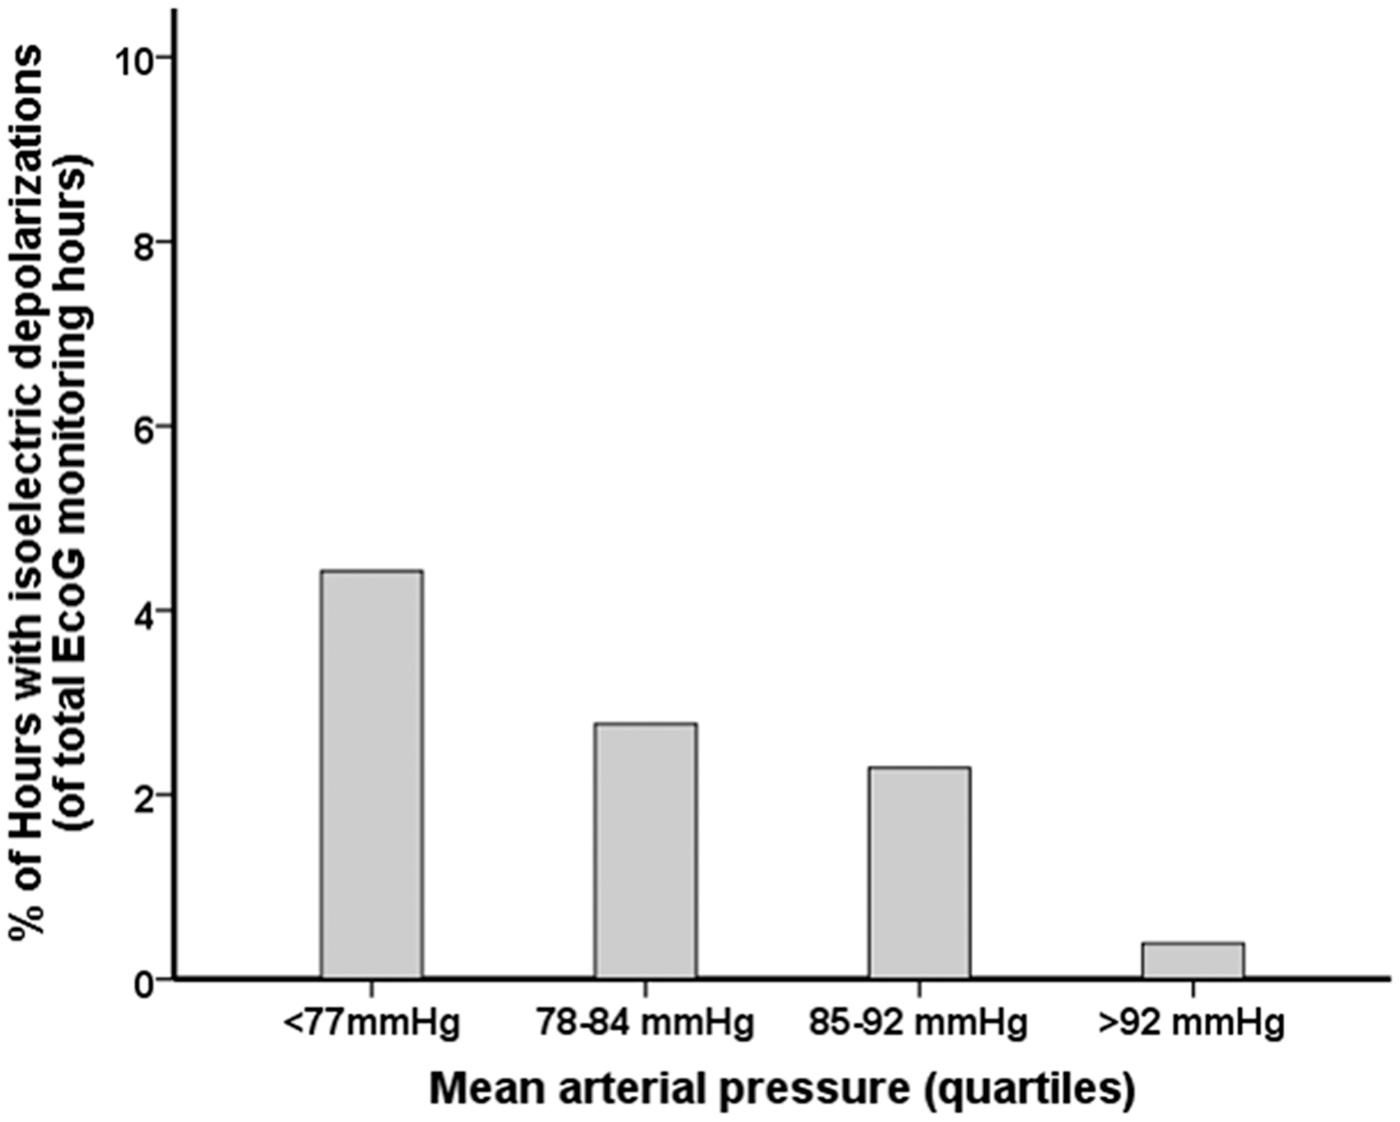
ECoG monitoring and perihematomal edema progression
Postoperative PHE was observed in 85% (22/26) of patients. One patient was excluded from analysis due to missing imaging follow-up. In the patients without significant postoperative PHE progression (N = 4, 15%), 480 h of electrocorticography were analyzed compared to 4326 h in patients with PHE development.
Only three isolated spreading depressions and one ISD were observed in patients without PHE progression on days 4, 5, 6 and 12 post-bleeding, respectively; in patients with PHE progression, spreading depressions and ISDs occurred frequently with a maximum on day 2 (Figure 5). There was no difference in ECoG depression time in SDs occurring in patients with and without PHE progression (P = 0.1). Clustered SDs were only observed in patients with PHE progression.
Time course of SDs following primary intracerebral hemorrhage in patients with (a, black bars, N = 22) and without perihematomal edema progression (b, white bars, N = 4). All patients, including those without depolarizations, were included in the analysis. The total number of depolarizations by day was divided by the number of patients recorded in the corresponding time interval in order to obtain mean rates that can be compared across time. SD: spreading depolarization.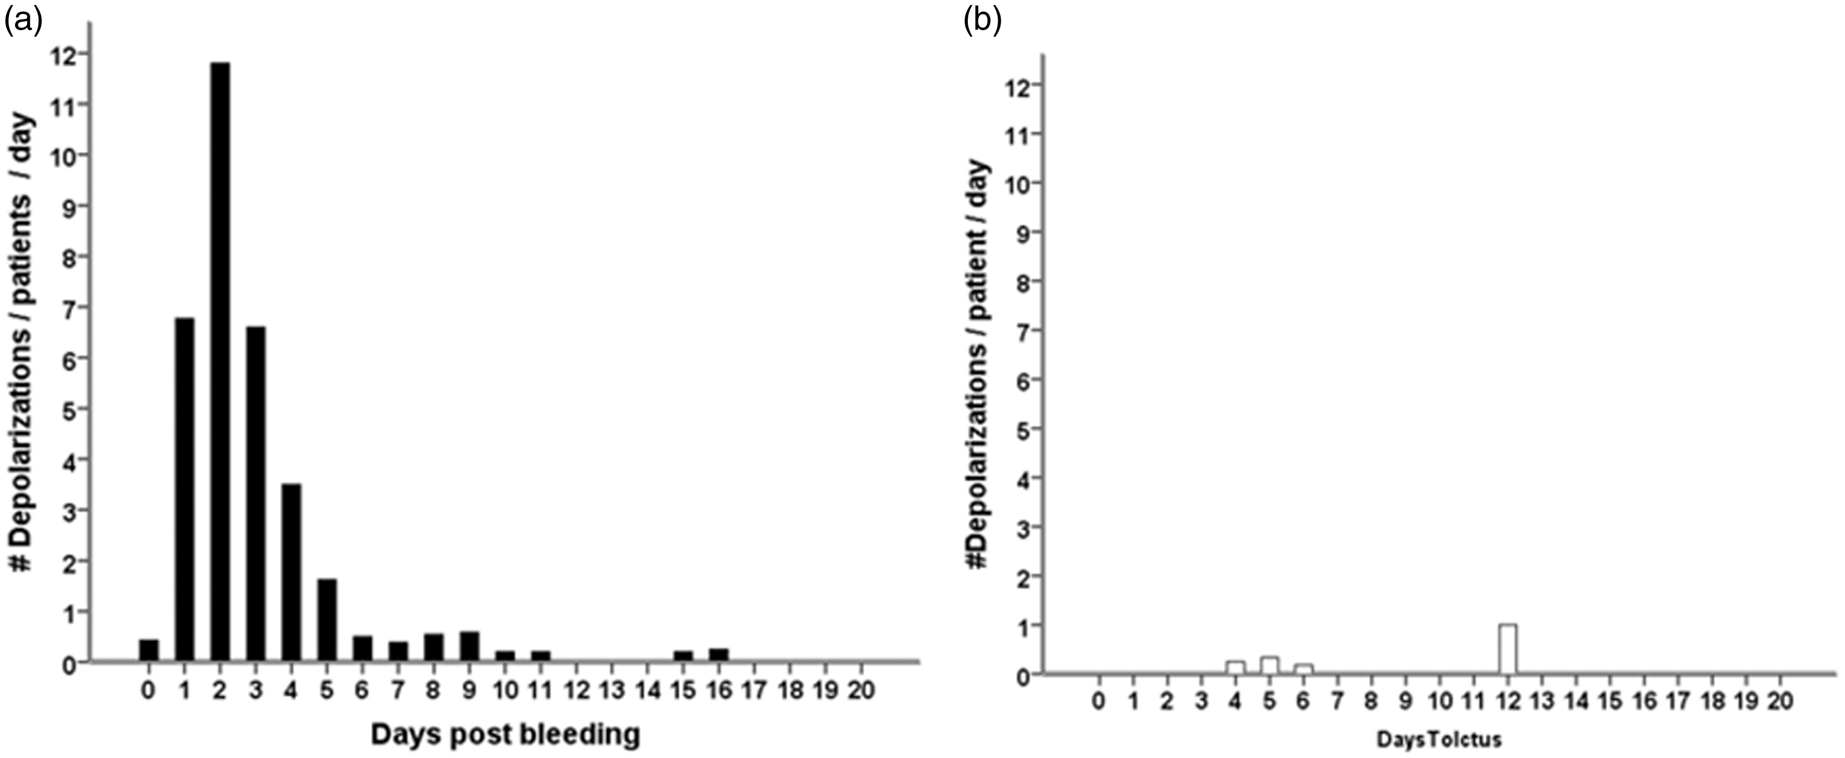
Discussion
Data presented here provide evidence that SDs occur in patients with spontaneous ICH, at least in patients with large size hematoma in whom hematoma evacuation is performed. The SD incidence of 67% was higher than previously reported in ICH patients (∼50%)16,18 and in patients with TBI (54%) 14 and lower compared to patients with SAH (72% and 84%)13,29 and malignant ischemic stroke (100%). 11 A potentially contributing factor that may explain the higher incidence in the current ICH cohort is the large hematoma size of 55 ml (median). Hemorrhage volume is a strong predictor for a complicated and prolonged hospital course and is associated with secondary complications and poor outcome. The association with SDs, however, has so far had little evidence from human data, while experimental studies on ICH in a swine model have tested electrophysiological and ICP changes during SDs.30,31 Even so, a recently published brain microdialysis study in SAH patients found an association between initial hemorrhage load and higher brain extracellular potassium concentrations. 32 Possible mechanisms of increased potassium levels in the brain extracellular fluid include erythrocytolysis, 33 blood–brain barrier breakdown 34 and unspecific membrane breakdown due to parenchyma injury;35–37 these factors may all have been diminished but not eliminated by hematoma evacuation in our patients. Brain extracellular K+ plays a pivotal role in the generation and propagation of SDs which, in a pathological environment, may even contribute to spreading ischemia.38–41 Thus, an increasing hemorrhage volume in ICH may increase the risk of SDs through the extracellular accumulation of K+.
Quantification of daily SDs revealed the highest number on day 2 with a steady decline thereafter. Data were normalized for patients recorded in the calculated time period of one day to account for potential bias. The initial hemorrhage load with a predominance of lobar hematoma (63%) may have contributed to the early peak incidence of SDs. One may also suspect early surgery as a trigger for SDs; however, 33% of patients (6/18) who underwent hematoma evacuation within the first 24 h never developed SDs during a total recording period of 759 h. In patients with severe TBI and aneurysmal SAH, a second delayed peak number of SDs was observed around days 6–7.29,42 This is in contrast to our observation in ICH patients suggesting different pathophysiologic mechanisms in the subacute phase. An association with delayed surgery and elevated ICP was described in TBI patients. Both, SAH patients and to a lesser degree patients with traumatic SAH are at risk for delayed cerebral ischemia (DCI). DCI is not a typical complication of ICH and in all our patients ICP was well controlled.
Most of our patients developed PHE progression, which is associated with a transient reduction of cerebral blood flow. 43 Interestingly, SDs frequently occurred in these patients and were only rarely observed in patients without postoperative PHE enlargement. Recently, we reported a case with significant PHE progression from 70 ml to 128 ml and a time-associated occurrence of clustered SDs. 19 In this patient, edema expansion was confirmed by repeated imaging findings and supported by elevated levels of matrix metalloproteinase-9 in the perihematomal brain tissue. 44 The former assumption of an ischemic tissue damage around the parenchymal bleeding has been replaced by the concept of neurohemoinflammation. 45 This concept derives from experimental ICH models and is based on the “toxicity” of blood driving early metabolic and electrical failure of brain cells: hemoglobin and thrombin trigger a proinflammatory response in perihematomal brain tissue, eventually leading to apoptotic and necrotic cell death.46–48 SDs are distinct cortical events associated with cellular edema and increased metabolism.49,50 Any causality between SDs and PHE progression remains speculative; however, SDs, especially if they occur in clusters, may contribute to changes in the cortical lesion volume. Animal data revealed SDs as a mechanism for neuronal swelling and dendritic beading resulting in cytotoxic edema of the gray matter.51,52 Moreover recurrent spreading depolarizations may facilitate dendritic beading in the ischemic penumbra which is supported by neuroimaging studies reporting a reduction in brain-water apparent diffusion coefficients around the hematoma. 53 SDs may, therefore, initiate or aggravate the development of cytotoxic edema in both, the cortical gray matter and the perihematomal brain tissue of patients with ICH. In rare circumstances, SDs may also produce blood–brain barrier opening and subsequent vasogenic edema via matrix-metalloproteinase-9 activation. 44 There is now paramount of evidence from animal data that SDs represent a crucial mechanism of lesion development after acute brain injury, which has been recently reviewed by Hartings et al. 54 Combining electrophysiological studies with advanced neuroimaging techniques would allow to further elaborate on this pathophysiologic concept of secondary brain injury in patients with primary ICH.
Depression of cortical activity was longer in our patients than previously reported.16,18,26 The duration of cortical depression reflects the ability of the tissue to recover after SDs and thereby the perfusion and metabolic state at the point of measurement. The longer duration of depression after SDs may be due to the inclusion of poor grade patients with large hematoma size and to the invasiveness associated with microsurgery (cortical lesions) performed in our patients. Prolonged ECoG depression time, the transition from spreading depression to ISD and prolonged negative DC shifts indicate worsening of the metabolic status and hemodynamic failure resulting in enlargement of the ischemic penumbra in ischemic stroke. 11 This is also relevant in SAH patients at risk for DCI and in TBI patients with secondary deterioration.15,55 Recurrence of SDs often leads to persistent depression of activity.11,13 These clustered SDs have also been found in malignant stroke and after SAH, where they are associated with secondary ischemic events and metabolic derangement.11,17 After ICH, we found clustered SDs only in patients with PHE progression. Multimodal neuromonitoring studies targeting the cortical area as well as the perihematomal area may help to further elucidate the hypothesis of a causal relationship between CSDs and PHE progression.
It remains elusive how spreading depressions and particularly ISDs may potentially influence brain homeostasis in the perihematomal brain tissue or even aggravate PHE. Cortical arterioles continue into the white matter to provide the main blood supply to this domain. Thus, a cortical steal phenomenon with transient hypoperfusion in the adjacent white matter or an inverse hemodynamic cortical response to SDs aggravating gray matter edema are both conceivable. Moreover, cortical vasoconstriction in response to SDs may also result in hypoperfusion of the adjacent white matter as indicated in a recent study with simultaneous ECoG and white matter near infrared spectroscopy monitoring. 56 Further multimodal neuromonitoring studies targeting the cortical area as well as the perihematomal area are needed to elaborate on these hypotheses.
We did not find an association between the incidence of SDs with hourly averaged MAP, CPP and ICP as previously reported in TBI patients. 42 However, the likelihood of ISDs was four times as high for MAP < 77 mmHg compared to the highest MAP quartile (>92 mmHg) and no association was found with ICP and CPP. The number of episodes with raised ICP (ICP > 20 mmHg) was low (8.4%), and ISDs did not occur during these episodes of ICP crisis. We hypothesize that a MAP of 77 mmHg may be a lower limit for stable CBF maintenance in the postoperative period of ICH patients with PHE progression if autoregulation is preserved. However, autoregulation may fail in a subgroup of patients, particularly those prone to clusters of SDs. Furthermore, in the group of highest MAP quartile, systolic blood pressure was > 160 mmHg, which is higher than recently recommended in the updated guidelines based on the INTERACT 2 trial.3,57 Again, the current guideline recommendations are based on a population of ICH patients with small to median size ICH (median 22 ml), and the optimal MAP may thus be different in our population with larger ICH (median 55 ml) and PHE.
Limitations
So far only patients with large hematoma size eligible for neurosurgical hematoma evacuation were included in this prospective observational trial. The neurosurgical operation per se may have introduced SDs in our cohort leading to an overestimation of the true incidence. Accordingly, the invasive surgical procedures in our cohort limit the generalizability of our results to a non-surgical population with ICH. Hematoma evacuation is currently not generally recommended in ICH patients and may be limited to good grade patients (GCS 9–12) when early intervention (within 8 h) is performed. 2 Surgery was decided by an interdisciplinary team of specialized neurosurgeons and neurointensivists in our patients considering the patient’s age (<60 years, N = 11/27, 40%), and the lobar extension of the hemorrhage (N = 17/27, 63%).
Subdural strip electrode placement was performed in most patients within 24 h. We may have underestimated the true incidence of SDs within the first week in our patient population, as in three patients ECoG monitoring was initiated at days 4, 5 and 7, respectively.
The study was initiated at the NICU in Innsbruck and extended by recruitment of patients at the NICU in Copenhagen within the trial. Treatment differences between sites may have influenced the presented results, although no statistically significant differences were found and all CT-scans were reviewed by an independent neuroradiologist at one site. Furthermore, the inclusion of two centers improves the generalizability of the results.
In certain patients (12/27), we used ketamine as an anesthetic drug. This noncompetitive N-methyl-D-aspartate receptor (NMDAR) antagonist has been shown to suppress SDs in patients with acute brain injury including two patients with ICH.19,58 However, recurrence of SDs has been described after termination of ketamine, 44 and none of our patients received ketamine during the whole neuromonitoring time. Therefore, this may have influenced the number of SDs recorded in these patients but probably not the incidence of SDs in our cohort.
Conclusion and summary
Spreading depressions and ISDs occurred spontaneously with a high frequency in this study of patients with spontaneous ICH after hematoma evacuation. We found a strong association between SDs and PHE progression. The association with episodes of metabolic derangement and ischemic lesions remains speculative and has to be confirmed using invasive and non-invasive neuromonitoring techniques in future studies. 44 Furthermore, the occurrence of SDs is not confirmed in smaller size hematoma and deep location of ICH.
Footnotes
Funding
The author(s) disclosed receipt of the following financial support for the research, authorship, and/or publication of this article: The study was supported by a grant of the Austrian National Bank (OeNB-Nr.: 14082), the NovoNordisk Foundation and the Toyota-Fonden.
Acknowledgements
The authors would like to thank the nursing staff, all physicians of our neurointensive care units in Innsbruck and Copenhagen for their overall support of this study. CKF, MF, JH and KM are members of Copenhagen Neurointensive Care Research Group (CONICA).
Declaration of conflicting interests
The author(s) declared no potential conflicts of interest with respect to the research, authorship, and/or publication of this article.
Authors’ contributions
RH was involved in the acquisition of data, statistical analysis, interpretation of data, study design and writing of the manuscript. AS, CKF and MK were involved in the acquisition and interpretation of data, statistical analysis and final revision of the manuscript. RB, BP, ES, MF and IU were involved in the acquisition of data, study design and in the final revision of the manuscript. PR was involved in blinded analysis of imaging data and in the final revision of the manuscript. CT, MO, JH and KM participated in surgical procedures, interpretation of data and in the final revision of the manuscript. EG, PL and GB participated in interpretation of data and in the final revision of the manuscript. All authors read and approved the final manuscript.