
Abstract
For amyloid positron emission tomography tracers, the simplified reference tissue model derived ratio of influx rate in target relative to reference region (R1) has been shown to serve as a marker of brain perfusion, and, due to the strong coupling between perfusion and metabolism, as a proxy for glucose metabolism. In the present study, 11 prodromal Alzheimer’s disease and nine Alzheimer’s disease dementia patients underwent [18F]THK5317, carbon-11 Pittsburgh Compound-B ([11C]PIB), and 2-deoxy-2-[18F]fluoro-D-glucose ([18F]FDG) positron emission tomography to assess the possible use of early-phase [18F]THK5317 and R1 as proxies for brain perfusion, and thus, for glucose metabolism. Discriminative performance (prodromal vs Alzheimer's disease dementia) of [18F]THK5317 (early-phase SUVr and R1) was compared with that of [11C]PIB (early-phase SUVr and R1) and [18F]FDG. Strong positive correlations were found between [18F]THK5317 (early-phase, R1) and [18F]FDG, particularly in frontal and temporoparietal regions. Differences in correlations between early-phase and R1 ([18F]THK5317 and [11C]PIB) and [18F]FDG, were not statistically significant, nor were differences in area under the curve values in the discriminative analysis. Our findings suggest that early-phase [18F]THK5317 and R1 provide information on brain perfusion, closely related to glucose metabolism. As such, a single positron emission tomography study with [18F]THK5317 may provide information about both tau pathology and brain perfusion in Alzheimer’s disease, with potential clinical applications.
Introduction
Increasing evidence from in vivo and in vitro studies suggests that Alzheimer’s disease (AD) begins with the deposition of amyloid-β (Aβ), leading to downstream neurodegenerative changes, including tau hyperphosphorylation. Widely applied to imaging fibrillary Aβ, the success of amyloid positron emission tomography (PET) with carbon-11 Pittsburgh Compound-B ([11C]PIB) and fluorinated alternatives such as [18F]florbetapir and [18F]flutemetamol have led to worldwide efforts aimed at the development of selective tau PET tracers. 1 These efforts have resulted in several promising candidate compounds now in clinical studies, including the second-generation quinolone derivative [18F]THK5317, previously known as (S)-[18F]THK5117. 2
In addition to providing a measure of Aβ plaque pathology, there is evidence to suggest that the early-phase of dynamic [11C]PIB PET can capture additional information closely related to cerebral glucose metabolism, comparable with that obtained using 2-deoxy-2-[18F]fluoro-D-glucose ([18F]FDG) PET.3–8 By using the unidirectional influx constant (K1) and early time-frame [11C]PIB uptake values—measures shown to correlate with cerebral blood flow (CBF)—regional metabolism was estimated due to the strong coupling between perfusion and glucose metabolism. 9 Further, using both [11C]PIB and [18F]florbetapir, dynamic PET data fitted using the simplified reference tissue model (SRTM) 10 to obtain R1—the ratio of K1 in target and reference tissue—has been found to serve as a reliable measure of relative brain perfusion.6,11 Approaches incorporating these measurements may decrease the need for dual-tracer (e.g. [11C]PIB and [18F]FDG) PET studies, resulting in decreased costs, patient discomfort, and radiation exposure. To date, however, no studies have examined whether the early-phase standardised uptake value ratio (SUVr) or SRTM R1 of [18F]THK5317 can provide perfusion information, and thus, a measure comparable with regional cerebral glucose metabolism.
The overarching aim of the present study was to thus explore the possible use of [18F]THK5317 early-phase SUVr and R1 as proxies for brain perfusion in AD, and to compare these measures with glucose metabolism as measured using [18F]FDG PET. To this end, we compared early-phase [18F]THK5317 SUVr images and R1 estimates with [18F]FDG SUVr, both within regions of interest (ROIs), and at the voxel level. In addition, with dual PET imaging of tau and amyloid being an increasingly likely prospect in the years to come, we compared [18F]THK5317 and [11C]PIB (early-phase SUVr and R1) with respect to their correlational strength to [18F]FDG SUVr. The classification accuracy of these parameters, in terms of their ability to discriminate between prodromal and AD dementia patient groups, was likewise investigated.
Materials and methods
Study population
Data from 11 mild cognitive impairment (MCI), and nine AD patients were used in the present investigation. All were recruited at the Department of Geriatric Medicine, Karolinska University Hospital Huddinge, Stockholm, Sweden, as part of another multitracer PET study. 12 All patients underwent a comprehensive routine assessment procedure, including a physical examination, evaluation of neurological and psychiatric status, apolipoprotein E (ApoE) genotyping from blood sample, serum and urine analysis, structural magnetic resonance imaging (MRI), cerebrospinal fluid sampling, and neuropsychological assessment.
Patients with AD fulfilled the NINCDS-ADRDA criteria for probable AD, 13 and MCI was diagnosed according to the Petersen criteria.14,15 In all cases, diagnosis was reached via a consensus based committee approach, which included neurologists, clinical neuropsychologists, and specialist nurses. MCI patients were considered as prodromal AD on the basis of episodic memory loss and positive [11C]PIB PET findings. 16
All patients provided written informed consent to participate in the present study, which was conducted according to the Declaration of Helsinki and subsequent revisions. Ethical approval was obtained from the Regional Human Ethics Committee of Stockholm and the Faculty of Medicine and Radiation Hazard Ethics Committee of Uppsala University Hospital, Uppsala, Sweden.
Image acquisition
[18F]THK5317 and [11C]PIB PET scans were performed at the Uppsala PET Centre, Uppsala, Sweden, on an ECAT EXACT HR+ (Siemens/CTI, Knoxville, TN) or a Discovery ST PET/CT scanner (GE Medical Systems, Milwaukee, WI). The orbitomeatal line was used to centre the head of the participants, with PET data acquired in 3D mode, yielding a 155 mm field of view. Both tracers were synthesised according to standard good manufacturing processes, as previously described,17,18 with [18F]THK5317 selected over the racemic mixture due to reports of lower non-specific binding and faster kinetics with the (S)-enantiomeric form (Victor Villemagne, unpublished data), similar to that shown for two other tau tracers of the same family.19,20
The dynamic [18F]THK5317 PET acquisition consisted of 22 frames acquired over 60 min (6 × 10 s, 3 ×20 s, 2 × 30 s, 2 × 60 s, 2 × 150 s, 4 × 300 s, and 3 × 600 s frames) after intravenous injection of 211 ± 41 MBq. The dynamic [11C]PIB PET acquisition consisted of 24 frames acquired over 60 min (4 × 30 s, 9 × 60 s, 3 × 180 s, and 8 × 300 s) after intravenous injection of 253 ± 69 MBq. Images were reconstructed using normalisation- and attenuation-weighted ordered subset expectation maximisation (NAW-OSEM; six iterations, eight subsets) applying all appropriate corrections and a 4 mm Hanning post-filter.
[18F]FDG PET studies were performed as part of routine clinical practice at the Department of Nuclear Medicine, Karolinska University Hospital Huddinge, Stockholm, Sweden, using a Biograph mCT PET/CT scanner (Siemens/CTI, Knoxville, TN). The imaging protocol consisted of a 15 min static acquisition performed 30 min after an intravenous bolus injection of 3 MBq/kg. All patients underwent a T1-weighted MRI scan, which was used for segmentation and ROI definition.
Image processing
The dynamic PET data for [18F]THK5317 and [11C]PIB were realigned to correct for inter-frame patient movement using the software VOIager (v.4.0.7, GE Healthcare, Uppsala, Sweden). Individual dynamic [18F]THK5317 and [11C]PIB PET scans were co-registered onto the individual T1-weighted MRI using PMOD image registration and fusion tool (PFUS) (v.3.5, PMOD Technologies Ltd., Adliswil, Switzerland). The MRI of each patient was classified into gray matter (GM), white matter (WM), and cerebrospinal fluid (CSF) using the unified segmentation algorithm of SPM8. An inclusive binary GM mask was then created by applying a threshold of 0.3 to the resultant probabilistic GM maps (0, no tissue; 1, tissue with >30% probability of belonging to GM).
As part of the segmentation algorithm, an inverse nonlinear transform parameter file was generated, enabling transformation of data from Montreal Neurological Institute (MNI) space back into each individual’s native T1 image space. This was used to spatially warp a probabilistic atlas21—comprising 49 regions—back into native T1 space for each subject. These atlases were then multiplied by their corresponding GM masks, yielding subject-specific GM ROIs. Subsequently, ROIs were grouped—using a weighted average approach incorporating the number of voxels per ROI—into frontal (superior, middle, inferior frontal gyri), medial temporal (hippocampus, parahippocampus, lingual, and fusiform gyri), lateral temporal (superior, middle, inferior temporal gyri), posterior cingulate, parietal (upper and lower lateral remainders), occipital (lateral remainder, cuneus), and global cortical composite regions.
PET quantification
Using individual GM atlases, regional time-activity curves (TACs) were extracted from dynamic [18F]THK5317 and [11C]PIB PET data by applying the PMOD Kinetic Modelling Tool (PKIN). [18F]THK5317 R1 and [11C]PIB R1 were calculated using SRTM, 10 with cerebellar GM as reference region, using PMOD. Voxelwise R1 maps were also created using the PMOD Pixelwise Modelling Tool (PXMOD). [11C]PIB and [18F]FDG SUVr maps were calculated by normalising 40–60 min [11C]PIB and 30–45 min [18F]FDG images (previously co-registered onto the individual T1-weighted MR images) to mean cerebellar GM activity, respectively, using SPM8. Individualised ROIs from the preceding atlas-creation step were then applied to SUVr maps to extract regional values. All patients were classified as [11C]PIB positive using a composite neocortical SUVr and a cutoff of >1.41 derived from a previously characterised population of normally distributed healthy controls. 22
Selection of [18F]THK5317 and [11C]PIB early-phase intervals
Data from the early-phase of [18F]THK5317 were generated by frame time-weighted averaging, using a range of initial time points (T0 = 0, 1, and 2 min) and frame durations (1–10 min). Early-phase SUVr values were subsequently calculated for each time period by normalising to activity within the cerebellar cortex over the corresponding interval. Using nine randomly selected patients (four prodromal AD and five AD), intra-subject correlations (Pearson’s r) between early-phase [18F]THK5317 and [18F]FDG SUVr—as well as between early-phase [18F]THK5317 SUVr and [18F]THK5317 R1—were calculated across all ROIs from the above described atlas. The optimum early-frame interval was then determined as that corresponding to the maximum average correlation coefficient between early-phase [18F]THK5317 and R1, among all intervals investigated. 5 Regional early-phase [18F]THK5317 SUVr values were subsequently computed across all subjects using this optimised interval and selected for the remaining analyses. An optimal time window of 1–8 min was adopted for [11C]PIB on the basis of previous findings showing high correlations between early-phase SUVr, K1, and [18F]FDG SUVr. 5
Relationship between early-phase [18F]THK5317, early-phase [11C]PIB and [18F]FDG SUVr
To test the assumption that R1 and early-phase [18F]THK5317 SUVr can provide indirect measures of regional glucose metabolism, ROI based and voxelwise correlation analyses between these parameters and [18F]FDG SUVr were conducted. In a second step, early-phase [18F]THK5317 and early-phase [11C]PIB were correlated. To compare the potential of both [18F]THK5317 and [11C]PIB early-phase measures to serve as proxies for glucose metabolism, both were compared with [18F]FDG SUVr at regional and voxel levels, using Pearson's r.
Voxelwise analyses methods
Voxelwise R1, early-phase SUVr, and [18F]FDG SUVr maps were used to perform voxelwise correlations, both uncorrected and corrected for multiple comparisons, using the Biological Parametric Mapping software package (BPM; Matlab, v.3.3) 23 in two-by-two comparisons. All PET images were first registered into the MNI space, smoothed by an 8-mm FWHM Gaussian filter, and masked using an apriori GM mask. BPM correlation maps were thresholded at p < 0.001 (uncorrected, with cluster extent k ≥ 20 voxels), and then corrected for multiple comparisons using a family-wise error (FWE) rate Bonferroni correction (p < 0.05). Resulting correlation maps (uncorrected and FWE corrected) were projected onto a group average surface using the cortical parcellation of FreeSurfer, v.5.3 (https://surfer.nmr.mgh.harvard.edu/).
Statistical analysis
All statistical analyses were performed in R (v.3.1.2, The R Foundation for Statistical Computing, Vienna, Austria), with an uncorrected p value of < 0.05 used to indicate statistical significance. Patient characteristics were compared using Mann–Whitney U and chi-square tests. Pearson’s product moment correlation analyses between outcome measures were conducted on a region-by-region basis across all subjects. All ROI based correlations were corrected for multiple-comparison using the Bonferroni method. To compare the discriminative power of [18F]THK5317/[11C]PIB R1, early-phase [18F]THK5317/[11C]PIB SUVr, and [18F]FDG—with respect to the separation of prodromal and AD dementia groups—receiver operating characteristic (ROC) analyses were performed with ROI based values to generate area under the curve (AUC) values for each ROI. Bootstrapping with 2000 resampling iterations was then used to compare AUC calculations on a two-by-two basis, using the R package pROC (v.1.8). 24 To test whether the difference between correlations for [18F]THK5317/[11C]PIB R1 and early-phase [18F]THK5317/[11C]PIB SUVr vs [18F]FDG SUVr was significant, Williams’ modification of Hotelling’s t-test was performed, using the R package cocor (v.1.1-1). 25
Results
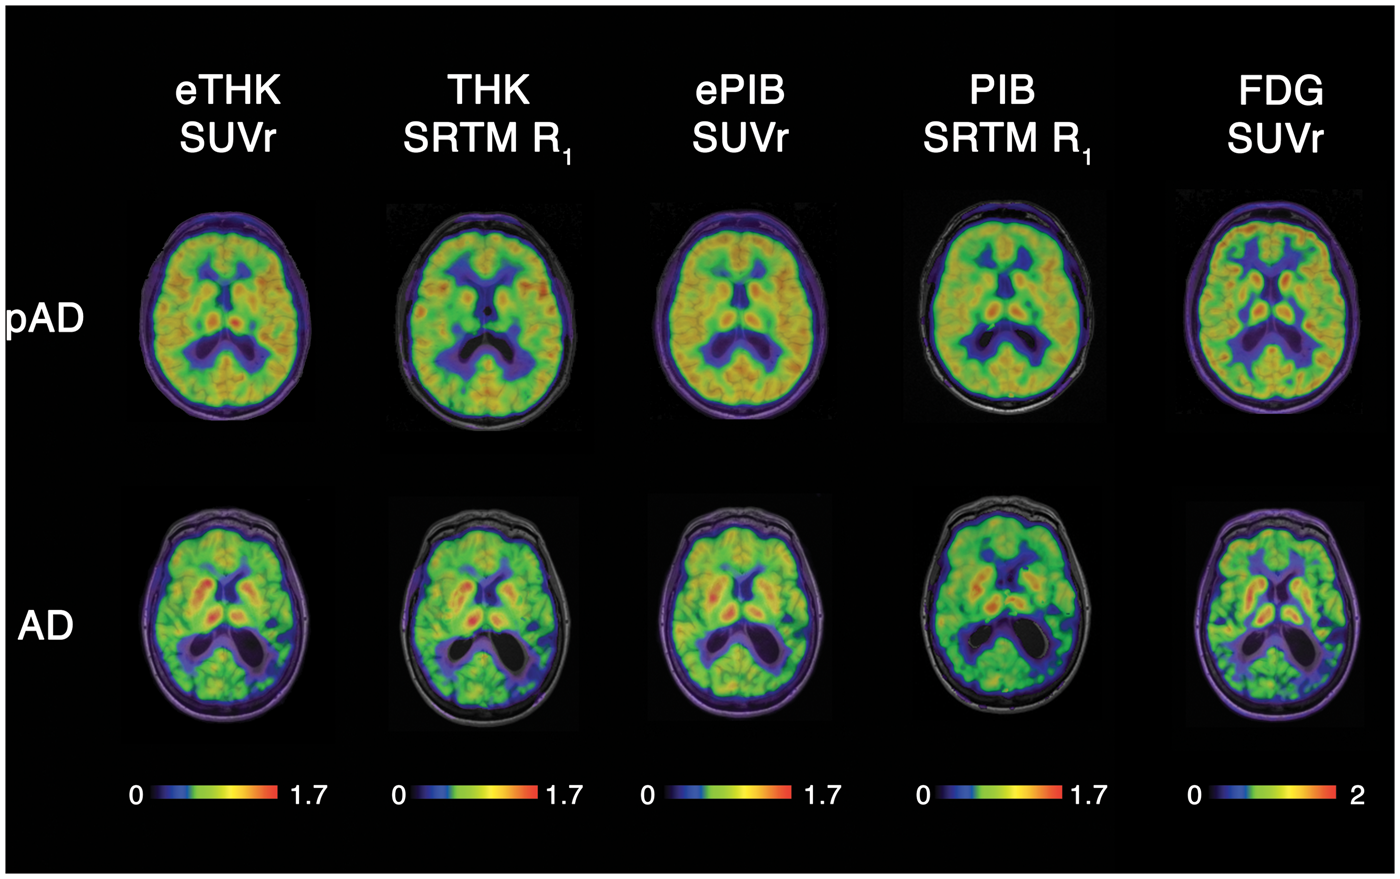
Demographic and clinical data for prodromal and AD dementia groups are displayed in Supplementary Table 1. No group differences were found with respect to age, sex, or percent carriage of the ApoE ɛ4 allele. MMSE scores were lower in the AD dementia group (p < 0.05). Figure 1 shows the results of within-subject correlation analyses in the test subset of nine patients, between early-phase [18F]THK5317 SUVr and both [18F]THK5317 R1 and [18F]FDG SUVr, across the various time intervals investigated. The period 0–3 min (frames 1–11) was found to be the interval where [18F]THK5317 SUVr had the highest correlations (mean ± SD Pearson’s r of test group) with both R1 (r = 0.995 ± 0.002) and [18F]FDG (r = 0.811 ±0.051). Representative images for the optimum 0–3 min early-phase [18F]THK5317, 1–8 min early-phase [11C]PIB SUVr, [18F]THK5317 R1, [11C]PIB R1, and [18F]FDG are shown in Figure 2.
Optimisation plots showing the correlation between early-phase [18F]THK5317 (eTHK) and [18F]THK5317 SRTM R1 (R1; open circles), and between eTHK and [18F]FDG (FDG; half-filled squares), across different frame start times and durations. The ordinate shows correlation coefficients while the abscissa shows duration of data acquisition. The star label in the leftmost panel indicates the highest correlation achieved between eTHK and R1. Axial views of representative [18F]THK5317 early-phase SUVr and R1 (eTHK SUVr and THK SRTM R1, respectively), [11C]PIB early-phase SUVr and R1 (ePIB SUVr and PIB SRTM R1, respectively), and [18F]FDG (FDG SUVr) PET images in a patient with prodromal AD (pAD, top row) and in a patient with AD dementia (bottom row).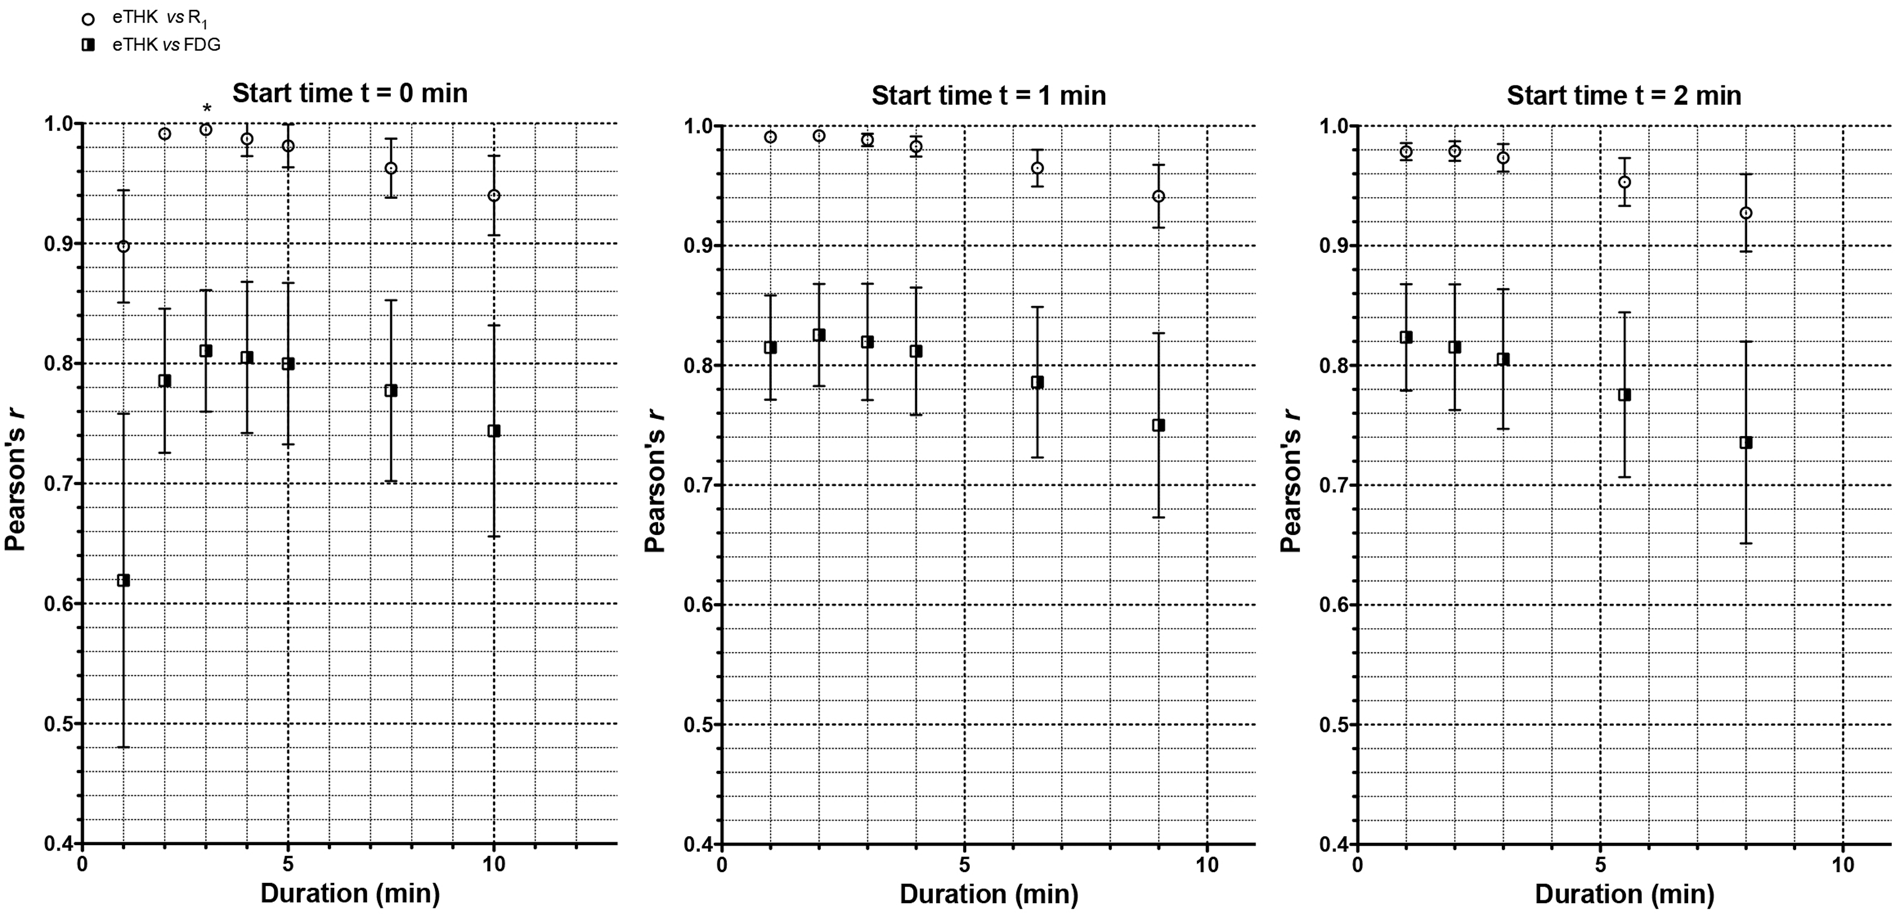
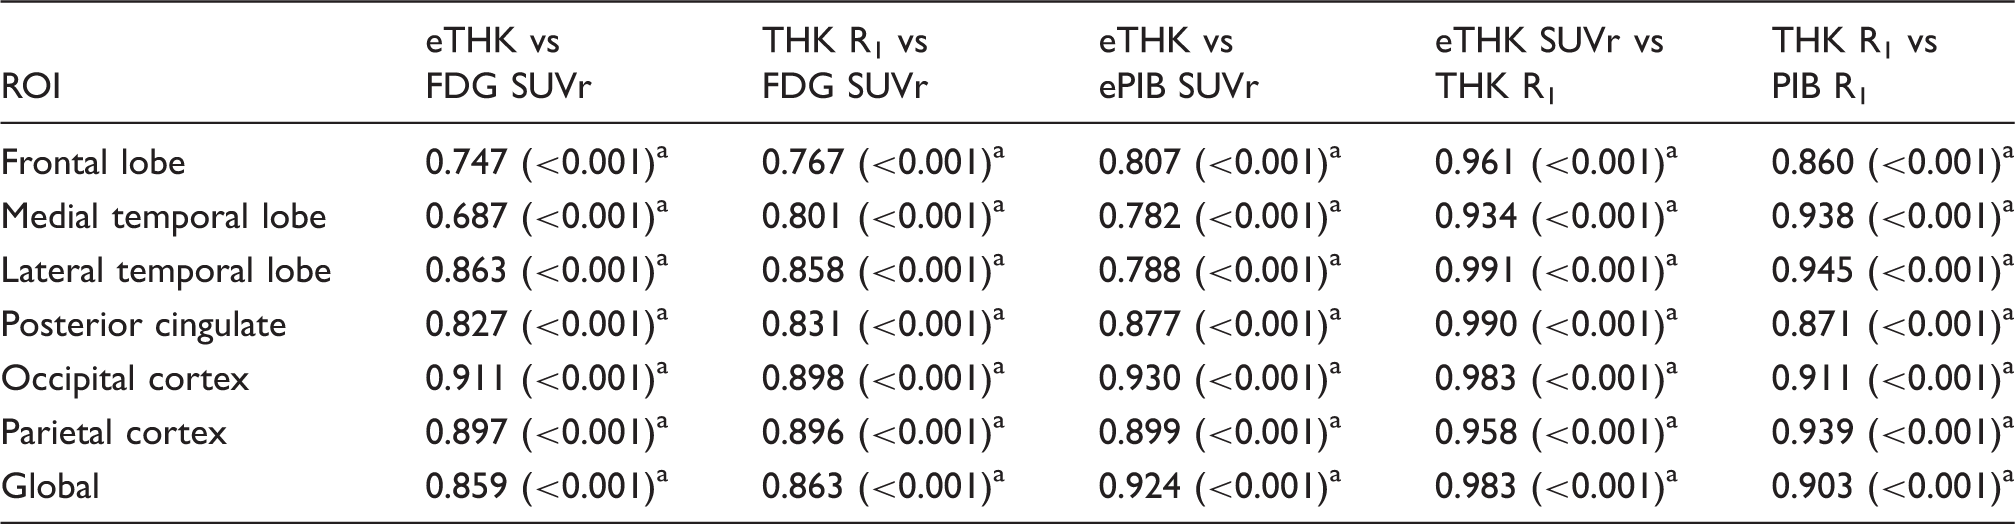
After identification of this optimal early-phase interval, correlation analysis was repeated across all 20 subjects. Significant positive correlations were found for both [18F]THK5317 R1 vs [18F]FDG SUVr, and for early (0–3 min) [18F]THK5317 SUVr vs [18F]FDG SUVr across all regions analysed, with the strongest correlations observed in the parietal, lateral temporal, and occipital cortices (Table 1). Representative regression plots are shown in Figure 3. Significant positive correlations between early-phase [18F]THK5317 SUVr and R1 neared 1 across all regions analysed, with all regions retaining significance following multiple comparison correction. Strong correlations were observed between early-phase [18F]THK5317 and early-phase [11C]PIB SUVr across all ROIs.
Linear regression scatter plots showing the relationship between early-phase [18F]THK5317 SUVr (eTHK SUVr) and [18F]THK5317 SRTM R1 (top row) and between eTHK SUVr and [18F]FDG SUVr (bottom row), across frontal, posterior cingulate, and parietal ROIs. In addition to the best-fit linear regression lines, shaded 95% confidence bands are shown. ROI based Pearson's correlation coefficients for pairwise comparisons among [18F]THK5317 (R1, optimised early SUVr), [11C]PIB (R1, optimised early SUVr), and [18F]FDG. Data in parentheses are p values. Statistically significant correlations, FWE Bonferroni adjusted. Global: global cortical composite.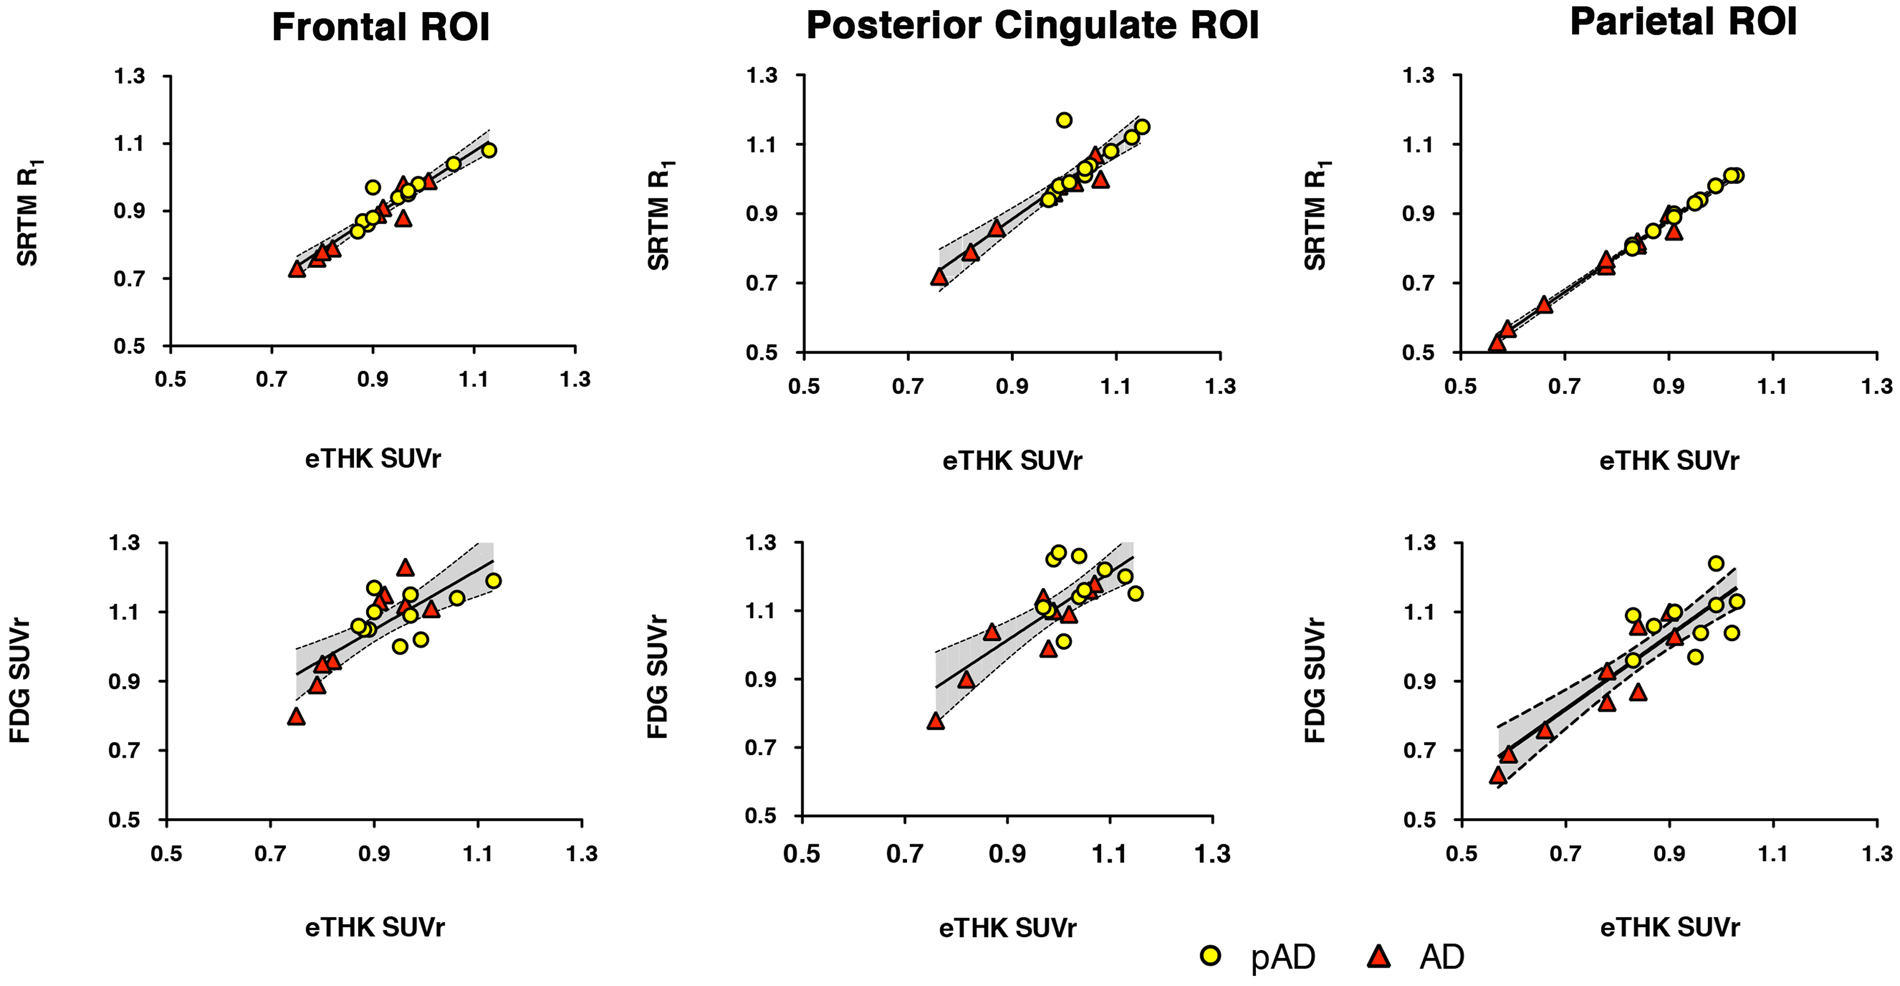
Voxelwise correlation analysis showed widespread positive associations between early-phase [18F]THK5317 SUVr and [18F]FDG within the dorsolateral prefrontal cortex, primary sensory-motor strips, parietal and temporal cortices, as well as the temporoparietal carrefour and frontotemporal oppercula (Figure 4(a)). Medially, correlations were observed in the parahippocampal and fusiform gyri, cuneus/precuneus, and paracentral lobule, as well as in the dorsomedial prefrontal cortex, and cingulate gyri. A similar pattern was observed for [18F]THK5317 R1 vs [18F]FDG—though with greater involvement of the cuneus, inferior temporal gyri, and anterior cingulate (Figure 4(c)). Early-phase [18F]THK5317 and [18F]THK5317 R1 were found to correlate positively across most cortical regions (Figure 4(e)). Few findings—in terms of percentage of ROIs—however, survived FWE correction for multiple comparisons: 33% (early [18F]THK5317 SUVr vs [18F]FDG, Figure 4(b)), 20% (R1 vs [18F]FDG, Figure 4(d)), and 63% (early-phase [18F]THK5317 vs [18F]THK5317 R1, Figure 4(f)). Surviving results were located primarily in frontal and temporoparietal regions. Cluster extents and within cluster maxima (uncorrected and FWE corrected) are reported in Supplementary Tables 2–4. No negative correlations were observed between outcome measures.
Biological Parametric Mapping derived voxelwise Pearson's correlation maps (n = 20; top row, uncorrected with cluster extent k ≥ 20 voxels, p < 0.001; bottom row, corrected for multiple comparisons using FWE, p < 0.05) showing (a,b) early-phase [18F]THK5317 vs [18F]FDG, (c,d) [18F]THK5317 R1 vs [18F]FDG, and (e,f) early-phase [18F]THK5317 vs [18F]THK5317 R1.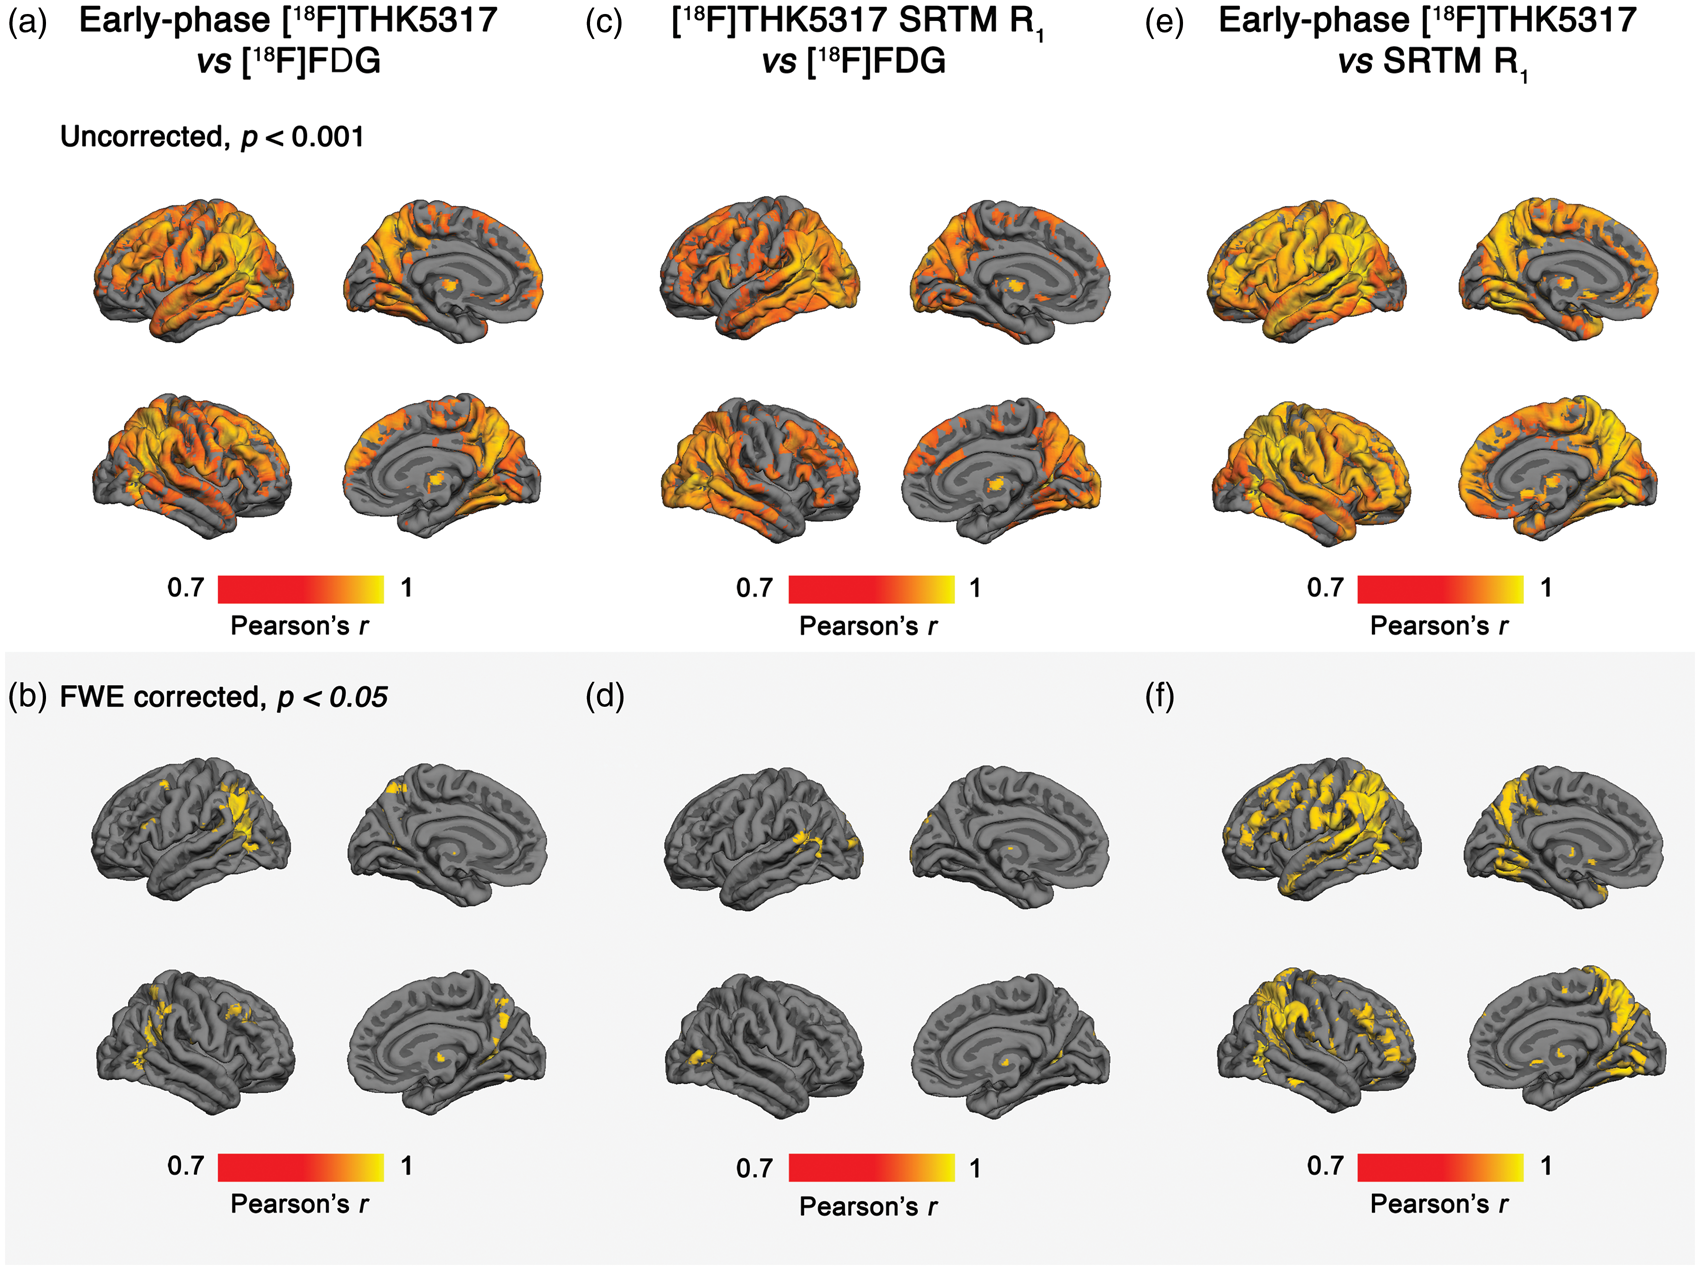
Discriminative ability of [18F]THK5317 (early-phase SUVr, R1), [11C]PIB (early-phase SUVr, R1), and [18F]FDG PET.
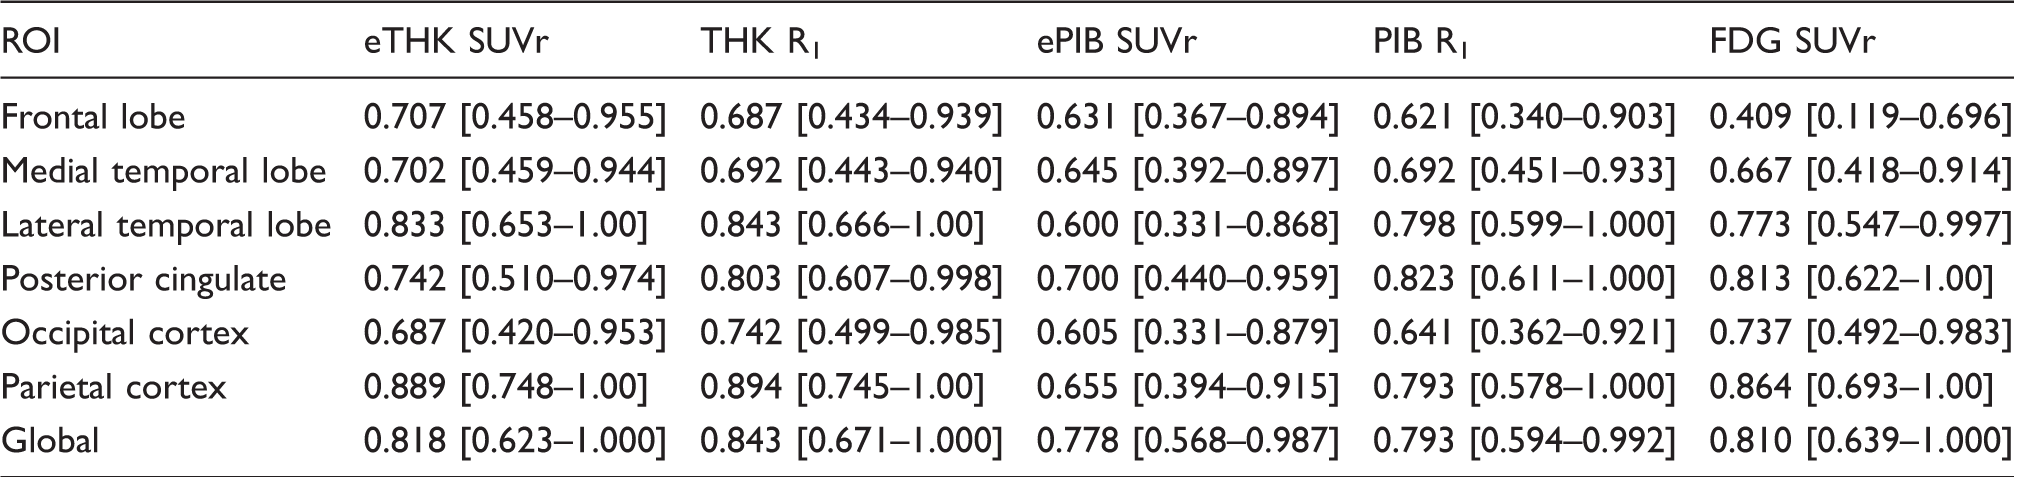
Results are presented as ROC AUC values [95% confidence intervals].
Global: global cortical composite.
Comparison of ROI based Pearson's correlation coefficients for [18F]THK5317 (early-phase SUVr, R1)/[11C]PIB (early-phase SUVr, R1) vs [18F]FDG PET.
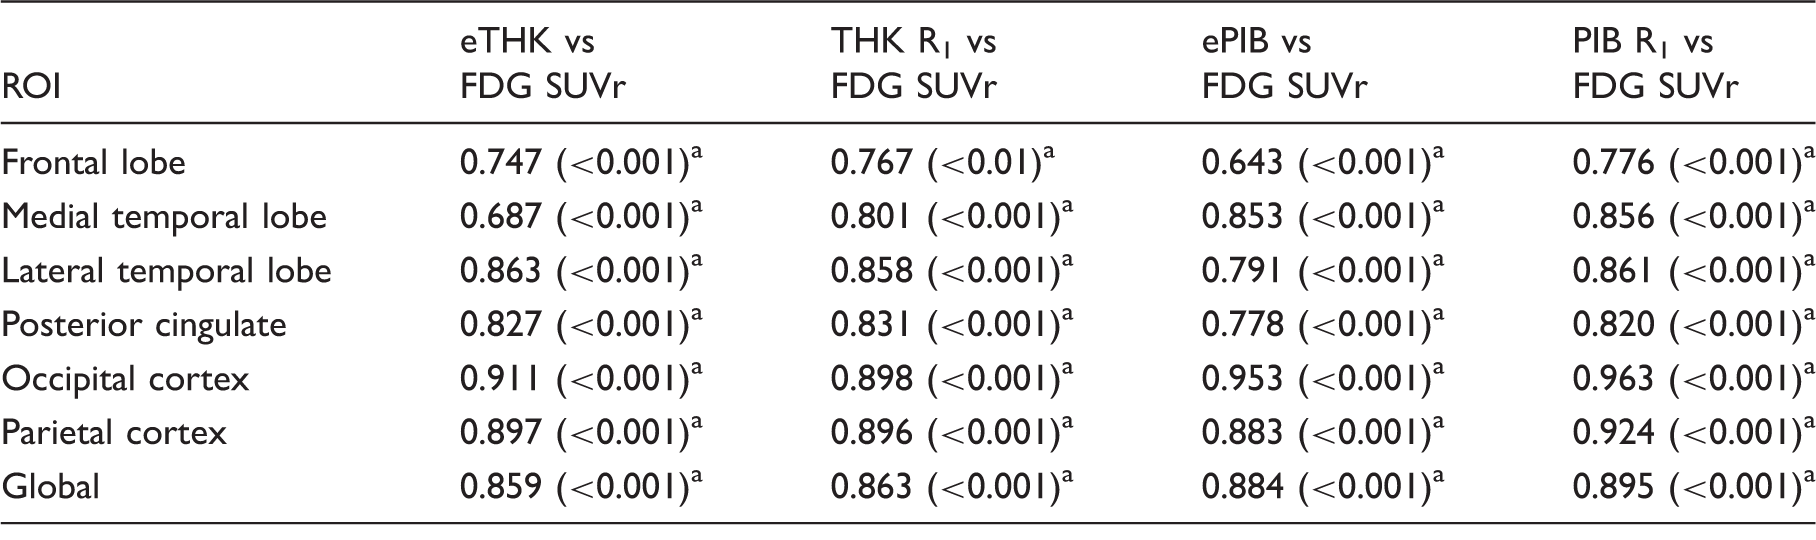
Data in parentheses are p values.
Statistically significant correlations, FWE Bonferroni adjusted.
Global: global cortical composite.
Discussion
The present study showed for the first time that [18F]THK5317 blood flow indices (early-phase SUVr and R1) correlate strongly with [18F]FDG SUVr. These results held at both the regional and voxel level. Overall, no significant differences in the discriminatory ability of investigated parameters were found. Secondarily, head-to-head comparison between early-phase SUVr or R1 of [18F]THK5317 and [11C]PIB, in terms of correlational strength to [18F]FDG, showed no differences.
Although the interval between time 0 and 3 min was chosen as the optimal early-phase for [18F]THK5317 in the present study, given that it provided the greatest correlation with R1, similarly high correlations were obtained when extending a minute on either side of the selected upper limit (0–2 or 0–4 min). Starting at the time of injection, however, ensured capture of the initial phase of tracer influx up to the time of peak concentration, tmax, which occurred within 2 to 3 min of tracer administration. On the basis of our findings, starting at 1 or 2 min post injection would likewise prove suitable; as such, the period used for the creation of the [18F]THK5317 early-phase SUVr image could be determined locally as a function of preference.
Visual inspection of representative early-phase [18F]THK5317, early-phase [11C]PIB, [18F]THK5317 R1, [11C]PIB R1, and [18F]FDG normalised uptake images shows clear-cut similarities in intensity patterns. While uptake within association cortices was greater in the patient with prodromal AD, in comparison with the patient with AD dementia, both patients showed similar perfusion and metabolism levels in subcortical structures, consistent with previous findings using [18F]FDG and perfusion single photon emission tomography (SPECT).26,27 Interestingly, an asymmetrical pattern of temporoparietal hypoperfusion in the AD patient coincides with a similarly asymmetrical hypometabolism in the same cortical regions, which can be appreciated visually.
The high ROI and voxel based correlations observed for [18F]THK5317 (early-phase SUVr and R1) vs [18F]FDG indicates good coupling between blood flow and glucose metabolism in the brain at resting-state. The inter-subject correlation coefficients between early-phase SUVr and R1 of [18F]THK5317 were likewise very high, indicating that early-phase [18F]THK5317 measures brain perfusion relative to the cerebellum. Similar findings were obtained for [11C]PIB, with no significant differences observed following comparison of correlation coefficients with those obtained using [18F]THK5317. Although application of multiple comparison correction reduced our voxelwise findings, retained significance despite a small sample size and the conservative nature of the FWE-rate approach support the assertion that early-phase SUVr and R1 of [18F]THK5317 provide proxy measures for regional relative blood flow, and thus, of brain metabolism.
Several studies have compared the discriminative ability of glucose metabolism and brain perfusion, as measured by [18F]FDG SUVr, early-phase amyloid PET, 99mTc-HMPAO SPECT, and arterial spin labelling (ASL) MRI, with respect to the differentiation of AD from healthy controls.7,28,29 These studies have shown the parietal, temporal, and posterior cingulate cortices to possess the best discriminative performance. Few studies, however, have specifically compared glucose metabolism and brain perfusion with respect to the separation of patients in the prodromal and dementia stages of AD. In the present study, AUC values were highest in these regions, across all parameters. Although AUC values for the discrimination between prodromal and dementia stages of AD were higher for perfusion markers compared with [18F]FDG in the frontal cortex—a finding that raised the tempting interpretation of relatively preserved brain perfusion in prodromal AD patients suggesting compensatory mechanisms at early stages of AD, as previously reported30—no statistically significant differences were found between AUC values obtained from perfusion compared with [18F]FDG measures within the frontal region, nor across the remaining ROIs.
The cerebellar cortex was selected as the reference region for [18F]THK5317 and [11C]PIB estimates due to previous reports of it lacking neurofibrillary tangles and Congo red/thioflavin-S positivity, respectively.31,32 Although consensus has yet to be reached as to which reference region is most suitable for normalisation of [18F]FDG SUV images, the pons has frequently been selected due to it being purported to be the brain region that is least affected, from a metabolic standpoint, in AD. 33 The cerebellar cortex was used in the present study, however, to achieve consistency with respect to the reference region used for [18F]THK5317 and [11C]PIB; in this respect, the metabolism of the cerebellar cortex has been shown to be well preserved in mild-to-moderate AD, 34 and has likewise been shown to be a good reference region for brain perfusion.35,36
Certain methodological aspects, however, limit interpretation of the present findings. In addition to the relatively limited sample size, we did not have any cognitively normal controls or patients with non-AD tauopathies, groups desirable to include in order to cover a wider range of outcome measures. Further, [18F]FDG SUVr is a semi-quantitative measure of glucose metabolism. However, it has been previously validated against fully quantitative measures of cerebral glucose metabolic rate, 34 and has been widely used in previous investigations examining the use of early-phase of [11C]PIB and [18F]florbetapir as proxies for brain perfusion.5,6,7,11 More accurate absolute measurements of brain perfusion using ASL MRI or 15 O-water PET—measures that have been shown to correlate well with [18F]FDG37,38 or surrogate measures of absolute brain perfusion such as those obtained by washout allometric reference method as demonstrated for [11C]PIB PET39,40—would potentially also have allowed for more accurate comparison with R1, itself a relative measure only.
Despite these caveats, our findings suggest that early-phase SUVr and SRTM derived R1 of [18F]THK5317 provide information on CBF, being closely correlated to glucose metabolism. The comparable discriminatory power observed across measures, in addition to the lack of statistical differences between associational strength to [18F]FDG, suggests that early-phase SUVr/R1 of [18F]THK5317 and [11C]PIB may both prove substitutes for [18F]FDG. An interesting possibility given the high cost of [18F]FDG investigations, 41 tracer selection could be based on feasibility, desired objectives, and availability of dynamic scanning protocols. Further prospective studies, including those incorporating additional tau and fluorine-18 Aβ PET imaging agents, are required to validate and extend these findings. Additional comparative clinical studies with [18F]FDG will also be of value to establish the diagnostic utility of these measures in both AD and non-AD tauopathies.
Funding
The author(s) disclosed receipt of the following financial support for the research, authorship, and/or publication of this article: This work was financially supported by grants from the Swedish Research Council (project 05817), the Swedish Foundation for Strategic Research (SSF), the Karolinska Institutet Strategic Neuroscience program, the Stockholm County Council-Karolinska Institutet regional agreement on medical training and clinical research (ALF grant), Swedish Brain Power, the Swedish Brain Foundation, the Alzheimer Foundation in Sweden, the Dementia Association, the European Union's Seventh Framework Programme (FP7/2007-2013) under grant agreement n° HEALTH-F2-2011-278850 (INMiND), the Foundation for Old Servants, Karolinska Institutet’s Foundation for Aging Research, Gun and Bertil Stohne's Foundation, Loo and Hans Osterman's Foundation, the Åhlén Foundation, and the Wenner-Gren Foundation.
Footnotes
Acknowledgments
We would like to express our gratitude to the patients who participated in the PET studies and their relatives. We also wish to thank the staff at the Uppsala PET Centre and Memory Clinic, Karolinska University Hospital Huddinge, as well Johan Lilja for support related to the imaging software VOIager (v.4.0.7, GE Healthcare, Uppsala, Sweden).
Declaration of conflicting interests
The author(s) declared no potential conflicts of interest with respect to the research, authorship, and/or publication of this article.
Authors' contributions
ERV, AL, AW, and AN were responsible for the study design; AN coordinated the study. ERV, AL, KC, and LSA were responsible for image processing and analysis. AW coordinated the PET investigations. ERV and AL were responsible for drafting of the manuscript. All authors critically revised the final version of the manuscript.
Data availability
Data can be accessed after contact with the authors and upon written agreement.