
Abstract
Reductions of cerebral blood flow and gray matter structure have been implicated in early pathogenesis of Alzheimer’s disease, potentially providing complementary information. The present study evaluated regional patterns of cerebral hypoperfusion and atrophy in patients with mild cognitive impairment and healthy older adults. In each participant, cerebral perfusion and gray matter structure were extracted within selected brain regions vulnerable to Alzheimer’s disease using magnetic resonance imaging. Measures were compared between diagnostic groups with/without adjustment for covariates. In mild cognitive impairment patients, cerebral blood flow was significantly reduced in comparison with healthy controls in temporo-parietal regions and the basal ganglia in the absence of local gray matter atrophy. By contrast, gray matter structure was significantly reduced in the hippocampus in the absence of local hypoperfusion. Both, cerebral perfusion and gray matter structure were significantly reduced in the entorhinal and isthmus cingulate cortex in mild cognitive impairment patients compared with healthy older adults. Our results demonstrated partly divergent patterns of temporo-parietal hypoperfusion and medial-temporal atrophy in mild cognitive impairment patients, potentially indicating biomarker sensitivity to dissociable pathological mechanisms. The findings support applicability of cerebral perfusion and gray matter structure as complementary magnetic resonance imaging-based biomarkers in early Alzheimer’s disease detection, a hypothesis to be further evaluated in longitudinal studies.
Keywords
Introduction
Alzheimer’s disease (AD) is mainly characterized by neuropathological events of amyloid-beta (Aβ) deposition and neurofibrillary tangles, 1 which can be detected in early disease stages. 2 In addition, vascular pathology has been implicated in early AD pathogenesis. 3 Brain vasculature and capillaries change morphology, disrupting normal blood flow and homeostasis between blood supply and neuronal activity, which can lead to neuronal dysfunction. 4 Such changes could be associated with vascular risk factors, but results from studies in mouse models of AD and humans also suggest links between Aβ and cerebrovascular deficiencies. 5
Reductions of cerebral perfusion are well-documented in patients with AD and mild cognitive impairment (MCI) 6 and could become a preclinical biomarker of early disease detection and progression.7,8 Reduced cerebral perfusion and hypometabolism, seen at the MCI stage, seem to affect parietal association areas first, before spreading to temporal regions.6,8,9 By contrast, gray matter atrophy is predominant in medial-temporal regions.10–12 Hence, there appears to be an early dissociation between temporo-parietal hypoperfusion and medial-temporal atrophy. 13 Yet, the possibility that magnetic resonance imaging (MRI)-based biomarkers of gray matter structure and cerebral perfusion may provide complementary information in early disease detection remains unclear.
Perfusion imaging sequences can be used to extract different parameters, the most common being cerebral blood flow (CBF) and cerebral blood volume (CBV), indicating the rate of blood delivery to the brain tissue and the fraction occupied by blood, respectively. 14 The two measures can be derived simultaneously using dynamic-susceptibility contrast MRI (DSC-MRI). 15 The DSC-MRI relies on the passage of a gadolinium-based contrast agent injected intravenously that will flow through the brain vasculature. Applied to MCI patients, a previous study reported changes in CBF prior to CBV in AD progression, 11 proposing the former as a more sensitive indicator of perfusion abnormalities.
The present study aimed to systematically evaluate regional reductions of cerebral perfusion (CBV and CBF) using DSC-MRI, and gray matter structure (volume and thickness) using T1-weighted MRI in prodromal AD within areas most affected by the disease. The AD-related regions-of-interest (ROIs) were selected based on previous neuroimaging studies using amyloid, metabolic, structural, and perfusion biomarkers.11,16–18 The MRI-based measures were extracted in the ROIs and compared between MCI patients and healthy control (HC) older adults. Specifically, our first aim was to assess divergence and convergence of regional patterns of hypoperfusion and gray matter atrophy in AD-related regions. Our second aim was to replicate previous findings of CBF being a more sensitive biomarker than CBV to detect perfusion abnormalities in MCI patients.
Material and methods
Participants
Participants (HC and MCI patients) were aged between 50 and 80 years and were native German speakers. The MCI patients were recruited from the memory clinic of the Department of Neurology at the Charité University Hospital, and a Neurology specialist practice in Berlin, Germany. Patients were diagnosed by a board-certified neurologist of the Charité using current criteria of amnestic MCI,19,20 which are as follows: a subjective cognitive complaint and an objective memory impairment measured using standardized subtests of episodic memory (performance at least 1.5 SD below age- and education-specific norm) on the Consortium to Establish a Registry for Alzheimer’s Disease (CERAD-Plus) test battery, 21 relatively preserved general cognitive functions measured using the Mini-Mental State Evaluation (MMSE), 22 no impairment in activities of daily living, and no sign of dementia in accordance with the NINCDS-ADRDA criteria for probable AD.23,24 The MCI sample included single domain amnestic MCI (with isolated episodic memory impairments) and multiple domain amnestic MCI (with episodic memory impairments and deficits in one or more other cognitive domains). The HC older adults were recruited from the general community via advertisement. They had no subjective cognitive complaints, scored at least 26 on the MMSE, and underwent a standardized medical interview and neurological examination. 25
Exclusion criteria for both diagnostic groups comprised severe medical, neurological, or psychiatric disease, major brain pathologies identified on MRI scans like territorial stroke or brain tumor, a body mass index (BMI) <18 kg/m2 or >35 kg/m2, and a score above 20 on the Beck’s depression inventory (BDI). 26 For the present analysis, only apolipoprotein E (APOE) ɛ4 non-carriers were included in the HC group, to minimize the possibility of AD pathology associated with APOE ɛ4-related genetic risk. 17 In the MCI group, APOE ɛ2 carriers were excluded, given the protective role of APOE ɛ2 in AD pathology 27 and AD risk. 28
The study was approved by the Ethics Committee of the Charité University Hospital, Berlin, Germany and was in accordance with the Declaration of Helsinki. All subjects gave informed written consent before participating in the study.
Neuropsychological testing
Participants were tested for verbal memory using the German version of the auditory verbal learning task (AVLT). 29 Scores of the sum and delayed recall AVLT subtests were provided for comparison of HC and MCI groups.
Vascular risk factors
A number of vascular risk factors were selected for sample description. Venous blood samples after overnight fasting were taken to assess markers of short-term fasting glucose levels, long-term glycated hemoglobin (HbA1c), and insulin levels. 25 Mean systolic blood pressure was calculated from two measurements taken in sitting position. Lipid parameters were assessed using total cholesterol, low-density lipoprotein (LDL), high-density lipoprotein (HDL), and triacylglycerides. In addition, we computed the validated Framingham risk index for cardiovascular disease (CVD, as a combined measure of vascular risk (Appendix e-1). 30
Genotyping
The APOE genotype was determined at the laboratory of Prof. Dr. Dan Rujescu (University of Halle, Halle, Germany) following procedures as previously described. 31 MCI patients were further dichotomized as APOE ɛ4 carriers (APOE ɛ3/ɛ4 and APOE ɛ4/ɛ4) or non-carriers (APOE ɛ3/ɛ3).
MRI acquisition
Scans were acquired using a 3-Tesla Magnetom Trio (Tim Trio; Siemens AG, Erlangen, Germany) at two different sites. The majority of HC individuals (n = 98) underwent MRI at the Charité Campus Benjamin Franklin; all other participants were examined at the Charité Campus Mitte using identical imaging protocols at both sites.
The high-resolution T1-weighted magnetization prepared rapid acquisition gradient echo (MPRAGE) sequence was acquired with the following parameters: repetition time (TR) = 1900 ms; echo time (TE) = 2.52 ms; 192 sagittal slices; voxel size = 1.0 × 1.0 × 1.0 mm3; flip angle = 9°. For DSC-MRI, participants received 5 mL of the contrast agent Gadobutrol (Gadovist; 1 M; Bayer Schering Pharma AG, Berlin, Germany) followed by 20 mL of saline by a power injector (Spectris; Medrad Inc., Warrendale, PA, USA), both at a rate of 5 mL/s. The DSC T2*-weighted sequence (TR = 1390 ms; TE = 29 ms; 21 axial slices, voxel size = 1.8 × 1.8 × 5.0 mm3; interslice gap = 0.5 mm; flip angle = 60°) yielded perfusion images with high contrast and signal intensity.
MRI processing
T1-weighted image processing
For cortical thickness estimation, T1-weighted images were processed using FreeSurfer (version 5.2, http://surfer.nmr.mgh.harvard.edu). 32 In an automated procedure, each T1 scan was bias-field corrected, intensity normalized, and skull stripped using a watershed algorithm. Cortical thickness surface maps were derived by defining the white/gray matter boundary, reconstructing the white/gray matter border surfaces, and estimating pial surfaces.
Perfusion image processing
Perfusion scans were processed using the image analysis software PMA (Perfusion Mismatch Analyzer, ASIST-Japan, version 3.4.0.6, http://asist.umin.jp/index-e.htm copyright). Arterial input functions (AIFs) used for processing the perfusion images were defined in an automated procedure. The automatic algorithm yielded between 7 and 10 AIFs located in both hemispheres. In the few cases in which an automated AIF was located low in the brainstem or in the superior brain slices, it was removed due to possible artifacts and replaced by an AIF defined manually in a major artery. Using the AIFs and standard singular value decomposition (sSVD) with a threshold of 0.2 and a 3 × 3 uniform smoothing kernel, CBV and CBF maps 33 were generated through voxel-by-voxel based calculations.
Extraction of MRI measures
Our analyses focused on ROIs preferentially affected in AD. The present ROI-based approach allowed for head-to-head comparisons of perfusion and structural MRI measures between diagnostic groups in the same brain region, as defined in the native space images.
Definition of regions-of-interest
Delineation of cortical and subcortical ROIs from the T1-weighted images was done using the Freesurfer automated ROI parcellation and segmentation procedures based on the Desikan atlas.
34
The following AD-related ROIs (Figure 1) were included: precuneus, inferior parietal gyrus, inferior temporal gyrus, isthmus portion of the cingulate gyrus, entorhinal gyrus, hippocampus, as well as basal ganglia (merged from caudate, putamen, and pallidus).
Representation of the AD-related regions-of-interest. Three-dimensional representation of cortical AD-related regions-of-interest (ROIs). The ROIs are projected on the gray matter surface of the left hemisphere. Subcortical ROIs of the hippocampus and basal ganglia are not shown.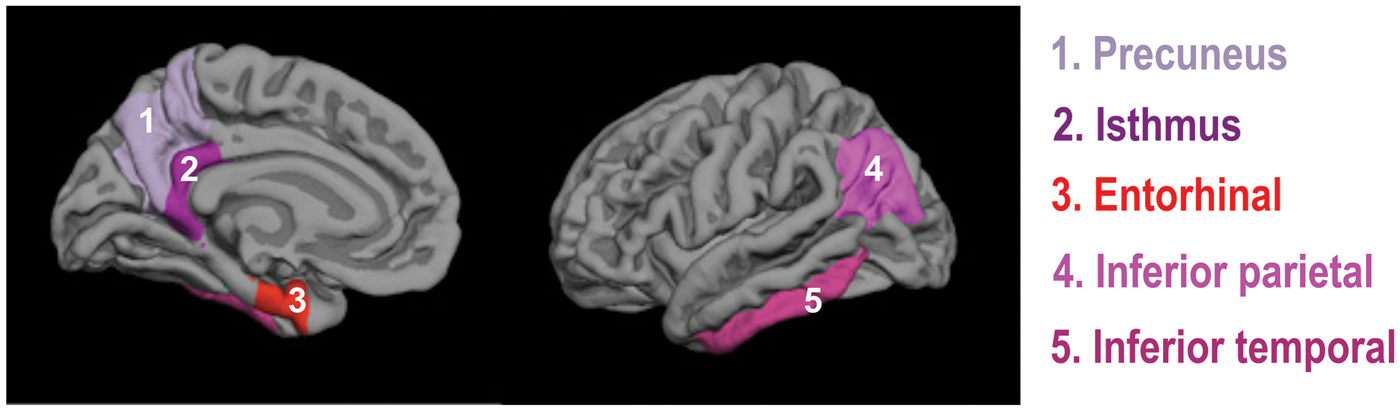
Extraction of cerebral perfusion measures
The FSL software package (version 4.1, www.fmrib.ox.ac.uk/fsl) was used to extract mean perfusion values from the CBV and CBF images for each ROI. The T1-weighted image and the ROIs were first co-registered to the native-space perfusion maps. Using the transformation matrix, the AD-related ROIs were then superimposed on the perfusion maps and the mean value of the non-zero voxels was extracted from the CBF and CBV maps. Perfusion values were normalized using the gray matter cerebellum, referred to as relative (r)CBV and rCBF values. We used the cerebellum based on the fact that perfusion was statistically non differentiable between diagnostic groups in this region (data not shown). This region is typically less affected than cortical areas in AD 35 and serves as an established reference region in perfusion imaging. 36 A threshold of the 90th percentile was applied before extracting the mean CBF and CBV values in the cerebellum to exclude voxels representing blood vessels or non-physiological artifacts. 36
Extraction of gray matter structural measures
Gray matter volume and thickness (when available) were assessed in each ROI using native-space T1-weighted images. Both measures were included since they represent divergent properties. Volume is influenced by both surface area and cortical thickness, but appears to be more closely related to surface area. 37 For each ROI, volume was determined using the FSL software and the non-zero voxels combined for the left and right hemisphere. Each volume measure was adjusted by total intracranial volume (ICV), a proxy of head size, via linear regression between gray matter volumes and ICV, i.e. residual approach. 38 The ICV-adjusted (residual) volumes were used for statistical analyses. Thickness was extracted for each hemisphere and each given cortical ROI using the FreeSurfer software and combined for left and right hemisphere.
In addition, white matter lesion (WML) volumes, an indicator of cerebrovascular disease, were estimated applying the subcortical FreeSurfer segmentation. 39 Acceptable reliability of the procedure using T1-weighted images has been previously demonstrated,40,41 even though it appears to underestimate WML volumes. WML volumes were rank-transformed to address the skewed distribution and adjusted for head size using the residual approach.
Statistical analysis
Statistical analyses were performed using SPSS 20 (IBM). The significance level was set to α = 0.05. Sample characteristics were compared using independent t-tests for parametric variables, chi-square tests for binary variables, and non-parametric (independent samples Mann–Whitney U test) for continuous variables if assumption of normality was not met. The initial multivariate analyses of variance (MANOVA) were performed for each ROI with diagnostic group (HC, MCI) as independent variable and all multimodal MRI measures (rCBV, rCBF, gray matter volume, and cortical thickness) as dependent variables. The multimodal MRI measures were z-transformed to express the same unit. Subsequently, we examined whether relationships between diagnostic group and cerebral perfusion were accounted for by local atrophy (and vice versa) by entering the respective MRI measure as covariate into the multivariate analyses. Results of these MANOVA models are presented separately for perfusion and structural measures in the result section.
Two additional analysis procedures were carried out. First, multivariate analyses of covariance (MANCOVA) models were computed including diagnostic group and covariates of age, sex, depression scores, and WML volumes due to significant group differences or potentially confounding effects. In separate MANCOVA models, we introduced only the Framingham CVD index, as a combined risk factor (supplementary material). Second, we examined effects of genetic risk on the multimodal MRI measures in MCI APOE4 carriers and non-carriers. Exploratory MANOVA models were conducted either including each MCI carrier group compared with HCs or MCI APOE4 carriers versus non-carriers as independent variables and the multimodal MRI measures as dependent variables (supplementary material).
Note, standardized beta coefficients were obtained from all MANOVA/MANCOVA models to provide a standardized effect size for the effect of diagnostic group on each MRI measure. Correction for multiple comparisons was done using false discovery rate (FDR) correction (corrected for the number of tests for each MRI measure). 42
Results
Participant characteristics
Participant characteristics.
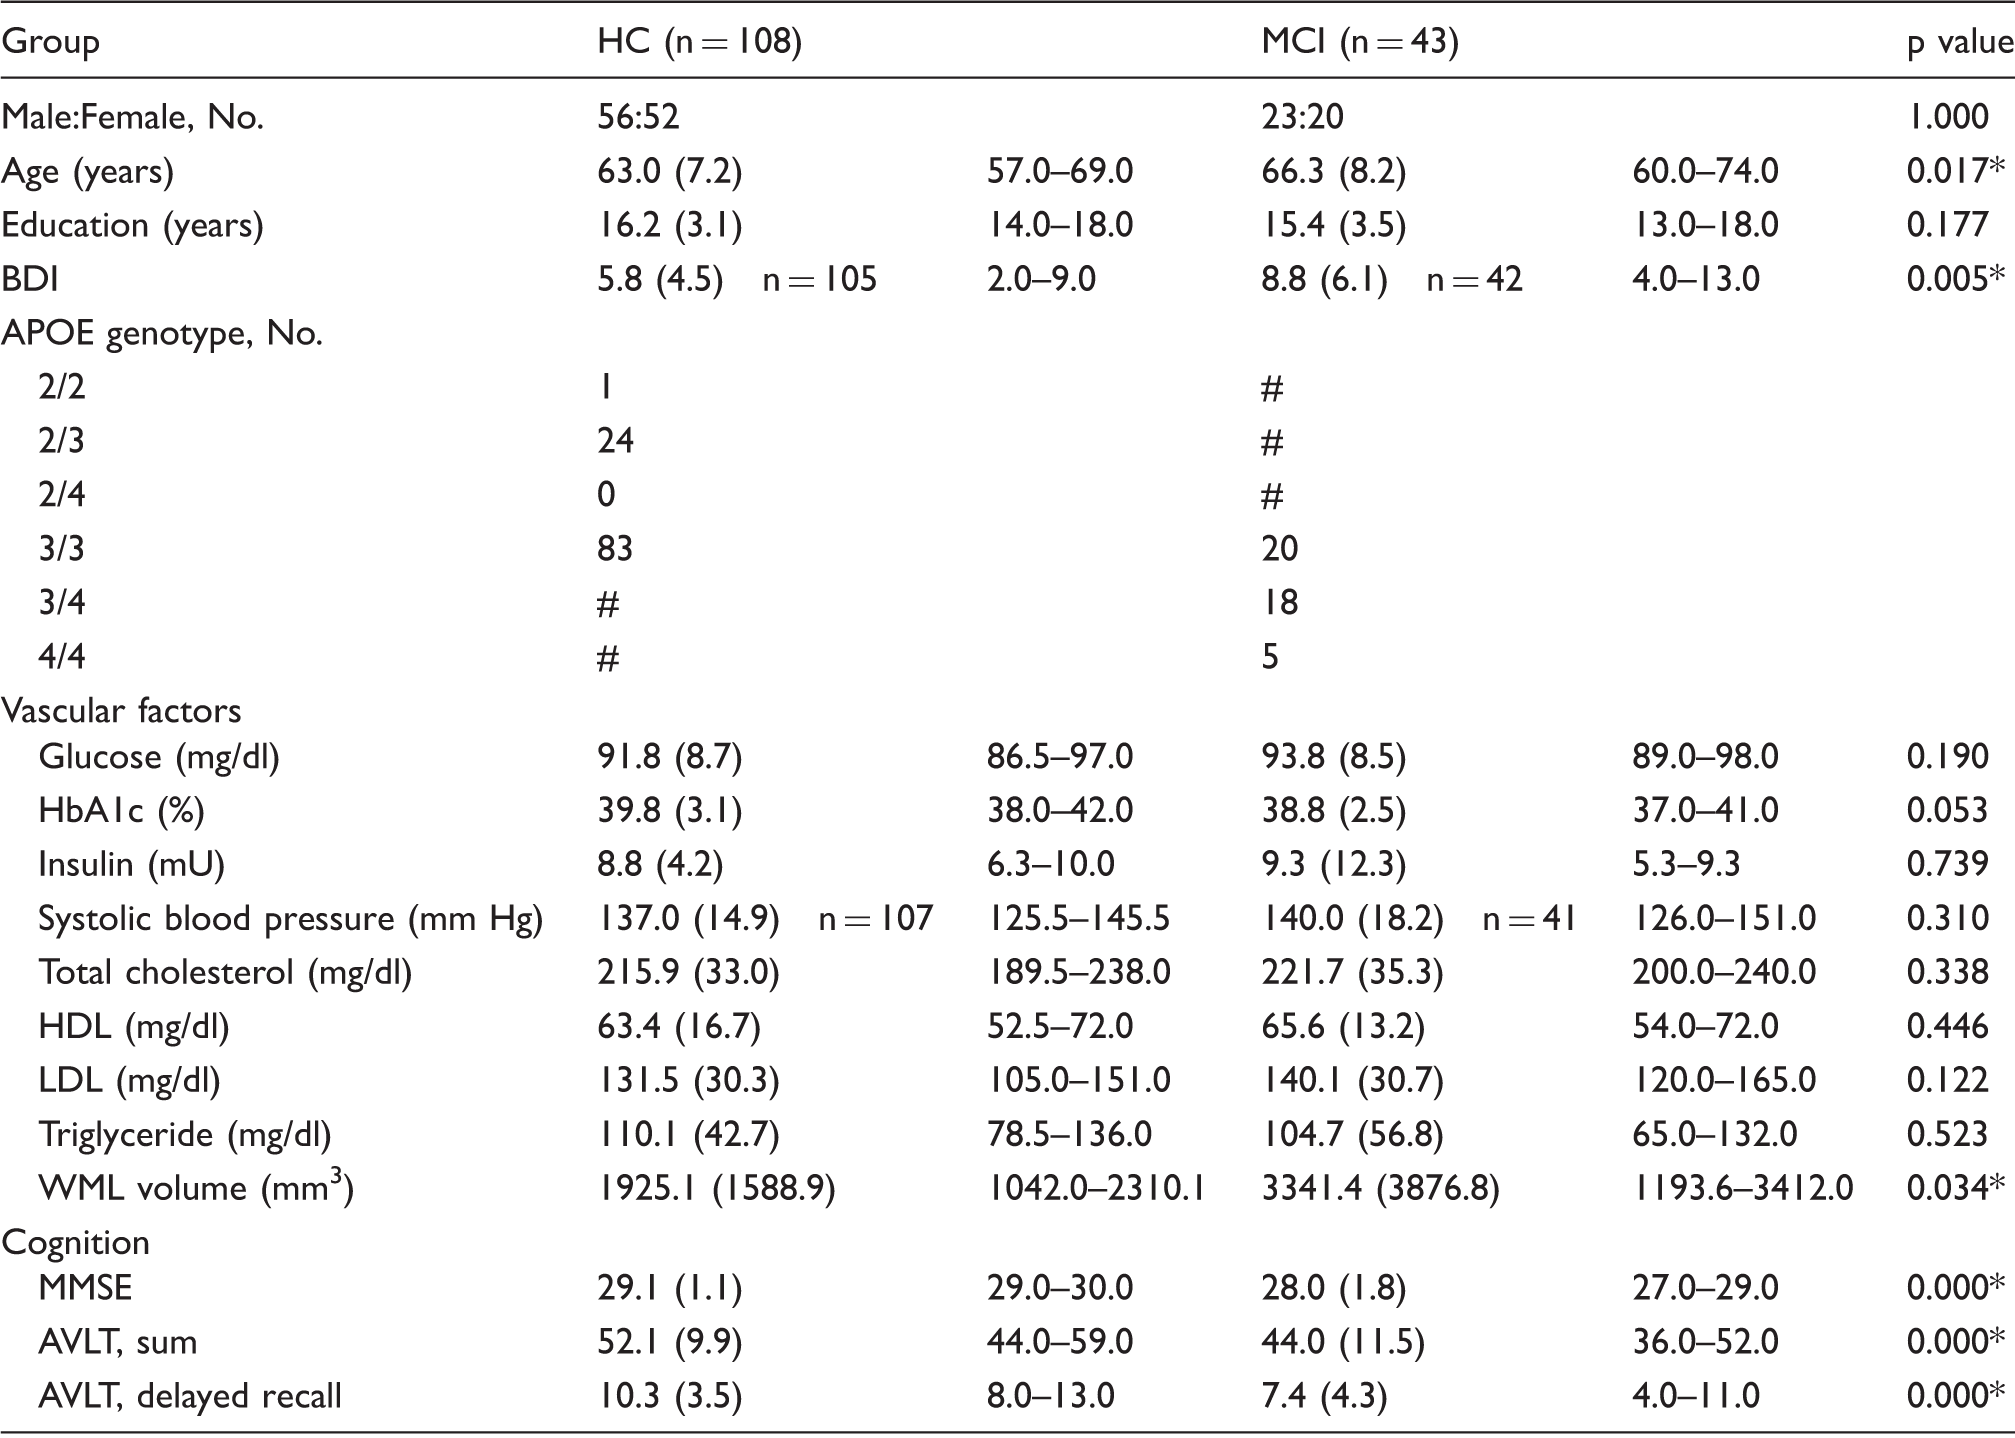
Mean (standard deviation) and interquartile range is provided for each variable, if available. P-values from two-tailed independent sample t-tests, chi-square test (for sex), and Mann–Whitney U test (for WML volumes) are reported. Asterisks indicate significance at p < 0.05, # excluded data.
APOE: apolipoprotein E; BDI: Beck’s depression inventory; Hbac1: glycosylated hemoglobin; HC: healthy control people; MCI: mild cognitive impairment patients; MMSE: Mini-mental state examination; WML: white matter lesion; AVLT: auditory verbal learning and memory test.
Perfusion differences between MCI and HC
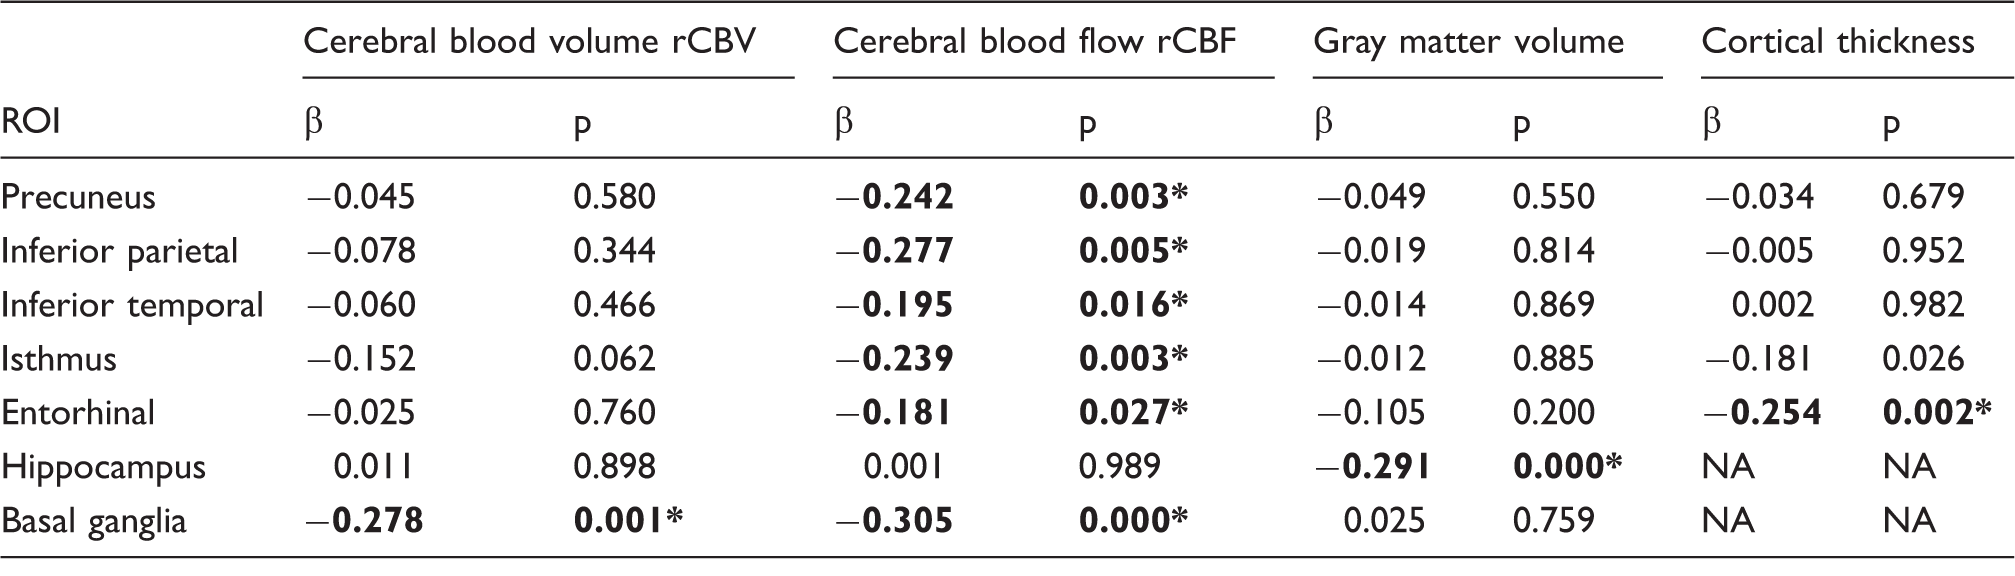
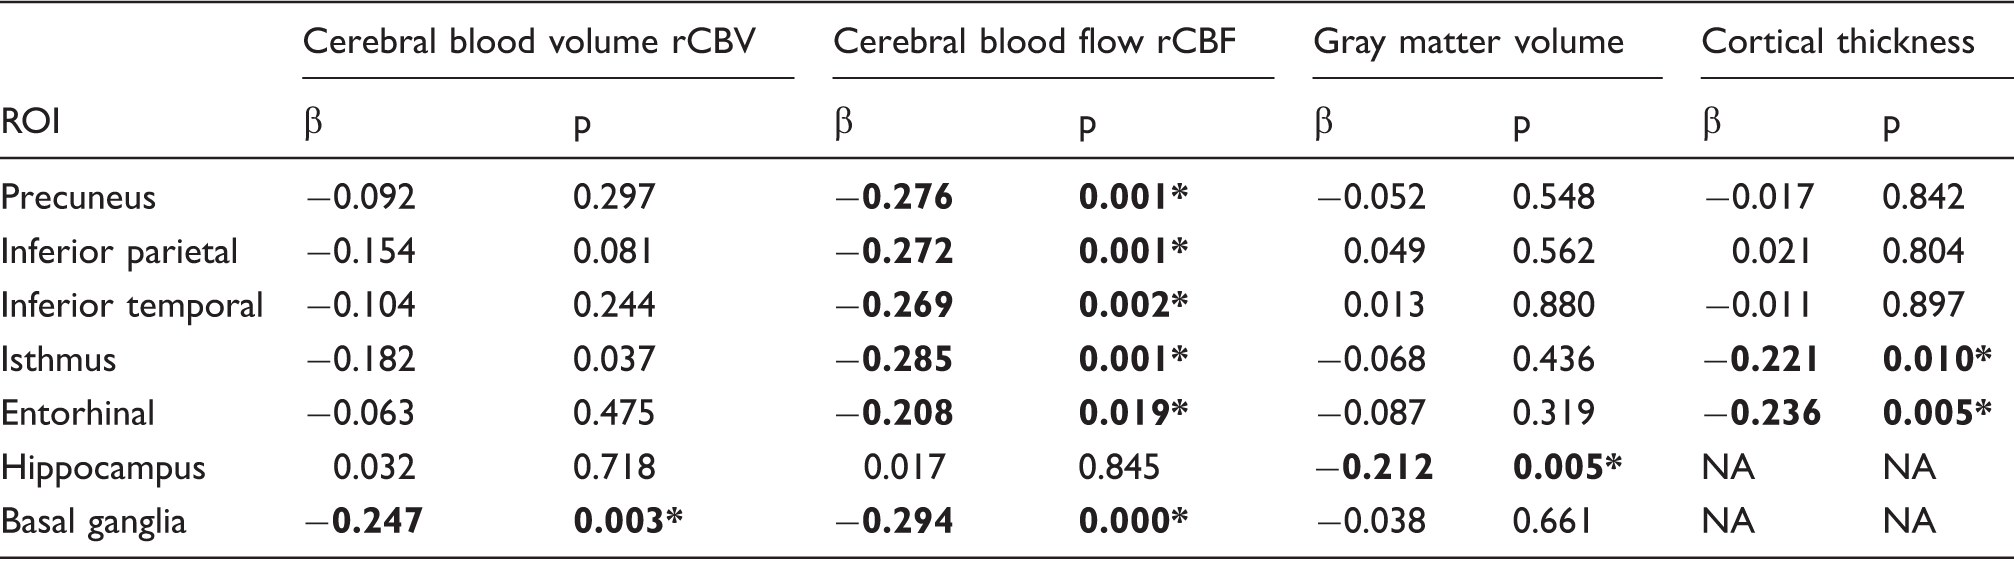
With regard to perfusion measures, MANOVA models showed significantly reduced perfusion (p’s < 0.05, FDR corrected, Table 2, Figure 2) in MCI patients compared with HCs in the following AD-related ROIs: precuneus (rCBF), inferior parietal (rCBF), inferior temporal (rCBF), isthmus cingulate (rCBV, rCBF), entorhinal (rCBF), and the basal ganglia (rCBV, rCBF), but not in the hippocampus. Adjusting for local gray matter structure did not attenuate the observed effects (data not shown), except for the rCBF reduction in the entorhinal cortex (p = 0.071, adjusted for thickness).
Effects of diagnostic group on perfusion and structural MRI measures. Effects of diagnostic group (HC, MCI) on cerebral blood volume (first bar), cerebral blood flow (second bar), gray matter volume (third bar), or cortical thickness (fourth bar) for AD-related regions-of-interest (ROIs). Negative standardized beta coefficients reflect biomarkers reductions in MCI patients; statistical significance is indicated (*p < 0.05, FDR corrected, unadjusted analyses; +p < 0.05, FDR corrected, when adjusting analyses for age, sex, depression scores, and WML volumes). Upper panel: ROIs with significant hypoperfusion in the absence of significant gray matter reduction in MCI patients. Lower panel: ROIs with significant gray matter reduction and the presence/absence of significant hypoperfusion in MCI patients. Effects of diagnostic group on perfusion and structural MRI measures. Effects of diagnostic group (HC = 108, MCI = 43) for cerebral blood volume, cerebral blood flow, gray matter volume, and thickness in regions-of-interest (ROIs). Standardized beta coefficients and p-values are reported. Asterisks indicate significance at p < 0.05, FDR corrected. Negative beta coefficients indicate hypoperfusion or gray matter atrophy in MCI patients.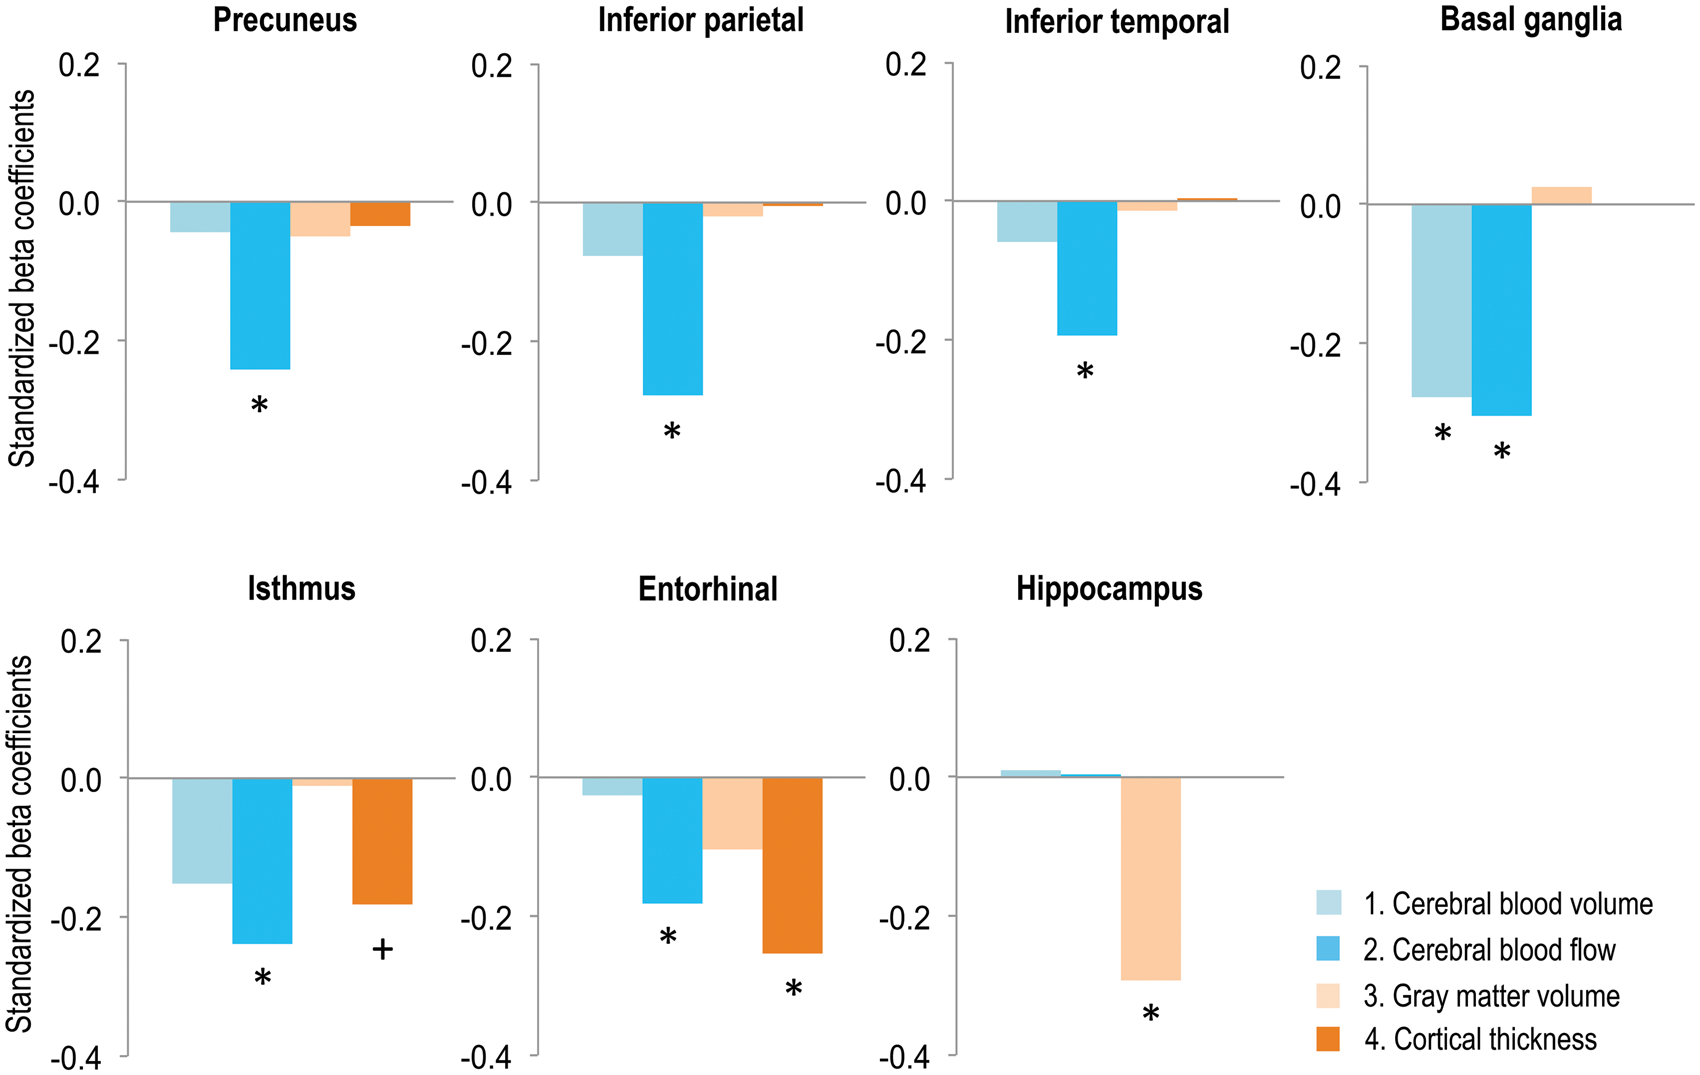
Structural differences between MCI and HC
With regard to measures of gray matter structure (volume and thickness), MANOVA models showed significant gray matter reductions (p’s < 0.05, FDR corrected, Table 2, Figure 2) in MCI patients compared with HCs in the hippocampus (volume) and entorhinal region (thickness), but not in the precuneus, basal ganglia, inferior parietal, or the inferior temporal regions. At a more liberal statistical threshold (p < 0.05, uncorrected), significant cortical thinning was present in the isthmus cingulate (p = 0.026). Adjustment for local perfusion did not attenuate the observed effects on gray matter volume or thickness (data not shown).
Additional statistical analyses
Adjusted effects of diagnostic group on perfusion and structural MRI measures.
Effects of diagnostic group (HC = 105, MCI = 42) for cerebral blood volume, cerebral blood flow, gray matter volume, and thickness in regions-of-interest (ROIs). Statistical models were adjusted for sex, age, depression, and WML volumes. Standardized beta coefficients and p-values are reported. Asterisks indicate significance at p < 0.05, FDR corrected. Negative beta coefficients indicate hypoperfusion or gray matter atrophy in MCI patients.
Exploratory MANOVA models examined differences in the multimodal MRI measures in MCI APOE ɛ4 carriers and non-carriers. Similar patterns of temporo-parietal hypoperfusion and medial-temporal atrophy were observed in both MCI groups in comparison with HCs. However, these effects were significant only in the MCI APOE ɛ4 carriers, but not in the MCI non-carriers (p’s < 0.05, FDR corrected, Tables e-2 and e-3, respectively). In MCI APOE ɛ4 non-carriers, we observed a significant rCBF reduction in the basal ganglia (p < 0.05, FDR corrected, Table e-3) and, at a more liberal statistical threshold, a reduction of hippocampal volume (p < 0.05, uncorrected, Table e-3). There were no significant differences in the multimodal MRI measures between APOE ɛ4 carriers and non-carriers in MCI patients (data not shown).
Discussion
The present study evaluated DSC-MRI perfusion measures (rCBF, rCBV) and gray matter structure (volume and thickness) in regions preferentially affected in AD in a large sample of MCI patients and healthy older adults. Our results indicated a dissociation in regional patterns of hypoperfusion and atrophy in MCI patients, with pronounced hypoperfusion without atrophy in temporo-parietal and basal ganglia areas, and atrophy without hypoperfusion in the hippocampus. Moreover, we confirmed superior sensitivity of rCBF over rCBV to detect perfusion alterations in MCI patients. These findings point toward hypoperfusion as an early event in temporo-parietal regions, detectable even in the absence of local atrophy in these regions. Our results converge with models proposing that cerebral perfusion may be affected first in certain areas, 7 however, longitudinal studies will be needed to answer this question. Overall, the present study suggests an added value of CBF imaging over structural imaging and supports applicability of cerebral perfusion and gray matter structure as complementary MRI-based biomarkers in early AD detection.
Perfusion differences between MCI and HC
Statistical analyses detected extended cerebral hypoperfusion, predominantly rCBF reductions, in MCI patients compared with HCs in areas typically affected in AD, except the hippocampus. Such a result converges with previous findings of aberrant perfusion in MCI patients within temporal and parietal regions10,43–45 and the basal ganglia. 44 The observed pattern of perfusion abnormalities found in the MCI patients co-localizes with brain hypometabolism, commonly measured using FDG-PET, in prodromal and clinical AD.46,47 Importantly though, no significant local atrophy was found in the precuneus, inferior temporal and parietal regions, as well as the basal ganglia. Temporo-parietal rCBF reductions also remained significant after correcting for local gray matter structure, suggesting associations between cerebral perfusion and cognitive status above and beyond the contribution of gray matter integrity. The result may thus imply an initial dysfunction of neurovascular mechanisms in early AD 48 in temporo-parietal and basal ganglia regions.
Our findings further confirm superior sensitivity of local rCBF rather than rCBV to detect hypoperfusion in MCI patients, convergent with a previous study. 11 Regional rCBV reductions in MCI patients were significant only in the basal ganglia, with lower effect sizes (beta coefficients) compared with rCBF abnormalities. Both blood flow and volume abnormalities were previously found in AD converters,11,49 highlighting their mutual sensitivity to pathogenic mechanisms. However, rCBF may be more affected by early AD-related pathological mechanisms than rCBV.
Structural differences between MCI and HC
Significant gray matter reductions were seen in the MCI patients compared with HCs in the hippocampus, the entorhinal cortex and the isthmus cingulate (after covariate adjustment), in line with existing findings. 50 For the entorhinal cortex, atrophy remained significant after adjustment for local hypoperfusion, while, for the hippocampus, atrophy was found in absence of significant perfusion alterations. Previous findings indicate that gray matter atrophy exceeds mild or moderate metabolic abnormalities in this brain region in AD, 47 similar to our results. An earlier study noticed hypoperfusion in the hippocampus of MCI patients 51 ; however, the authors did not examine the degree of local gray matter atrophy. Our findings support observations that gray matter atrophy is localized to medial-temporal regions in MCI patients, where it appears to occur in the absence or independent of local hypoperfusion.
Potential pathological mechanisms underlying hypoperfusion in MCI patients
The observed divergence of temporo-parietal hypoperfusion and medial-temporal atrophy in MCI patients could reflect involvement of partly different pathological mechanisms. Previous findings suggest that CBF reductions may be linked to Aβ pathology, particularly, in early stages of the disease. 16 Comparing MCI patients with increased (cortex-wide) Aβ deposition to Aβ-free healthy older individuals, hypoperfusion was found in the patient group in inferior temporal and parietal areas, 16 comparable with our findings. Similarly, in a mixed sample of healthy older adults and MCI patients, global Aβ deposition was recently found to correlate with posterior parietal hypometabolism. 52 However, no significant CBF reduction was reported in a group of Aβ-positive/tau-negative non-demented older people, 53 highlighting the possibility that Aβ alone might not be sufficient to cause cerebral hypoperfusion. In our MCI cohort, CBF alterations appeared to be mainly driven by APOE e4 carriers, although we failed to detect significant perfusion differences between APOE e4 carriers and non-carriers in this group. Nevertheless, the observation converges with a previous report, 54 which further indicated that APOE e4 mainly contributed to reductions in global CBF via mechanism that were not limited to Aβ deposition. Medial-temporal atrophy, as seen in the hippocampus and entorhinal regions, has been linked to tau pathology in AD patients,50,55 thought to emerge through at least partly independent pathological pathways. 56 Given that local pathological processes may affect distant functionally connected brain regions, it is also possible that medial-temporal gray matter damage impairs temporo-parietal perfusion. 57 Finally, multimodal deficits (hypoperfusion and atrophy) as observed in entorhinal and isthmus cingulate regions, might point toward an early intersection of pathological mechanisms in these regions. 58
Cerebrovascular pathology and vascular risk factors may also be involved in neurovascular dysfunction and atrophy. 3 In the present study, we could not identify a major role of vascular pathology. There were no significant differences between MCI patients and HCs in a number of vascular risk factors and adjustment for increased WML load found in MCI patients or the Framingham CVD risk index did not modify our results. It therefore appears that vascular pathology was not the major factor underlying alterations in perfusion and gray matter structure as shown by the MCI patients. However, pathological pathways potentially related our findings will need to be clarified in future longitudinal studies that combine MRI-based and PET-based imaging markers of neuropathology.
Limitations and strengths
Several limitations should be considered when interpreting our findings. First, spatial resolution of the perfusion imaging is rather low, yielding imperfect registration on the perfusion maps. To minimize the impact of this technical limitation, images were inspected visually after ROIs registration on the perfusion map. Although prone to perfusion changes 44 and Aβ accumulation, 59 frontal areas were excluded, due to distortions in these regions often seen in DSC-imaging. 60 Second, imaging data were acquired on the same scanner model, but at two different locations. Given that inter-scanner differences have substantially less impact than the effect of disease in AD 61 and that other MRI-specific factors such as scanner platforms and field-strengths introduce more measurement bias, 62 it is unlikely that scanner location confounded our results. Third, MCI patients had a higher age and subclinical depression scores compared with the HC group. Still, adjustments for these parameters did not modify our results. Strengths of the study encompass the large and well-characterized sample of HC individuals and MCI patients, with gadolinium-based assessment of cerebral perfusion in all participants.
Conclusion
Our results demonstrate divergent patterns of hypoperfusion and gray matter atrophy in MCI patients: reduced perfusion is present mainly in temporo-parietal and basal ganglia regions, while reductions of gray matter structure occur mainly in medial-temporal regions. Our findings support applicability of perfusion- and structure-based MRI measures as complementary biomarkers in early AD detection, which needs further evaluation in future longitudinal studies.
Footnotes
Funding
The author(s) disclosed receipt of the following financial support for the research, authorship, and/or publication of this article: The research work was supported by grants from the Deutsche Forschungsgemeinschaft (Fl 379-8/1, Fl 379-10/1, Fl 379-11/1, and DFG-Exc 257), the Bundesministerium für Bildung und Forschung (FKZ 0315673A, 01EO0801, 01GQ1424A, and 01GQ1420B), the Hans Gerhard Creutzfeldt scholarship, and the NeuroCure Female postdoctoral research fellowship.
Acknowledgments
The authors thank Dr. Lucia Kerti (NeuroCure Clinical Research Center and Department of Neurology, Charité - Universitätsmedizin Berlin, Germany) and Dr. Sylvia Villeneuve (Centre for Studies on Prevention of Alzheimer’s Disease, Douglas Mental Health University Institute, Montreal, Canada) for help in data collection, analysis or manuscript drafting, respectively.
Declaration of conflicting interests
The author(s) declared the following potential conflicts of interest with respect to the research, authorship, and/or publication of this article: Agnes Flöel has obtained consulting fees from Schwabe, Honoraria for oral presentations from Novartis, Böhringer-Ingelheim, Schwabe, and Souvenaid, as well as royalties from the book “Alzheimer-Unabwendbares Schicksal?”
Author's contributions
Miranka Wirth: Analysis or interpretation of data, drafting/revising the manuscript for content, final approval. Alexa Pichet Binette: Analysis or interpretation of data, drafting/revising the manuscript for content, final approval. Peter Brunecker: Analysis or interpretation of data, drafting/revising the manuscript for content, final approval. Theresa Köbe: Analysis or interpretation of data, drafting/revising the manuscript for content, final approval. Veronica Witte: Study concept or design, drafting/revising the manuscript for content, final approval. Agnes Flöel: Study concept or design, drafting/revising the manuscript for content, final approval.
References
Supplementary Material
Please find the following supplemental material available below.
For Open Access articles published under a Creative Commons License, all supplemental material carries the same license as the article it is associated with.
For non-Open Access articles published, all supplemental material carries a non-exclusive license, and permission requests for re-use of supplemental material or any part of supplemental material shall be sent directly to the copyright owner as specified in the copyright notice associated with the article.