
Abstract
Evaluation of the venous system may be useful in stroke prognostication and patient selection for acute intervention strategies. We report a novel phenomenon, delayed-late venous phase cortical vein filling, observed on dynamic computed tomography angiography obtained using multidetector computed tomography scanner, in acute ischemic stroke patients. The aim of this study was to examine the frequency of delayed-late venous phase cortical vein filling and assess its association to baseline collateral status. Dynamic computed tomography angiography images of acute ischemic stroke patients, being assessed for reperfusion therapy, were prospectively studied. Delayed-late venous phase cortical vein filling was defined by late venous phase opacification of cortical veins despite contrast clearance from contralateral cortical veins on dynamic computed tomography angiography. Time to peak of maximum arterial enhancement was recorded. A total of 117 patients (mean age = 70.6 ± 13.3 years; males = 48%) with hemispheric ischemic stroke who underwent acute dynamic computed tomography angiography were included in the study. Overall, 56 (48%) demonstrated delayed-late venous phase cortical vein filling. Poor collateralization (OR = 13.50; 95% CI = (4.2, 43); p ≤ 0.0001) and longer time to peak of maximum arterial enhancement (OR = 3.2; 95% CI = (1.96, 5.3); p ≤ 0.0001) were positively associated with delayed-late venous phase cortical vein filling. Delayed-late venous phase cortical vein filling was independently associated with poor baseline collateral status (75% vs. 15%, p ≤ 0.0001; OR = 14.38; 95% CI = (4.33, 47.8); p ≤ 0.0001). Delayed-late venous phase cortical vein filling is frequently seen in patients with acute ischemic stroke and is associated with poor baseline collateralization.
Introduction
Computed tomography angiography (CTA) is a non-invasive vascular imaging technique with high sensitivity for the detection of arterial anatomy in the circle of Willis and other vascular structures. CTA also presents a reliable substitute to magnetic resonance angiography (MRA) and an expedient adjunct to conventional digital subtraction angiography (DSA).1,2 The development of new generation 320-detector row 640-slice multidetector CT (MDCT) scanners allows for whole-brain, sub-second, and volumetric acquisition of four-dimensional (4D) dynamic time-resolved CTA (dCTA) studies of the brain, in particular visualization of changes in perfusion.3,4 In addition to obtaining three-dimensional (3D) evaluation of intracranial vasculature, time-resolved dCTA allows visualization of contrast flow from its arterial to venous phases and has demonstrated superior diagnostic accuracy in comparison to the single-phase conventional CT-angiography.1,4 Currently, clinico-neuroradiological assessments using CTA focus primarily on the arterial cerebral circulation. Information on haemodynamics and the drainage topography of the venous cerebral circulation may be useful for prognostication in stroke. Animal studies have shown that the presence of blood flow in cortical veins after ischemic stroke was associated with decreased severity of hemiparesis and lower infarct volumes. 5 Based on these findings, the authors postulated that cortical venous outflow is more prevalent in strokes with good baseline collaterals, and animals with poor collaterals would demonstrate reduced or absent venous outflow. Other studies have used venous phase timing as a surrogate marker of the adequacy of collaterals at the circle of Willis and for general cerebral blood flow. 6 A recent clinical study found that cortical venous drainage, not the deep venous drainage patterns, identified by CTA, accurately predicted clinical outcomes. 7 Several studies have demonstrated the presence of hypointense prominent cortical veins, in early or mid-venous phase, ipsilateral to the ischemic tissue in acute ischemic stroke patients using susceptibility-weighted imaging (SWI).5,8–11 However, data on venous drainage patterns, temporal aspects of the filling of leptomeningeal collateral vessels, 12 and their role in stroke pathophysiology are limited.7,13–16
Currently, methods used to assess collateral filling are qualitative in nature. An alternative and direct measure of collateral flow can be very useful in clinical practice. In this study, we prospectively evaluated a quantitative measure, being venous drainage, in a group of hyperacute ischemic stroke patients who underwent dCTA angiography as part of their emergent evaluation. We report a novel angiographic pattern of delay in late venous phase cortical vein filling (LCVF) and its relationship to arterial collateral status.
The specific objectives of the study were:
To examine the frequency of delayed-LCVF. To investigate the factors or covariates associated with delayed-LCVF. To study the association of delayed-LCVF with baseline collateral status.
We hypothesize that the appearance of delayed-LCVF will be more commonly seen in a sub-group of ischemic stroke patients with poor arterial collaterals.
Materials and methods
Patient selection and study design
We studied consecutive acute ischemic stroke patients admitted to a comprehensive stroke centre using the following inclusion criteria: (a) age > 18 years, (b) presented within 4.5 h of stroke symptom onset, (c) being evaluated for reperfusion therapy, (d) hemispheric stroke, and (e) dCTA acquired at baseline. Patients without baseline CTA images, with hemorrhagic or metabolic stroke, were excluded from the study. Patients who were eligible for thrombolysis received 0.9 mg/kg intravenous recombinant tissue plasminogen activator (rtPA). Demographics and risk factors were assessed in a structured case-record form. Baseline clinical measures (immediately before acute CT) were assessed using the National Institutes of Health Stroke Scale (NIHSS). Stroke etiology was assessed using the Causative Classification System (CCS) criteria. 17 This study was approved by the Hunter New England Human Research Ethics Committee (HNEHREC, Newcastle, NSW) in accordance with the National Statement in Ethical Conduct in Human Research 2007. All patients gave informed consent.
Imaging acquisition and neuroradiological evaluation
All the patients included in the study underwent non-contrast CT (NCCT), CT perfusion (CTP) with dCTA at baseline, and follow-up (24 h) magnetic resonance imaging (MRI) (including diffusion-weighted imaging (DWI)) in accordance with our routine stroke imaging protocol. 18 All CT imaging was acquired on a 320-detector row 640-slice cone beam MDCT scanner (Aquilion One, Toshiba Medical Systems). Whole-brain NCCT was performed in one rotation (detector width 16 cm). Subsequent to NCCT, a 4D-dCTA and CTP were acquired simultaneously in two 60-s series. CTA/CTP imaging data were acquired in the axial plane before and after administration of 50 ml of contrast agent (Ultravist 370; Bayer HealthCare, Berlin, Germany) injected intravenously at a rate of 6 ml/second chased by 50 ml of saline (acquisition parameters: 120 kV, 128 mAs, scanning coverage (SC = 240 mm) and scanning width (SW) = 5 mm). Starting 7 s after contrast injection, pulsed full rotation scan with 19 time points acquired over 60 s with a total pulse image acquisition time of 9.5 s was used. For examination of extra cranial vessels, CTA of extracranial segment was also acquired using bolus tracking with 50 ml of contrast (injected at 6 ml per second chased by 50 ml of saline). Total radiation exposure was 5.5–6.0 mSev. MRI was performed at 24 h based on standard stroke imaging routine protocol that includes an axial isotropic DWI spin-echo echo-planar imaging (SE-EPI) sequence, time-of-flight MR angiography (TOF-MRA), and whole-brain perfusion imaging with bolus-tracking perfusion-weighted imaging (PWI), on a 3 T MRI (Siemens Verio, Erlangen, Germany) with a 32-channel receive-only head coil. 19
All CTA images were de-identified and reviewed digitally at a workstation (Vitrea® fX, Version 1.0, Vital Images, Minnetonka, MN, USA). Baseline axial CTA data were formatted and images were analysed using maximum intensity projection (MIP) and multiplanar reformat reconstructions in coronal and sagittal planes. 20 These images were read by consensus by two experienced readers (SB and CL). In order to obtain optimized spatial orientation and precise localization of the ischemic lesion, three-dimensional volume rendering was applied. Delayed-LCVF was defined by late venous phase opacification of cortical veins despite contrast clearance from contralateral cortical veins on MIP images from dCTA (see Supplementary Video). To assess the association of venous drainage with delay in maximized enhancement of arterial collateralization, we recorded time to peak of maximum arterial enhancement (TPME). The baseline (time = 0) was defined as the image immediately preceding the venous filling in early phase, following which, the times taken to reach maximized arterial filling of all M2, M3, and M4 segments, with respect to the contralateral hemisphere, were recorded (each successive image corresponds to 2 s lag; therefore, TPMEs were recorded as even numbers = 2 s, 4 s, 6 s, 8 s …). For morphological assessment of collateralization status, collateral grading was done using dCTA data based on the degree of reconstitution of the MCA up to the distal end of its occlusion and was divided into ‘good’ or ‘reduced or poor’ using a protocol described previously. 21 The extension of the sphenoidal segment from the bifurcation of ICA on the medial end to its bifurcation or trifurcation in the insular region is identified as M1. M2 is defined in terms of proximal (the segment that starts immediately after M1 bifurcation) and distal (beyond M1 region) segments. 7
CTP data were de-identified prior to analysis, following which CTP perfusion maps, including mean transit time (MTT) and cerebral blood volume (CBV) were generated with MIStar software (Apollo Medical Imaging Technology, Melbourne, Australia), which uses a deconvolution algorithm to process the data. 22 Acute perfusion imaging was processed using single-value deconvolution with delay and dispersion correction. An arterial input function and venous outflow function was semiautomatically selected from the non-stroke (contralateral) hemisphere MCA/ACA and sagittal sinus, respectively. Previously validated thresholds were applied in order to measure the volume of the acute perfusion lesion (relative delay time, DT > 3 s) and acute infarct core (relative CBF < 30%). 23 Penumbral volume was calculated from the volume of the perfusion lesion (DT threshold > 3 s) minus the volume of the infarct core (relative CBF threshold < 30% within the DT > 3 s of the lesion).
Case presentations
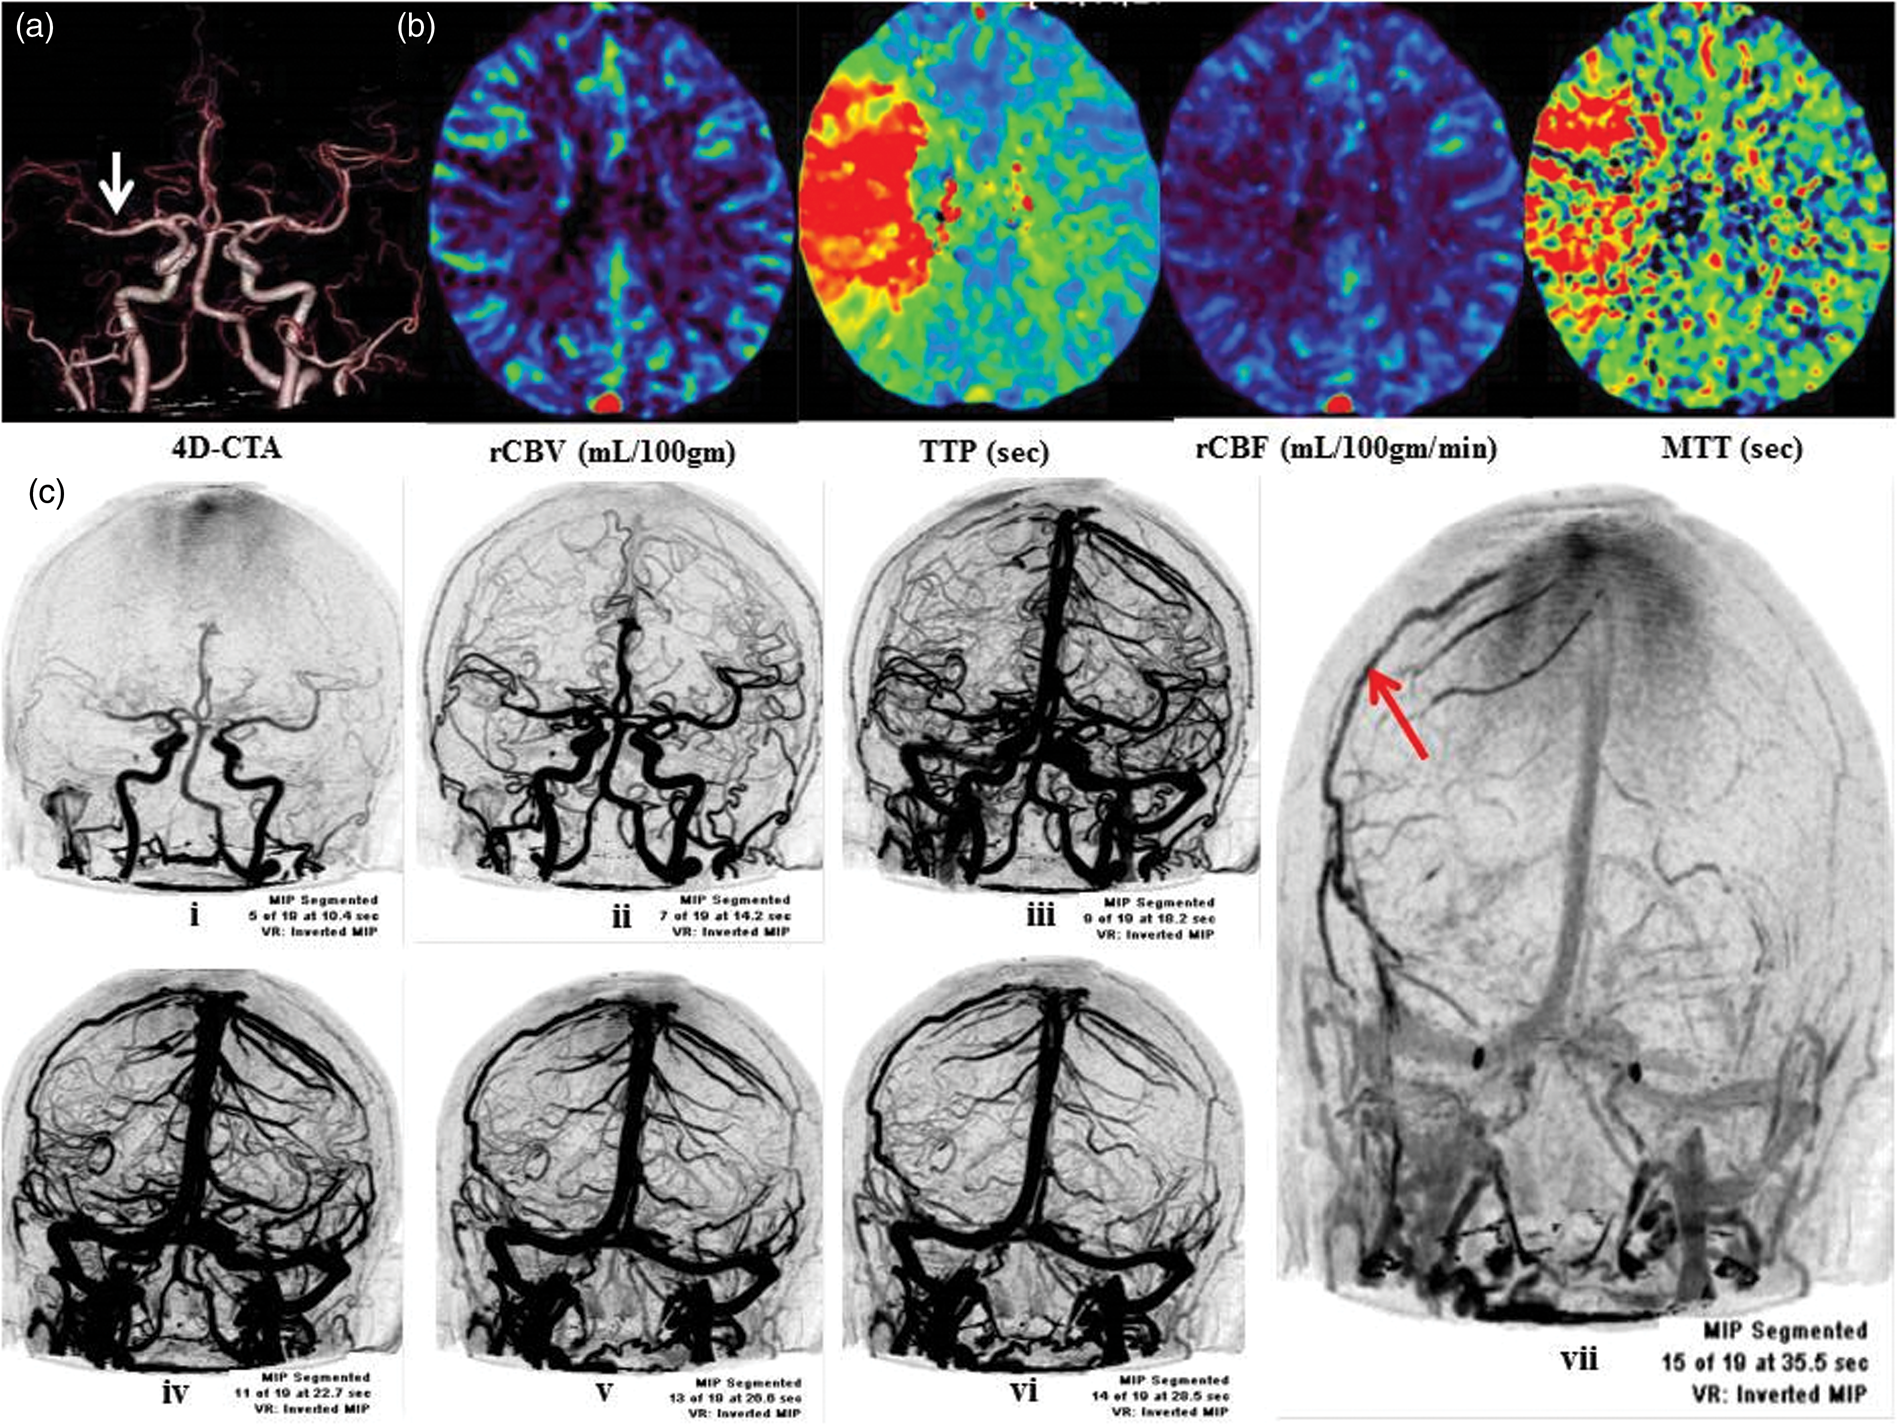
Two cases with delayed-LCVF are shown in Figures 1 and 2. Early, mid-venous, and late venous phases are depicted. The patterns of delayed-LCVF as seen on MIP reconstructed images of CTA are detailed. Cortical veins showed persistent opacification in late venous phase on the side of the ischemic lesion despite contrast clearance from the contralateral side. The time course of venous flow on dCTA for the patient in case study 1 is shown in Supplementary Video.
Case study 1. (a) Non-contrast CT (NCCT) demonstrates effacement of the sulci and blurring of the normal grey/white matter differentiation in the left frontoparietal region. (b) Three-dimensional volume-rendered image from MDCT 4D-CTA. The white arrow points at the presence of a left M2 occlusion. (c) (i–iv) CTP (coronal 5 mm average registered) shows the presence of penumbra and demonstrated region of increased mean transit time (MTT) and time to peak (TTP), as well as reduced cerebral blood flow (CBF) and blood volume (CBV) in the left MCA cortex. (d) Baseline MRI using PWI-DWI mismatch also confirms the presence of penumbra in the left MCA infarct involving insula region. (e) CT Angiogram AP view: coronal reformatted 2D MIP spiral dynamic CTA images (i–vii); The presence of left-sided late-venous phase opacification of cortical veins (red arrow) on left side despite contrast clearance from contralateral (right side) cortical veins can be seen on dynamic CTA image, (e) (vii). Early phase is characterized by early filling of venous sinuses (i–ii), followed by mid-venous phase (iii–vi). Late venous phase is depicted in vii (red-arrow). Case Study 2.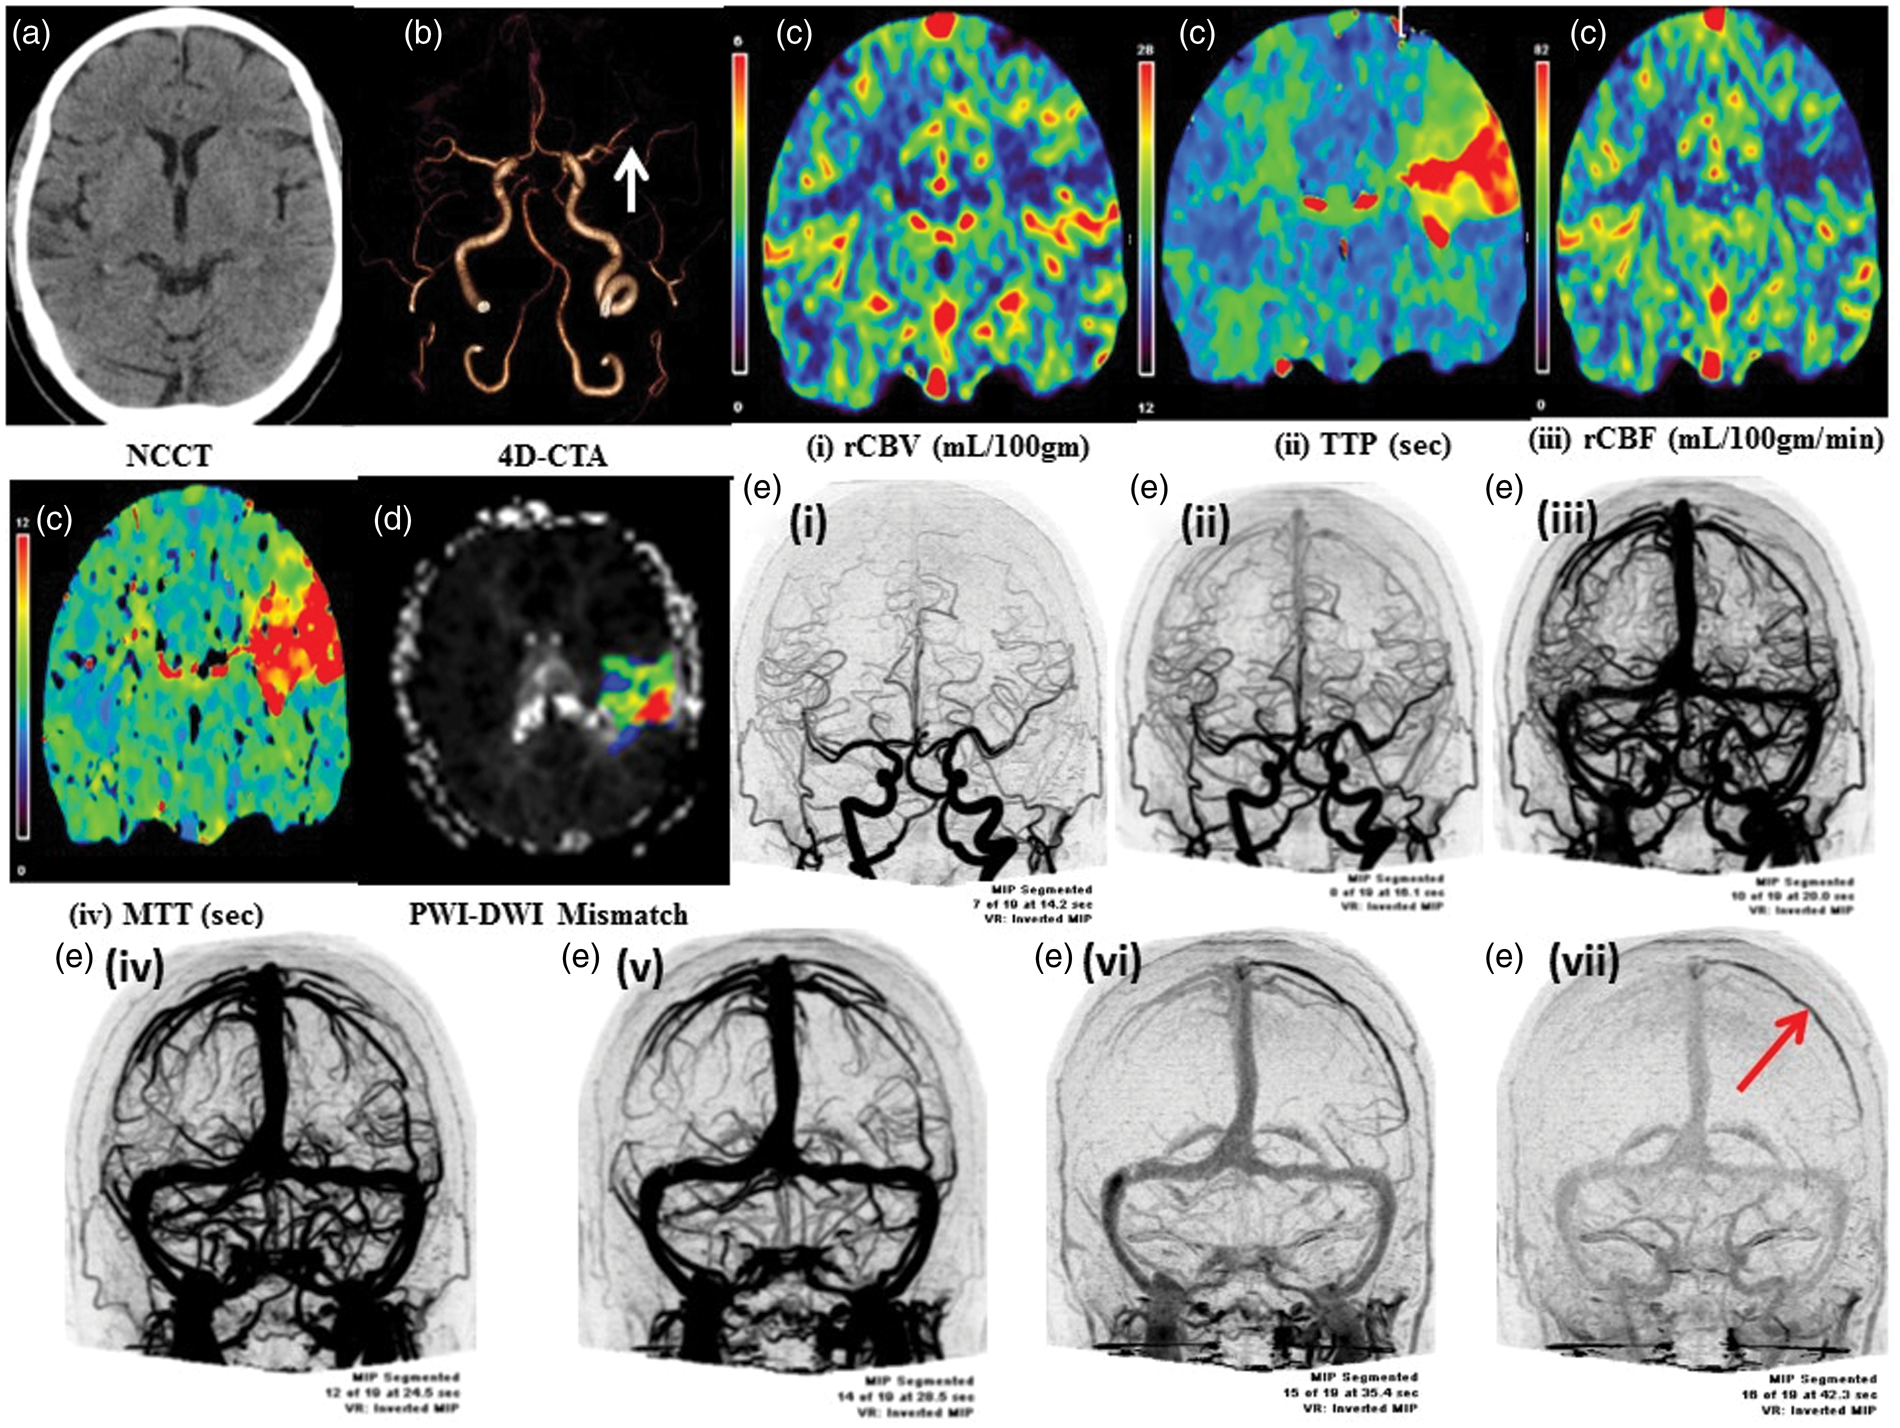
Statistical analysis
All the statistical analyses were performed using STATA (Version 10, 2001; College Station, TX, USA). Numerical values given are the means (±standard deviation) or medians (interquartile range) for age, TPME, and NIHSS at admission. For ordinal or continuous data, Mann-Whitney (Wilcoxon rank-sum) test was used. Nominal data were analysed with the Pearson's chi-squared (χ2) or the two-tailed Fisher exact test. We compared two groups of patients stratified by delayed-LCVF status (delayed-LCVF vs. no-delayed-LCVF). Group differences were considered significant at p-values < 0.05. Univariate logistic regression analysis was used to test associations between covariates and delayed-LCVF. Results of logistic regression are reported as odds ratios (ORs). Only those variables with p < 0.1 were tested in the subsequent multivariate regression analysis. Before fitting the multivariate model, we also tested the correlations among all covariates with the pairwise Pearson's correlation coefficient (r) to identify collinear pairs. Significance level of the correlation coefficients for each variable was also tested. Multicollinearity was also tested using tolerance and variance inflation factor (VIF): a common rule of thumb is that VIFs > 5 identify strongly collinear pairs. 24 If two or more covariates were found to be collinear, we retained the variable that was more strongly associated with the delayed-LCVF to ensure a stable model. A multivariate regression model, based on a backwards, step-wise approach was used; to arrive at the most parsimonious model by retaining only the most important ‘explanatory’ variables (p < 0.1). Multivariate normality (of the regression model) was also checked using the Doornik-Hansen test. Comparison between the various multivariate regression models was made using model selection statistics (including the Akaike information criterion (AIC) and the Bayesian information criterion (BIC)). The sensitivity, specificity, and overall rate of correct classification for each model were estimated using classification statistics using a cut-off (positive outcome threshold) of 0.5. The goodness-of-fit using Pearson χ2 test and number of covariate patterns were calculated for each multivariate model. Finally, the receiver operating characteristic (ROC) curve for the regression model was plotted, and the area under the ROC curve was computed to evaluate the predictive ability. To study the association with baseline collateral status, univariate and multivariate logistic models were used. The model used TPME, age, and NIHSS. The effect of delayed-LCVF on this model was also studied, and the classification statistics for both the models were compared.
Results
Baseline characteristics
List of demographic, clinical, and risk factor variables stratified by late-phase cortical vein filling.
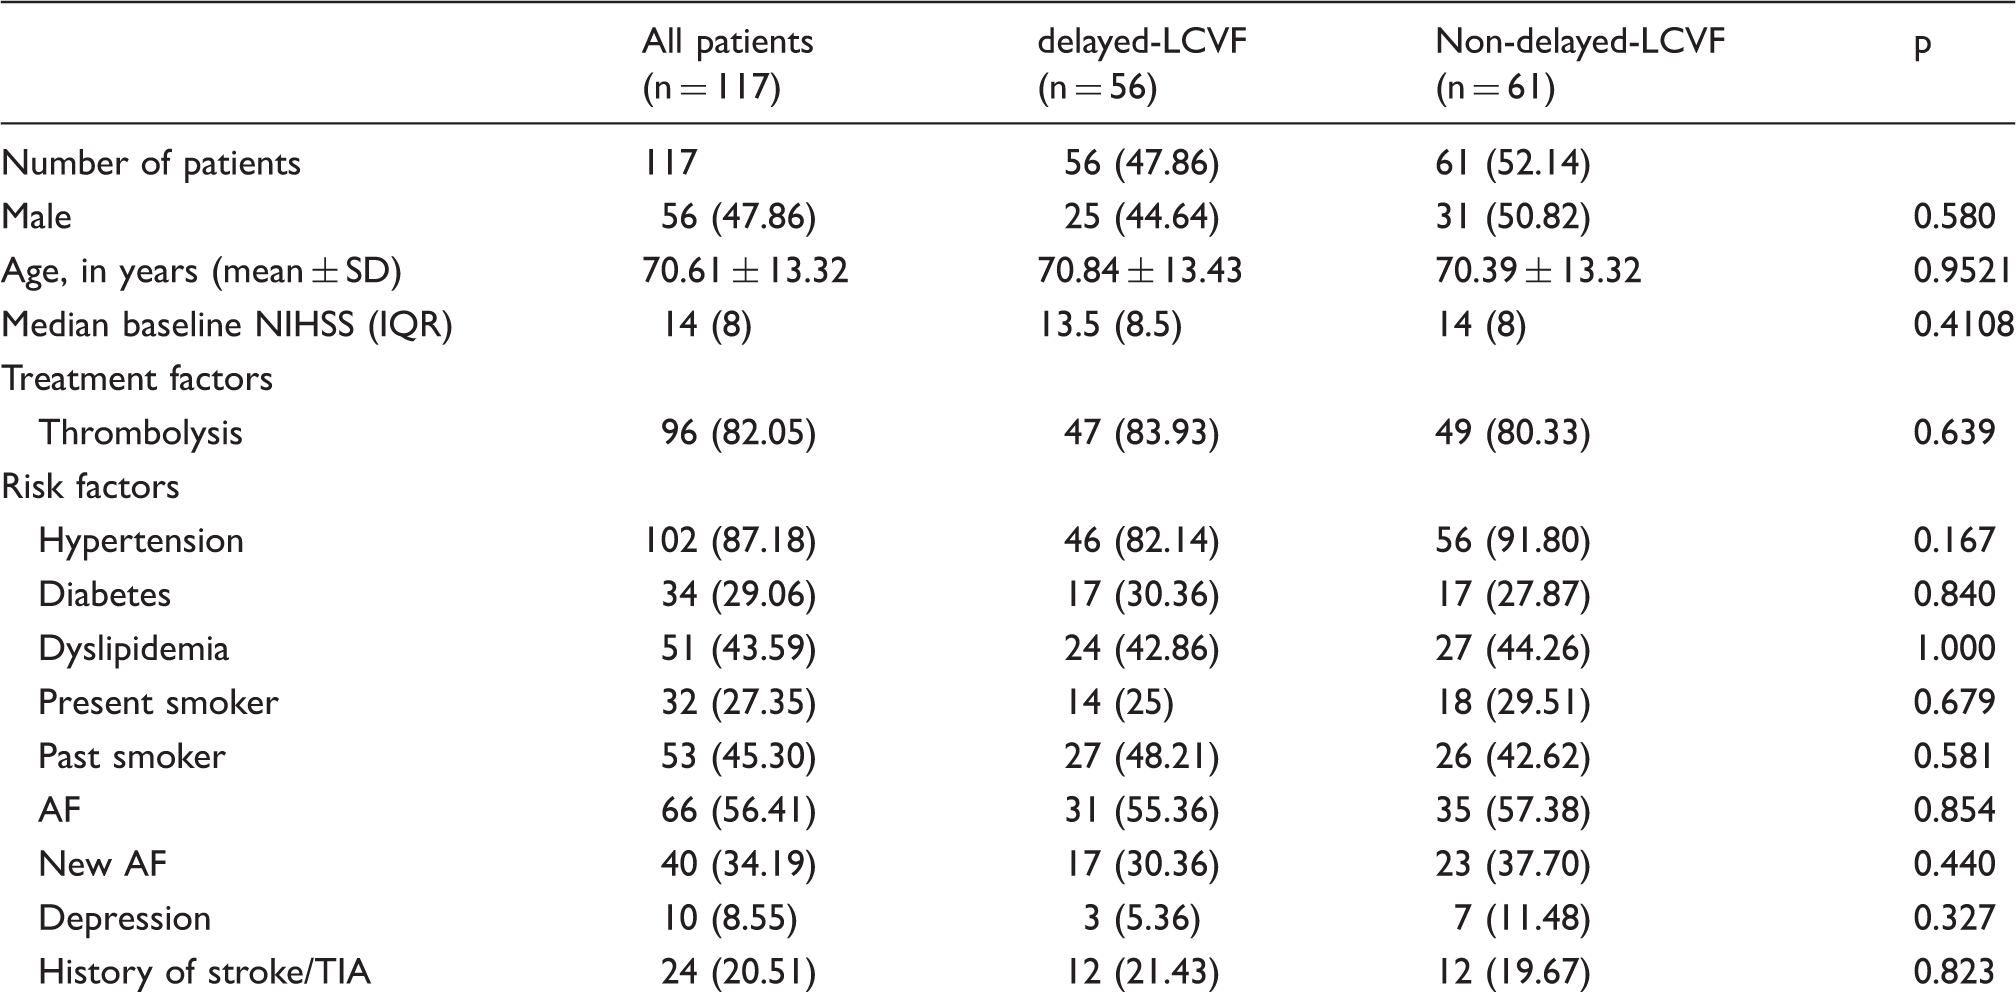
Note: Figures in parentheses are percentages. *p < 0.05 as the threshold for statistical significance.
LCVF: late venous phase cortical vein filling; AF: atrial fibrillation; HT: hemorrhagic transformation; TIA: transient ischemic attack; IQR: inter-quartile range; SD: standard deviation; NIHSS: National Institute of Health Stroke Scale Score.
Delayed-LCVF vs. no-delayed-LCVF
List of imaging findings stratified by late-stage cortical vein filling.
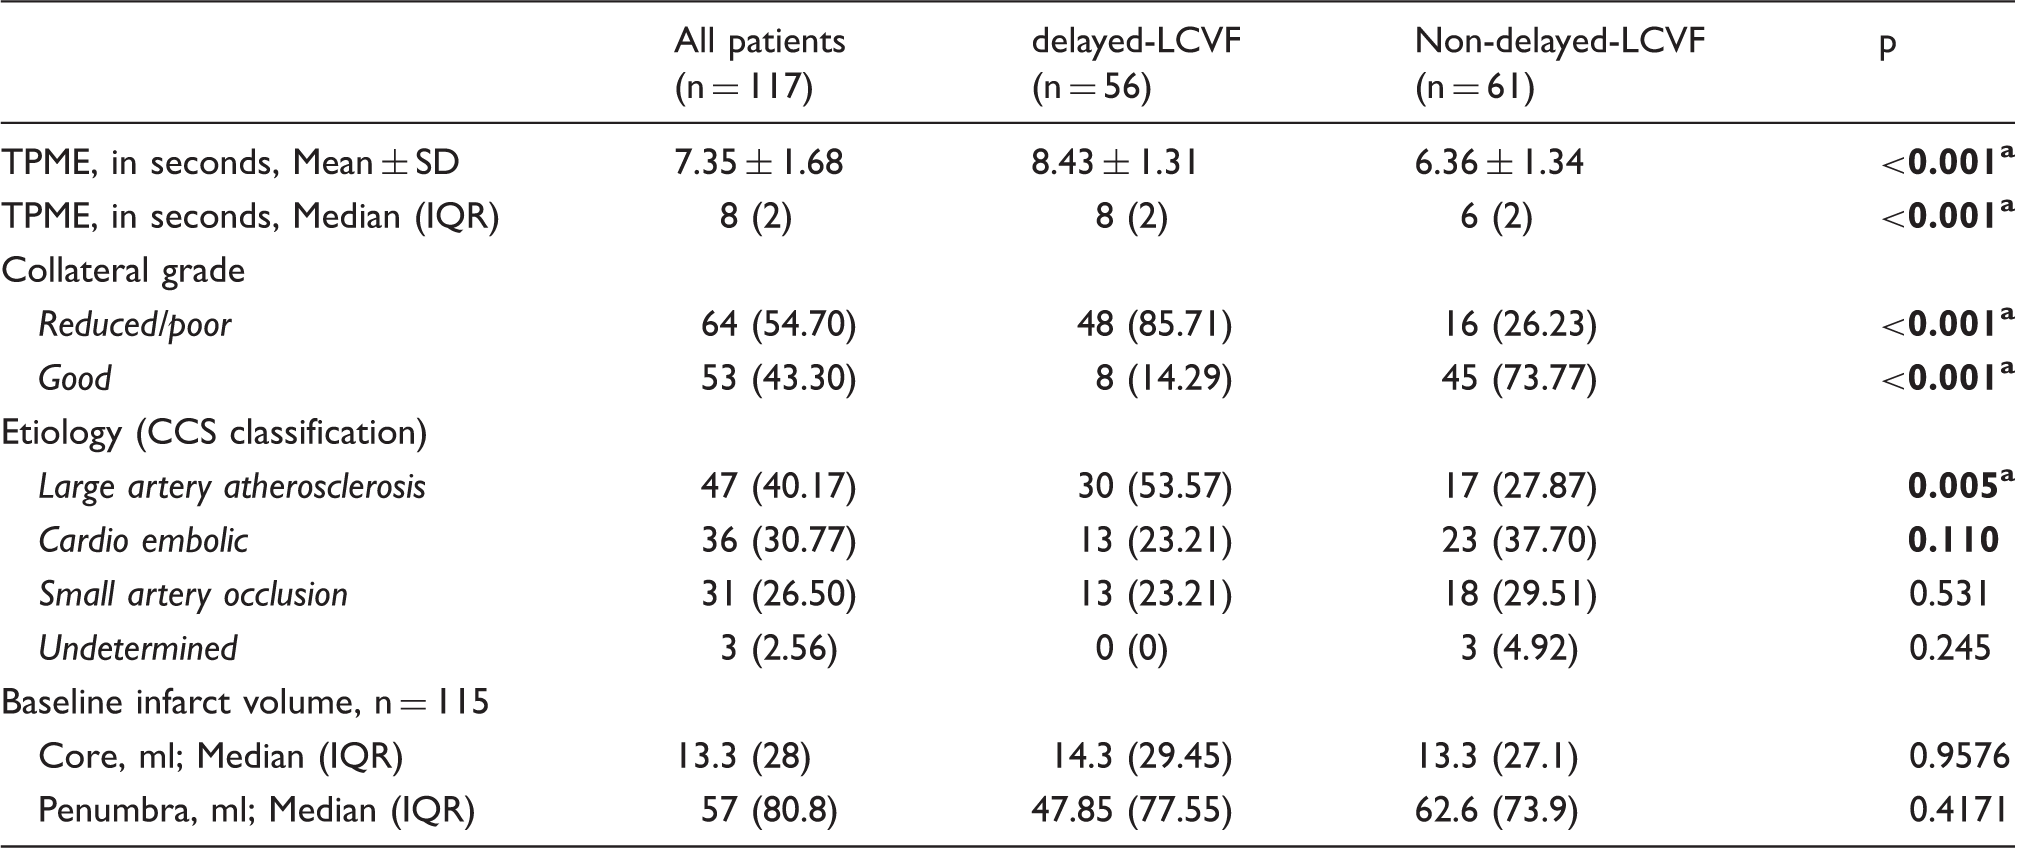
TPME: time to peak of maximum arterial enhancement (in seconds); LCVF: late venous phase cortical vein filling; CCS: Causative Classification of Stroke System; IQR: inter-quartile range.
Note: CCS classification method was used to assess the causative etiological mechanism underlying the stroke event. Figures in parentheses are percentages and those in square brackets are interquartile ranges.
p < 0.05 as the threshold for statistical significance.
Associations with LCVF using univariate logistic regression
Odds ratios (95% confidence intervals) for the association with late venous phase cortical vein filling.
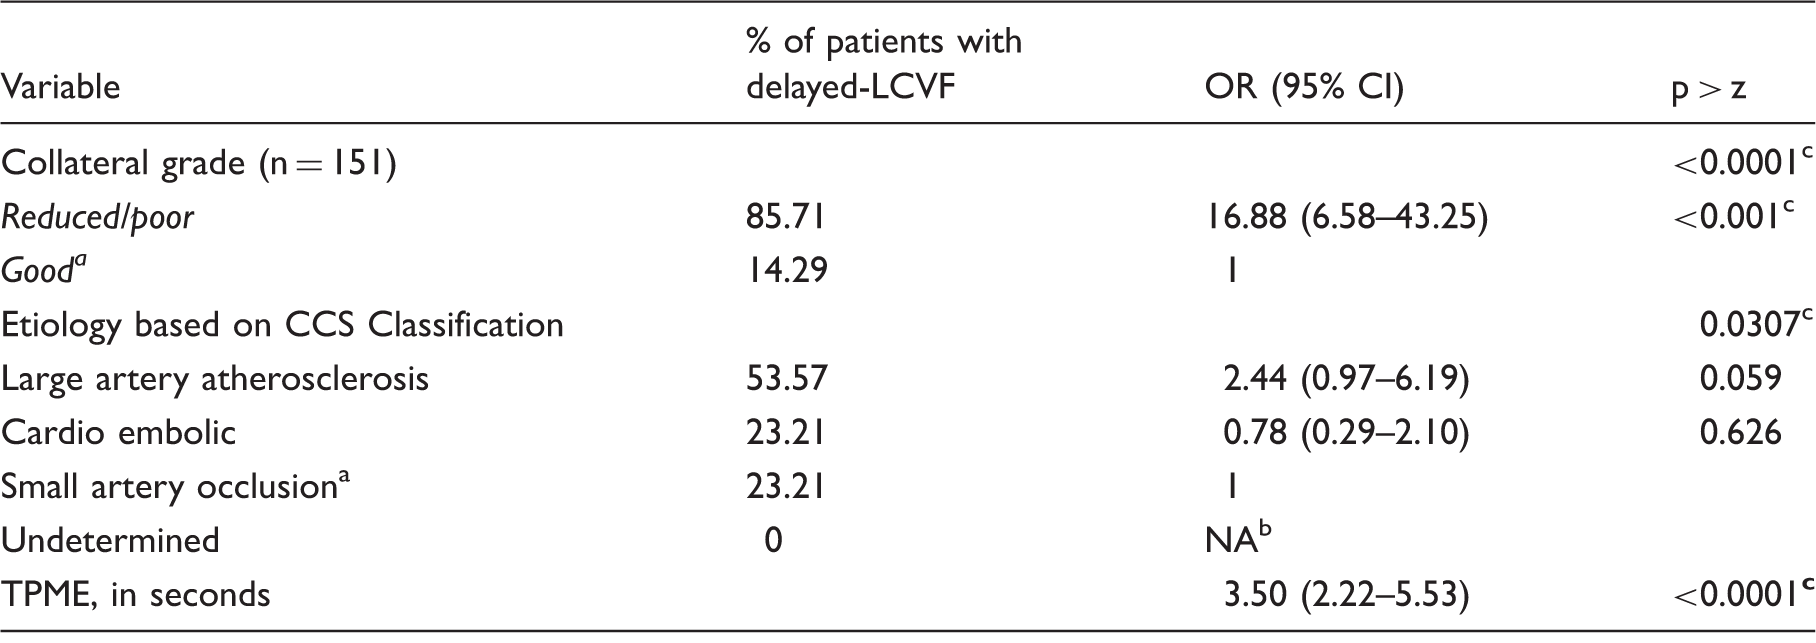
TPME: Time to peak of maximum arterial enhancement (in seconds); LCVF: late venous phase cortical vein filling; CCS: Causative Classification of Stroke System.
Used as reference category.
Not applicable.
p < 0.05 as the threshold for statistical significance.
Covariates with p < 0.1 (TPME, poor collaterals, etiology) were tested for collinearity, and VIF values were found to be less than 5. Therefore, no strong multicollinearity was detected.
Multivariate regression model of associations with delayed-LCVF
Step-wise-backwards multivariate logistic regression analysis showing the association of covariates with delayed-LCVF.
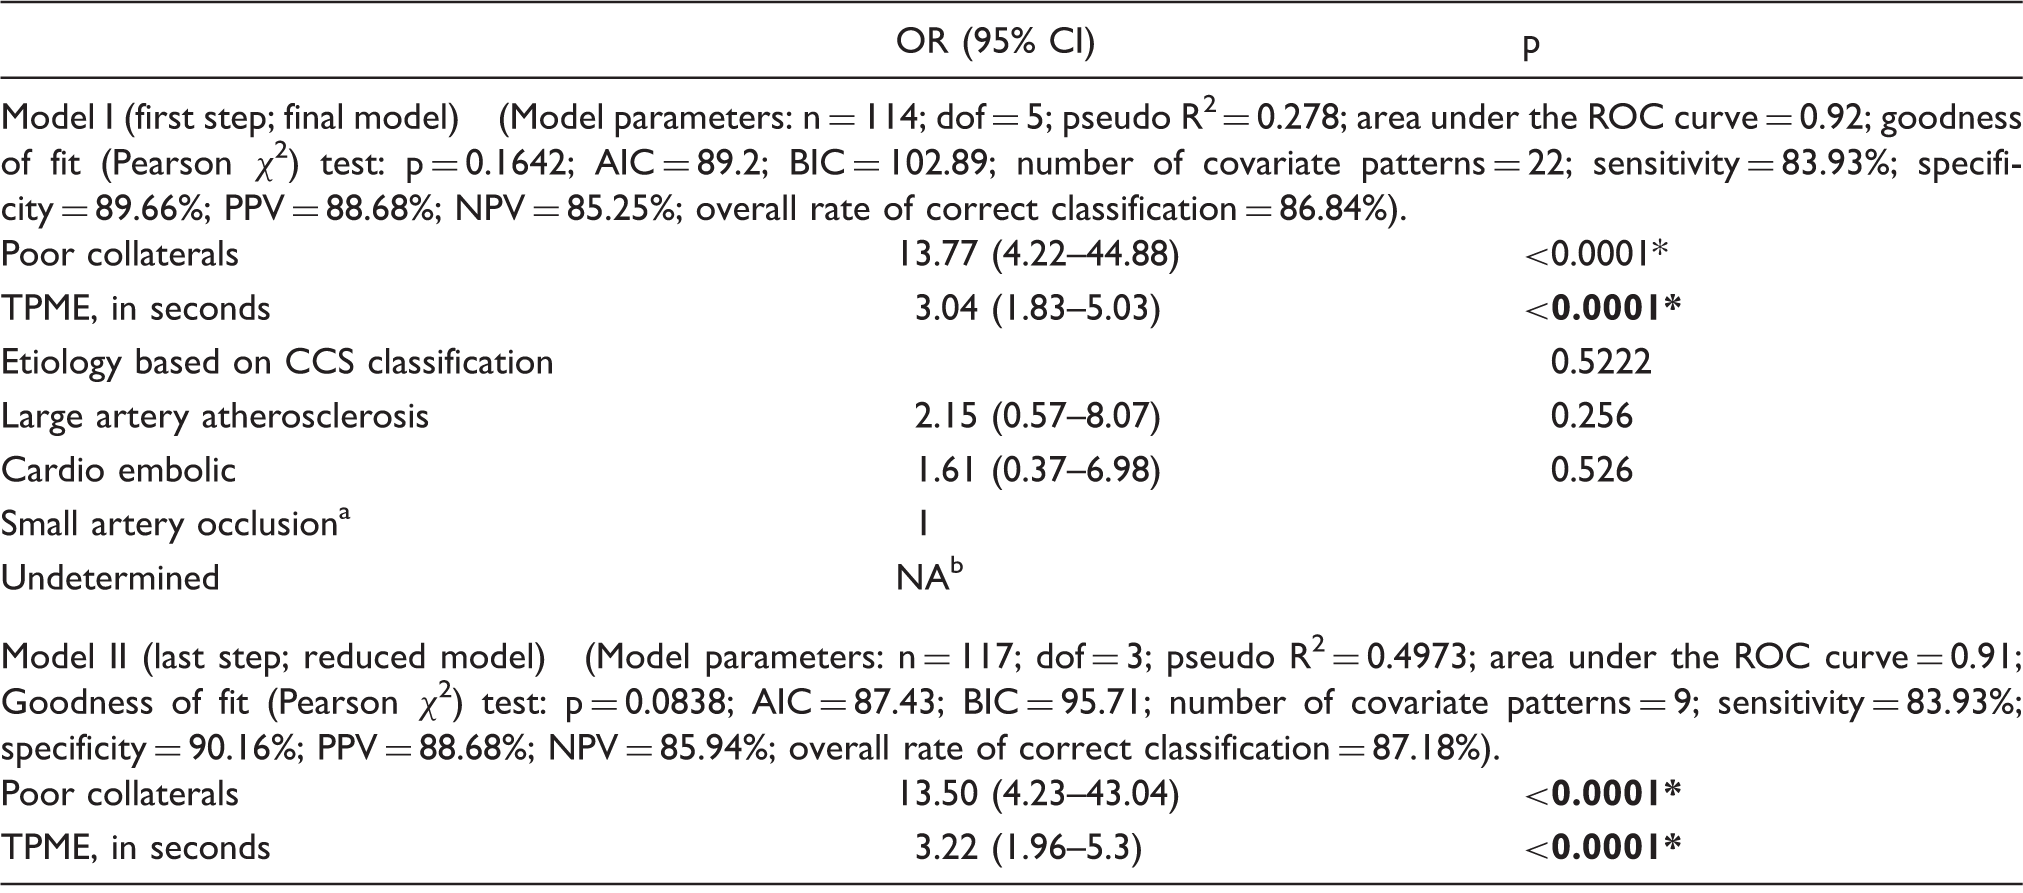
Used as reference category
Not applicable
p< 0.1 for enter and stay criteria. The two multivariate models differed in terms of the particular covariates/factors included. *p < 0.05 as the threshold for statistical significance.
dof: degrees of freedom; AIC and BIC: Akaike and Bayesian information criteria; PPV: positive predictive value; NPV: negative predictive value; ROC: receiver–operator characteristic curve; CI: confidence interval; TPME: time to peak of maximum arterial enhancement (in seconds); LCVF: late venous phase cortical vein filling; CCS: Causative Classification of Stroke System.
Association with poor collateral status
Simple and mixed ORs showing the association of covariates with poor-collateralization.
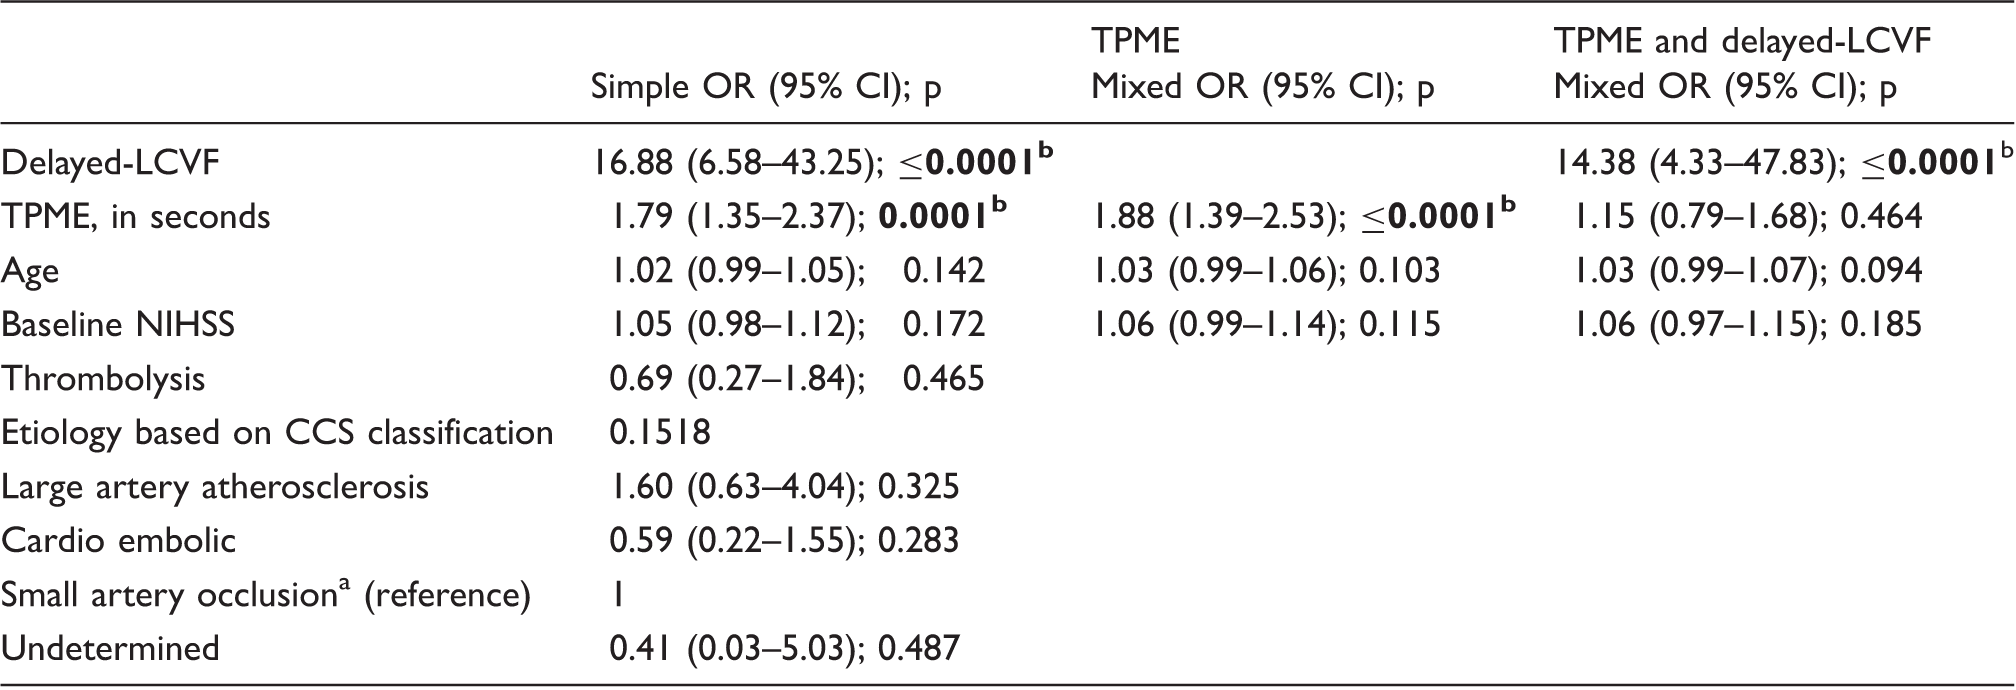
Note: Simple odds ratios (OR) were obtained using univariate logistic regression. Mixed ORs were obtained using multivariate logistic regression analysis using TPME or both TPME and delayed-LCVF while controlling for the effects of age and baseline stroke severity. The multivariate models differed in terms of the particular covariates/factors included.
TPME: time to peak of maximum arterial enhancement (in seconds); LCVF: late venous phase cortical vein filling; CCS: Causative Classification of Stroke System; NIHSS: National Institute of Health Stroke Scale Score.
Used as reference category.
p < 0.05 as the threshold for statistical significance.
Discussion
In this study, we report a novel cortical vein filling pattern observed in the late venous phase on time-resolved dCTA images in acute ischemic stroke patients. To our knowledge, this is the first such study that describes delayed-LCVF. Delayed-LCVF is independently associated with poor baseline collateral status and the morphological extent of baseline collateralization and delay of maximized collateral enhancement were linked with delayed-LCVF. Studies on cortical veins, their role in stroke pathophysiology, and their association with short- and long-term clinical outcomes are limited. Asymmetrically prominent cortical veins, in early or mid-venous phase, have been previously reported in ischemic stroke using T2* and phase-based methods.5,8,9,16,25 A recent study by Xia et al., 26 undertaken in a cohort of acute ischemia, reported reduced levels of oxygen saturation in these abnormal veins using a quantitative susceptibility mapping (QSM) technique. 26 They concluded that the presence of deoxyhemoglobin was the most plausible explanation for the presence of asymmetrically prominent cortical veins.13,27,28 So far, the appearance of delayed LCVF has not been studied in stroke patients.
There is wide variability in the presence of the three variants of cortical veins, often existing in reciprocal relationship with angiographic assessment showing a predominance of one or two of these three veins (see Supplementary Information II for anatomical details of the cranial venous system). 29 Alterations in the venous drainage (increase in venous drainage through secondary pathways), and associated reduction in intracranial compliance have been linked to migraine, 30 mild traumatic brain injury, 31 and multiple sclerosis. 32 Vascular assessment in stroke is predominantly based on examination of the arterial system, and venous correlates of collateral perfusion are usually ignored. Venous circulation accounts for the majority of cerebral blood volume. Increased intracranial pressure may lead to the compression of venules after cerebral ischemia due to brain edema 33 and subarachnoid hemorrhage due to vasospasm of deep cerebral veins. 34 Veins and venules may play a role in acute stroke caused by arterial occlusion/stenosis. 33
Delayed cortical vein filling in late venous phase
As a principal finding of this study, we found that the delayed appearance of cortical vein filling during the late venous phase on baseline time-resolved dCTA images was relatively common in our hyperacute study cohort. In this exploratory study in acute ischemic stroke population, we demonstrate that dCTA provides useful information on the morphologic extent of the collaterals and the collateral blood flow delay. We found that the morphologic extent of the collaterals and the collateral blood flow delay in maximum enhancement (defined in terms of TPME) were independent predictors of delayed-LCVF.
Previous studies have shown that the good collateralization on dCTA predicts a small lesion volume. 35 One of the shortcomings of these studies is that the assessment of collateral status was based on the maximal morphologic extent of collateral vessels over the entire scan time and lacked the temporal information associated with time point of collateral reconstitution. Data on time point of collateral reconstitution and its predictive value are limited.12,18,36 We demonstrate that the time delay in collateral flow provides an additional measure over and above the morphological based assessment. Our study shows that the model using both morphological extent of collateral vessel and the delay in collateral reconstitution showed excellent predictive ability for delayed-LCVF.
Average TPME was significantly greater in delayed-LCVF population. This measurement can provide quantifiable data on the status of arterial and venous flow. The longer the TPME on dCTA, the higher the probability of delayed-LCVF. Longer scanning times could assist in the further characterization of filling defects.
Poor collateral status linked to delayed-LCVF
This study also shows that the baseline delayed-LCVF was independently associated with baseline collateralization status. In multivariate analysis, delay in maximal collateral enhancement or TPME, was significantly associated with morphological extent of the collateral vessels at the baseline, while controlling for the effects of age and baseline stroke severity. However, on addition of delayed-LCVF to the multivariate model, the association of TPME was no longer significantly associated with poor baseline collateralization. Baseline collateral status is considered an important parameter in the evaluation and treatment of cerebral ischemia, 37 and is linked to infarct volume, 38 and functional outcomes.14,21,39 Leptomeningeal collaterals play a pivotal role in maintaining blood flow to brain regions distal to an arterial occlusion, thereby contributing to sustaining brain viability (by allowing survival of ischemic penumbra) and limiting the ischemic core size. 40 In acute stroke settings, good collaterals at baseline are strongly associated with better clinical outcomes as it allows the survival of ischemic penumbra. On the contrary, failure of flow due to the presence of poor collaterals at baseline has been observed in some patients and was found to be linked to infarct growth. 40 A number of plausible mechanisms behind poor collateral status or ‘collateral failure’ have been proposed including rise in intracranial pressure, 41 venous steal, 42 collateral vessel thrombosis, 43 blood pressure fluctuations secondary to autonomic dysfunction, 44 and reversed Robin Hood syndrome. 45 We postulate that a select group of patients with poor collaterals may show presence of delayed-LCVF owing to the slowing of venous outflow in the late venous phase.
Presently, evaluation of collateral status is done qualitatively through visual examination and involves indirect assessment of the extent and rate of backfilling of pial arteries which are fed by collateral vessels to maintain blood flow.12,18,46 As such, a more ‘direct’ measure such as the absence or presence of delayed-LCVF pattern could potentially be used as a more reproducible method to assess collateral status.
Evaluation of venous drainage using dCTA and identification of delayed-LCVF with MIP reconstruction of dCTA source images
Conventional arterial angiography using DSA is considered the gold standard in angiographic evaluation. 47 However, it is expensive, time-consuming, and involves more invasive procedures (cut down to the femoral artery, individualized selection of each vessel, etc.) compared to CTA. Hence, it is not routinely performed in during initial workup of majority of ischemic stroke patients. CTA14,18,41,48,49 and MRA 40 are used in non-invasive assessment of collateralization. CTA offers a relatively low cost, wide availability, less time-consuming, and non-invasive (in comparison to DSA) alternative to patients. However, assessment of collaterals on conventional CTA is dependent on the image acquisition timing. This causes impaired assessment in setting of delayed collateral filling distal to the occluded artery. The development of whole-brain 4D-dCTA on MDCT scanners have made it possible to generate time-resolved angiograms of brain vasculature, in particular the collaterals, from skull base to the vertex. The dCTA harnesses the ability of MDCT scanners to acquire imaging at multiple time points. This technique has demonstrated improved assessment of collaterals by capturing optimal enhancement of collateral vessels, 50 identification of the origin of the dominant collaterals, 18 and quantifying the delay of maximum enhancement.12,36,50 Moreover, dCTA provides additional hemodynamic information (in contrast to conventional cerebral angiogram) by allowing time-resolved visualization of pial arterial filling in all vascular territories.12,50 See Supplementary Information II for a detailed account on applications of CTA in the emergent evaluation of stroke.
Our study shows that dCTA (obtained using 320-detector row 640-slice MDCT scanners) with appropriate reconstructions using an MIP algorithm can be used to investigate venous dynamics or various stages of downstream venous flow. Evaluation of MIP reconstructions of CTA images as a part of routine stroke imaging can provide additional insights into the venous dynamics, and identification of special drainage patterns such as asymmetric prominent cortical veins during the early and mid-venous phase and delayed-LCVF appearance in late venous phase.
Limitations
We acknowledge that this study has few limitations, and these data must be interpreted in the context of the study design. Although our study cohort was comparatively larger or at par to many similar studies focussing on cerebral veins, the number of patients was still small. However, we believe that the use of large cohort of consecutive acute ischemic stroke patients and our standardized treatment regimen for patients admitted to our comprehensive stroke centre would have arguably minimized this problem. The assessment of delay in maximized enhancement may have been influenced by additional occlusions distal to the M1 segment and variations in the prominences of M2, M3 and M4 trunks. The data may be influenced by the differences in the filling time of collaterals in different areas of the MCA territory. 12 However, since we recorded the delay in maximized collateralization enhancement all the way through to M4 (tracing M2 and M3 along the way), this discrepancy would not have much of bearing on our final results. We acknowledge that we did not have data on the site of occlusion. We contemplate that the delayed LCVF may not be appreciated in patients with distal MCA occlusions. Therefore, we envisage to investigate this on a larger dataset of patients that are being collected currently – to find out if there exists significant difference between the prevalence of delayed-LCVF in major vessel proximal versus distal occlusion. Future prospective multicenter studies on even larger sample size are recommended for confirming our findings and for investigating the association of this new imaging finding (delayed-LCVF) with penumbra, short-term and long-term functional clinical outcomes.
Conclusion
In summary, we have presented evidence around the appearance of delayed cortical vein filling during the late venous phase, using the reconstruction of baseline dCTA images using MIP and other reformatted formats, in acute ischemic stroke patients. We found that the delayed-LCVF is independently associated with poor baseline collateral status. We also found that the morphological extent of baseline collateralization and delay of maximized collateral enhancement were linked with delayed-LCVF. Future prospective studies with a larger number of patients are needed to establish the role of delayed-LCVF in stroke prognostication. Our study also suggests that MIP reconstructions of dCTA source images are a valuable angiographic tool to evaluate arterial and venous anatomy. Evaluation of drainage patterns and flow dynamics associated with the downstream venous system may be useful in the prognostic management of acute stroke patients.
Footnotes
Funding
The author(s) disclosed receipt of the following financial support for the research, authorship, and/or publication of this article: Hunter Medical Research Institute & University of Newcastle.
Declaration of conflicting interests
The author(s) declared no potential conflicts of interest with respect to the research, authorship, and/or publication of this article.
Authors’ contributions
Contributors SB and CL conceived and designed the study. SB and CL collected and analysed the data. SB, CL and JRA contributed in the data analysis. SB, PS and CL drafted the article, and all authors (SB, CL, PS, AB, JRA, MN, and MP) contributed towards the patient recruitment, study design, data analysis, drafting and revision of the article.