
Abstract
Intracranial hemorrhage remains a devastating disease. Among antiplatelet drugs, cilostazol, a phosphodiesterase 3 inhibitor, was recently reported to prevent secondary hemorrhagic stroke in patients in a clinical trial. The aim of this study was to evaluate whether pre-treatment with cilostazol could decrease the intracranial hemorrhage volume and examine the protective mechanisms of cilostazol. We evaluated the pre-treatment effects of the antiplatelet drug cilostazol on the collagenase-induced intracranial hemorrhage volume and neurological outcomes in mice. To estimate the mechanism of collagenase injury, we evaluated various vascular components in vitro, including endothelial cells, vascular smooth muscle cells, pericytes, and a blood–brain barrier model. Cilostazol pre-treatment reduced the intracranial hemorrhage volume with sufficient inhibition of platelet aggregation, and motor function was improved by cilostazol treatment. Blood–brain barrier permeability was increased by collagenase-induced intracranial hemorrhage, and cilostazol attenuated blood–brain barrier leakage. Terminal deoxynucleotidyl transferase dUTP nick-end labeling and western blot analysis showed that cilostazol prevented pericyte cell death by inducing cyclic adenosine monophosphate-responsive element-binding protein phosphorylation. Cilostazol also prevented endothelial cell death and protected collagen type 4, laminin, and vascular endothelial- and N-cadherins from collagenase injury. In conclusion, cilostazol reduced collagenase-induced intracranial hemorrhage volume by protecting the blood–brain barrier.
Introduction
Intracranial hemorrhage (ICH) accounts for 7–20% of all cases of stroke, with an overall 1-month mortality rate of 42%. 1 At present, one-third of all ICH occurs in patients taking antiplatelet drugs to treat cerebrovascular diseases. 2 However, whether pre-treatment with antiplatelet drugs increases hematoma volume or worsens the prognosis in patients with ICH remains controversial. 3
Complete reproduction of spontaneous ICH has not yet been achieved in an animal model. However, with regard to hematoma expansion, the collagenase-induced ICH model mimics several aspects of human ICH. 4 Because hematoma expansion following ICH is considered to result from elevated local concentrations of collagenase released by injured cells,5,6 this simple and easily reproducible model is suitable for evaluating hematoma expansion. Importantly, mutation of collagen type 4 alpha 1 (COL4A1) or alpha 2 (COL4A2) is associated with recurrent ICH, indicating that collagen impairment is associated with ICH.7–9 Another advantage of this model is that hemorrhage occurs at in situ vessels.
Oral pre-treatment with antiplatelet drugs (aspirin and/or clopidogrel) in drinking water did not increase ICH volumes or worsen the functional outcome using the collagenase-induced ICH model. 10 Similarly, Mihara et al. 11 administered low to high aspirin doses and the glycoprotein IIb/III antagonist FK419 to guinea pigs and did not observe increased ICH volumes. To our knowledge, only the two reports mentioned above have evaluated the association between pre-treatment with antiplatelet therapy and ICH volume. The results of these studies indicated that pre-treatment with antiplatelet drugs does not increase hematoma expansion in ICH.10,11
The antiplatelet drug cilostazol has been approved for use as a vasodilating antiplatelet drug for treating ischemic symptoms in chronic peripheral arterial obstruction or intermittent claudication and for the secondary prevention of cerebral infarction. Cilostazol is a phosphodiesterase 3 inhibitor that also exhibits antioxidative and vasodilation effects by increasing intracellular cyclic adenosine monophosphate (cAMP) and endothelial nitric oxide synthase activity. In addition, cilostazol protects vascular endothelial (VE) cells against oxidative stress, 12 prevents endothelin-induced smooth muscle constriction and proliferation, 13 and reduces hemorrhagic transformation by protecting the endothelium and pericytes, which are components of the neurovascular unit (NVU), 14 or by protecting the tight junction proteins. 15 Furthermore, cilostazol was recently reported to be more effective than aspirin in the secondary prevention of all types of stroke, especially secondary hemorrhagic stroke in the CSPS 2 trial. 16 Cilostazol was also reported to reduce stroke recurrence, post-stroke ICH, and extracranial bleeding in a meta-analysis. 17
On the other hand, cilostazol has attracted attention with regards to its potential to prevent restenosis in clinical situations. Cilostazol reduces angiographic restenosis after endovascular therapy for femoropopliteal lesions. 18 In coronary disease, the addition of cilostazol to conventional dual antiplatelet therapy reportedly reduces the risk of cardiac events and restenosis after drug-eluting stent implantation.19,20 The prevention of restenosis is thought to result from the protective effect of cilostazol on the endothelium. In addition to these reports, cilostazol reportedly has the potential to suppress cognitive decline in patients receiving donepezil with mild dementia. 21
The pleiotropic effects of cilostazol on vascular smooth muscle cells, the endothelium, pericytes, and tight junctions may reduce the incidence of hemorrhagic complications. The aims of this study were to test whether cilostazol pre-treatment would reduce ICH volume, and to evaluate the mechanism by which cilostazol protects against collagenase-induced injury in an in vitro co-culture model.
Methods
Animals and experiments
All animal protocols were conducted in accordance with the ARRIVE (Animal Research: Reporting In Vivo Experiments) guidelines and were approved by the animal experiment committees of Gifu Pharmaceutical University, Japan. Male ddY mice (Japan SLC, Ltd., Hamamatsu, Japan) aged 11 to 12 weeks with a mean body weight of 40 ± 2 g were used. Animals were housed at 24 ± 2℃ under a 12-h light–dark cycle. Food and water were available to all animals ad libitum. All experimental procedures and outcome assessments were performed in a blinded manner.
In vivo study design
We used a total of 156 mice in this study; a schematic of the design is shown in Supplemental Figure 1. We used 30 mice for the tail bleeding tests, 36 mice for the platelet aggregation tests, 30 mice for the plasma concentration tests, and 60 mice in the collagenase-induced ICH model.
Confirmation of antiplatelet effects and plasma concentrations of cilostazol. (a) Tail bleeding volumes measured by the hemoglobin assay. Student’s t-test, n = 10/group. (b) Plasma concentrations of cilostazol after drug administration (n = 3). (c,d) Results of the ex vivo platelet aggregation tests measured by light transmission aggregometry. Induction by 20 µg/mL collagen (c) and 20 µM ADP (d). *p < 0.05, **p < 0.01 vs. vehicle. A total of 12 animals were tested per group.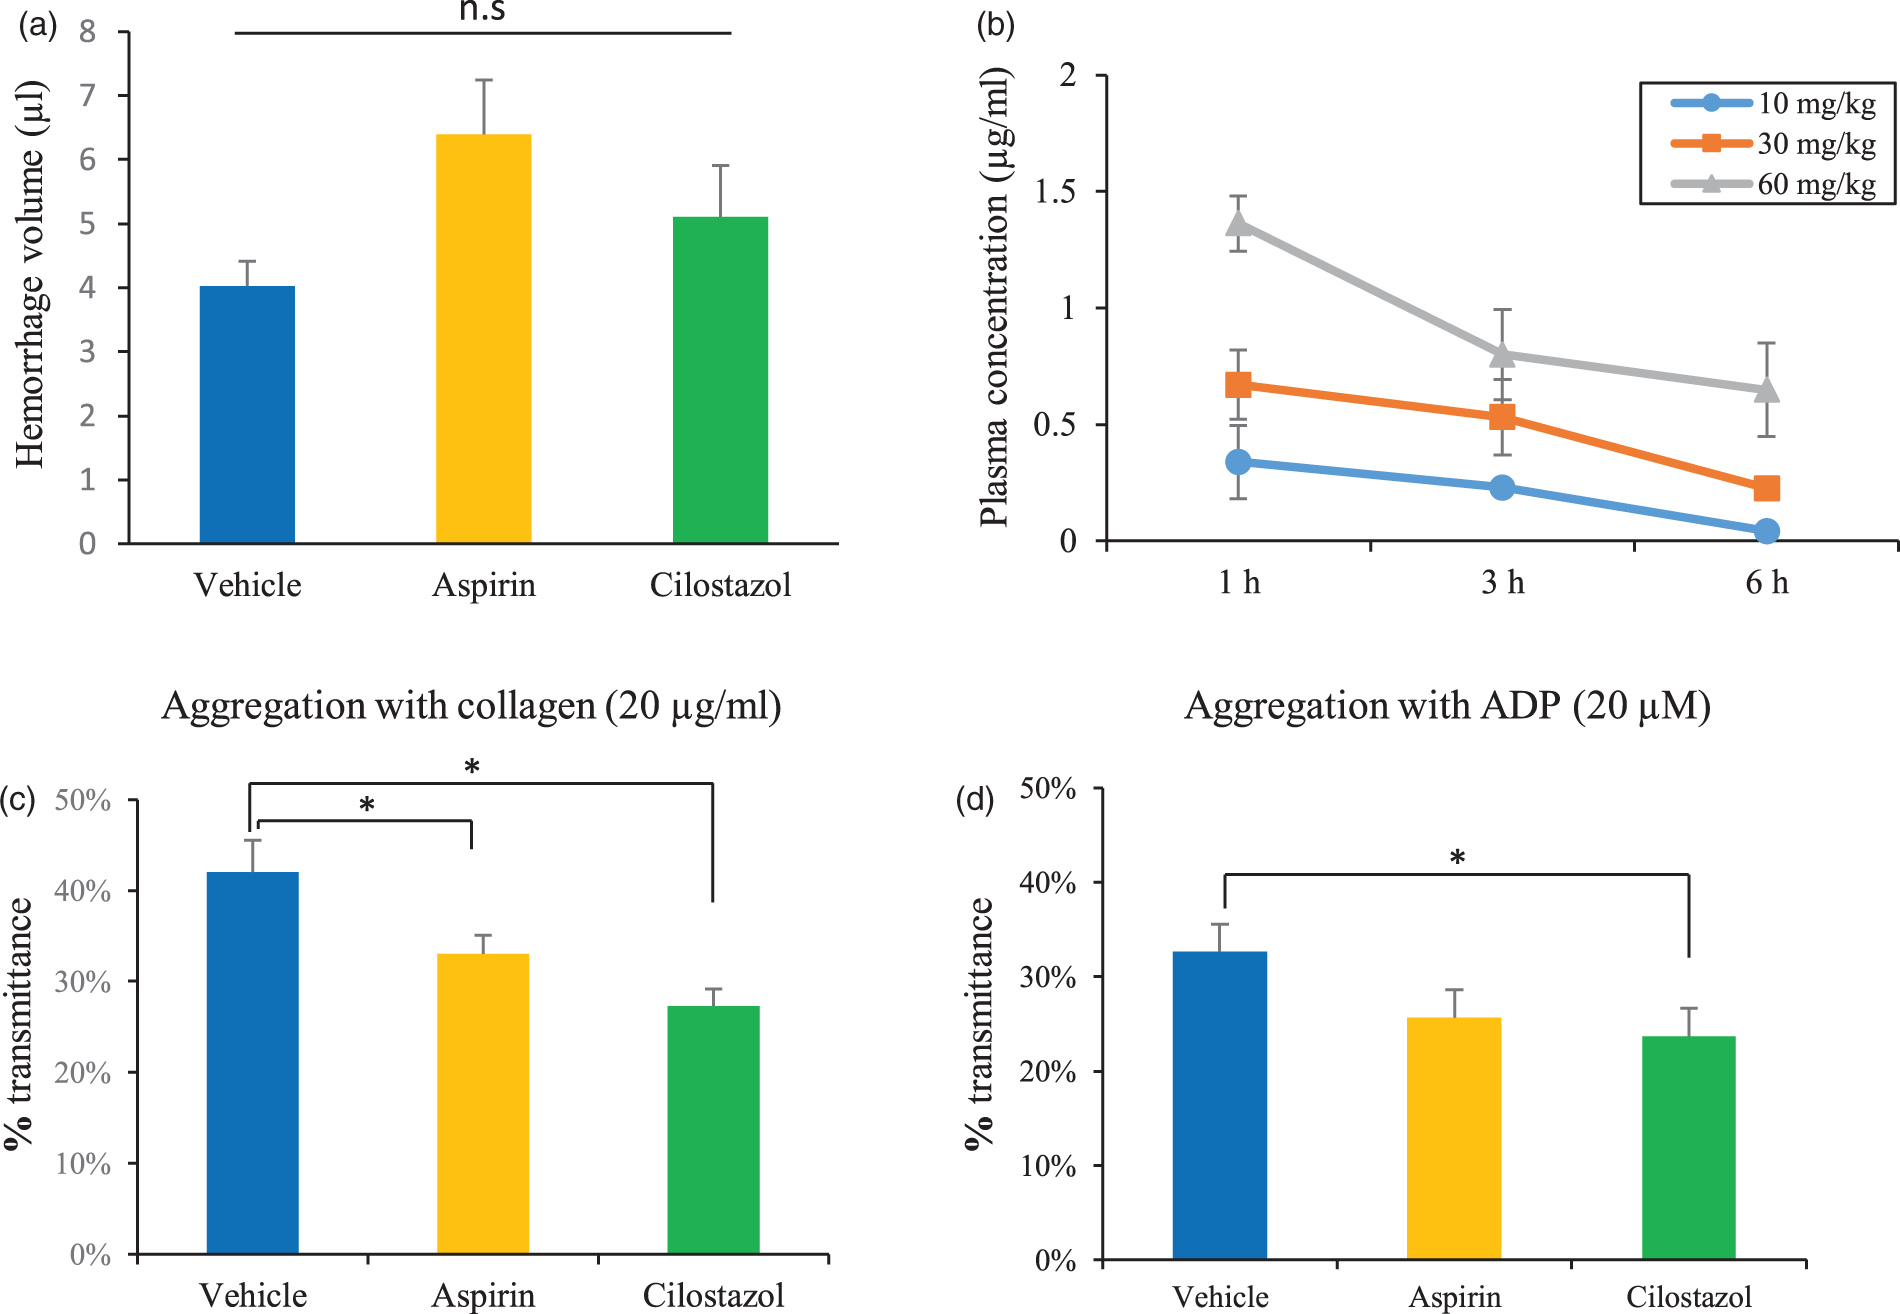
Antiplatelet treatment
Mice were randomly assigned to three groups receiving either vehicle (0.5% carboxymethylcellulose), 60 mg·kg−1·day−1 aspirin (Wako Pure Chemical Industries, Ltd., Osaka, Japan), or 30 mg·kg−1·day−1 cilostazol (Otsuka Pharmaceutical Co., Ltd., Tokyo, Japan) for 3 days. These dosages were selected based on previous experimental studies.10,22
In vivo analysis of platelet adhesion
The mice were anesthetized with 1.5% isoflurane (in 80% N2O/20% O2) by using an animal general anesthesia machine (Soft Lander; Sin-ei Industry Co., Ltd., Saitama, Japan). Cilostazol was administered 3 h before anesthesia induction. Body temperature was maintained at 37 to 37.5℃ with the aid of a heating pad and heating lamp. The distal tip of the tail was cut at 4 mm using a scalpel blade. The tail was immediately inserted into a tube containing 1 mL pre-warmed (37℃) phosphate-buffered saline (PBS). After 3 min, the tube was vortexed for homogenization, and the solution was centrifuged for 30 min at 13,000 rpm. Then, 50 µL of the supernatant was transferred to 200 µL of reagent (QuantiChrom Hemoglobin Assay Kit; BioAssay Systems, Hayward, CA, USA). After 15 min, the optical density was read at 400 nm with a spectrophotometer (Skan It RE for Varioskan 133 Flash 2.4; Thermo Fisher Scientific, Waltham, MA, USA). Hemoglobin levels were calculated using a standard curve.
Ex vivo platelet aggregation test
Platelet aggregation was evaluated using light transmission aggregometry (LTA) as described previously. 14 Whole blood was collected from deeply anesthetized mice by cardiac puncture using a 22-G needle. Blood volume from four mice (a total of 4 mL) per group was pooled into 5-mL tubes containing 0.3 mL 3.8% sodium citrate. Platelet-rich plasma was prepared from these pooled samples by centrifugation at 155 × g for 12 min at room temperature. Platelet-poor-plasma was prepared from residual blood by centrifugation at 1400 × g for 5 min. Aggregation was initiated by adding 20 µg/mL collagen (Nycomed Austria Gmbh, Linz, Austria) or 20 µM adenosine 5’-diphosphate (ADP; Sigma-Aldrich Co., St. Louis, MO, USA) to 225 mL of platelet-rich plasma. Platelet aggregation was analyzed using an aggregometer (PA200 apparatus, Kowa Co., Ltd., Tokyo, Japan) by recording light transmission. Specimens were continuously mixed with a stir bar and kept at 37℃ during aggregation measurements.
ICH induction
Animals were randomly divided into three groups, and the operator was blinded to the treatment status of the animals. ICH induction was performed 3 h after the last administration of antiplatelet agents in consideration of the antiplatelet effect of cilostazol. The mice were anesthetized with 2.0 to 2.5% isoflurane (Mylan Inc., Canonsburg, PA) with a facemask (The Univentor 400 Anesthesia Unit, Bioresearch Center Co., Ltd., Nagoya, Japan). To maintain similar circulation conditions, the depth of anesthesia was adjusted by achieving a 50% reduction in respiratory rate. Heart rate (HR) and blood pressure were monitored using a Non-Invasive Blood Pressure Monitor for Mice (MK-2000ST, Muromachi Kikai Co., Ltd., Tokyo, Japan). Body temperature was maintained with the aid of a heating lamp. After a small burr hole was drilled, a 32-G 0.5-mL injection needle (Hamilton, 7000 series, Hamilton, Reno, NV, USA) was slowly inserted into the right striatum. The injection point was 0.0-mm anterior and 2-mm lateral to the bregma at a depth of 3.5 mm. Then, 0.45 units (U) collagenase VII-S (Sigma-Aldrich) in 0.5 µL saline was administered over a period of 5 min. The needle was left in place for 10 min and then slowly removed over 5 min as described previously. 10
ICH volume quantification
After neurological assessment, the mice were intraperitoneally injected with an overdose of pentobarbital sodium and transcardially perfused with cold saline for 3 min. The brains were removed immediately, and a 2 - to 10-mm portion of the forebrain was excised. After removal, the brains were placed in glass tubes containing 300 µL of PBS. After 30 s of homogenization using a disperser, the solution was centrifuged for 30 min at 13,000 × g. Next, 50 µL of the supernatant was transferred to 200 µL of reagent (QuantiChrom Hemoglobin Assay Kit; BioAssay Systems). After 15 min, the optical density was read at 400 nm using a spectrophotometer (Skan It RE for Varioskan 133 Flash 2.4; Thermo Fisher Scientific), and hemoglobin levels were calculated using a standard curve.
Neurological assessments
All behavioral tests were conducted in a quiet and dimly lit room 24 h after ICH induction by an experimenter blinded to the treatment groups. Neurological outcomes were rated using the Garcia score as described previously. 23 The Garcia score (3−18) was calculated by combining the scores on the following six tests: spontaneous activity, symmetry in the movement of all four limbs, forepaw outstretching, climbing, body proprioception, and response to vibrissae touch. Each test had three possible points according to the neurological presentation.
In addition, the grid walk test was performed to evaluate the animals’ abilities to accurately place their forepaws on the rungs of a grid during spontaneous movement. 24 The mice were placed on a grid of 0.24 mm (length, width) with 10 mm2 openings and allowed to explore freely for 2 min. Step errors were assessed and videotaped by a camera placed under the grid. We counted a step error when the limb or foot slipped through the grid hole. The step failure percentage of the affected side was also calculated.
Cell cultures and incubation
Human brain microvascular endothelial cells (HBMVECs) (Cell Systems, Kirkland, WA, USA), human brain vascular smooth muscle cells (HBVSMCs) (Primary Cell, Japan, Kyoto, Japan), and human brain vascular pericytes (HBVP) (Primary Cell) were cultured in 100-mm dishes in HuMedia EG2 (Kurabo, Osaka, Japan) supplemented with 10% heat-inactivated fetal bovine serum (FBS), Smooth Muscle Cell Medium (Primary Cell), or Pericyte medium (Primary cell), respectively, at 37℃ under a humidified 5% CO2 atmosphere until they reached 80% confluence. Cells were seeded on the upper side of the collagen- and fibronectin-coated polyester membranes (0.4 -µm pore size) of Transwell inserts® (Corning Incorporated Life Sciences, Corning, NY, USA) in 24-well culture plates and cultured until they reached confluence with replacement of culture medium every 2 days.
Co-culture model for vascular structure and preparation
We used a triple co-culture model termed the BBB Kit™, which consists of endothelial cells, pericytes, and astrocytes (RBT-24H, PharmaCohee-Cell Company, Ltd., Nagasaki, Japan) as described previously. 25 This model is reconstructed by culturing both primary rat brain microvascular endothelial cells and rat brain pericytes separated by a macroporous Millicell membrane (24 wells, pore size: 3.0 µm; Millipore, Billerica, MA, USA) pre-cultured with rat astrocytes to support the tight junctions. We incubated the BBB kit at 37℃ in 5% CO2 for 5 days to establish strong tight junctions as reported previously. 25
Evaluation of membrane permeability
We mimicked vessel wall collapse with membrane permeability assessments of vessel components in an in vitro study. Membrane permeability was evaluated by two methods: trans-endothelial electrical resistance (TEER) and fluorescein isothiocyanate (FITC)-dextran permeability. To evaluate the functionality of the membrane barrier, we measured TEER using an Epithelial Volt-Ohm Meter (Millicell ERS-2, Millipore) and a cup-shaped electrode (Endohm-6, World Precision Instruments, Inc., Sarasota, FL, USA). TEER reflects the flux of sodium ions through the cell layer, and real-time changes in TEER were monitored using this system. We also assessed the permeability of FITC-dextran to evaluate membrane permeability. The online-only Data Supplement provides further details of the TEER measurement and FITC-dextran assay.
Drug treatment in vitro
After incubation of the BBB kit for 6 days, the medium was discarded, and we exposed the cells to the medium containing cilostazol (3 or 10 µM) or the cell-permeable cAMP analog dibutyryladenosine-cyclic monophosphate sodium salt (db-cAMP, Sigma-Aldrich, 100 µM) for 24 h. In pericyte monocultures, confluent cells were exposed to cilostazol or db-cAMP for 24 h. Different concentrations of collagenase were added 24 h after drug treatment for 3 h.
TEER measurement and FITC-dextran assay
After the estimation of pre-TEER, the medium was exchanged and collagenase-VII was added at different concentrations (1, 10, 30, and 100 U/mL). In the analysis using the BBB kit, the well was excluded if pre-TEER was less than 150 Ω cm2. At 2 h after collagenase administration, the medium in the cell culture inserts (Transwell) was exchanged for medium containing FITC-dextran (1 mg/mL, Sigma-Aldrich), and the BBB kit was incubated for 1 h at 37℃ under 5% CO2. After incubation, the cell culture inserts were carefully removed, and TEER was measured. We then collected the medium from both the apical and basolateral sides of the BBB model. After stirring, 50 µL of each sample was added to 950 µL PBS, and 100 µL of each was placed in a 96-well microplate. Then, fluorescent signals were measured using a Varioskan Flash 2.4 microplate reader (Varioskan Flash 2.4, Thermo Fisher Scientific) at 485 (excitation) and 530 nm (emission).
For TEER measurement, the extracellular matrix (ECM)-treated Transwell inserts were placed in a 24-well plate containing culture medium to measure the background resistance. The resistance of blank filters (background) was subtracted from the filters with cells. TEER values are given as Ω × cm2, and the data indicate the rate of change in TEER before and after treatment. Membrane permeability was evaluated as the apparent permeability coefficient (Papp), which is calculated by the following formula, as reported previously:
26

Western blotting
The preparation and procedure details have been reported previously. 27 Cells were lysed in radioimmunoprecipitation assay buffer (Sigma-Aldrich) containing 1% protease inhibitor cocktail and 1% of each of the phosphatase inhibitor cocktails 2 and 3 (Sigma-Aldrich) and harvested. Protein concentrations were measured using a bicinchoninic acid Protein Assay Kit (Thermo Scientific) with a bovine serum albumin standard. Thereafter, equal volumes of protein sample and sample buffer were mixed, and the samples were boiled for 5 min at 95℃. The samples (2 µg protein/well) were subjected to 5–20% sodium dodecyl sulfate–polyacrylamide gradient gel electrophoresis and then transferred to polyvinylidene difluoride membranes (Immobilon-P, Millipore). For immunoblotting, the following primary antibodies were used: rabbit anti-collagen IV antibody (1:1000 dilution; Abcam, Cambridge, UK), rabbit anti-laminin antibody (1:1000 dilution, Abcam), rabbit anti-N-cadherin antibody (1:1000 dilution, Abcam), rabbit anti-cleaved caspase-3 antibody (1:1000 dilution; Cell Signaling Technology, Danvers, MA, USA), rabbit anti-phosphorylated cAMP responsive element-binding protein (p-CREB) antibody (1:1000 dilution, Cell Signaling Technology), rabbit anti-occludin antibody (1:250 dilution, Santa Cruz Biotechnology, Santa Cruz, CA, USA), rabbit anti-VE-cadherin antibody (1:1000 dilution, Cell Signaling Technology), and β-actin mouse monoclonal antibody (1:2000 dilution, Sigma-Aldrich). Horseradish peroxidase (HRP)-conjugated goat-anti-rabbit antibody and HRP-conjugated goat-anti-mouse antibody (both from Pierce Biotechnology, Rockford, IL, USA) were used as secondary antibodies. Immunoreactive bands were visualized using Immunostar-LD (Wako) and an LAS-4000 luminescent image analyzer (Fuji Film Co., Ltd., Tokyo, Japan). Expression level differences were analyzed with ImageJ software version 1.43 h (National Institutes of Health, Bethesda, MD, USA) by measuring band intensities.
Terminal deoxynucleotidyl transferase dUTP nick end labeling (TUNEL)
TUNEL was performed according to the manufacturer’s protocols (In Situ Cell Death Detection kit; Roche Diagnostics, Mannheim, Germany) as described previously. 27 Briefly, cells were fixed in a freshly prepared 4% paraformaldehyde solution for 1 h and then blocked in 3% H2O2 in methanol for 10 min. Cells were further permeabilized in 0.1% Triton X-100 in citric sodium for 2 min on ice. Cells were then incubated with terminal deoxyribonucleotidyl transferase enzyme at 37℃ for 1 h and subsequently incubated with an anti-fluorescein antibody peroxidase conjugate in a humidified chamber for 30 min. Next, the reaction was developed using diaminobenzidine tetrahydrochloride peroxidase substrate. Light microscope images were photographed in five areas per well, and the number of TUNEL-positive cells was counted.
Statistical analysis
All values are expressed as the mean ± the standard error of the mean (SEM). Quantitative variables were statistically analyzed using Student’s two-tailed t-tests for two-group comparisons, Wilcoxon signed-rank tests for non-parametric values, and one-way analyses of variance (ANOVAs) followed by Dunnett’s test for multiple pair-wise comparisons. The p values less than 0.05 were considered statistically significant. All statistical analyses were performed using JMP 10 software (SAS Institute Inc., Cary, NC, USA).
Results
In vivo and ex vivo platelet aggregation
To confirm the effects of the antiplatelet agents, tail bleeding volumes and ex vivo platelet aggregation tests were assessed 3 h after the last drug administration. Tail bleeding volumes were not significantly increased in the aspirin group (6.4 ± 0.8 µL) or cilostazol group (5.1 ± 0.8 µL) compared with the vehicle group (4.0 ± 0.4 µL) (Figure 1(a)). Platelet aggregation was evaluated by LTA. Compared with the vehicle group (42 ± 3.5%), platelet aggregation with 20 µg/mL collagen was significantly inhibited in both the aspirin (33 ± 2.1%) and cilostazol groups (27 ± 1.9%) (n = 3/group, p < 0.05, vs. vehicle; Figure 1(c)). According to the analysis on the size of platelet aggregates, small aggregates (9–25 µm) were increased in the aspirin and cilostazol groups (Supplemental Figure 2). Conversely, platelet aggregation with 20 µM ADP was inhibited significantly by cilostazol (24 ± 3.0%) compared with vehicle (33 ± 2.8%), but was not affected by aspirin (26 ± 3.0%) (Figure 1(d)). These results indicate that administration of 60 mg/kg aspirin or 30 mg/kg cilostazol was sufficient to inhibit platelet aggregation, but did not significantly increase the tail hemorrhage volume.
ICH volume and neurological assessments. (a) Study protocol; (b) a representative hemorrhage from each group is shown in the upper panel. The bottom graph shows the hematoma volume 24 h after hemorrhage induction as measured by hemoglobin quantification. *p < 0.05 vs. vehicle, #p < 0.05 vs. aspirin, Student’s t-test, n = 18–19. (c) Neurological outcomes assessed by the Garcia test (n = 13–14). (d) Results of the grid walk test. The number of forepaw failures was counted for 2 min. *p < 0.05 vs. vehicle, Wilcoxon test, n = 13–14. (e) Permeability of FITC-dextran 3 h after ICH induction. The images on the left show typical FITC leakage, with the green color indicating FITC-dextran. The graph on the right shows the results of the statistical analysis of the FITC leakage. *p < 0.05, **p < 0.01 vs. control, Dunnet’s comparison test; #p < 0.01 vs. vehicle, Student’s t-test, n = 4 for each group.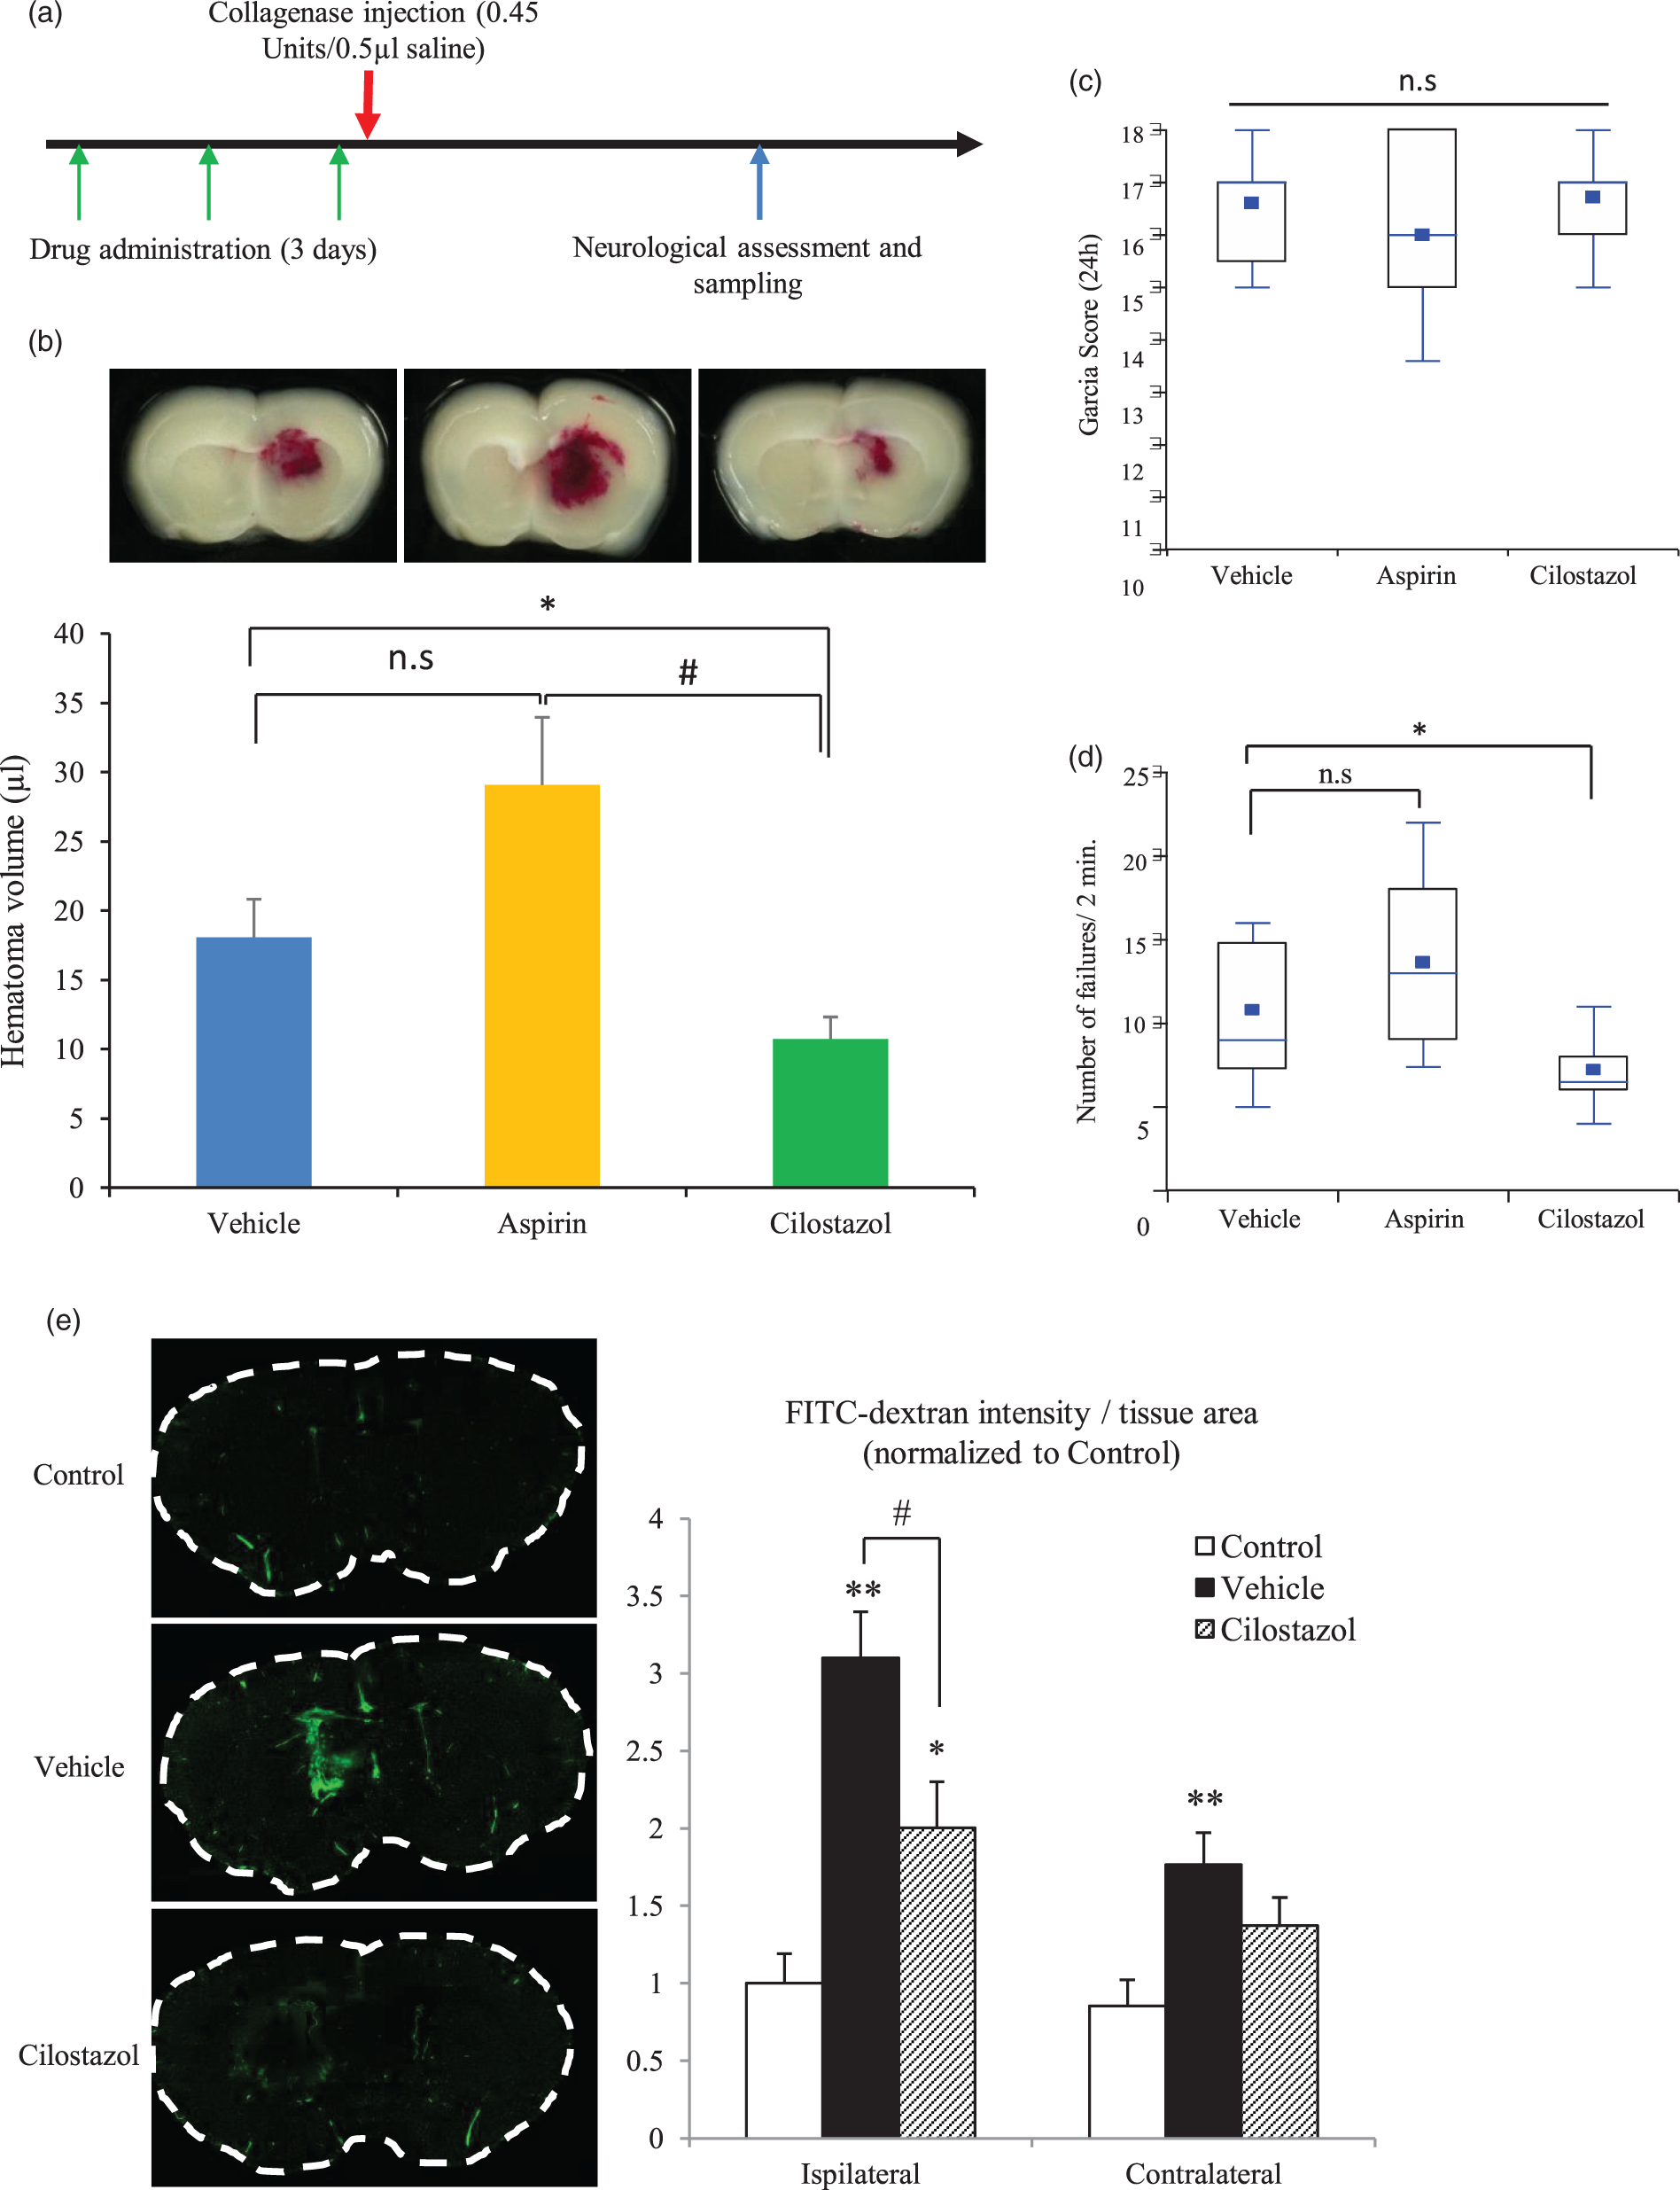
Plasma concentration of cilostazol
To confirm the effects of cilostazol in vivo, we assessed its plasma concentration following gavage. The plasma concentration of cilostazol 3 h after administration (30 mg/kg) was 0.53 ± 0.16 µg/mL (Figure 1(b)). This concentration was almost the same as that in humans following administration of 100 mg cilostazol (Cmax: 0.8 µg/mL, Tmax: 2 h). 28
ICH volume at 24 h
ICH was induced by a standard stereotactic injection of collagenase type VII-S (0.45 U) into the mouse striatum. Hematoma volumes were assessed using a hemoglobin assay kit 24 h after ICH induction. In the experiments, 3 (one per group) out of 60 mice were excluded due to death from excessive anesthesia, and 2 mice (one each in the aspirin and cilostazol groups) were excluded because they died prior to sampling. Surprisingly, ICH volume was significantly decreased in the cilostazol group compared with the vehicle group (10.8 ± 1.6 µL vs. 18.1 ± 2.8 µL, respectively, n = 18–19, p < 0.05), but hematoma volume was not significantly increased in the aspirin group (29.1 ± 4.9 µL) compared with the vehicle group (Figure 2(b)). As reported previously, aspirin did not significantly increase hematoma volume. 10 Larger ICH volumes were not found in the excluded mice.
Functional outcome
No differences in neurological outcome were observed as assessed using the Garcia score 24 h after ICH induction (Figure 2(c)). However, forelimb performance was significantly improved in the cilostazol group (Figure 2(d)). These results indicate that hematoma reduction improved motor function, but did not improve sensory disturbances. The mortality rates at 24 h were 1/20, 2/20, and 2/20 in the vehicle, aspirin, and cilostazol groups, respectively.
BBB permeability 3 h after ICH induction
To assess BBB permeability after ICH induction, we estimated leakage of FITC-dextran 3 h after collagenase injection. Leakage of FITC-dextran was increased by collagenase injection, but cilostazol blocked FITC-dextran leakage (Figure 2(e)). These results indicate that BBB permeability was increased by collagenase-induced ICH, and that cilostazol ameliorated the BBB leakage.
Vital signs with antiplatelet drugs
Systolic blood pressure (SBP), mean blood pressure (MBP), and HR were evaluated before examination, after antiplatelet administration (day 3), under anesthesia for ICH induction, and 24 h after ICH induction using the Non-Invasive Blood Pressure Monitor for Mice (MK-2000ST, Muromachi Kikai Co., Ltd). No differences in these parameters were observed among the three treatment groups (Supplemental Figure 3A, B), but the HR was lower under anesthesia in all groups compared with pre-treatment. SBP and MBP were not higher after ICH induction in any of the groups (Supplemental Figure 3C).
Electron microscopy (EM) imaging of BBB components
Next, we evaluated vasculature changes in collagenase-induced ICH using EM. The images showed that pericyte coverage for endothelial cells was significantly decreased by collagenase, and this decrease was improved by cilostazol administration (Supplemental Figure 4). The EM images also revealed that a part of the basement membrane was diminished and that endothelial cell shape became irregular as a result of collagenase damage (Supplemental Figure 5).
In vitro study of collagenase’s effects on vascular components
We initially planned to perform immunostaining to identify the damaged vascular layer and bleeding points in vivo, but this would be challenging. Therefore, we evaluated the collagenase-induced injuries to vascular components in vitro using membrane permeability assays with FITC-dextran and TEER.
First, we evaluated the effects of collagenase in HBMVECs and HBVSMCs, which are the components of perforating arteries or arterioles that are considered the origin of ICH. FITC-dextran permeability and TEER were not affected by collagenase at each of the concentrations used in monocultures of HBMVECs or HBVSMC (Supplemental Figure 6B, C). These results indicate that collagenase did not affect arterioles comprised of endothelial cells and vascular smooth muscles.
Next, we performed the same assays using the BBB kit, a model of microvessels at the capillary level, where BBB integrity is determined by pericytes. Schematics of the BBB model and study protocol are shown in Figure 3(a) and (b), respectively. FITC-dextran permeability and TEER were altered by collagenase in a concentration-dependent manner (Figure 3(c)). These results indicate that collagenase injured the vessels at the capillary level and suggest that pericytes and/or the basement membrane were the most strongly affected.
Membrane function in the BBB model and pericytes. (a) Schematic of the BBB model; (b) study protocol; (c) TEER (left) and FITC-dextran permeabilities (right) at each concentration of collagenase in the BBB model. *p < 0.05, **p < 0.01, ***p < 0.001 vs. control, Dunnet’s comparison test, n = 4–5. (d) FITC-dextran permeabilities (right) at each concentration of collagenase in pericytes. *p < 0.05, **p < 0.01, ***p < 0.001 vs. control, Dunnet’s comparison test, n = 6 per group.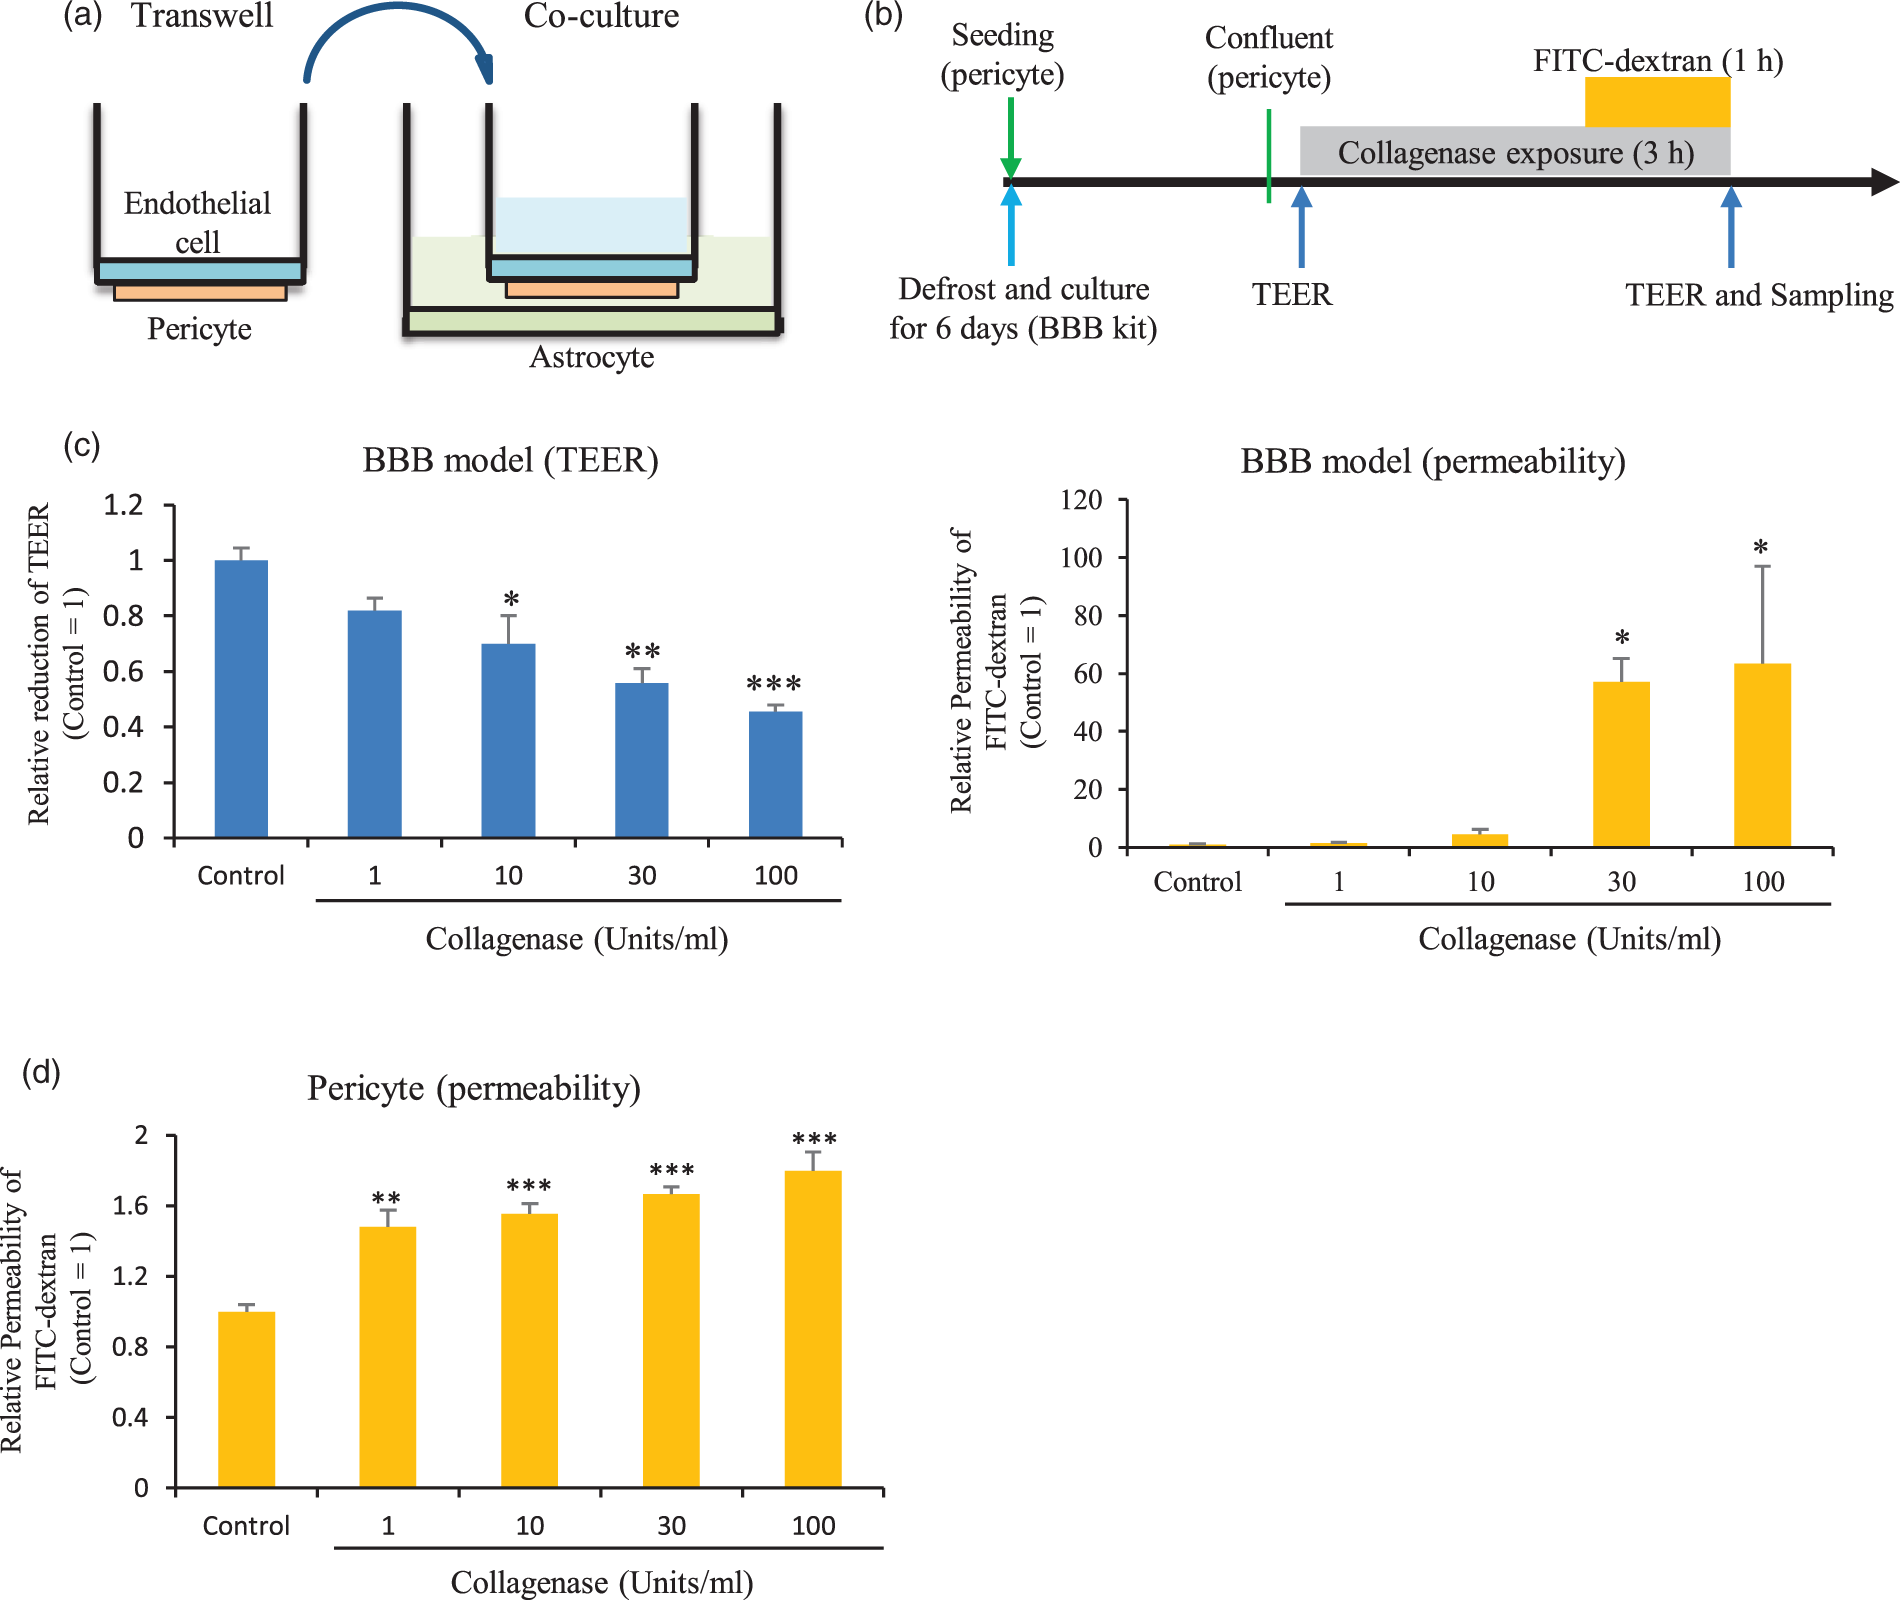
Pericyte injury by collagenase in vitro
To examine whether collagenase affected the basement membrane and/or pericytes, FITC-dextran permeability was evaluated in pericyte monocultures. FITC-dextran permeability was affected by collagenase in a concentration-dependent manner (Figure 3(d)). However, the permeability in pericyte monocultures was less than that observed in the BBB model (by 30-fold in the simplest analysis). These results indicate that collagenase directly affected both the basement membrane and pericytes.
Effects of cilostazol on collagenase-induced damage in the BBB model and pericytes
Next, we assessed the protective effects of cilostazol against collagenase-induced hyperpermeability in vitro. The study protocol is shown in Figure 4(a). We found that both 3 and 10 µM cilostazol significantly ameliorated the collagenase-induced reduction of TEER and FITC-dextran permeability (Figure 4(b)). These same effects were achieved with the administration of 100 µM db-cAMP, indicating that the protective effect achieved with cilostazol was due to increased levels of cAMP, the molecule upregulated by cilostazol administration (via CREB phosphorylation), which is the key mechanism of cilostazol (Figure 4(b)).
Effect of cilostazol and db-cAMP on collagenase damage. (a) Study protocol; (b) TEER (left) and FITC-dextran permeabilities (right) at each concentration of collagenase in the BBB model. *p < 0.05, **p < 0.01, ***p < 0.001 vs. control, Student’s t-test; #p < 0.05, ##p < 0.01 vs. vehicle, Dunnet’s comparison test; †p < 0.05 vs. vehicle, Student’s t-test, n = 5–6. (c) FITC-dextran permeabilities at each concentration of collagenase in pericytes. *p < 0.05, **p < 0.01, ***p < 0.001 vs. control, Dunnett’s comparison test; †p < 0.05 vs. vehicle, Student’s t-test, n = 6 per group.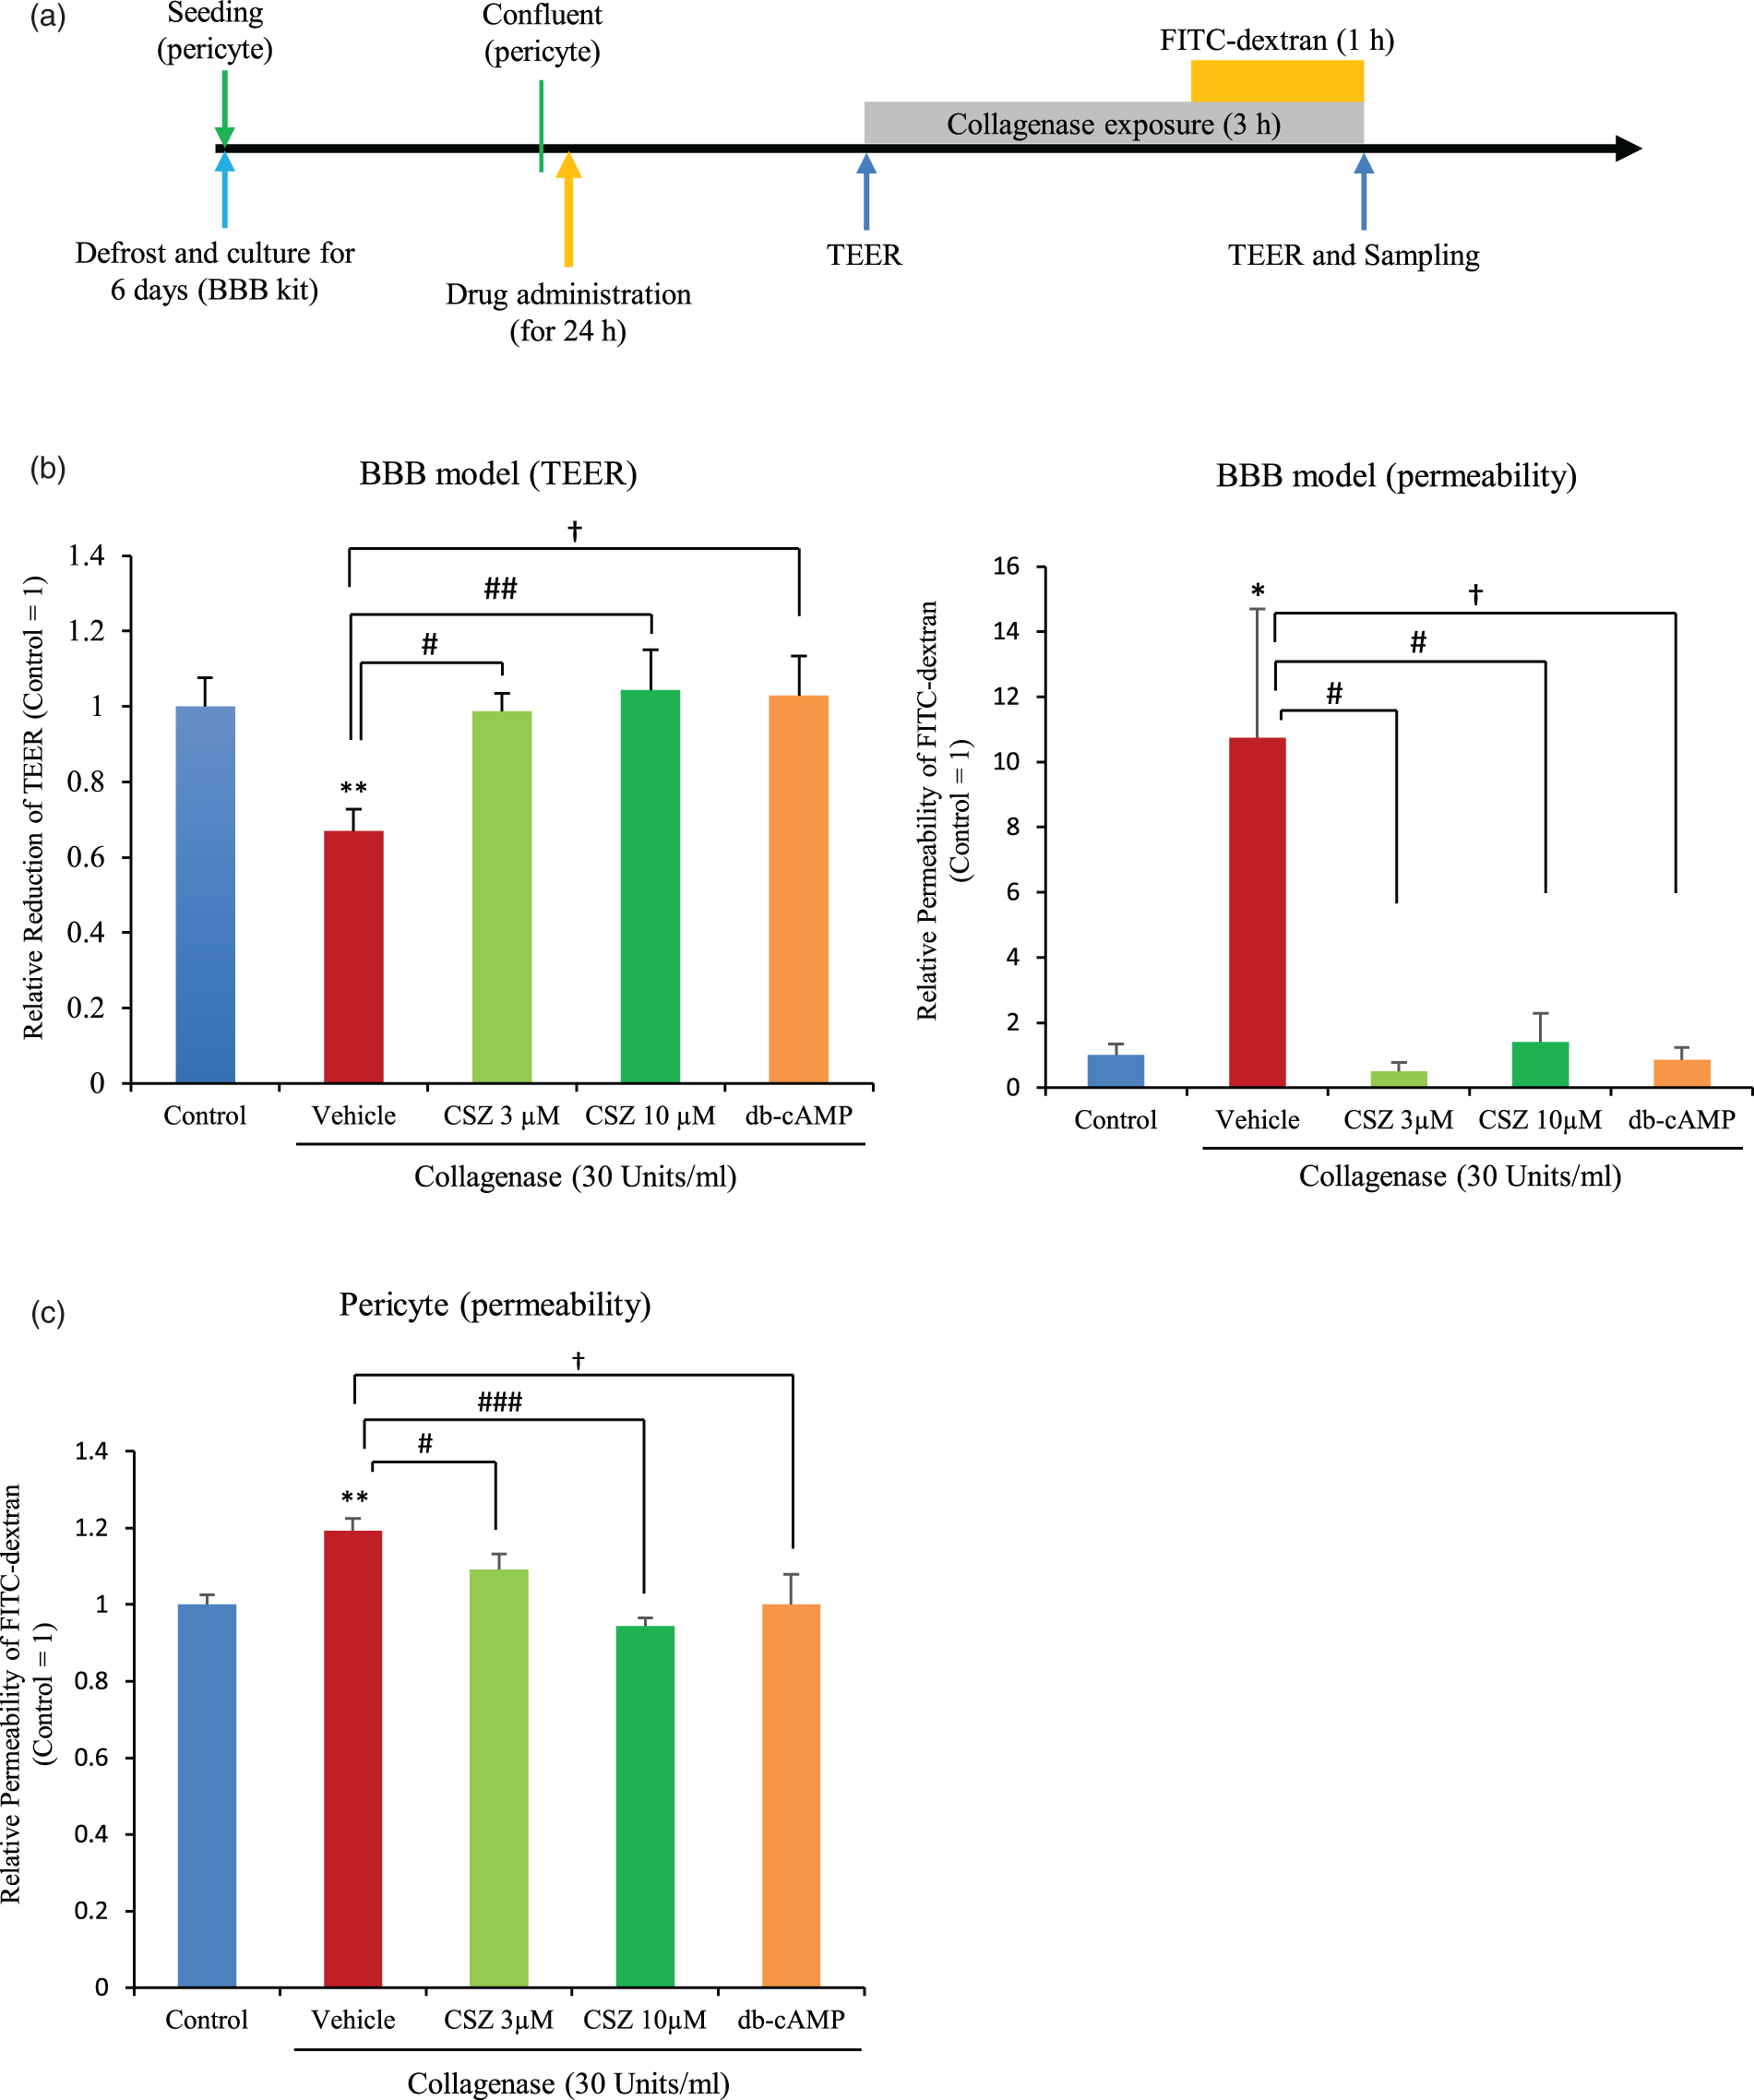
In pericyte monocultures, 3 and 10 µM cilostazol significantly ameliorated the reduction of FITC-dextran permeability (Figure 4(c)). Improvement of FITC-dextran permeability was also observed following administration of 100 µM db-cAMP (Figure 4(c)). These results indicate that cilostazol protected both the basement membrane and pericytes from collagenase-induced damage, and that BBB permeability was maintained due to cilostazol-mediated pericyte protection.
Collagenase induces endothelial cell, tight junction protein, and VE-cadherin damage in vitro
We evaluated the collagenase-induced cell death of endothelial cells and the changes in tight junction proteins and VE-cadherin. Endothelial cell death was significantly increased by collagenase exposure, and both cilostazol and db-cAMP protected endothelial cells from cell death. This effect was canceled out by the addition of a protein kinase A (PKA) inhibitor (Figure 5(a)). With regard to tight junction proteins, occludin was decreased by collagenase, and cilostazol treatment blocked this decrease (Figure 5(b)). Claudin-5 and -3 were not impaired by collagenase exposure (data not shown). However, VE-cadherin was decreased by collagenase, and cilostazol treatment attenuated this effect (Figure 5(c)). These in vitro experiments demonstrate that collagenase treatment decreased endothelial cell viability, VE-cadherin, and occludin, but cilostazol prevented these vasculature changes associated with BBB hyperpermeability.
Endothelial cell death analysis and collagenase-induced damage to tight junction proteins and VE-cadherin. (a) The upper panel shows typical double-staining with Hoechst 33342/PI. The lower graph shows the statistical analysis of endothelial cell death. Red, PI; Blue, Hoechst33342. **p < 0.01 vs. control, #p < 0.05 vs. vehicle, $p < 0.05 vs. cilostazol, Dunnett’s comparison test, n = 4 per group. Western blot analyses for occludin (b) and VE-cadherin (c). Representative bands are shown in the upper panel, and quantification is shown in the lower graph. *p < 0.05, **p < 0.01 vs. control; #p < 0.05, vs. vehicle, Student’s t-test, n = 4 per group.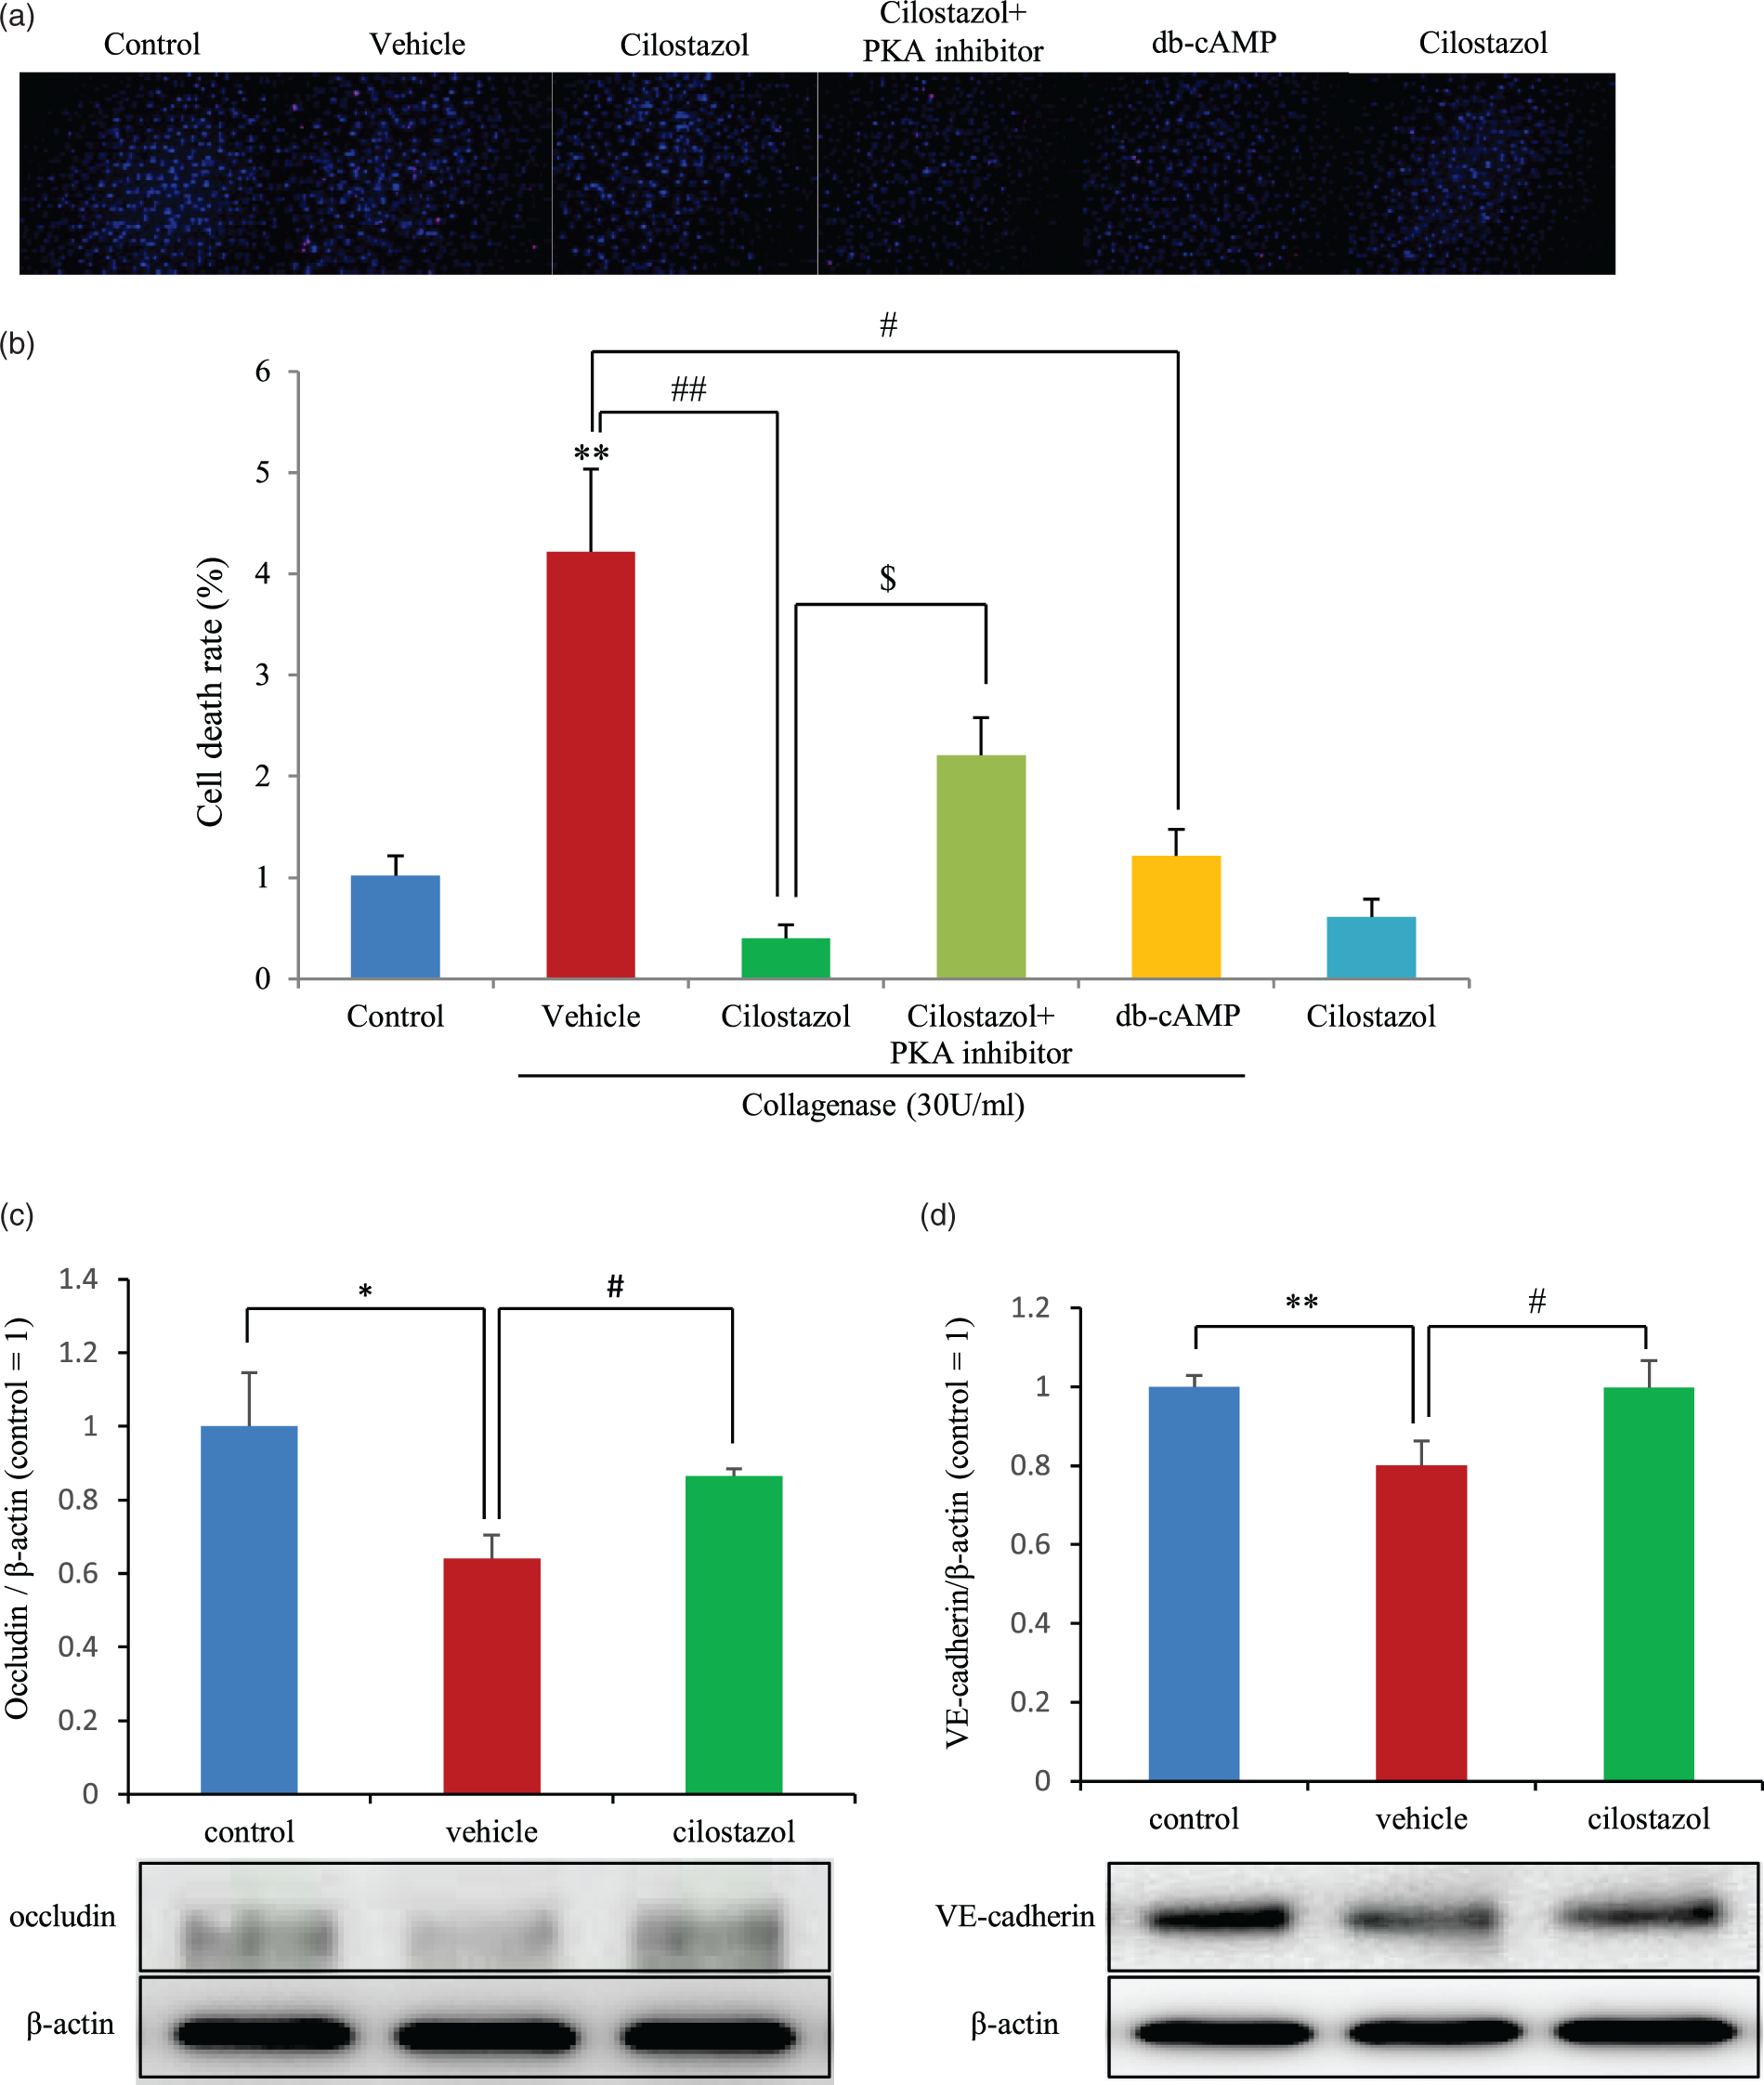
Protective mechanism of cilostazol on the basement membrane in the BBB model
To evaluate the protective mechanism of cilostazol against collagenase-induced hyperpermeability, we first assessed changes in the ECM and adherence junction proteins (AJPs) using western blotting of the BBB model. We evaluated collagen IV and laminin, which are the main components of the BBB basement membrane. Collagen IV and laminin were decreased following collagenase exposure, but this was attenuated by pre-treatment with cilostazol (Figure 6(a) and (b)). Almost the same effect was achieved by db-cAMP. The protein level of the AJP N-cadherin was also decreased by collagenase exposure and increased by cilostazol (Figure 6(c)). These results indicate that the ECM and AJPs were damaged by collagenase, but show that these changes were ameliorated by pre-treatment with cilostazol.
Evaluation of ECM and AJP following collagenase treatment of the BBB model. Western blot analysis for collagen IV (a), laminin (b), and N-cadherin (c). Representative bands are shown in the upper panel, and quantification is shown in the lower graph. *p < 0.05, ***p < 0.001 vs. control; #p < 0.05, ##p < 0.01 vs. vehicle, Student’s t-test, n = 6 per group.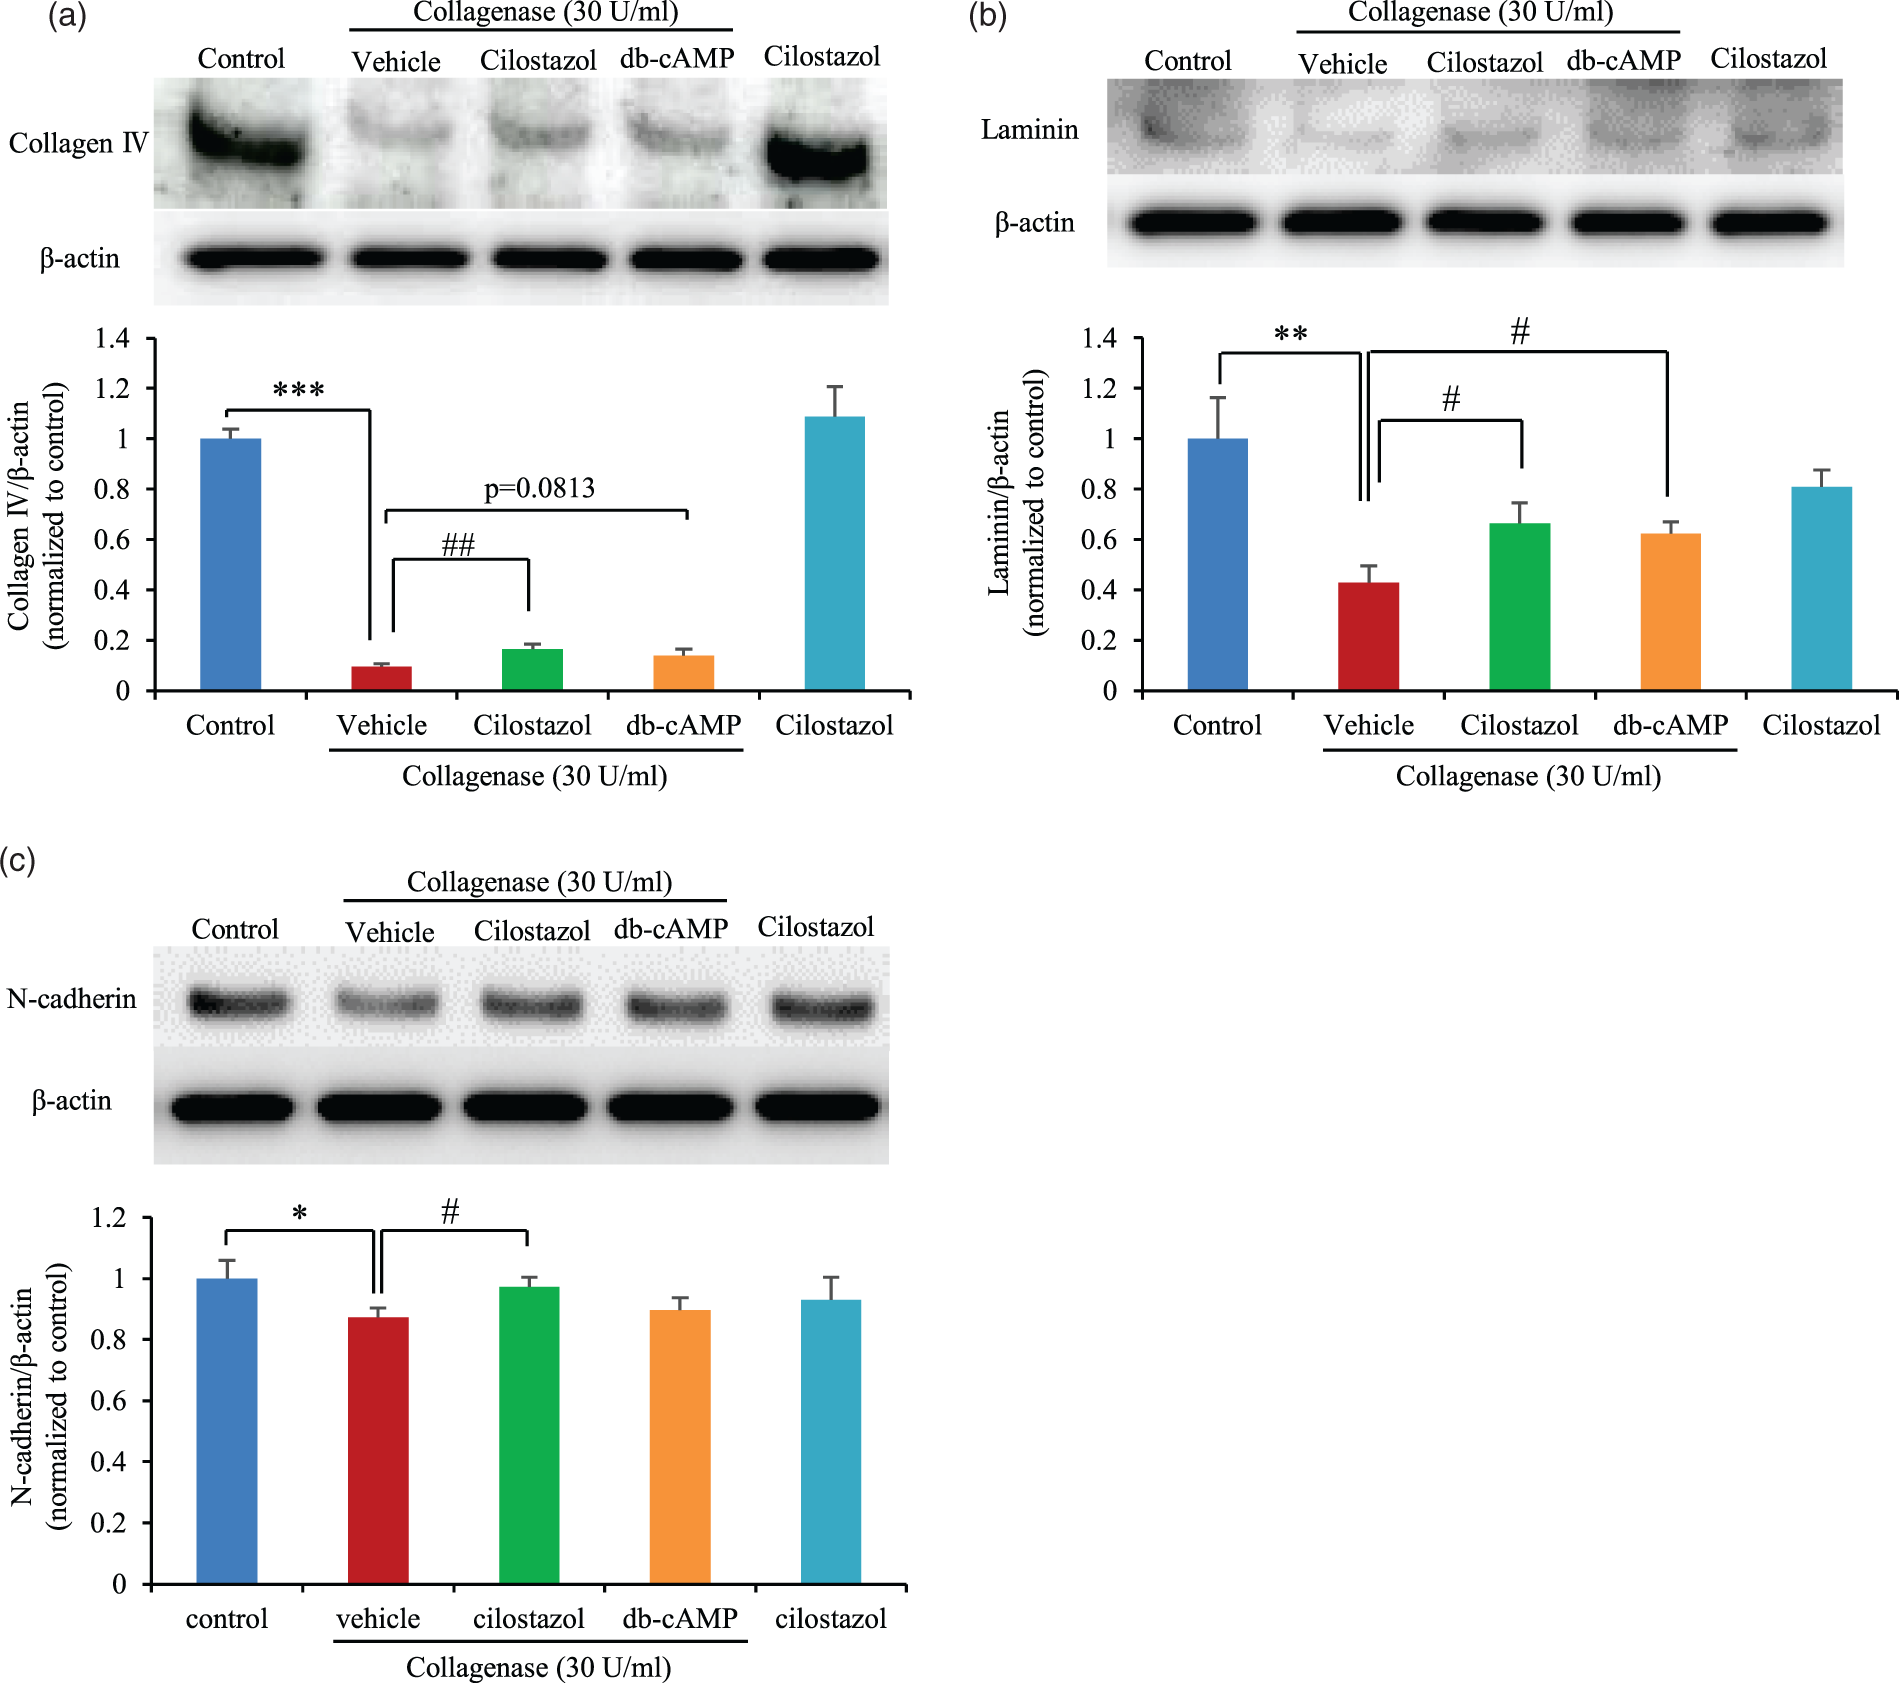
Effects of cilostazol on pericytes
To estimate the effects of cilostazol on pericytes, we performed western blots and TUNEL staining in pericyte monocultures. The number of TUNEL-positive cells increased following collagenase treatment, but decreased after cilostazol treatment (Figure 7(a)). Cleaved caspase-3 was increased by collagenase and decreased following cilostazol administration (Figure 7(b)). CREB phosphorylation was increased by both cilostazol treatment and db-cAMP (Figure 7(c)). Pericyte cell death was significantly increased by collagenase exposure, while both cilostazol and db-cAMP protected pericytes from cell death. This protection was canceled out by the addition of a PKA inhibitor (Supplemental Figure 7). These results indicate that cilostazol prevented pericytes from undergoing cell death by inducing CREB phosphorylation.
Cell death analysis and protective mechanism in pericytes. (a) Representative TUNEL images of in control, vehicle-treated, and cilostazol-treated cells (upper panel). The black arrow indicates a TUNEL-positive cell with broken DNA. Scale bar = 100 µm. (b) Quantitative analysis of TUNEL-positive cells. *p < 0.05 vs. control, #p < 0.05 vs. vehicle, Student’s t-test, n = 4 per group. (c) Western blot analysis for cleaved caspase-3. *p < 0.05 vs. control, #p < 0.05 vs. vehicle, Student’s t-test, n = 4–5. (d) Western blot analysis for phosphorylated CREB. *p < 0.05 vs. control, #p < 0.05 vs. vehicle, Student’s t-test, n = 6 per group. (e) Schematic depicting collagenase-induced BBB disruption and the hypothetical protective mechanism of cilostazol.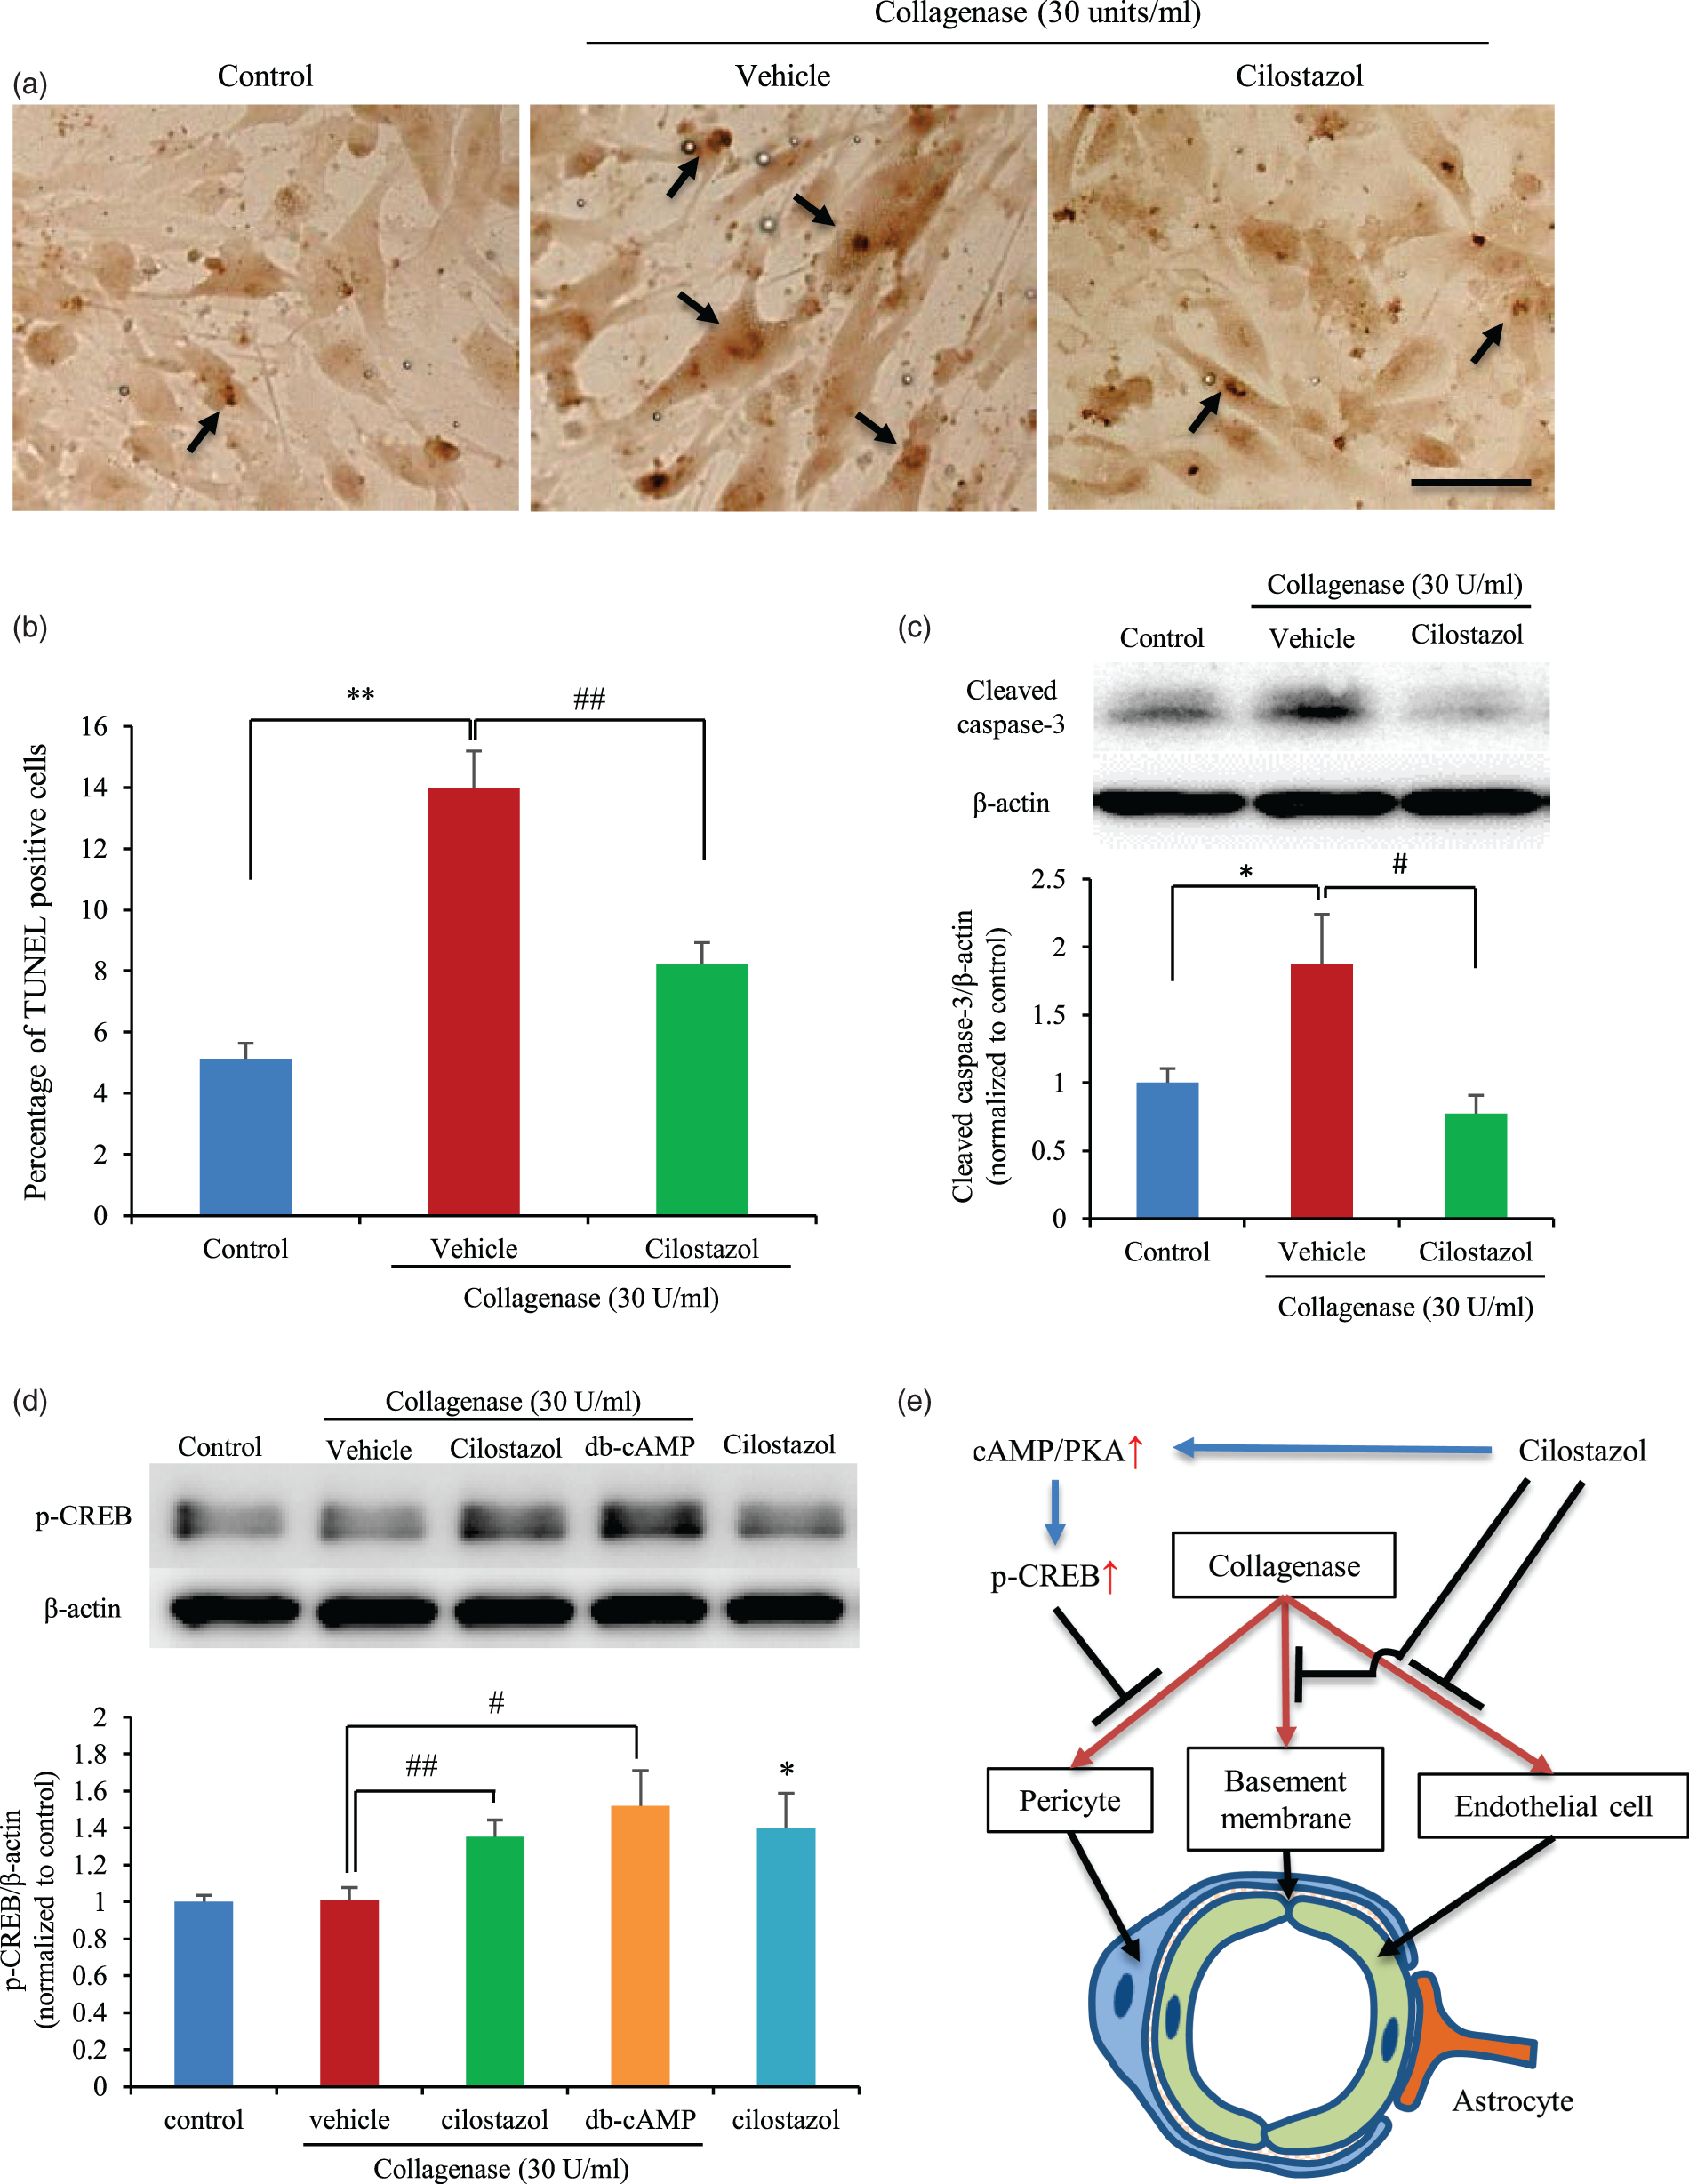
Discussion
The main finding of this study is that cilostazol pre-treatment decreased hematoma volume and improved the neurological outcomes in a collagenase-induced ICH model. Another interesting result is that collagenase injured pericytes, endothelial cells, and the basement membrane at the capillary level, while cilostazol protected BBB integrity by protecting both endothelial cells and pericytes by enhancing CREB phosphorylation.
Pre-treatment with aspirin did not increase the ICH volume despite sufficient platelet aggregation inhibition. Surprisingly, cilostazol pre-treatment decreased ICH volume compared with vehicle despite platelet aggregation inhibition. Although cilostazol has a vasodilatory effect, pre-treatment with cilostazol had no effect on blood pressure. Additionally, forelimb function after ICH was better in the cilostazol group than it was in the vehicle group, likely due to the reduction in hematoma volume.
The ability to inhibit platelet aggregation with antiplatelet drugs is usually evaluated by the gold standard method of LTA. Evaluation of platelet aggregation with cilostazol is usually performed following stimulation of human platelet-rich plasma with ADP, collagen, epinephrine, or arachidonic acid. 29 Recently, platelet aggregometry with prostaglandin E1 has been reported as a reliable method for cilostazol monitoring. 30 We found that platelet aggregation was inhibited by the administration of 20 µg/mL collagen both in the aspirin and cilostazol groups and by 20 µM ADP in the cilostazol group. Therefore, the concentrations of both drugs were sufficient to inhibit platelet aggregation.
The plasma concentration of cilostazol was 0.53 µg/mL at 3 h after oral administration, which was when ICH was induced in our study. This concentration is almost equivalent to the concentration following oral administration of 100 mg of cilostazol in human subjects (Tmax: 2 h, Cmax: 0.8 µg/mL). 29 In terms of the plasma concentration, the cilostazol concentration was sufficient to inhibit platelet aggregation. However, the in vivo results indicated that cilostazol reduced the ICH volume via a mechanism other than platelet inhibition, thus the protection of BBB integrity and tight junction proteins was considered a possible candidate mechanism.
In the pathology of hypertensive ICH, fibrinoid necrosis and miliary aneurysms are thought to be associated with causative lesions. 31 These changes are found in small arteries and arterioles, which are usually less than 300 -µm wide. 31 However, it is controversial whether fibrinoid necrosis and vascular smooth muscle degeneration are directly associated with ICH or if miliary aneurysm rupture results in ICH. 4
On the other hand, another theory regarding small vessel disease was recently proposed, wherein ICH is classified as a small vessel disease along with lacunar infarction, white matter hyperintensities, and enlargement of perivascular spaces in white or deep gray matter. 32 According to this concept of small vessel disease, it is not inconsistent that the underlying cause of ICH is at the capillary, rather than the arteriole level. Indeed, our results showed that collagenase injured pericytes, endothelial cells, and the basement membrane in the BBB model. These results indicate that collagenase affects multiple BBB components including endothelial cells, pericytes, the basement membrane, and AJPs.
COL4A1 or COL4A2 mutation is a monogenic risk factor for recurrent ICH.7–9 From the viewpoint of collagen impairment, both the in vivo collagenase-induced ICH model and the in vitro collagenase injury model can mimic human ICH.
In the present study, endothelial cell and pericyte monocultures were also injured by collagenase. However, the severity of membrane hyperpermeability was increased in the BBB model compared with in pericyte monocultures. FITC-dextran permeability was increased more than 30-fold in the BBB model in our simplest analysis. These results indicate that collagenase impaired endothelial cells, pericytes, and other BBB components and that changes between the mono-cultures and BBB model were due to differences in barrier strength between the two model systems. The ability of cilostazol to decrease hematoma size is likely a result of a protective effect on both endothelial cells and pericytes.
Pericytes reportedly have an important role in BBB maintenance as part of the NVU. They perform various neurovascular tasks, including contributing to vessel stability, regulating capillary diameter and blood flow, and controlling BBB integrity and function.33,34 It was also reported that transforming growth factor (TGF)-β signaling in pericytes initiates the production of ECM molecules.33,34 Therefore, pericyte injury by collagenase may deteriorate BBB integrity and exacerbate the reduction in ECM protein levels. In the present study, cilostazol protected pericytes from cell death, which reduced membrane hyperpermeability in vitro.
It has been shown that the transcription factor CREB mediates diverse responses in the nervous system, including cell survival, neuronal plasticity, and memory formation. 35 CREB also protects the brain from ischemia by activating downstream neuroprotective genes.36–38 CREB is phosphorylated at Ser133 by PKA activated in the cAMP-signaling cascade, and phosphorylated CREB enhances its binding to the coactivators CREB-binding protein (CBP) and p300.38,39 In the present study, CREB phosphorylation was upregulated by cilostazol treatment and inhibited collagenase-induced membrane hyperpermeability. Both cilostazol and a cell-permeable cAMP analog, db-cAMP, exerted almost the same protective effect and increased CREB phosphorylation. Thus, cilostazol is thought to activate CREB phosphorylation through cAMP/PKA signaling and protects pericytes from collagenase-induced cell death through this mechanism. Moreover, protection of pericytes may result in increased ECM expression.
N-cadherin is the adhesion factor between pericytes and basement membrane proteins, and VE-cadherin functions in the same role between endothelial cells and the basement membrane proteins known as AJPs. Both N-cadherin and VE-cadherin expressions were decreased or increased by collagenase or cilostazol treatment, respectively. This suggests that the reduction in AJPs might be one reason underlying membrane hyperpermeability in our model.
Cilostazol reportedly has pleiotropic effects, including protecting VE cells against oxidative stress, 12 preventing endothelin-induced smooth muscle constriction and proliferation, 13 and reducing hemorrhagic transformation via protection of the endothelium and pericytes (components of the NVU 14 ) or tight junction proteins. 15 Cilostazol also reportedly prevented secondary hemorrhagic stroke in a clinical trial (CSPS2). 16 In addition to these reports, our results show that cilostazol decreased the collagenase-induced ICH volume in vivo and ameliorated both collagenase-induced FITC-dextran permeability and TEER reduction in vitro. Our in vitro results also showed that both endothelial cell and pericyte cell death were prevented by cilostazol. The reduction of ICH by cilostazol was achieved by preventing endothelial cell and pericyte death through CREB phosphorylation. Cilostazol also prevented the collagenase-induced decreases in collagen IV, laminin, VE-cadherin, and N-cadherin. Although the detailed mechanism remains unknown, both endothelial cell and pericyte viability are affected in the collagenase-induced ICH model, and cilostazol’s ability to decrease hematoma size is likely a result of its anti-apoptotic effects on both cell types. This mechanism might partially explain why cilostazol reduces hemorrhagic stroke in clinical settings.
Conclusion
Cilostazol reduced the collagenase-induced ICH volume by sufficiently inhibiting platelets. BBB permeability was also increased by collagenase-induced ICH, and that cilostazol ameliorated the BBB leakage. Our in vitro studies revealed that collagenase injured pericytes, endothelial cells, AJPs, and the basement membrane. Cilostazol protected pericytes and endothelial cells from collagenase-induced cell death via CREB phosphorylation, and cilostazol also protected the basement membrane and AJPs. In summary, both endothelial cell and pericyte viability are likely affected in the collagenase-induced ICH model, and cilostazol’s ability to minimize hematoma size is likely a result of anti-apoptotic effects on both cell types. This putative mechanism might partially explain why cilostazol reduces hemorrhagic complications. Based on the findings described here, cilostazol might suppress ICH.
Footnotes
Funding
The author(s) disclosed receipt of the following financial support for the research, authorship, and/or publication of this article: This study received financial support from Otsuka Pharmaceutical Co., Ltd., to perform a collaborative study.
Declaration of conflicting interests
The author(s) declared the following potential conflicts of interest with respect to the research, authorship, and/or publication of this article: Dr. Ito is an employee of Otsuka Pharmaceutical Co., Ltd., which provided cilostazol for the study.
References
Supplementary Material
Please find the following supplemental material available below.
For Open Access articles published under a Creative Commons License, all supplemental material carries the same license as the article it is associated with.
For non-Open Access articles published, all supplemental material carries a non-exclusive license, and permission requests for re-use of supplemental material or any part of supplemental material shall be sent directly to the copyright owner as specified in the copyright notice associated with the article.