
Abstract
Novel MRI-based dynamic cerebral autoregulation (dCA) assessment enables the estimation of both global and spatially discriminated autoregulation index values. Before exploring this technique for the evaluation of focal dCA in acute ischaemic stroke (AIS) patients, it is necessary to compare global dCA estimates made using both TCD and MRI. Both techniques were used to study 11 AIS patients within 48 h of symptom onset, and nine healthy controls. dCA was assessed by the rate of return of CBFV (Rturn) following a sudden drop induced by the thigh cuff manoeuvre. No significant between-hemisphere differences were seen in controls using either the TCD or MRI technique. Inter-hemisphere averaged Rturn values were not different between TCD (1.89 ± 0.67%/s) and MRI (2.07 ± 0.60%/s) either. In patients, there were no differences between the affected and unaffected hemispheres whether assessed by TCD (Rturn 0.67 ± 0.72 vs. 0.98 ± 1.09%/s) or MRI (0.55 ± 1.51 vs. 1.63 ± 0.63%/s). Rturn for both TCD and MRI was impaired in AIS patients compared to controls in both unaffected and affected hemispheres (ANOVA, p = 0.00005). These findings pave the way for wider use of MRI for dCA assessment in health and disease.
Keywords
Introduction
Cerebral autoregulation (CA) can be estimated from the cerebral blood flow velocity (CBFV) measured with transcranial Doppler (TCD) ultrasound, in both healthy and acute ischaemic stroke (AIS) populations.1–3 TCD is a non-invasive and relatively straightforward technique, able to assess CBFV with good time resolution, making it an attractive method for assessing CA. However, one major limitation of the technique is its poor spatial resolution. Although it is also possible to insonate anterior and posterior cerebral arteries, in most clinical studies, measurements are only made in the middle cerebral arteries (MCAs), thus limiting the detection of CBF abnormalities to differences between the hemispheres in the MCA territories.2,3 Greater spatial discrimination in CA assessments would be highly desirable. Of the potential imaging techniques, magnetic resonance imaging (MRI) appears suitable because it is available in acute care situations, gives good spatial resolution and has an excellent safety record.
The thigh cuff (THC) manoeuvre is an accepted stimulus for assessing CA, since it induces a rapid drop in blood pressure (BP) due to the reactive hyperaemia in the legs after the temporary ischaemia resulting from the inflated thigh cuffs. 1 An earlier study from our group in healthy control subjects has shown the response to a BP fall induced by thigh cuff release is similar when assessed by MRI and TCD; moreover the MRI data may be more reliable. 4
The aim of this study was to compare the ability of the two techniques to discriminate between the healthy and AIS populations.
Materials and methods
Patient population and controls
AIS patients admitted to the University Hospitals of Leicester NHS Trust within 48 h of symptom onset were studied. Unconscious patients and those with atrial fibrillation were excluded, as were patients with a past medical history or evidence at the time of study of diabetes mellitus, impaired renal function, acute myocardial infarction, and/or unstable angina.
In addition, a control group of 10 healthy subjects of similar age, sex and BP was recruited from departmental volunteers and advertisement responders. Controls were excluded if they had a history of cardiovascular disease, migraine, epilepsy, or other chronic neurological disorders, or if they had contraindications to MRI scanning.
The study was approved by the Leicestershire, Northamptonshire and Rutland Research Ethics Committee (REC 09/H0403/25), and all subjects gave written informed consent.
Study protocol
The study protocol consisted of two parts: TCD and MRI measurements, where MRI scans always followed TCD, with a median time interval between them of 2 h (range 0.5–8 h). The two procedures are summarised below.
Initial TCD assessments were performed in a dedicated cardiovascular research laboratory, which was at controlled temperature (20–24℃) and free from distraction. Subjects did not consume caffeine or alcohol for at least 2 h prior to study participation. Subjects were asked to lay supine, with arms resting by their sides, and pillows were used for head support. Casual BP was measured at the upper arm using a validated cuff device (Omron Automatic BP 705CP-11, Omron Healthcare, Inc., Lake Forest, IL). Continuous BP was measured non-invasively using a finger arterial volume clamping device (Finapres, Finapres Medical Systems BV, Amsterdam, The Netherlands), with the BP cuff applied to the middle phalanx of the middle finger of the hand opposite to where the arm cuff was applied. A 3-lead surface ECG was recorded continuously. End-tidal CO2 (EtCO2) was monitored using a capnograph (Capnocheck Plus, Smiths Medical, Ashford, Kent, UK) attached to a nasal cannula.
TCD ultrasonography (Viasys Companion III, Viasys Healthcare, Surrey, UK) was used to measure CBFV in the left and right middle MCAs simultaneously. Two transducers operating at 2 MHz were positioned on the temporal bone, and the MCAs were identified by adjusting the positions of the transducers to give the maximum reflected signal at a depth of 45–60 mm. The transducers were then secured in position using a head frame.
Each subject rested for a stabilisation period of 15 min, following which brachial BP was measured using the arm cuff. BP, ECG, EtCO2 and CBFV recordings were made in each subject before, during and after a step BP drop. The servo-adjust function of the Finapres was turned off at the beginning of each recording and the BP signal was calibrated for each measurement. Digitised signals for all parameters were stored through a physiological data acquisition system for offline analysis.
The thigh cuff technique was used to induce a step drop in arterial BP. Large thigh cuffs (Model C22, DE Hokanson, Inc, Bellevue, WA) were placed one on each thigh approximately 10 cm above the knee, and inflated at least 20 mmHg above peak systolic BP. An adapted bicycle pump was used for cuff inflation, and inflation was maintained for 3 min. A transient BP drop was then induced by fast simultaneous release of both cuffs using a rapid cuff deflator (Hokanson model RD2).
Each participant underwent an initial baseline recording of 5 min, following which three repeats of the BP step drop procedure were performed, each one with a 3-min period of cuff inflation, and 2 min post deflation. The recordings for each subject were carried out in a single session, during which the volunteer remained supine.
All MRI measurements were performed using a 1.5 Tesla MRI scanner (Symphony, Siemens AG, Erlangen, Germany) with a single channel transmit/receive quadrature birdcage head coil. After arrival at the MRI suite and being seated for a period of 10 min, brachial BP was measured as a guide for thigh cuff inflation pressure. Subjects then lay supine on the scanner couch and the thigh cuffs were applied. A lightweight foam collar was used to support the head and neck, and a custom-made foot rest was clamped to the couch to provide additional support during the cuff deflation manoeuvre in order to minimise movement. The foot rest was a wooden plate that projected upwards from the couch and which was adjustable to provide a firm base against which the subjects could brace their feet at a comfortable ankle flexion angle.
After a localizer scan, standard proton-density / T2-weighted dual-echo fast spin-echo and spin-echo echo-planar imaging (EPI) diffusion-weighted (DW) sequences were performed so that any acute stroke pathology could be identified by an independent stroke consultant who was blind to all other details of the study. The sequence parameters for the dual-echo scan were: TR = 2930 ms; TE = 15.86 ms; echo train length = 5; matrix = 256 × 256; in-plane resolution = 0.9 × 0.9 mm. For the DW sequence, the parameters were: TR = 4100 ms; TE = 112 ms; matrix = 128 × 128; in-plane resolution = 1.8 × 1.8 mm interpolated to 0.9 × 0.9 mm. Diffusion weighting was applied in three orthogonal directions, with a b-factor of 1000 s mm−2; an image with b = 0 was also collected. For both sequences, 21 axial slices were acquired, with a slice thickness of 5 mm and a 2 mm gap between slices, covering the whole of the cerebrum. Slices were positioned parallel to a line that joined the most anterio-inferior and posterio-inferior margins of the corpus callosum as viewed on a sagittal localizer, correcting for any head tilt by also viewing in the coronal plane.
The thigh cuffs were then inflated to at least 20 mmHg above peak systolic BP and the main image series was commenced as soon as the cuffs were up to pressure. This consisted of rapid serial acquisition using a gradient-echo EPI sequence (TR = 1000 ms; TE = 40 ms; flip angle = 40°; matrix = 64 × 64; in-plane resolution = 3.45 × 3.45 mm; slice thickness = 5 mm; gap between slices = 4 mm). Twelve slices were positioned as for the dual-echo and DW scans, but there was less coverage of the cerebrum due to the smaller number of slices acquired. Two hundred and forty multi-slice image sets were acquired over 4 min, equivalent to a sampling frequency of 1 Hz, which was the fastest rate possible while still maintaining coverage of the head. The relatively low resolution of the image matrix (4096 voxels per slice) was also because of the need for high sampling frequency. Three minutes into the series, the cuffs were rapidly deflated. It has previously been found to be necessary to inflate the thigh cuffs for 3 min prior to deflation, in order to obtain a reliable BP drop. 5 Although we ultimately only characterize the MRI signal change after deflation in order to assess autoregulation, it is advantageous to scan for the full 4 min to minimize any change in stress to the subject (due to the acoustic noise during MRI scanning) around the time of the thigh cuff release. This also allowed us to assess and correct any signal changes due to physiological ‘noise’, as done for similar scanning protocols such as functional MRI (fMRI) analysis. 6 After the scan was completed, the cuffs were re-inflated and the procedure was repeated twice more. The scanning for each subject was carried out in a single session, during which the volunteer remained supine without being removed from the scanner.
Data analysis
Transcranial Doppler
Data acquired were edited using application-specific software designed in house, prior to calculation of dynamic cerebral autoregulation (dCA) values. CBFV traces were visually inspected and passed through a median filter. The right and left CBFV, BP, ECG and EtCO2 were then low-pass filtered (Butterworth, 20 Hz cut-off). Recordings were rejected if there was a drift in BP signal, absent or poor quality CBFV signal over several beats, or a large number of narrow spikes. 7 The ECG was marked to determine the R–R interval, and estimates of mean CBFV and BP were calculated for each cardiac cycle. The end tidal value of the capnographic signal was detected for each breath and resampled for each cardiac cycle. Using spline interpolation and resampling the data at 5 Hz, a uniform time base for all the data was achieved.
Magnetic resonance imaging
MRI pre-processing was performed using the FMRIB Software Library (FSL) Version 4.1.7 (www.fmrib.ox.ac.uk/fsl). This consisted of: noise reduction using an anisotropic spatial filter, correction for subject motion during the acquisition, and registration to a standard anatomical space in order to allow data averaging across subjects. The time-series of images for each subject was spline interpolated and resampled at 5 Hz similarly to the TCD data.
Due to the occurrence of artefacts in the MRI signals and, to a lesser extent, in the TCD CBFV signals, acceptance of data was based on a blind procedure to avoid any potential biases. Both TCD and MRI signals were low-pass filtered at 0.35 Hz and their amplitude was normalised by fitting the signals' minimum and maximum values within the range [0,1]. This procedure made signals indistinguishable between modalities (Figure 1). TCD and MRI signals were then mixed randomly and presented on a computer screen to a panel of four of the authors (RBP, NPS, MAH, TGR) to decide on acceptance/rejection based on the expected temporal pattern after cuff release and the absence/presence of large artefacts that could distort estimates of the rate of return. Unanimity was required for acceptance.
Representative MCA velocity (a,c) and MRI intensity signal (b,d) for a control subject (a,b) and a stroke patient (c,d) following thigh cuff release with t = 0 indicating the minimum negative signal derivative as point of synchronism. Right or ipsilateral hemisphere (continuous line), left or contralateral hemisphere (dashed line). The straight interrupted line represents the regression best fit from the first minima (<5 s) after cuff release for a 6 s interval.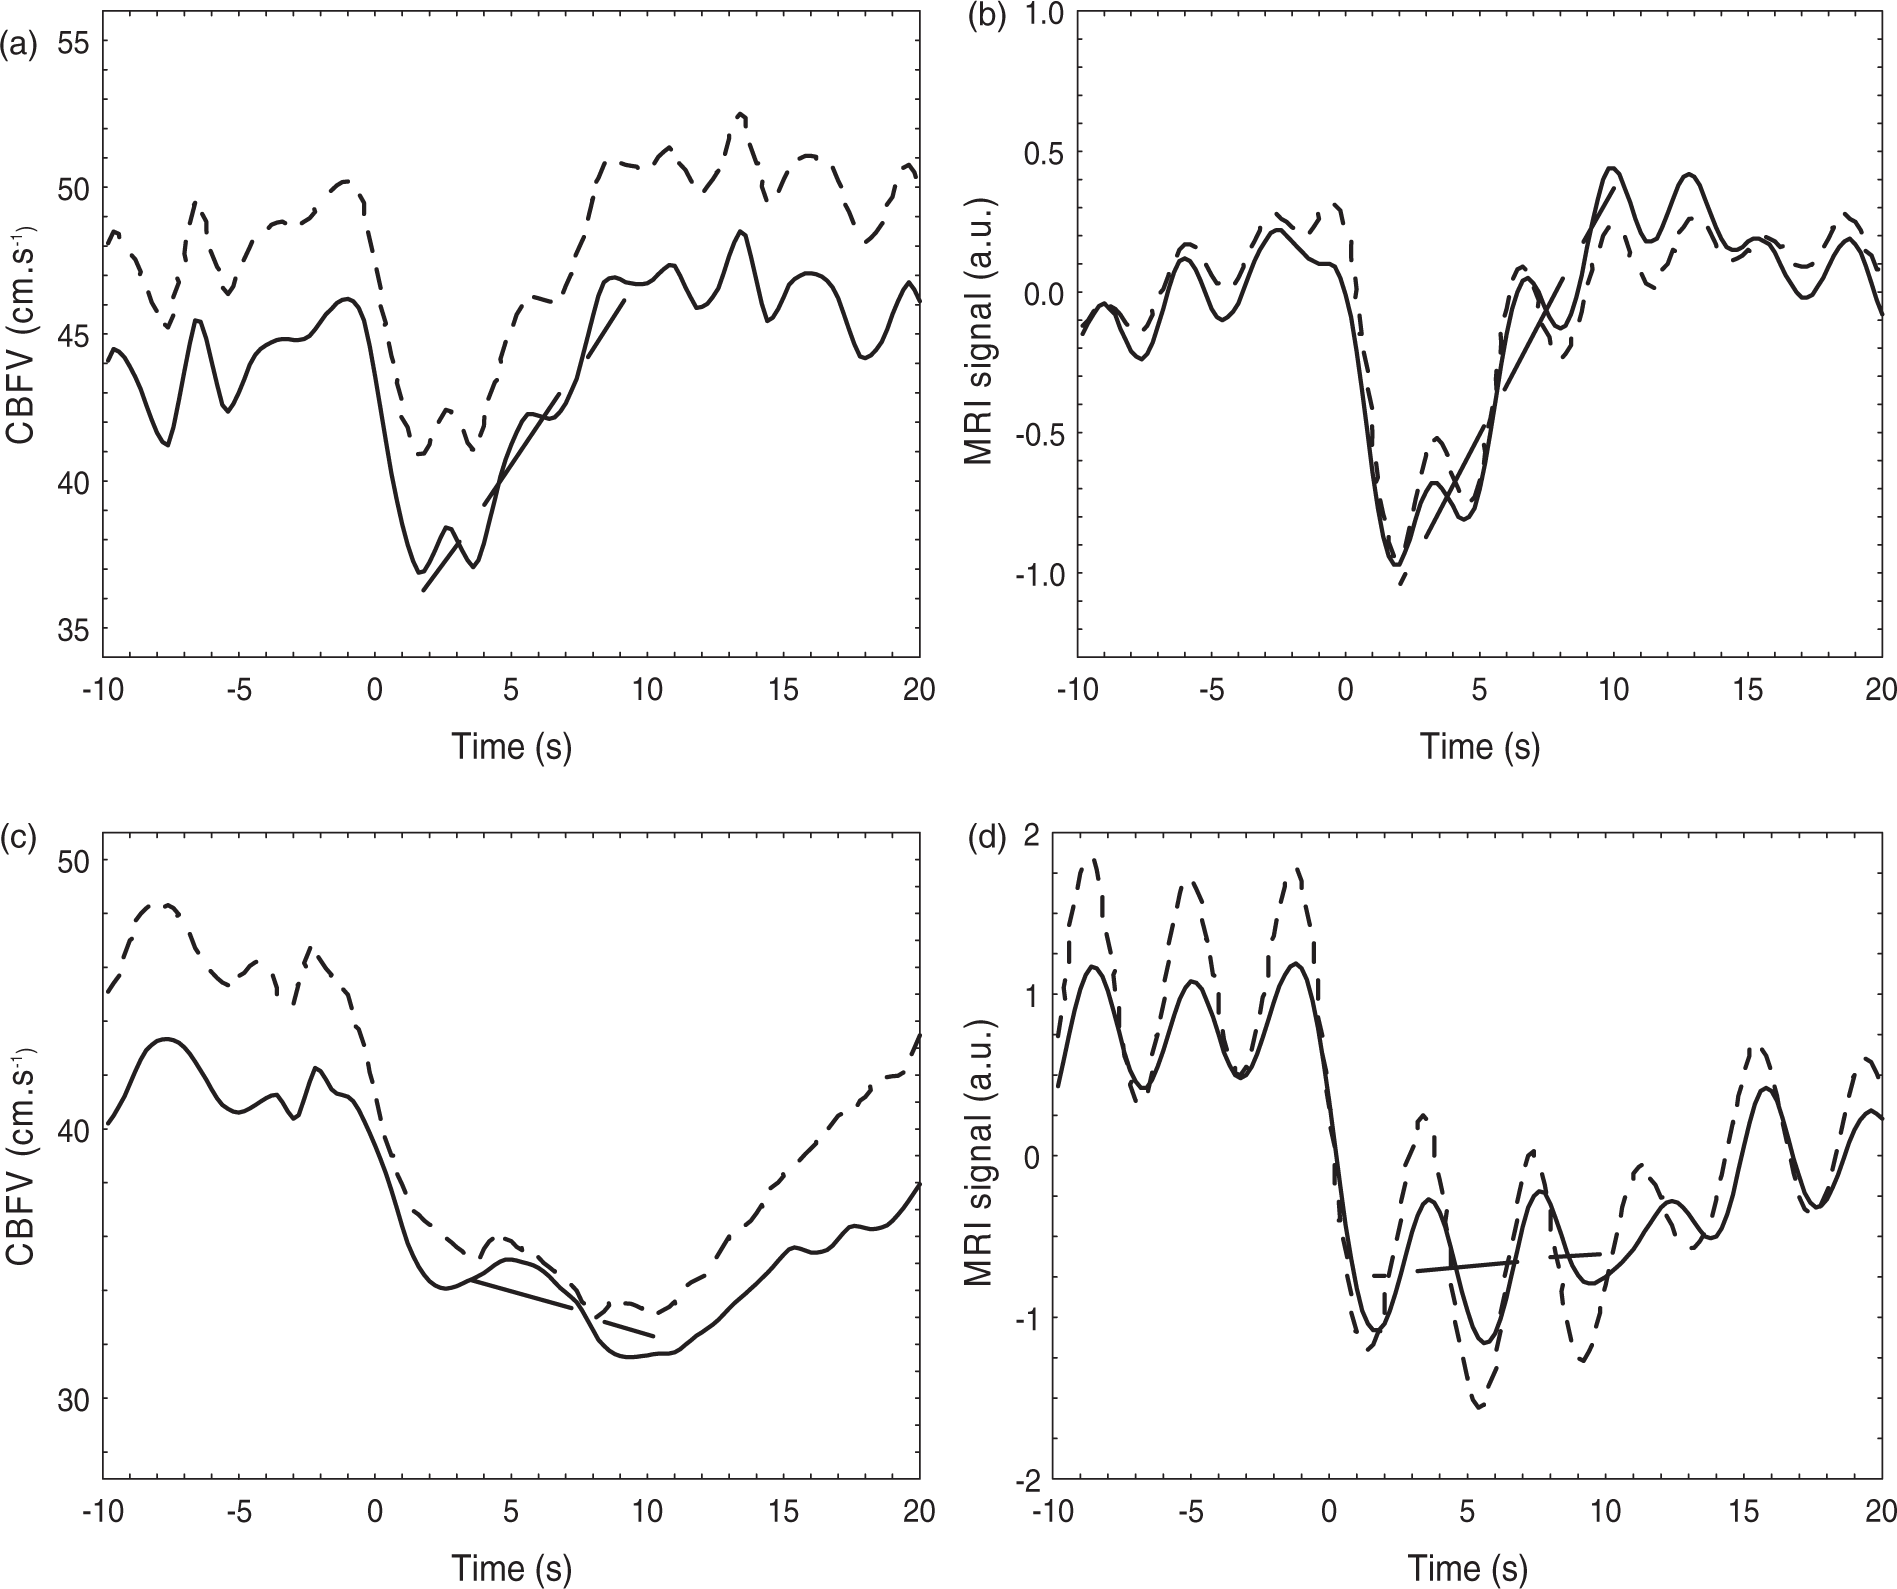
Dynamic CA
With TCD, the efficiency of dCA using the THC approach has been quantified with the ARI index.5,8 For the MRI signal response to the THC manoeuvre, an equivalent index has been proposed, 9 but in the current study an alternative approach was adopted to obtain an homogenous index for both signals, taking into account the absence of BP recording concurrent with the MRI signal. Following the THC release, both the TCD CBFV and the MRI signal drop sharply and then recover to their original level with a speed of recovery that is assumed to reflect the efficiency of dCA. 1 The rate of return index (Rturn) is the slope of the return phase in units of %/s (Figure 1), calculated from the linear regression of 30 data samples (6 s) following the minimum signal value after cuff release (< 5 s), normalised by the signal standard deviation for the data window ranging from 15 s before to 15 s after cuff release.
Statistical analysis
Rturn values for the left and right hemispheres of control subjects, for each technique (TCD and MRI), were tested for differences with a paired Student's t test and averaged if non-significant. A two-way ANOVA was performed to assess the differences between control subjects and the affected and unaffected hemispheres (condition) and differences between TCD and MRI (technique). Receiver operating characteristic (ROC) curves were constructed and the ability of both TCD and MRI to detect stroke in the ipsi- and contra-lateral hemispheres was assessed using the area-under-the curve (AUC). Confidence limits for differences between two AUCs were obtained by Monte-Carlo simulations, using 105 realizations with random Gaussian distributed data fitting the exact number of subjects and statistical distributions of corresponding Rturn values. The level of statistical significance was set at p < 0.05 for all tests.
Results
Most patients were studied within a 48 h window after stroke onset, but for logistic reasons involving the MRI test, three patients were studied at 54, 55 and 73 h after onset, respectively. The overall distribution (median [lower, upper quartiles]) of measurement times after onset was 44.7 [30.6,54.5] h. With the exception of one control subject, all participants tolerated the measurement protocol for both TCD and MRI well, with nine control subjects and 11 stroke patients completing three THC manoeuvres in each modality. After careful signal inspection, including the blind presentation and rejection of signals with artefacts coinciding with THC release, the resulting number of recordings (separate hemispheres) for analysis was 37 and 26 for TCD controls and patients, respectively, and 44 and 24 for MRI.
Subject characteristics.
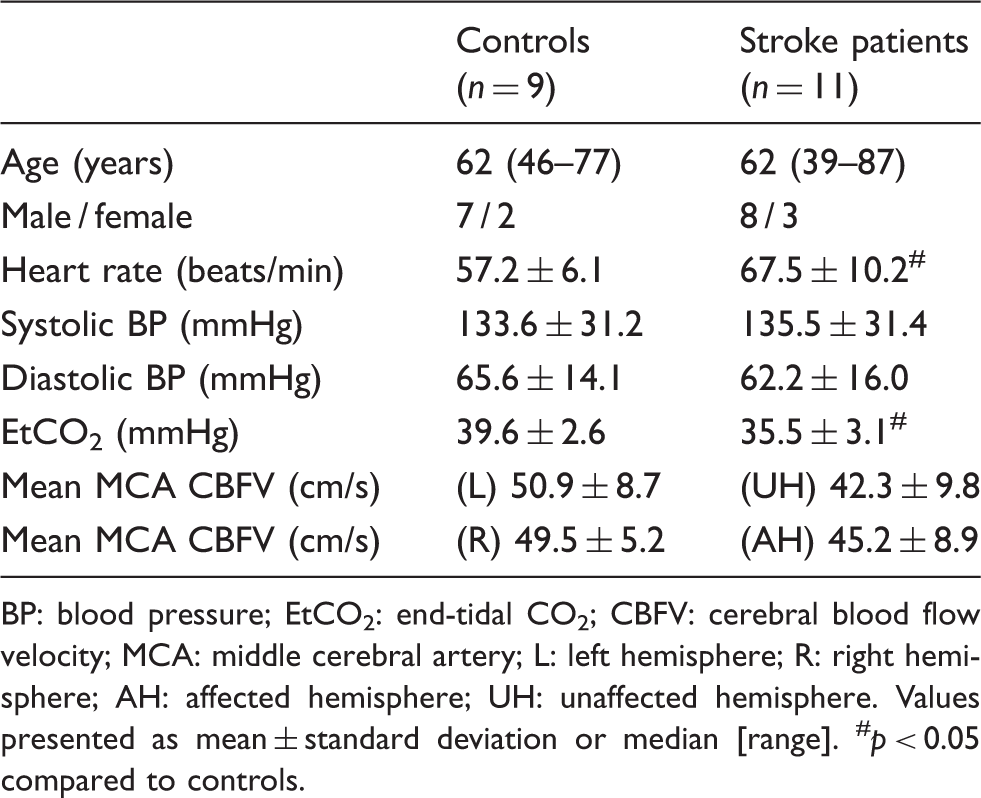
BP: blood pressure; EtCO2: end-tidal CO2; CBFV: cerebral blood flow velocity; MCA: middle cerebral artery; L: left hemisphere; R: right hemisphere; AH: affected hemisphere; UH: unaffected hemisphere.
Values presented as mean ± standard deviation or median [range]. #p < 0.05 compared to controls.
Linear regression slopes and correlation (r) coefficients for control subjects and acute stroke patients.
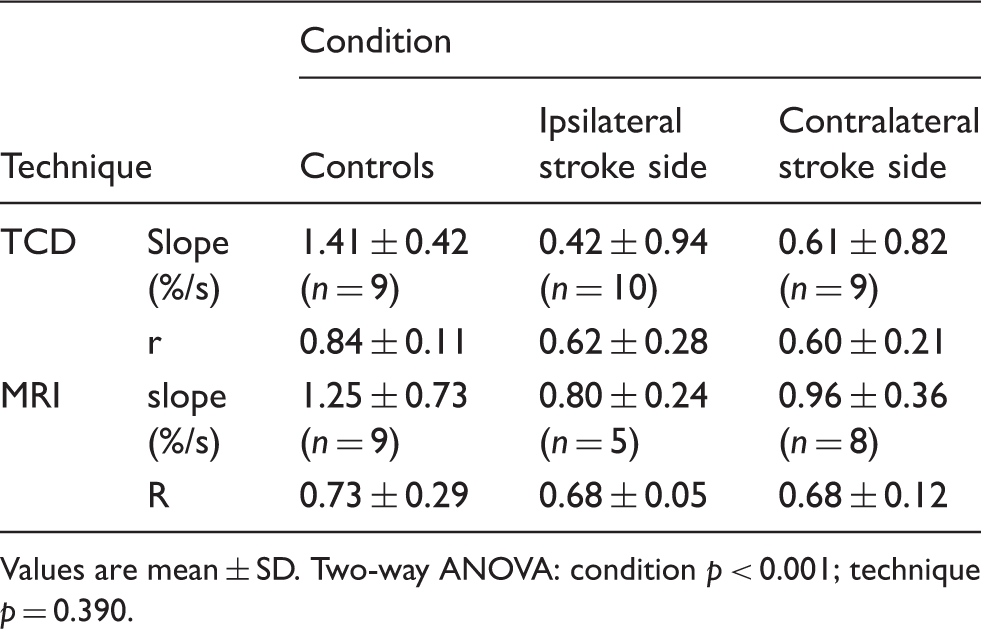
Values are mean ± SD. Two-way ANOVA: condition p < 0.001; technique p = 0.390.
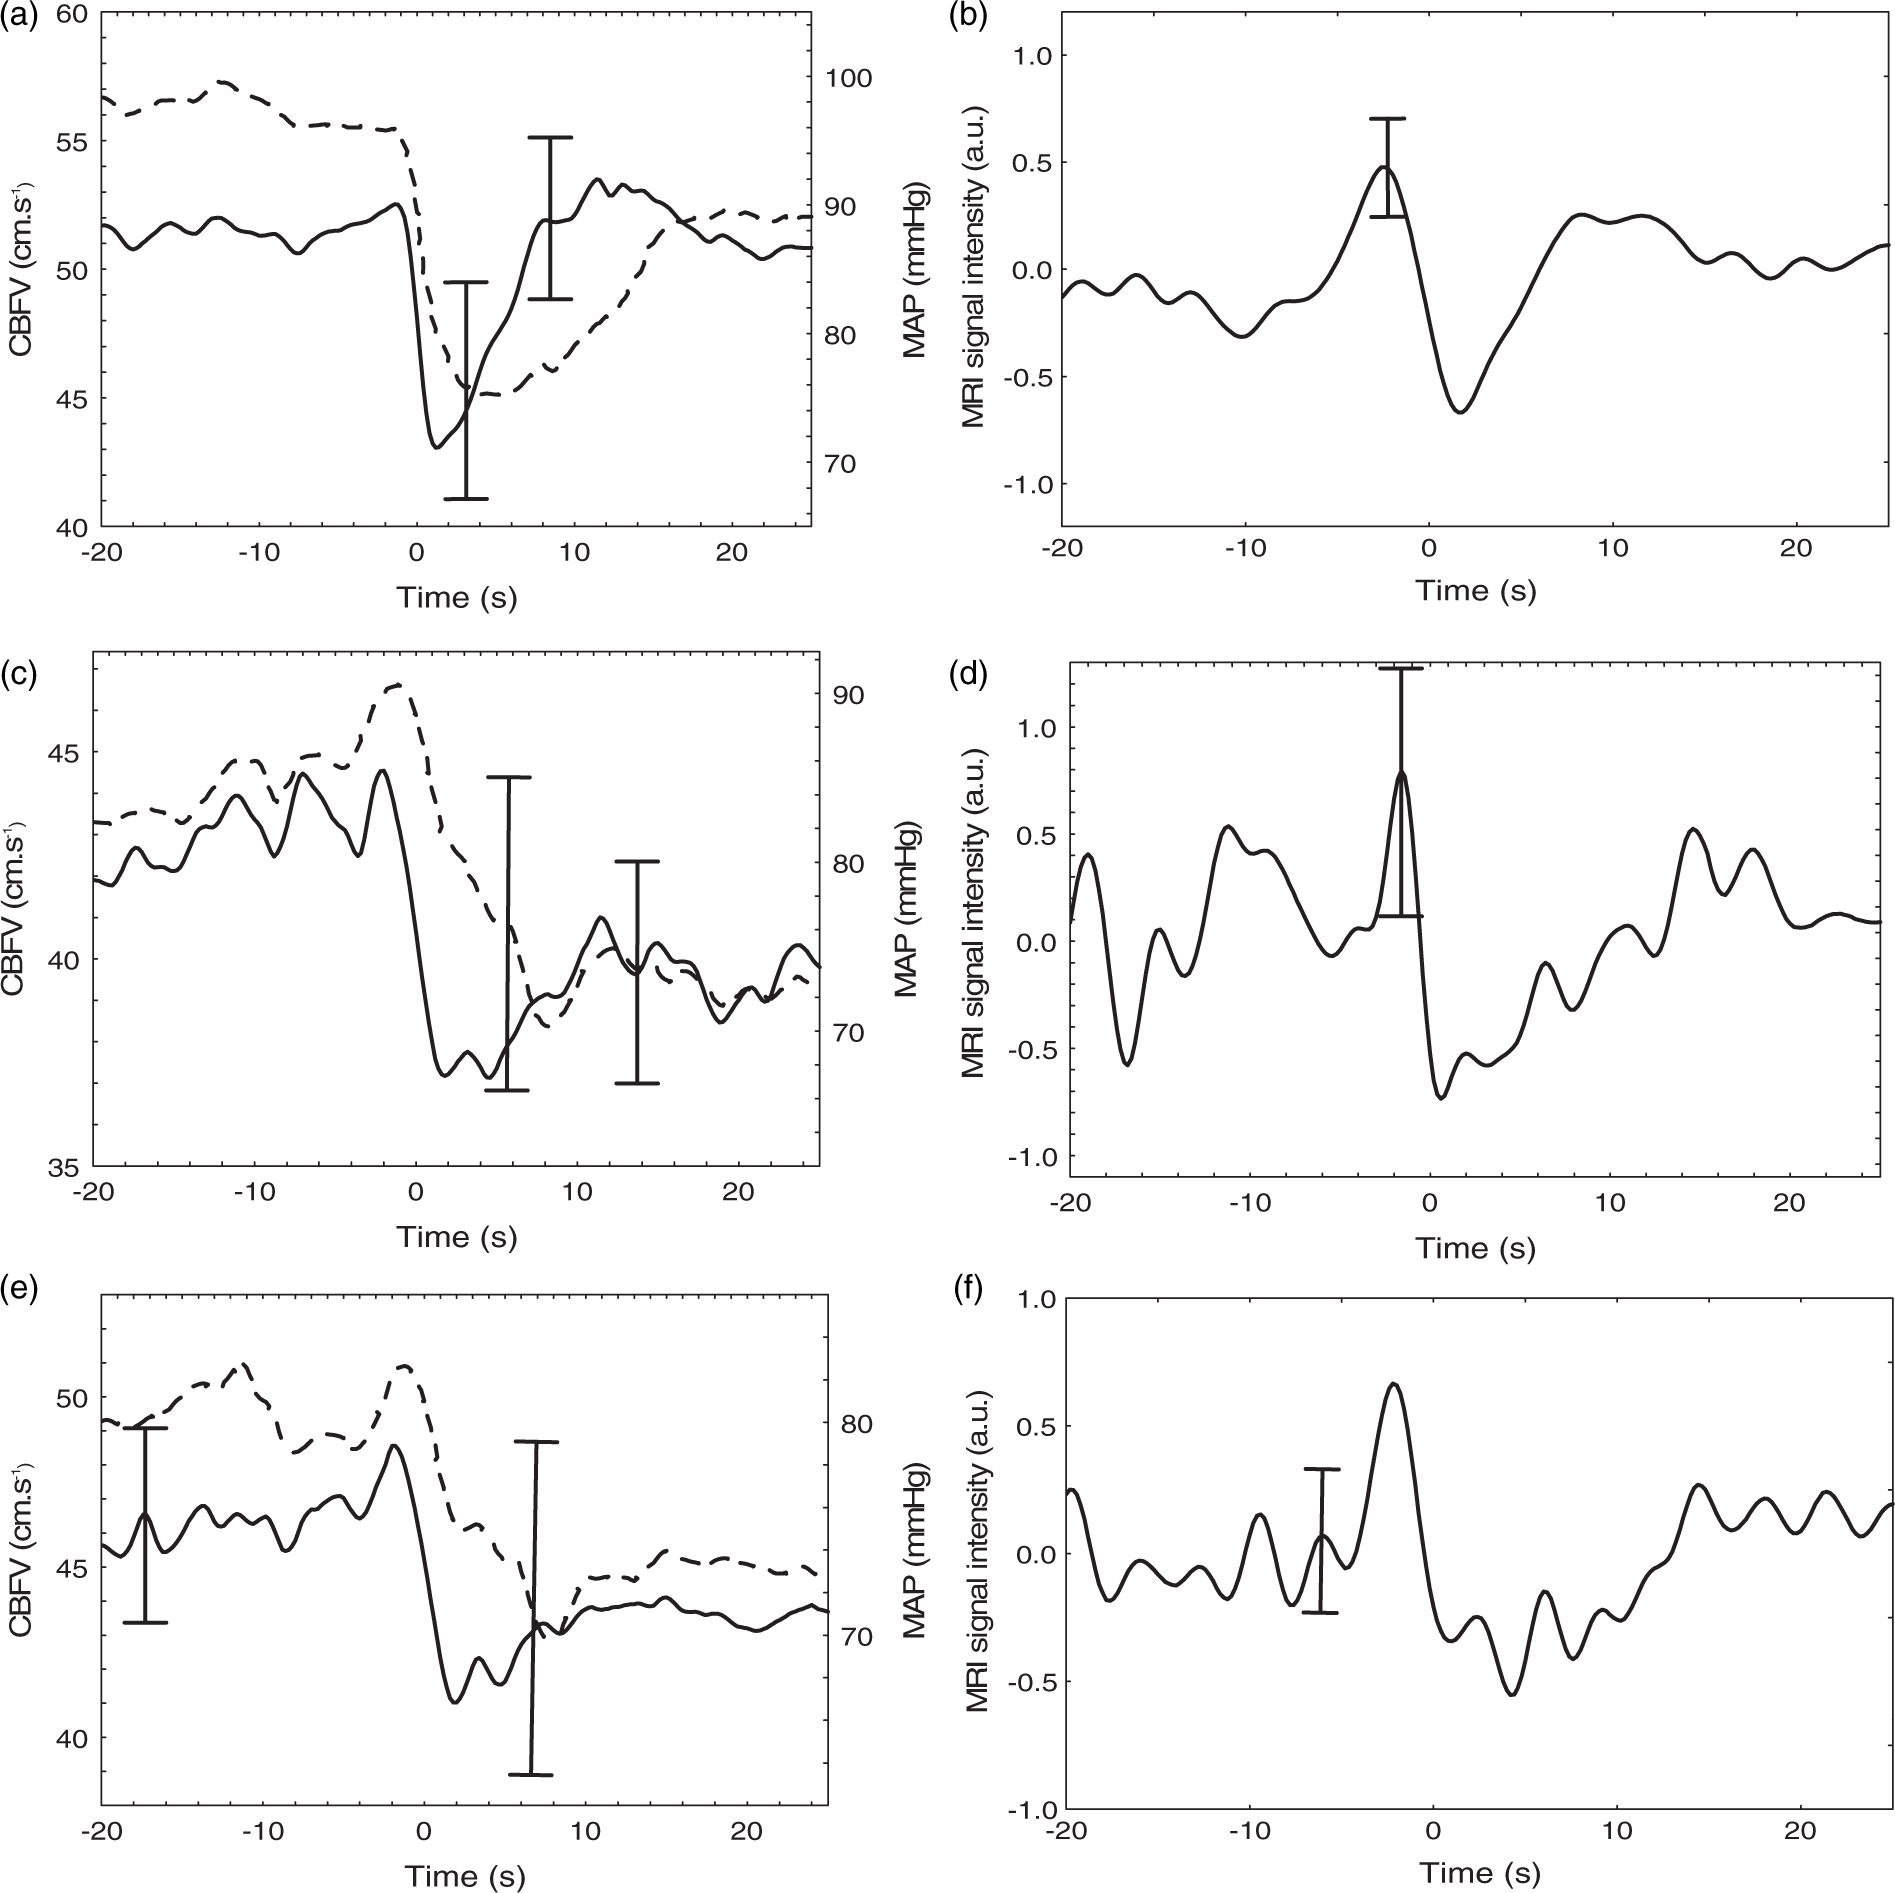
Coherent population averages of MCA velocity (a,c,e) and MRI intensity signal (b,d,f) for healthy controls (a,b) and contralateral (c,d) and ipsilateral (e,f) hemispheres of stroke patients. For TCD recordings, mean arterial pressure (MAP) is also included (dashed line). Error bars represent the largest ±1 SE at the point of occurrence.
ROC curves are shown in Figure 3. For both TCD and MRI, detection of ipsilateral strokes was significantly better than the classification of contralateral strokes (TCD AUCipsi = 0.900, AUCcontra = 0.765, p = 0.0477; MRI AUCipsi = 0.9775, AUCcontra = 0.708, p = 0.0283). No significant differences were observed for AUC comparisons between TCD and MRI, neither for the ipsilateral nor the contralateral sides.
Receiver operating characteristic curves for TCD (a) and MRI (b). Ipsilateral hemisphere (continuous line), contralateral hemisphere (dashed line).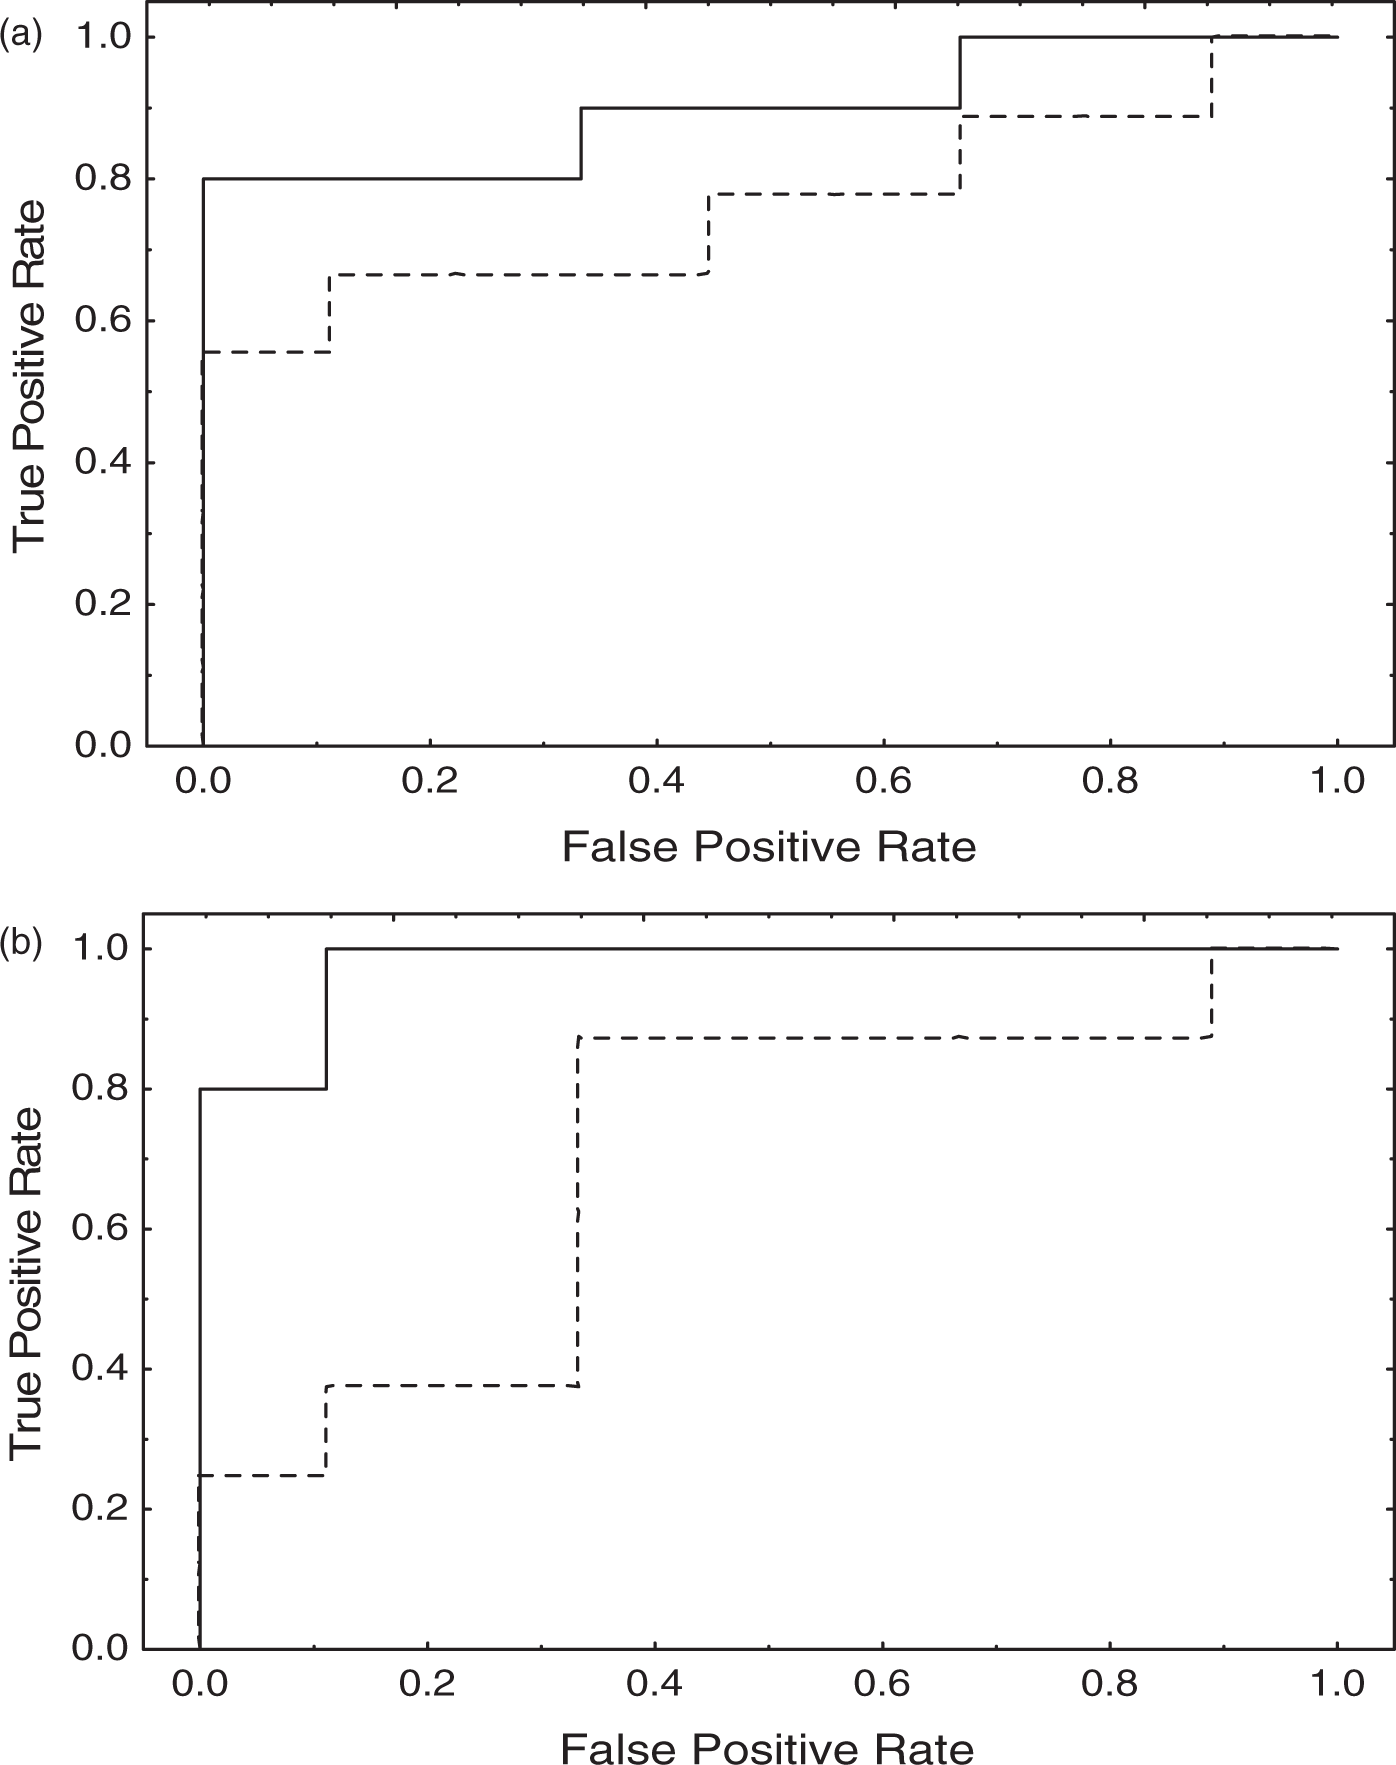
Discussion
The aim of this experimental study was to assess the potential of MRI to detect impairment of CBF pressure-autoregulation in comparison with the previously reported changes observed with TCD in patients with AIS. The motivation for developing an imaging-based alternative to TCD for assessing dynamic CA is that TCD can only measure flow velocity in the major cranial arteries that are accessible through the temporal bone window, most commonly the MCAs. Thus, impairment to autoregulation can only be assessed as an average over large brain areas and is usually taken to be indicative of changes at the level of an arterial territory or a brain hemisphere. With the ability of MRI to capture images of the whole brain, this introduces the possibility to evaluate focal changes.
We compared responses to the sudden release in thigh cuffs1 using flow velocity values in the left and right MCAs for TCD, and MRI signal intensity responses measured in the left and right hemispheres in image slices corresponding approximately to the MCA territories (Figures 1 and 2). Hence, although we did not fully exploit the imaging capabilities of MRI, the aim was to compare as closely as possible results from the two techniques in an AIS population.
Despite the small number of subjects successfully scanned, AIS patients had evidence of impaired dynamic CA from the MRI responses, similar to TCD, although no differences between the affected and unaffected hemispheres were identified. However, there is conflicting evidence for differences between the affected and unaffected hemispheres of stroke patients, with some researchers reporting a significant difference between hemispheres,10–13 and others reporting no difference.14–17 It was not possible to explore potential differences in the rate-of-return index (Rturn) related to stroke subtype, since only 11 of 37 recruited AIS patients had good quality data with both TCD and MRI techniques. Furthermore, patients were categorised according to the clinical Oxfordshire Community Stroke Project classification, though the investigation of differences between large vessel and other stroke subtypes (particularly small vessel) using the TOAST classification may have been more informative.
Limitations of the study
Undoubtedly, the main limitation of our study is the lack of simultaneous continuous BP measurement during MRI recordings. We are not aware of any non-invasive devices that can provide information similar to the Finapres within the environment of the MRI scanner. Despite this limitation, there is no reason to believe that the BP drops obtained during MRI recordings were significantly different from those achieved during the TCD test, when all participants showed significant pressure drops (Figure 2). Moreover, the sudden MRI signal drop following thigh cuff release, and the characteristic pattern of the response, in both controls and AIS patients (Figures 1 and 2), also suggest that the BP signal pattern was similar for the TCD and MRI recordings.
With MRI we also found a worse signal-to-noise ratio compared to the TCD, largely due to the presence of motion artefacts. When artefacts occurred before or after the 30 s period of thigh cuff release and signal recovery, narrow spikes (<3 s) could be removed by linear interpolation, but this was not acceptable during the 30 s window, and in these cases it led to the recording being rejected. Although we applied a motion correction scheme to co-register the individual images, motion artefacts is one area that needs addressing in future studies. In addition to motion artefacts, the need to ascertain that CBF dropped significantly and rapidly after cuff release also led to a significant number of recordings being rejected. For this reason, having more than one recording in each measurement session is paramount to increase the yield of acceptable data in future similar studies.
The signal-to-noise ratio limitations mentioned above did not allow a more detailed examination of regional differences in Rturn which is the ultimate objective of this line of work. We are still pursuing this objective with more sophisticated image analysis techniques and the use of higher intensity MRI machines should also improve prospects in this area. Nevertheless, the demonstration that pathophysiological differences in dynamic CA can be detected with MRI, similarly to that described for TCD, is an important stepping stone for progressing towards testing the hypothesis that acute ischemic events can lead to regional differences in dynamic CA.
As in most studies involving the use of TCD, it is not possible to guarantee that MCA cross-sectional area remained constant during examinations to assume that CBF velocity temporal patterns perfectly matched corresponding changes in absolute CBF. Nonetheless, Newell et al., 18 using electromagnetic flow meters in the carotid artery, have demonstrated that changes in MCA diameter are unlikely to take place during the thigh cuff manoeuvre. Although small changes in EtCO2 have been reported following the sudden release of thigh cuffs, 19 their amplitude were not sufficient to induce significant changes in MCA diameter.20,21
The higher heart rate and lower EtCO2 in patients, compared to controls, suggest that patients might have demonstrated greater anxiety during recordings than control subjects. We are not aware of any reports in the literature suggesting that relatively small differences in heart rate (∼10 bpm) could influence dynamic CA. On the other hand though, it is well known that hypocapnia tends to improve dynamic CA 1 with the implication that if patients had PaCO2 values closer to those of controls, their values of Rturn would be expected to be even lower. Relative hypocapnia in patients with AIS was also observed in a separate recent study in our lab, involving a completely different group of stroke patients. 22
Finally, due to the lack of BP measurement during the MRI test, we adopted an alternative index of dynamic CA, based on the rate of return of the CBF signal to baseline, following the sudden drop induced by cuff release (Figures 1 and 2). This index has a similar logic to the rate of regulation (RoR) adopted by Aaslid et al. 1 in their seminal study and it also has similarities to a recently proposed model-free index of dynamic CA. 23 The Rturn index represents a relatively simple common metric to assess both types of response (TCD and MRI), following the temporal patterns observed for controls and patients (Figures 1 and 2). However, it must be made clear that this does not represent a broader proposal to replace indices that have been previously validated, such as the ARI or phase values from transfer function analysis of the BP–CBFV relationship. 24
Conclusions
Because of its greater spatial discrimination, MRI-based assessment of CA is an appealing alternative to the current TCD-based methods for exploring regional CA changes as a consequence of AIS and other acquired brain pathologies. We have previously demonstrated that the signal change seen in a gradient-echo MRI sequence is similar to the blood flow velocity change seen using TCD in response to a THC manoeuvre. In the current study, we have been able to show that the MRI method is able to discriminate between healthy controls and stroke patients. The low signal-to-noise ratio in the data we acquired precluded more detailed investigation of any regional variations at this time. The improved signal-to-noise ratio and BOLD contrast when using MRI scanners of higher field strength 25 should lead to a significant improvement in the quality of measurements, and requires further investigation. Studies with greater statistical power are also needed to shed light into potential inter-hemisphere differences in AIS patients.
Footnotes
Funding
The author(s) disclosed receipt of the following financial support for the research, authorship, and/or publication of this article: The Stroke Association of the United Kingdom. NPS also received funding from the NIHR BRU for Cardiovascular Sciences. JLJ was partially funded by the University of Santiago de Chile and Becas Chile.
Declaration of conflicting interests
The author(s) declared no potential conflicts of interest with respect to the research, authorship, and/or publication of this article.
Authors' contributions
RBP, MAH and TGR conceptualise and planned study; NJS and MAH performed data collection; NJS, JLJ, MAH and RBP performed data editing and analysis; MAH and RBP wrote manuscript, RBP, JLJ, NPS, MAH and TGR checked manuscript and approved final version.