
Abstract
L-glutamine (Gln) is the most abundant amino acid in plasma and cerebrospinal fluid and a precursor for the main central nervous system excitatory (L-glutamate) and inhibitory (γ-aminobutyric acid (GABA)) neurotransmitters. Concentrations of Gln and 13 other brain interstitial fluid amino acids were measured in awake, freely moving mice by hippocampal microdialysis using an extrapolation to zero flow rate method. Interstitial fluid levels for all amino acids including Gln were ∼5–10 times lower than in cerebrospinal fluid. Although the large increase in plasma Gln by intraperitoneal (IP) injection of 15N2-labeled Gln (hGln) did not increase total interstitial fluid Gln, low levels of hGln were detected in microdialysis samples. Competitive inhibition of system A (SLC38A1&2; SNAT1&2) or system L (SLC7A5&8; LAT1&2) transporters in brain by perfusion with α-(methylamino)-isobutyric acid (MeAIB) or 2-aminobicyclo-(2,2,1)-heptane-2-carboxylic acid (BCH) respectively, was tested. The data showed a significantly greater increase in interstitial fluid Gln upon BCH than MeAIB treatment. Furthermore, brain BCH perfusion also strongly increased the influx of hGln into interstitial fluid following IP injection consistent with transstimulation of LAT1-mediated transendothelial transport. Taken together, the data support the independent homeostatic regulation of amino acids in interstitial fluid vs. cerebrospinal fluid and the role of the blood–brain barrier expressed SLC7A5/LAT1 as a key interstitial fluid gatekeeper.
Introduction
The blood–brain barrier (BBB) is an extensive microvascular network controlling entry and exit of substances between the blood and the brain by both physical and metabolic barriers to free exchange. Unlike in the periphery, brain endothelial cells form a tight barrier through expression of contiguous, well-organized tight junctions and lack of transcellular channels and fenestrations. Furthermore, the endothelium exhibits a polarized (luminal vs. abluminal) distribution of proteins including transporters.1–3 The BBB endothelium in association with pericytes (within a common basement membrane), astrocytic endfeet (with an associated parenchymal basement membrane), and neurons form “the neurovascular unit”. 1
All amino acids (AAs), whose diverse metabolic and regulatory functions include serving as neurotransmitters and neurotransmitter precursors, are tightly controlled in the central nervous system (CNS). Since testing cerebrospinal fluid (CSF) is less invasive than sampling brain interstitial fluid (ISF), CSF is more thoroughly characterized than ISF. Therefore, CSF is commonly used for diagnostic and drug development as a proxy for ISF. Although, there are known similarities between CSF and ISF, for example, in the ionic composition (i.e. K+, Ca2+, Na+, Cl−), it is unclear whether this is a valid assumption for many solutes. CSF concentrations for most AAs are ∼6 to 10 times lower than in plasma. One exception is the most abundant plasma AA, L-glutamine (Gln), which is nearly as high in CSF as in blood. 4 However, in brain ISF the reported Gln levels vary ∼two fold.5,6 Gln is a precursor for the major excitatory (L-glutamate (Glu)) and inhibitory (γ-aminobutyric acid (GABA)) neurotransmitters. 7 Furthermore, levels are altered during neuropathologies such as Huntington disease, ischemia, and epilepsy,8–10 and hyperammonemia, or hepatic encephalopathy (HE). 11 Therefore, Gln concentrations must be efficiently regulated in the ISF.
In general, AAs do not freely diffuse across membranes instead specialized membrane proteins or solute carriers (SLC) transport AAs across membrane barriers. Prior to their molecular identification AA transporters (AAT) were classified as “systems” based on substrate specificity and dependence (or lack of) on Na+ for activity. Figure 1 illustrates expression of known Gln transporters in the CNS. The Na+-dependent system A transporters SLC38A1 (SNAT1) and SLC38A2 (SNAT2) expressed by neurons12,13 participate in Gln uptake for Glu or GABA synthesis
7
; however, some other Gln transporters were also found in neurons.14–17 Astrocytes express a wide range of Gln transporters such as SLC1A5 (ASCT2), SCL38A2 (SNAT2), SCL38A3 (SNAT3), SLC38A5 (SNAT5), SLC7A6 (y+LAT2), SLC7A5 (LAT1) and SLC7A8 (LAT2),14,18–21 although in adults ASCT2 and y+LAT2 levels are minimal.18,22 The abundantly expressed Na+-dependent pH sensitive SNAT3 and SNAT5 are thought to be the main astrocytic transporters for Gln efflux to neurons for the Glu/GABA-Gln cycle.
7
The BBB also expresses several different AAT involved in Gln transport.
23
Due to abundant expression and endothelium membrane localization LAT1 and SNAT3 may perform central roles in the BBB modulated control of brain ISF homeostasis for Gln and other AAs.2,23
Diagram of glutamine transporters expressed in the neurovascular unit cells. The abbreviations used for the transporters are: ASCT2 (SLC1A5, sodium-dependent amino acid antiporter), B0AT2 (SLC6A15, sodium amino acid symporter), y+LAT1 and y+LAT2 (SLC7A7 and SLC7A6, antiporters of neutral amino acids and sodium against cationic amino acids), SNAT1, SNAT2 and SNAT7 (SCL38A1, SLC38A2 and SLC38A7, sodium amino acid symporters), SNAT3 and SNAT5 (SCL38A3 and SLC38A5, sodium amino acid symporters and proton antiporters) and LAT1 and LAT2 (SLC7A5 and SLC7A8 sodium-independent amino acid antiporters). Relative expression levels are indicated by the box borders as follows: thick borders = high, thin solid borders = moderate, and thin dotted borders = low expression. The arrows indicate the possible directions of L-glutamine transport into (pointing towards) or out of (pointing away) the cells. BCH-sensitive system L transporters (LAT1 and LAT2) indicated with grey boxes. The system A transporters (SNAT1 and SNAT2) that are sensitive to MeAIB are shown with dotted box fill. The data are based on in vivo and in vitro studies.2,3,12–23,24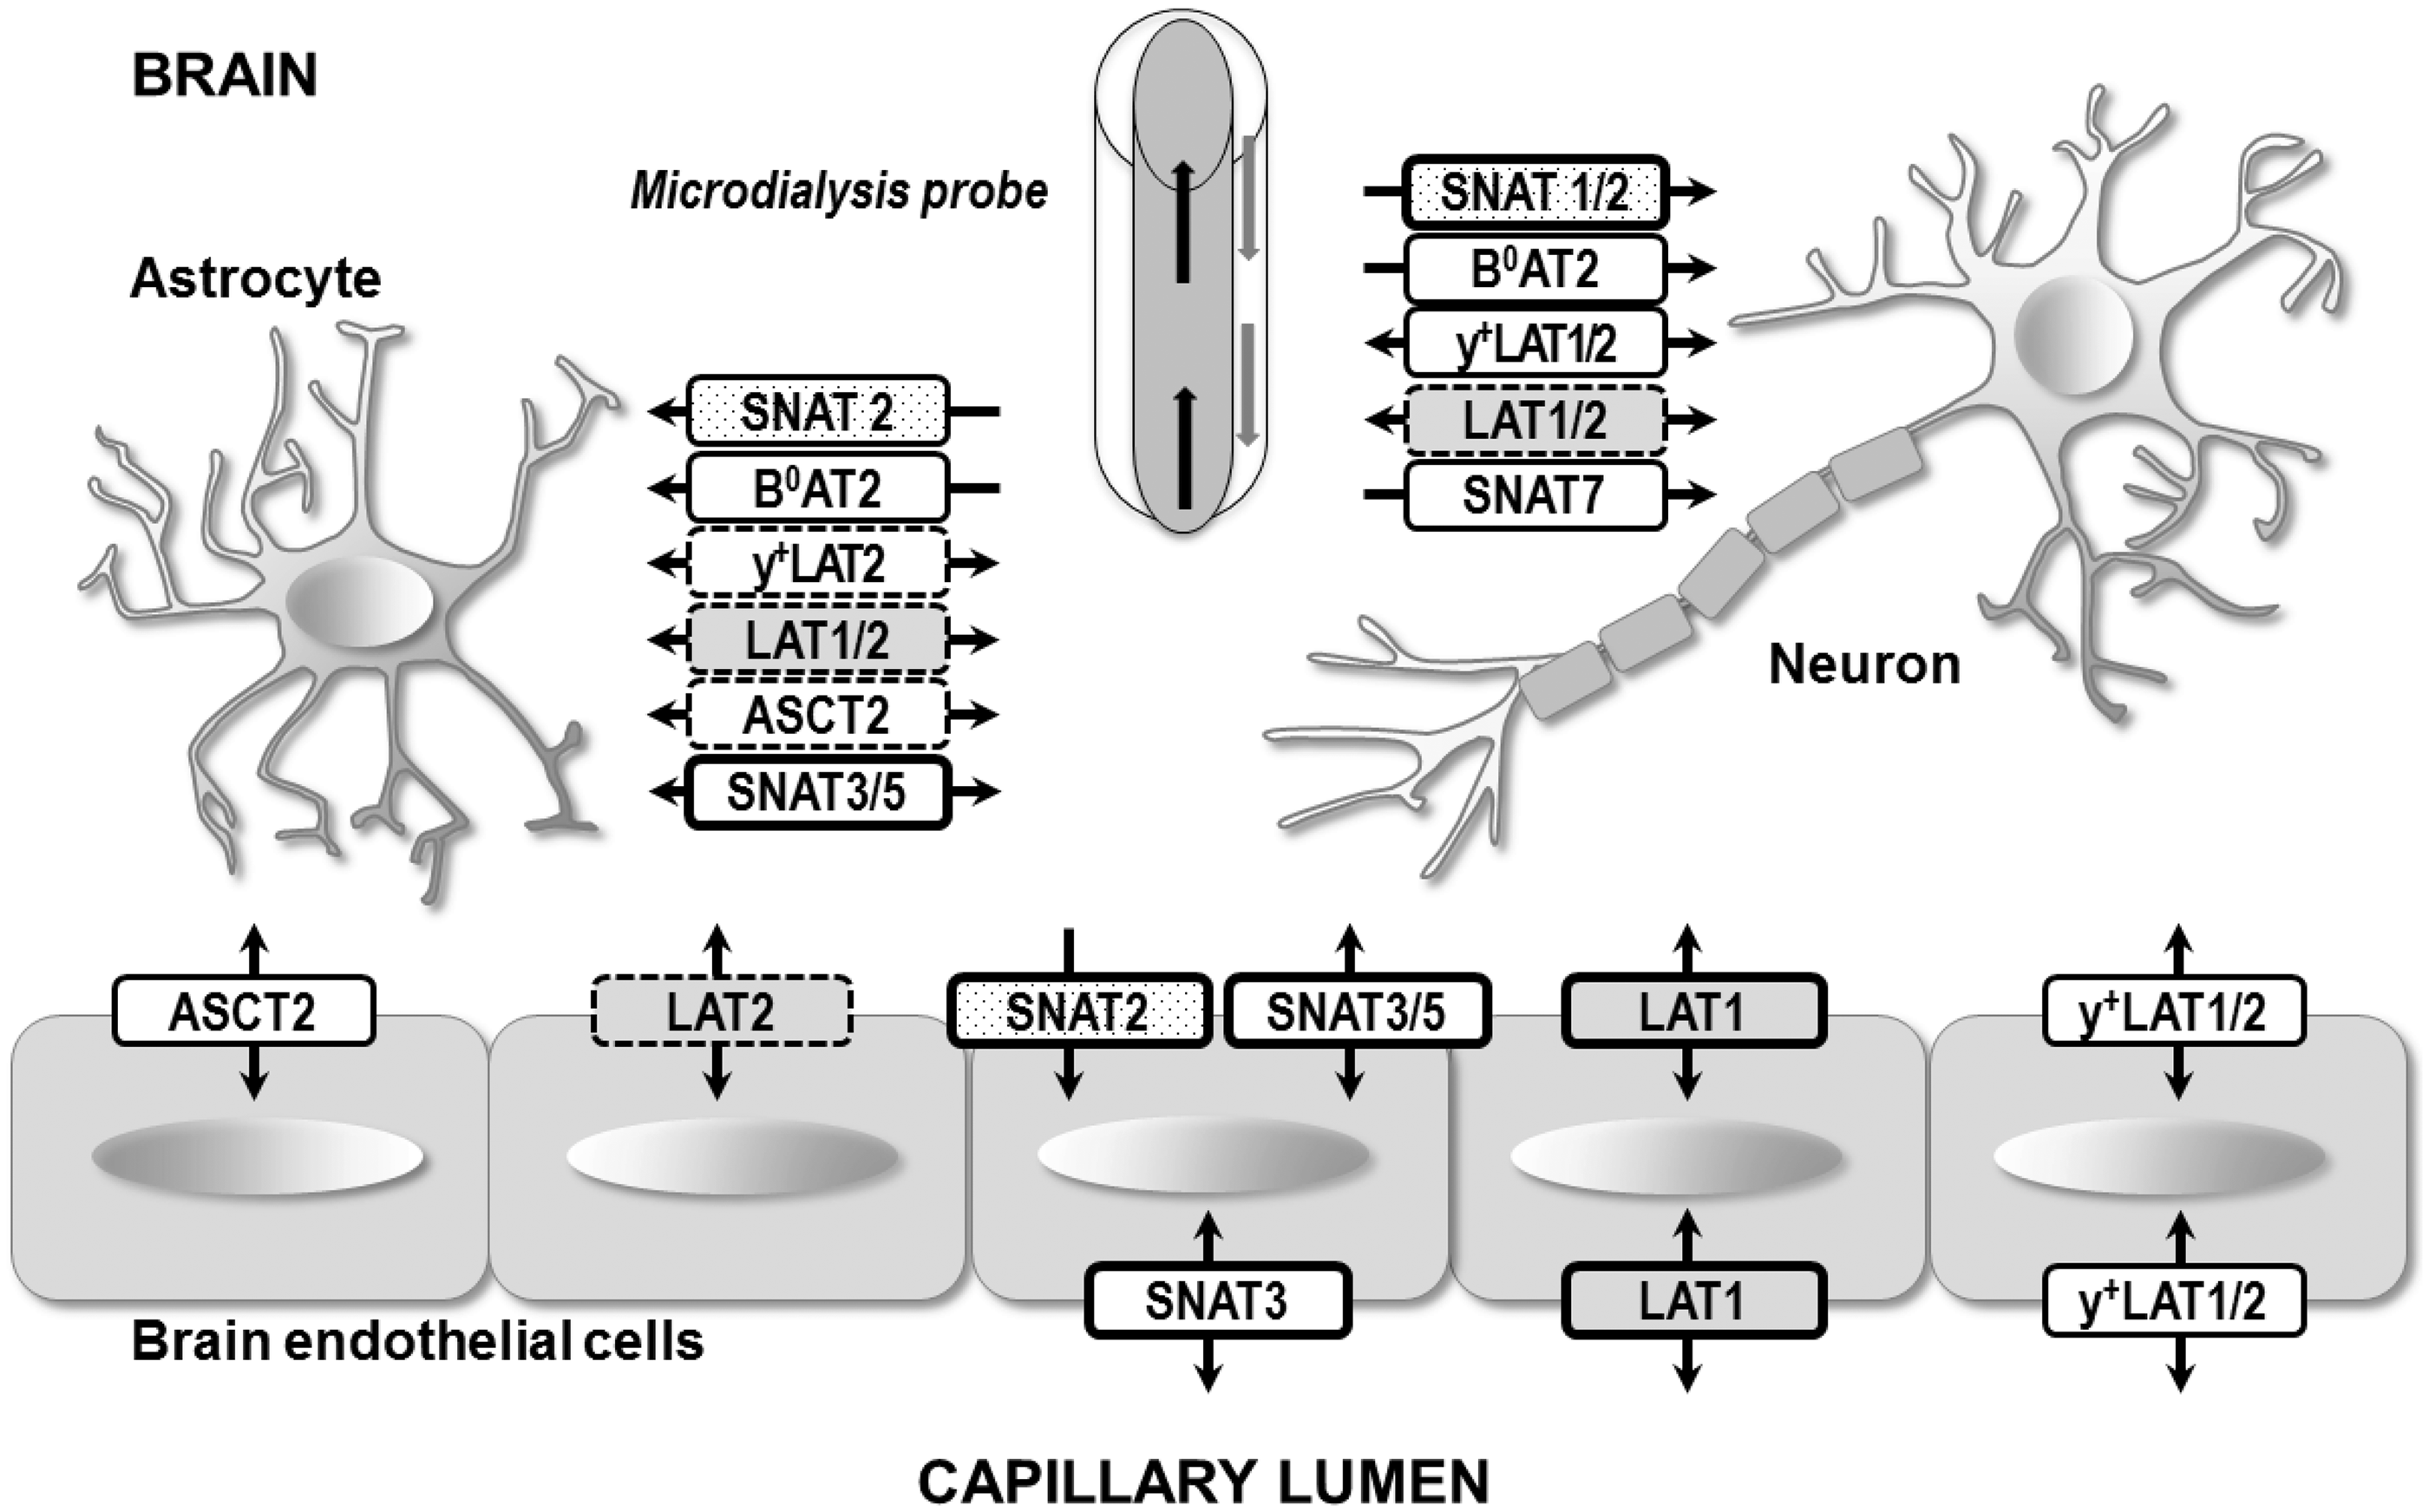
A central aim of the current study was to accurately measure the ISF AA concentrations. Hippocampal ISF AA content was quantified and AA regulation investigated by in vivo microdialysis in freely moving mice. Here we report a quantitative comparison of AA levels in ISF vs. CSF and plasma. Furthermore, responses to acute peripheral and/or parenchymal challenges support a central role for BBB expressed LAT1 transporters in regulation of Gln homeostasis in the ISF.
Materials and methods
Animals
All animal experiments were conducted in accordance with the Swiss federal and cantonal law and were performed with the approval of the Swiss Veterinary Council. This study has not been performed specifically following the ARRIVE guidelines, but completing the corresponding Checklist showed that most of the applicable recommendations were implemented.
For all experiments 12–14-week-old male C57BL/6J mice (Charles River (Crl), Germany) (22–29 g) were used. Prior to surgeries mice were adapted for one week to food ad libitum during the active period (night) and food restriction during the inactive phase (day), with water ad libitum at all times.
Microdialysis
Microdialysis materials and chemicals
Microdialysis guide cannulas (CMA 7, P000138,) and probes (CMA 7: 6 kDa MW cut-off, with 1.0 mm (cat. #P000082) or 2.0 mm (cat. #P000083) membranes were purchased from CMA Microdialysis AB, Kista, Sweden. Dental acrylic cement (CE 0086) was purchased from Pattern Resin LS, Powder & Liquid, GC America Inc., USA. FEP (fluorinated ethylene propylene) tubing, and tubing adapters were purchased from Microbiotech/se AB (Stockholm, Sweden). Samples were collected in a temperature-controlled fraction collector (EFC-82, Eicom, Dublin, Ireland). Norleucine (NLeu), α-(methylamino)-isobutyric acid (MeAIB), 2-amino-2-norbornanecarboxylic acid (BCH), L-glutamic acid-γ-monohydroxamate (GAH), L-glutamine (Gln), L-valine (Val), sulphosalicylic acid (SSA), and cresyl violet acetate were purchased from Sigma-Aldrich Chemie GmbH (Buchs, Switzerland). 15N2 heavy labeled L-glutamine (hGln) and fully labeled L-glutamine 13C515N2, were obtained from Cambridge Isotope Laboratories Inc. (Tewksburry, MA, USA).
In vitro microdialysis
The relative recovery (RR) and mass transfer coefficient (K0) were estimated for 1 and 2 mm CMA7 probes in vitro (supplementary Tables 1 and 2). Probes were placed in a solution with 15 standard AAs with and without NLeu. Artificial cerebrospinal fluid (aCSF, composition in mM: NaCl 147; KCl 4.03; CaCl2 2.52; pH 7.4) or aCSF with 100 µM NLeu was used for perfusion as indicated. For K0 determination the fractions were collected at four flow rates (0.1, 0.5, 1, and 2 µl/min) with adequate equilibration between flow rate changes. Samples were stored at −80℃ for UPLC.
Intracerebral microdialysis in awake, freely moving mice
Surgery
Mice were deeply anaesthetized by an intraperitoneal (IP) injection (10 µl/g body weight) of fentanyl 50 µg/ml, midazolam 5.0 mg/ml and medetomidin 1 mg/ml in 0.9% sterile saline. Eye cream (Viscotears, Novartis Pharma Schweiz AG, Bern, Switzerland) was applied, and body temperature controlled at 37℃. Using a stereotactic frame guide cannulas were implanted in the hippocampus at AP: −3.1; L: +2.9; V: −2.3 25 and supported by screws and dental acrylic cement. After surgery, the anesthetic was antagonized by IP injection of 10 µl/g body weight 0.4 mg/ml naloxon, 0.1 mg/ml flumazenil and 5.0 mg/ml atipamezol in 0.9% sterile saline. For two days post-surgery an analgesic was administered in drinking water (200 µg/50 ml temgesic) and mice fed ad libitum. Thereafter and for the duration of microdialysis experiment food restriction was resumed with drinking water ad libitum. Food restriction was instituted to preemptively reduce variability in microdialysate AAs. Mice were weighed daily and mice that lost more than 10% body weight were excluded. Additionally, comparisons between 1 µl/min 24 h microdialysate collection failed to show any significant changes in AAs with or without food restriction (data not shown). Eighteen hours before experimental microdialysate collection, microdialysis probes were inserted and for the first 4–6 h perfused at 1 µl/min, followed by an overnight perfusion at 0.1 µl/min (supplementary Figure 1). During microdialysis mice were subjected to normal 12 h light and dark cycles. They were singly housed in cages equipped with swivels that allowed free movement. Unless otherwise noted, 30 minute samples were collected at 1 µl/min and stored 8–12 h at +4℃ and at −80℃ until measurement (supplementary Figure 1).
Determination of brain interstitial fluid amino acid concentrations
Amino acid concentrations in brain ISF were determined using an extrapolation of microdialysate concentrations to “zero flow” rate (Flow-rate method).
26
The extrapolation is based on the inverse relationship between flow rate and the transfer of molecules (mass transfer rate). Relative recovery is a function of flow rate, probe surface area, and the mass transfer coefficient (K0), due to the chemical and physical properties of the solute and the matrix. The AA concentrations in 30 µl volumes of microdialysates collected at four flow rates (0.1, 0.5, 1, 2 µl/min) were extrapolated to original concentrations (C0) using the equation

To constrain the solution for C0, the mass transfer coefficient (K0) for the non-standard AA NorLeucine, (NLeu) was determined in vivo for each mouse. 27 Flow-rate experiments were performed twice: initially with aCSF perfusate, and repeated with aCSF +100 µM NLeu. K0 for NLeu vs. other AAs of interest was determined in vitro and found comparable. NLeu K0 for each mouse was applied for calculation of C0 of all other AAs using equation (1) (supplementary Figure 2(B)).
Microdialysis sampling during intraperitoneal AA injection or/and competitive inhibitors perfusion
For experiments with AA IP injection, mice were prepared for microdialysis as described; initially 3–4 control samples were collected (baseline), then vehicle (0.9% sterile NaCl) injected IP and 30 min samples were collected at 1 µL/min for 4 h. Half of the mice received 1.3 g/kg of hGln IP and the other half 240.5 mg/kg Val IP. Samples were collected as before for 4 h (supplementary Figure 1(C)).
For experiments with perfusion with competitive inhibitors, after baseline samples were collected for 2 h, probes were perfused with aCSF +20 mM methylaminoisobutyric acid (MeAIB) or 20 mM 2-aminobicyclo-(2,2,1)-heptane-2-carboxylic acid (BCH). After a 40-min equilibration with inhibitor (time until inhibitor has reached the microdialysis probe in the brain and then fraction collector), 30 min samples were collected for 3 h, then aCSF was re-introduced into the probes, equilibrated for 40 min and sampling was resumed for 3–4 h (supplementary Figure 1(D)).
For simultaneous IP AA administration with inhibitor infusion, baseline samples were collected for 2 h, probes equilibrated for 40 min perfusion with aCSF + 20 mM inhibitor. Following inhibitor equilibration, hGln (1.3 g/kg, in 0.9% NaCl) was administrated IP and microdialysate samples were collected for 2 h. Following cessation of inhibitor perfusion, probes were equilibrated with aCSF for 40 min and samples collected for 3 h (supplementary Figure 1(E)).
To calculate the total influx of Gln into the brain from the plasma following IP injection with heavy labeled Gln (hGln) the following calculation was used: (hGln/total Gln in microdialysis sample)/(hGln/total Gln in plasma) = total Gln influx to the brain from plasma.
Organ and tissue collection
Plasma collection
At chosen time points ≈20 µl blood samples were collected from tail tip cuts into Na+-heparinized microhematocrit tubes (Provet AG, Switzerland). Samples were centrifuged (10,000 g, 10 min, 4℃) in heparin containing vials (B. Braun Medical AG, Sempach, Switzerland), frozen on dry ice, and stored at −80℃ for measurement.
Terminal CSF, plasma, and brain collection
CSF samples were collected prior to terminal perfusion as previously described. 28 Briefly, mice were anaesthetized with IP ketamine (100 mg/kg) and xylazine (10 mg/kg), and an incision made in the skin inferior to the occiput. Under a dissection microscope, the dura mater of the cisterna magna was penetrated and CSF collected into a pulled glass capillary, frozen on dry ice, and stored at −80℃. CSF samples visibly contaminated with blood were discarded.
Blood was drawn by cardiac puncture, transferred to heparin containing tubes, and centrifuged to separate plasma (10,000 g, 10 min, +4℃). Mice were transcardially perfused with ice-cold PBS (10 mM Na2HPO4, 2.5 mM NaH2PO4, 150 mM NaCl, 3 mM KCl, pH 7.4), brains harvested and cut into hemispheres. Left hemispheres were incubated in PBS with 4.0% PFA at +4℃ overnight, and subsequently paraffin embedded for probe position verification, and right hemispheres were snap-frozen in liquid nitrogen and stored at −80℃.
Amino acid measurements
Ultra performance liquid chromatography amino acid measurements
The analysis of AA concentrations was performed at the Functional Genomic Center Zurich (FGCZ) using the Mass Track Amino Acid Analysis Application Solution by ACQUITY ultra performance liquid chromatography (UPLC; Waters, Milford, USA) according to the manufacturer’s protocol. Microdialysis and CSF samples were analyzed without deproteinization, and plasma samples were diluted 1:1 with 10% sulfosalicylic acid (SSA) for deproteinization prior to UPLC.
Mass spectrometry for heavy isotope-labeled glutamine quantification
Heavy labeled Gln (hGln) was detected in microdialysis and plasma samples by liquid chromatography mass spectrometry (LC-MS) using a Q Exactive Hybrid Quadrupole-Orbital Trap mass spectrometer (Thermo Scientific, USA) coupled with a nanoAcquity liquid chromatograph (Waters, USA). For quantification 2.5 µM of totally labeled glutamine (13C515N2) was added as an internal standard (IS) to dialysate samples. After thawing, samples were diluted 5-fold with 50 mM ammonium acetate in acetonitrile–methanol 9:1, vortexed and analyzed immediately. For each independent set of samples, hGln and total Gln calibration curves (10, 5, 2.5, 0.5 µM) containing 2.5 µM IS were measured. Quantification was based on the response factor from calibration curves.
After precipitation with 10% SSA plasma samples were diluted 10 times with borate buffer (500 mM, pH 9), precipitated with methanol 4:1 and analyzed as above. Baseline ratio of hGln/Gln measured by liquid chromatography mass spectrometry (LC-MS) before IP injection was 6.6 ± 2% in plasma and 0.13 ± 0.3% in microdialysates. The higher baseline hGln levels detected in plasma may have been an artifact of the LC-MS analysis since the naturally occurring frequency of the 15N isotope is 0.1–0.5%. 29 LC-MS may have over-estimated hGln in plasma but not in microdialysis samples.
Immunohistochemistry
Paraformaldehyde-fixed brains were paraffin embedded (Shandon Xylene Substitute, Thermoscientific), 5 µm coronal sections prepared using a microtome (RM 2235, Leica) and stored at +4℃ for staining. Nissl staining was performed for probe position validation. Paraffin sections were deparaffinized (Microm/Histocam AG, Thermoscientific) to 100% ethanol, extensively rinsed in water, and incubated 15 min in warm 2% cresyl violet. Excess cresyl violet was removed, sections dehydrated in 100% ethanol twice, and destained twice with xylene (Shandon Xylene Substitute, Thermoscientific). Nissl stained sections were imaged by a handheld USB digital Firefly GT800 microscope (Belmont, USA).
Statistical analysis
Sample data were plotted at the collection midpoint and, as indicated, sample time was adjusted for the time required to reach the fraction collector from the probe and reported as “time in the brain” (supplementary Figure 1).
Statistical analysis was performed using GraphPad Prism 5.0 (GraphPad Software, USA). Unless otherwise stated between-group comparisons were performed by Student’s t-test or two-way analysis of variance ANOVA (two independent factors: treatment and time), followed by Dunnett, Bonferroni or Sidak post-test as stated. Statistical significance was accepted at P < 0.05 or as indicated. All data are presented as mean ± standard deviation (SD) or mean ± standard error of the mean (SEM).
Results
Measurement of hippocampal interstitial fluid amino acid levels
Hippocampal ISF AA concentrations (C0) were extrapolated from microdialysis measurements using a method of extrapolation to “zero flow” (Flow-rate method, Methods, equation (1)). 26 To reach a unique solution for C0, the mass transfer coefficient (K0) for each mouse was determined using retro-dialysis of a known concentration (100 µM) of the L-leucine analog, Norleucine (NLeu), (supplementary Figure 2, supplementary Tables 1 and 2). In vitro experiments verified NLeu K0 is comparable to K0 for detected AAs (supplementary Table 2). To test whether perfusion with aCSF depletes AA in the ISF, samples gathered at 1 µL/min on 3–4 sequential days were compared for eight mice from two experiments (supplementary Figure 3). Mean levels for 10 detected AAs did not decrease significantly over four days (supplementary Figure 3(A) to (E)).
Mouse brain interstitial fluid, cerebrospinal fluid, and plasma amino acid concentrations and ratios.
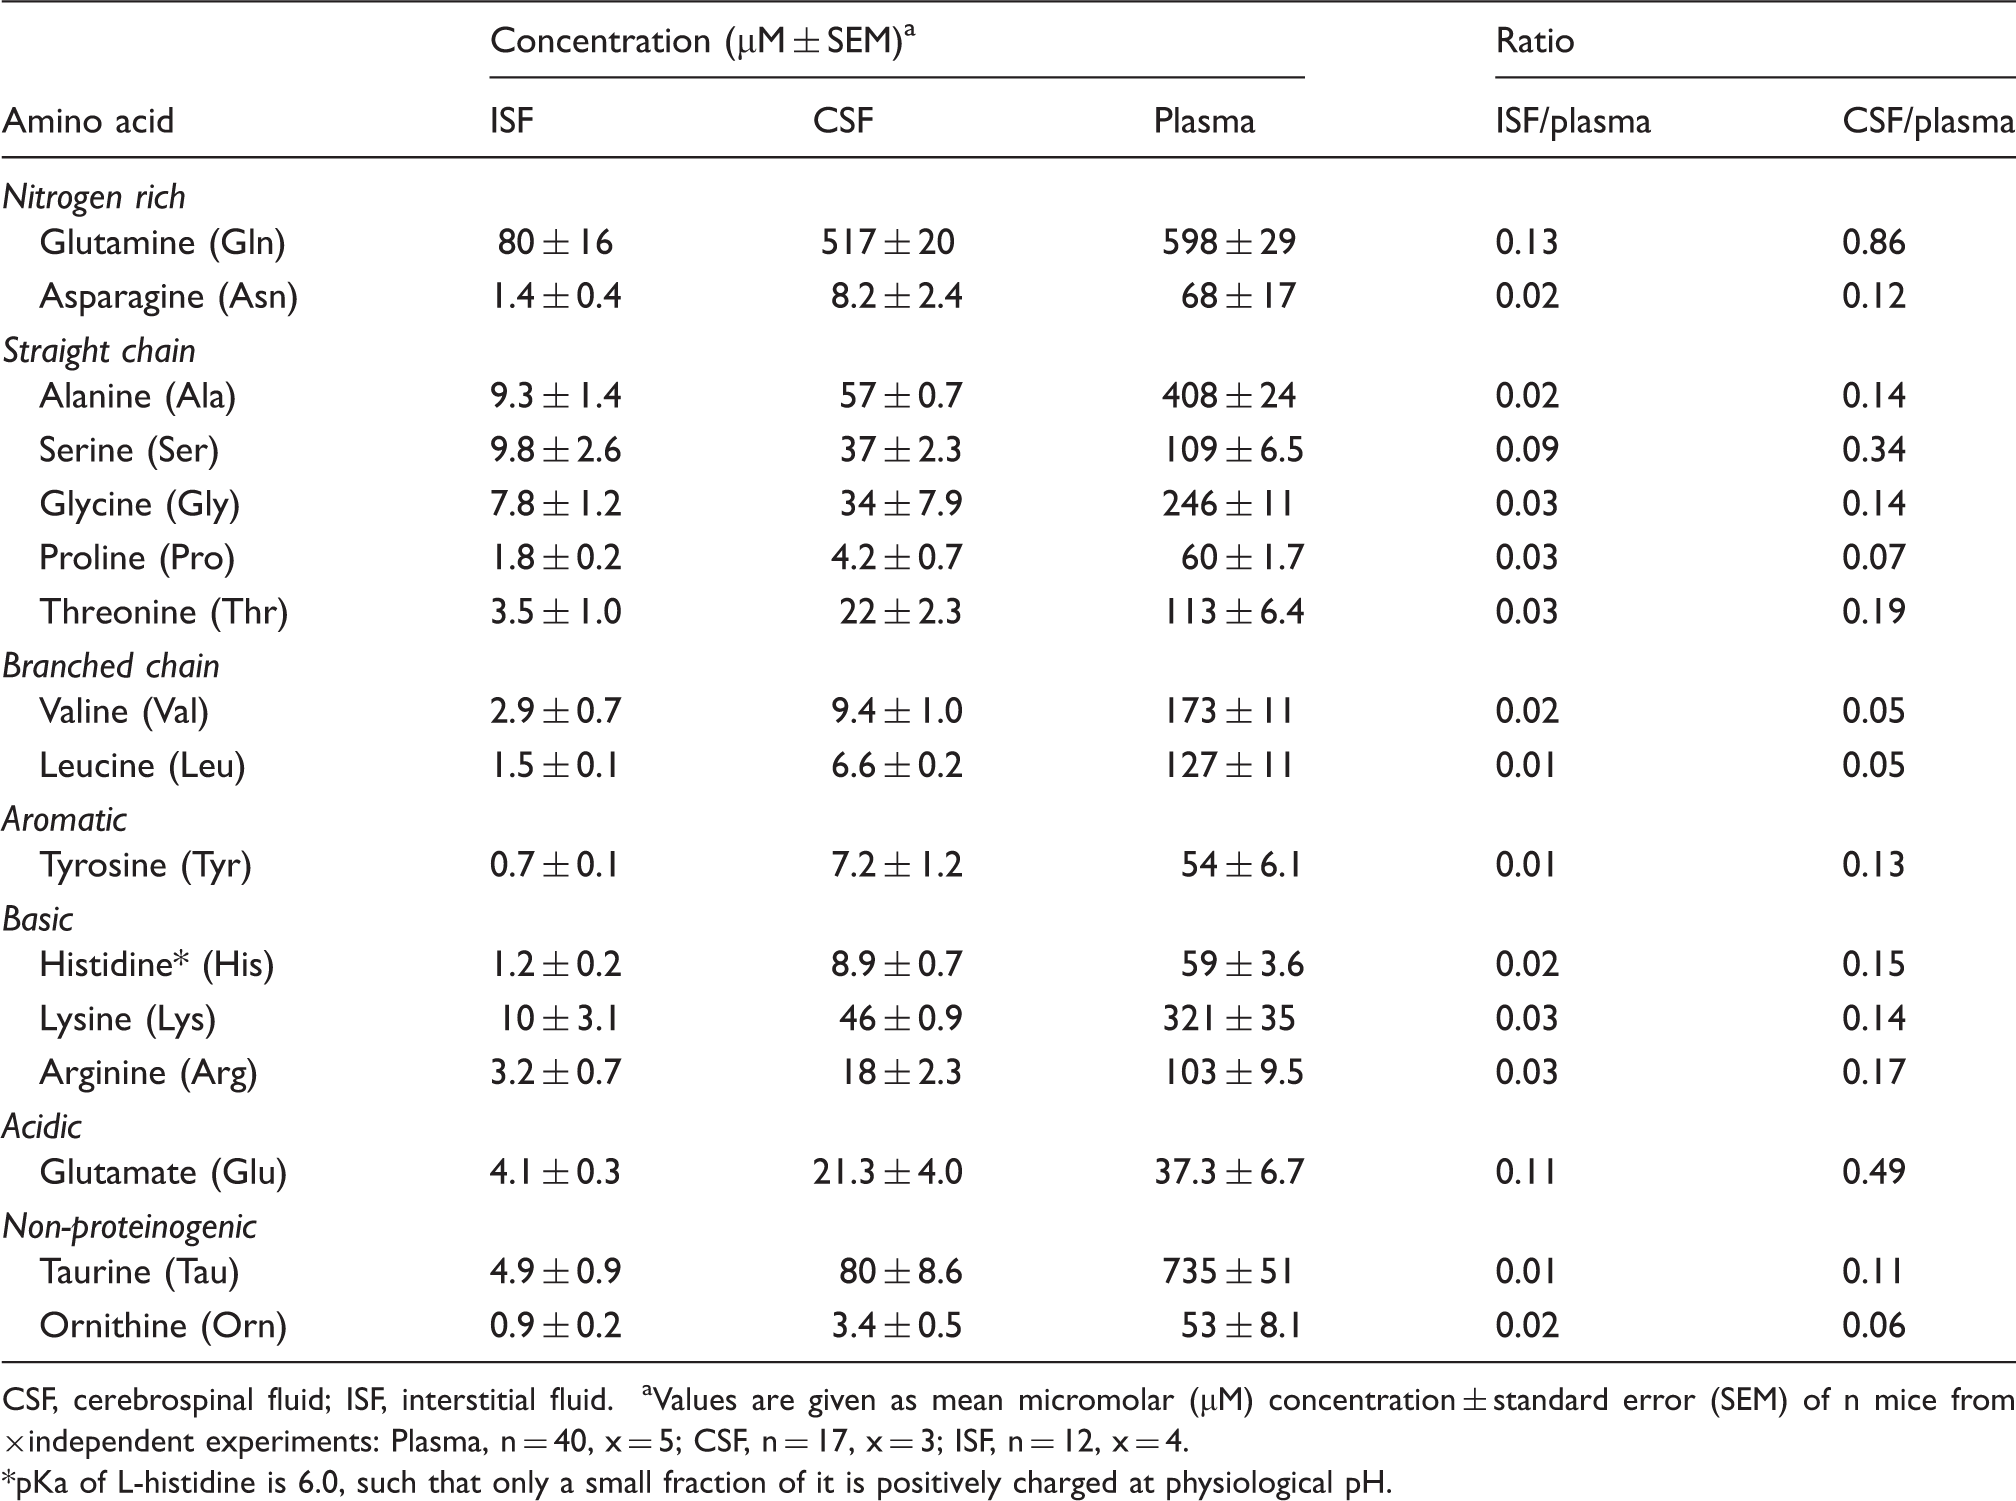
CSF, cerebrospinal fluid; ISF, interstitial fluid.
Values are given as mean micromolar (µM) concentration ± standard error (SEM) of n mice from ×independent experiments: Plasma, n = 40, x = 5; CSF, n = 17, x = 3; ISF, n = 12, x = 4. *pKa of L-histidine is 6.0, such that only a small fraction of it is positively charged at physiological pH.
ISF responses to large transient elevations in plasma levels of L-valine vs. L-glutamine
We next tested how acute increases in the plasma concentrations of two LAT1 substrates, Val (Figure 2(a)), and Gln (Figure 2(b)) affected ISF levels. Mice were injected intraperitoneally (IP) with an amount of each of these AAs corresponding to ∼200 times their amount in blood. Within 5–10 min after IP injection with Val plasma levels significantly increased to 674 ± 259% of the control value (Figure 2(a)). Similarly, following Gln IP injection, plasma Gln increased to 381 ± 42% (Figure 2(b)). Levels of all other AAs remained stable (data not shown) and IP injection of vehicle alone (0.9% saline) had no effect on Val or Gln levels (Figure 2(a) and (b)). Additionally, following Val IP injection, Val levels in microdialysis samples rose rapidly to 395 ± 175% of baseline (25’ post-IP) (Figure 2(a)). In contrast, there was no significant increase of total Gln in microdialysates at any time after IP injection with Gln. Rather within 1 h of Gln IP injection the non-significant trend was for decreasing ISF Gln levels (Figure 2(b)).
Plasma and brain interstitial fluid amino acid responses to intraperitoneal injection of L-valine or L-glutamine. The amount of each amino acid (AA) injected intraperitoneal (IP) in mg/kg body weight corresponds to ≈200 times total measured amount in plasma (concentration × blood volume). (a) Impact of L-valine (Val) IP injection (240 mg/kg Val or 0.9% NaCl vehicle (veh)) on plasma and interstitial fluid (ISF) Val concentrations (mean ± SD from four animals). (b) Impact of heavy labeled L-glutamine (hGln) IP injection (1.37 g/kg body weight of 15N2 labeled Gln (hGln) vs. 0.9% NaCl vehicle (veh)) on plasma and ISF hGln concentration (mean ± SD from 4 animals). (c) Ratio of hGln to total Gln (hGln/Gln) in plasma and ISF, as measured by liquid chromatography mass spectrometry (LC-MS). Data are presented as mean ± SEM for microdialysates from three independent experiments (n = 10 total mice) and mean ± SD for plasma from 1 experiment (n = 4). For all experiments, arrows indicate the time of AA IP injection. Statistical analysis was performed by two-way ANOVA with Dunnett’s post-test and statistically significant changes relative to baseline are indicated as: #### = p < 0.0001 and ## = p < 0.01;*** = p < 0.0001 and ** = p < 0.01.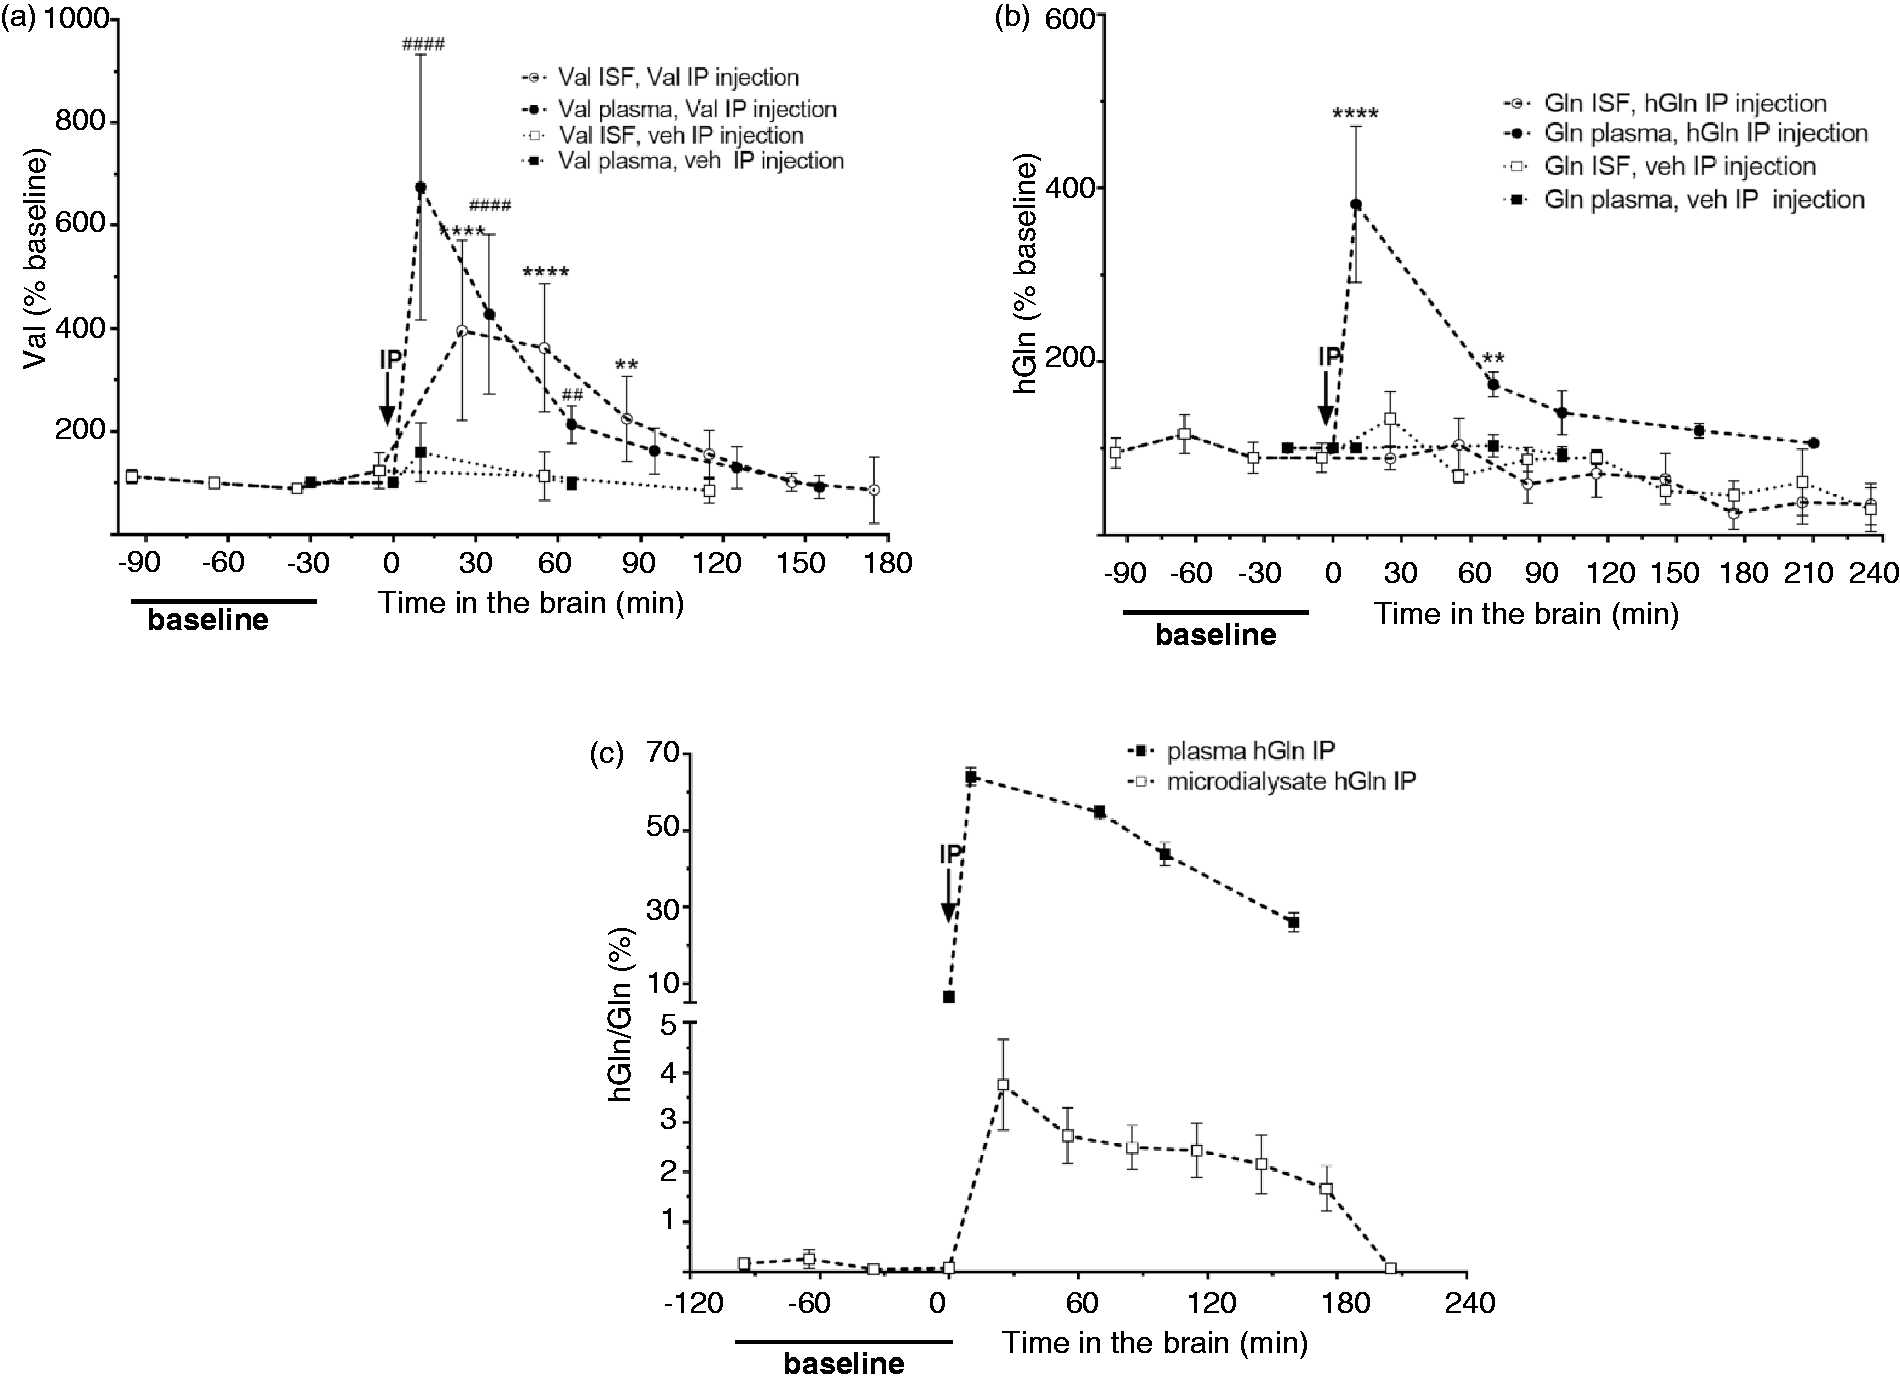
To test Gln transendothelial transport from the blood into the brain, Gln labeled with two heavy nitrogens (15N2) (hGln) was used for IP injections. Figure 2(b) shows total Gln in plasma and microdialysates measured by UPLC. Additionally, total and labeled Gln in microdialysate and plasma samples collected after hGln IP were analyzed by liquid chromatography mass spectrometry (LC-MS) (supplementary Figure 4). Figure 2(c) shows a time course for percent hGln vs. total Gln (hGln/Gln) in plasma and microdialysis samples. After IP injection ∼2/3 of total plasma Gln (64 ± 2% baseline) was labeled, while in microdialysates hGln increased to only 3.8 ± 0.9% of total Gln (25′ post-IP) (Figure 2(c)). Since following IP injection with hGln, 64% of the plasma Gln was labeled therefore, in total 1.6 Gln (labeled and unlabeled) must have been influxed to the brain from the plasma for every hGln recovered by microdialysis (1/0.64 = 1.6). This indicates post-IP injection approximately 6% of the Gln in the ISF originated from the plasma (0.04 hGln in ISF/0.6 hGln in plasma = 0.06 total Gln in ISF was from plasma). In plasma hGln decreased ∼10% in the first hour and after 3 h ∼30% of Gln was still labeled. hGln levels in the ISF were stable for 1 h before being slowly cleared (Figure 2(c)).
Competitive inhibition of system L vs. system A transporters in the brain
To test the relative contributions of system A (SNAT1&2) vs. L (LAT1&2) transporters in regulating Gln in ISF, known competitive inhibitors for each transport system type were perfused into the brain through the microdialysis probe. The microdialysate concentrations were normalized to baseline and the time of collection corrected by the time required to reach the fraction collector. Figure 3(a) and (b) shows time courses before, during, and after perfusion with 20 mM of the system A (SNAT1/2) inhibitor, methylaminoisobutyric acid (MeAIB) for the system A substrates glycine (Gly) and Gln, and non-substrates, Val and Tau.12,30 After 50 min of MeAIB perfusion Gly increased 256 ± 90% while Val did not change significantly (105 ± 37%) (Figure 3(a)), whereas Gln levels exhibited unstable behavior, transiently peaking at 80 min (219 ± 75%), returning to near baseline at 110 min, and rising again at 140 min (147 ± 35%) (Figure 3(b)). After 140 min of perfusion levels of the osmolyte, taurine (Tau) also doubled (182 ± 48%). Following inhibitor removal all AAs returned to near baseline after 120 min of aCSF perfusion.
Impact of brain perfusion with system A and L competitive inhibitors on amino acids in brain microdialysates. Competitive inhibitors (20 mM) were introduced in the brain by perfusion via the microdialysis probe (as indicated by the grey shaded area) for 3 h. For each panel the indicated amino acid responses in ISF are plotted normalized to baseline values vs. time in brain (adjusted for the time samples take to reach fraction collector). In panel a, Glycine (Gly), L-valine (Val), and in panel b, L-glutamine (Gln), and taurine (Tau) responses following 20 mM methylaminoisobutyric acid (MeAIB) brain perfusion are shown. Data are means ± SD from three animals. (c) Val, Gln, L-glutamate (Glu) and Tau concentrations as a result of brain perfusion of 20 mM 2-aminobicyclo-(2,2,1)-heptane-2-carboxylic acid (BCH). Data are means ± SD from four animals. (d) Gln levels in ISF normalized to the mean baseline values prior to MeAIB or BCH perfusion, respectively, and compared to Gln levels at 50 and 80 minutes of perfusion with the indicated inhibitor. For all panels, baseline samples are indicated by the solid line. Perfusate equilibration without sample collection is indicated by the break in the X axis (time in brain). Inhibitor presence in perfusate is indicated by the shaded area of the graph and underlined X axis region. Statistical comparisons were performed by two-way Anova with Dunnett’s post-test for the comparison of values obtained with inhibitor versus baseline (a,b,c) and with Bonferroni post-test for the comparison of values obtained with different inhibitors and with baseline (d). Tracked amino acids are indicated in the individual panel keys. Statistical significance for all panels are: **** = p < 0.0001, *** = p < 0.001, ** = p < 0.01, and * = p < 0.1; #### = p < 0.0001, ## = p < 0.01 and # = p < 0.1; $$$$ = p < 0.0001 and $ = p < 0.1.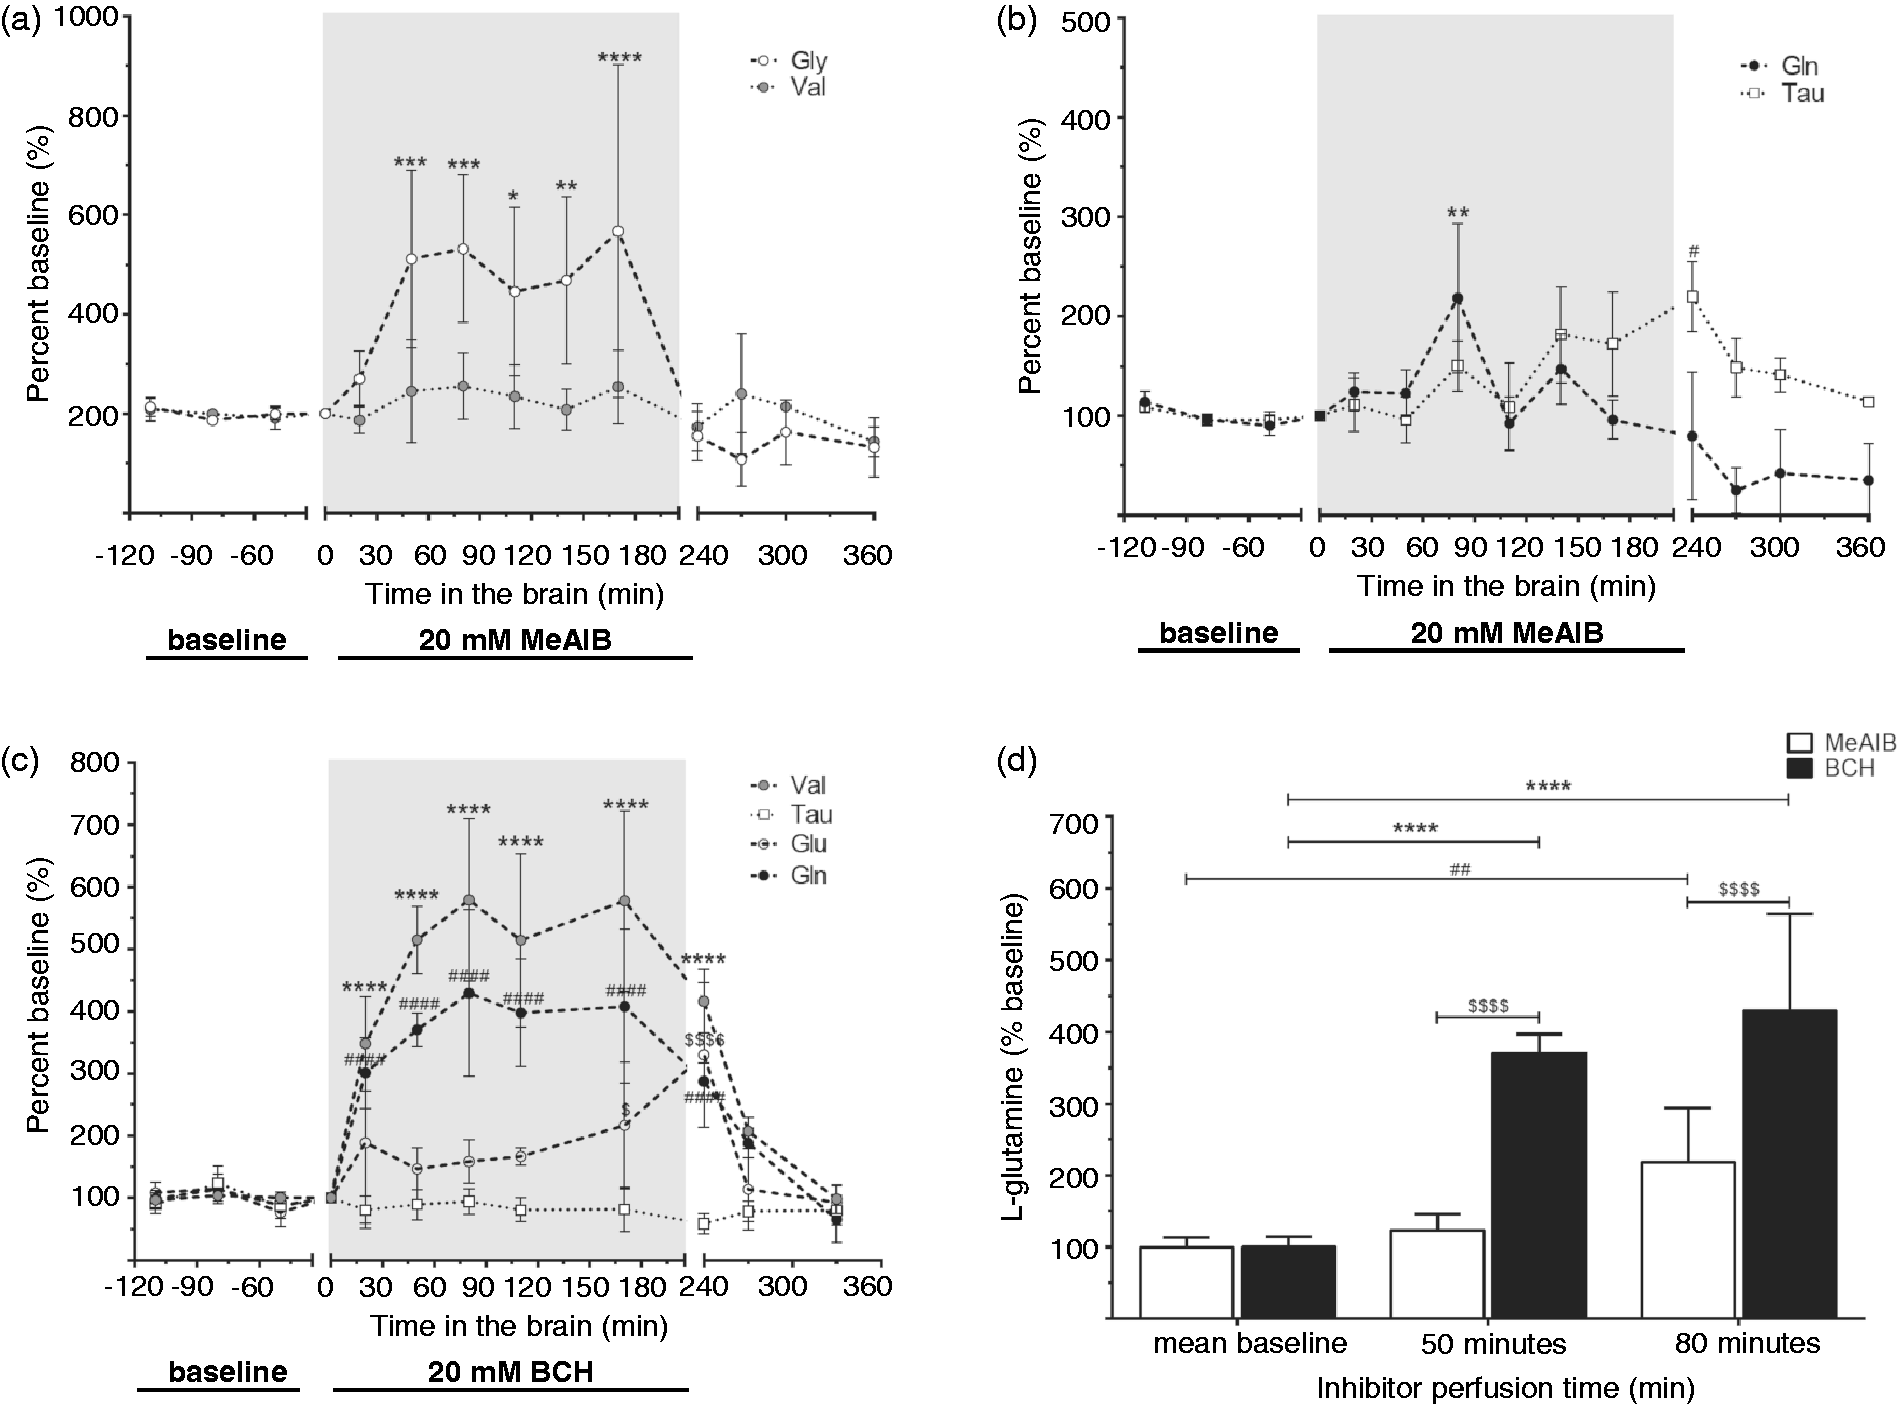
Figure 3(c) shows the time course pre-, during, and post-perfusion with 20 mM of the system L inhibitor 2-aminobicyclo-(2,2,1)-heptane-2-carboxylic acid (BCH) for the system L substrates, Val and Gln, and non-substrates, Glu and Tau. 31 Within 50 min of BCH treatment levels for Val (515 ± 54%) and Gln (371 ± 27%) rose significantly vs. baseline (Figure 3(c)). By 80 min of BCH Val plateaued at 579 ± 131% and Gln at 430 ± 134% of baseline (Figure 3(c) and (d)). However, unlike during MeAIB perfusion where Glu did not increase (data not shown), after 170 min of BCH treatment Glu significantly increased to 217 ± 102% of baseline. Tau remained stable throughout the BCH perfusion (Figure 3(c)). Removal of BCH by flushing with aCSF fully reversed AAs to baseline within 3 h (Figure 3(c)).
Since the system N transporters (SLC38A3/SNAT3 and SLC38A5/SNAT5) are abundantly expressed in BBB endothelial cells and astrocytes (Figure 1), a competitive system N inhibitor, glutamate-γ-monohydroxamate (GAH), 32 was tested. Perfusion of 50 mM GAH rapidly elevated Gln to ∼300% of baseline levels (at 20′); however, as GAH perfusion increased all AAs, a non-specific effect could not be ruled out (supplementary Figure 5(A) and (B)). Additionally, both BCH and GAH perfusion increased GABA, which returned to baseline upon inhibitor removal. Since neither inhibitor acts on known GABA transporters (SLC6A1/GAT1 and SLC6A13/GAT3), the data indicate the possible involvement of system L and N transporters in GABA ISF homeostasis (supplementary Table 3). Finally, at no time did any of the competitive inhibitor perfusions produce observable behavioral abnormalities in mice.
Combined system L competitive inhibition and heavy labeled glutamine intraperitoneal injection
Next we tested if the elevated Gln observed during BCH treatment resulted from increased transendothelial transport (by LAT1) or was due to release from another brain cell type expressing system L (e.g. astrocyte expressed LAT2). Therefore, BCH perfusion was repeated with hGln IP injection (Figure 4(a) and (b)) and compared to BCH perfusion without IP injection (Figure 3(c) and (d)). Fifty minutes after BCH perfusion of the brain (25′ post-hGln IP injection) total Gln increased significantly to 727 ± 238% in animals with hGln IP injection vs. 371 ± 27% for mice treated with BCH alone (Figures 4(a) and 3(c)). The increase in Val after 50 min BCH perfusion and hGln IP injection (25′ post-hGln IP injection) was approximately half that with BCH alone (242 ± 161% vs 515 ± 54%, respectively) (supplementary Figure 6(A)). As measured by LC-MS 25′ after hGln IP injection (i.e. 50′ after of brain perfusion with BCH), 50 ± 19% of the total microdialysate Gln was 15N2 labeled, indicating that 83% of the Gln in the ISF came from the plasma (0.53 ISF hGln/0.64 hGln plasma). Therefore, 600% of the 730% increase in baseline Gln in the ISF came from the plasma (7.3 × 0.83) (Figure 4(b)). In contrast, after 50 min of MeAIB perfusion + hGln IP injection (25′ post-hGln IP injection) no hGln was detected in microdialysis samples and at 80 min MeAIB (55′ post-hGln IP) hGln was 0.06 ± 0.007% of total Gln vs 2.5 ± 0.4% in mice receiving hGln IP alone (supplementary Figure 6(B)).
Interstitial fluid total and labeled L-glutamine concentrations following brain perfusion with BCH without or with labeled hGln intraperitoneal injection. (a) ISF Gln levels are plotted relative to baseline for samples collected before, during, and after 20 mM (2-aminobicyclo-(2,2,1)-heptane-2-carboxylic acid (BCH) brain perfusion alone (data from Figure 3(b)) or in combination with hGln intraperitoneal (IP) injection. Data are mean percent relative to baseline ± SD from four animals (BCH + IP). See panel for key. Vertical arrow indicates the time of hGln IP injection. Data were compared by two-way ANOVA with Sidak post-test. Statistical significance indicated as *** = p < 0.001 for comparison of treatments with each other. (b) Labeled Gln (hGln) as percent (%) of total Gln (hGln/Gln) in microdialysate samples. Samples were collected 25 min post hGln IP injection in the absence (data from Figure 2c) or in the presence of BCH perfusion (at 50’ of BCH perfusion, corresponding to 25’ post-IP injection of hGln) (a). Data were compared with unpaired t-test and statistical significance indicated as **** = p < 0.0001.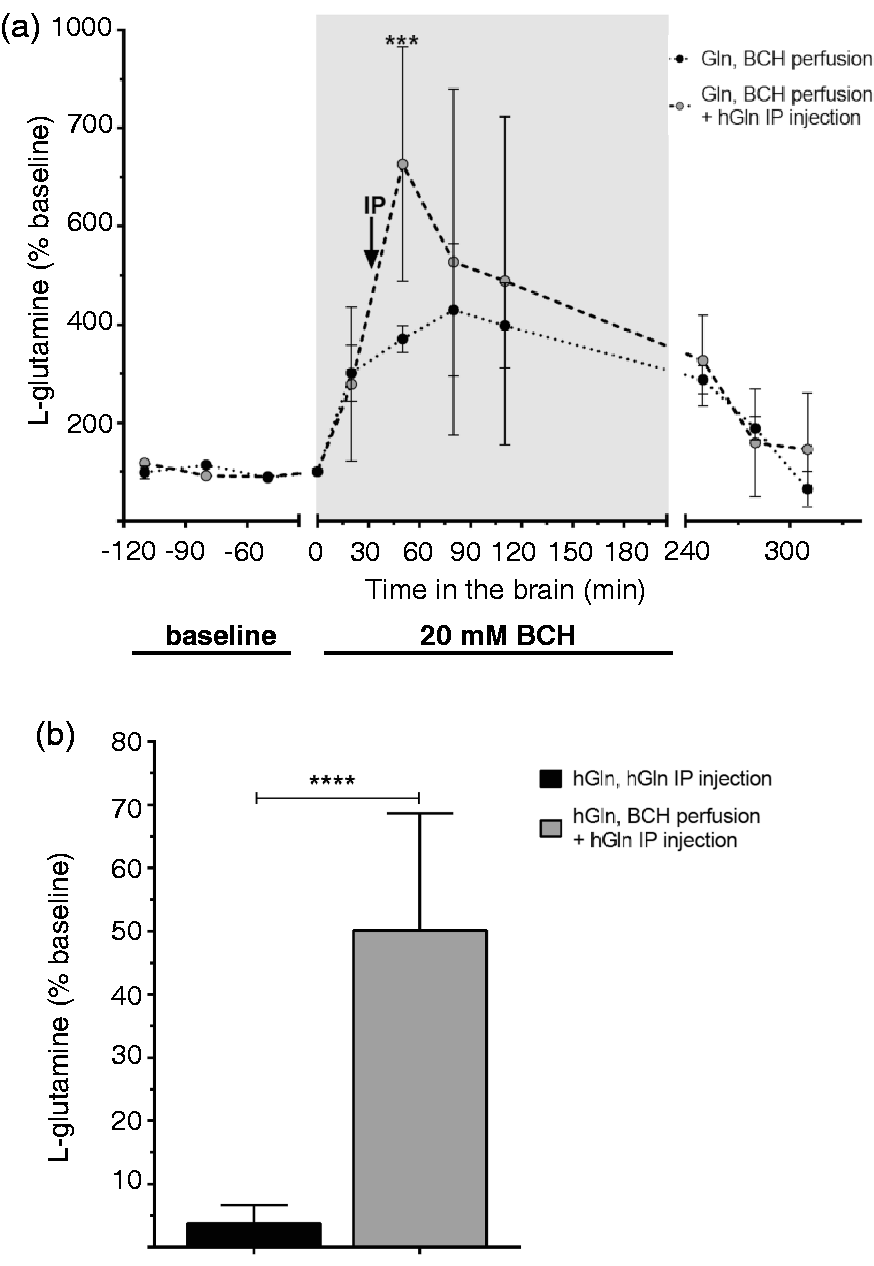
Discussion
Hippocampal interstitial fluid amino acids are significantly lower than in cisterna magna CSF indicating distinct regulation
Here we report results of a quantitative determination of hippocampal ISF AA concentrations in awake, freely moving mice. Not only was a steep gradient in AA (except Gln) concentrations between plasma and CSF confirmed, ISF AAs, including for Gln, were ≈5–10 times lower vs. CSF.
In general, ISF solutes have been measured by either sensor or sampling (either direct or by microdialysis) methods. 27 Sensor detection methods, which have high accuracy, are only applicable for a few analytes while sampling can be used to broadly screen multiple substances (such as AAs). Direct sampling either involves a “push-pull” method or a very low flow extraction. 33 Microdialysis, while lacking the temporal sensitivity of sensor detection mitigates the tissue damage inflicted by the “push-pull” method of pumping fluid into to the brain to extract samples. Instead, fluid is perfused through a semi-permeable microdialysis probe to extract brain solutes. 27 Due to technical limitations most microdialysis studies avoid reporting quantitative data instead normalizing results from experimental manipulations relative to baseline controls. However, two accepted methods for quantification “no-net-flux” and the “extrapolation to zero-flow” (or “Flow-rate”) have been developed. 27 The “no-net-flux” method requires a series of perfusions with different concentrations of the substance of interest. The brain concentration is determined as the concentration of the target for which no net exchange occurs during perfusion into the brain. However, each AA concentration must be determined individually, and infusing AAs into the brain may trigger alterations in both brain levels and relative recovery. 27 Our study used the “Flow-rate” method to determine C0 (brain concentration) based on the inverse relationship between flow rate and mass transfer and is applicable to multiple solutes simultaneously (see equation (1)). The Flow-rate method algorithm extrapolates a set of microdialysis data to C0, however, without constraining the mass transfer coefficient, K0, C0 not only does not resolve to a unique solution: it often results in a higher value for C0. Therefore, we used retro-dialysis of a non-natural L-leucine analog, NLeu, to determine K0 in vivo allowing an unequivocal solution of C0 for ISF AAs. 27
A commonly raised issue with microdialysis studies in general is the creation of “an area around the probe in which all solutes capable of crossing the probe membrane are depleted”. 27 We examined the possible ISF depletion by comparing relative recovery over the first several days of microdialysis collection at 1 µL/min. Representative results show that mean levels of individual AAs (except proline and alanine) remained relatively stable for all four days of microdialysis (supplementary Figure 3(A)). Gln levels were generally stable with only one mouse showing a trend to increasing AA levels by the fourth day (supplementary Figure 3(C)). Tau has been suggested to be a marker for ISF osmolality and the generally stable levels suggest no major disturbances in ISF osmotic balance occurred over multiple days of microdialysis for most mice (supplementary Figure 3(E)). The slight increases in AAs observed may be due to a trauma layer surrounding the probe causing gliosis (glial activation and proliferation) and/or ischemia (interrupted blood flow). 27 A study by Jaquin-Gerstl and coworkers found that although dexamethasone significantly reduced gliosis and ischemia, it had only minor effects on dopamine quantitation over several days of microdialysis in comparison to untreated control animals. These data suggest gliosis had a minimal impact on solute recovery during microdialysis. 34
Consistent with previous reports steep concentration gradients from plasma to CSF for 16 AA (except Gln as previously reported) were observed. In addition, we measured decreased AA concentrations in ISF vs. CSF (Table 1). For example, we measured 80 ± 16 µM Gln in ISF. While we are aware of no other study to date that comprehensively quantifies brain ISF AA concentrations in mice, some studies have been carried out for selected AAs. For example, in 1.5 µL/min microdialysis samples collected from non-anesthesized mice Gln levels of ∼11 µM in striatum and ∼9 µM Gln in cortex 9 were measured, values similar to our 1 µL/min data for hippocampal Gln (8.5 ± 1.1 µM). However, this mouse study was comparative and no absolute ISF concentration was derived. In contrast, for non-anesthesized rats Kanamori and Ross reported a Gln concentration of 385 µM in striatal ISF, 5 while Lerma et al. measured 190 µM Gln in hippocampus of anaesthetized rats. 6 Unlike in the present study, neither of these rat studies independently determined K0 to constrain the solution for C0 .
In addition, there are many differences between the cited study protocols and ours, e.g. physiological state (awake vs. anesthetized, fed vs. food restricted), or brain region (striatum vs. hippocampus), or species (mouse vs. rat), which may also contribute to observed differences in ISF AA concentrations. For example, it was recently shown that ketamine/xylazine anesthesia increases mouse brain ISF distribution of a tracer introduced in the CSF. 35 The ISF is produced partially by periarterial influx of CSF, which contains significantly higher concentrations of AAs than ISF. Therefore a reduction in the proportion of ISF arising from CSF, as occurs in awake animals, is predicted to reduce ISF AA concentrations vs. those observed for anesthetized animals.
Finally, a low flow “push-pull” study by Slaney et al. reported ISF levels of 8.5 µM Glu and 7.2 µM Gly in the midbrain (ventral tegmental area (VTA)) of awake, freely moving rats 33 similar to the 4.1 ± 0.3 µM Glu and 7.8 ± 1.2 µM Gly measured in the current study (Table 1). Therefore, our findings of low hippocampal ISF relative to CSF AA levels are supported by our carefully controlled study protocol (including the in vivo determination of K0). Furthermore, while there are some discrepancies in Gln levels, the direct sampling data available for several AAs 33 are consistent with our results. Finally, although CSF and ISF partially co-mingle, the steep AA concentration gradients observed indicates a degree of independent homeostatic regulation of solutes in each fluid compartment may exist.
L-glutamine but not L-valine ISF levels are strongly buffered against large acute plasma increases
The rapid and significant increase in plasma (≈600%) and ISF Val (≈400%) (Figure 2(a)) following intraperitoneal injection of Val is consistent with published data (≈4–5 fold in Val in brain tissue and ISF, and 8.5 fold in CSF 36 ). Val influx from the periphery is expected to be mediated by LAT1, which transports Val with high affinity (Km ≈50 µM). 37 In contrast, hGln IP injection significantly raised Gln levels in plasma (≈3-fold), but not ISF, and resulted in minor enrichment of hGln (≈4%) in ISF (Figure 2(b) and (c)). Similarly, Bagga et al. recently reported that 3 min of [U-13C5]-Gln infusion did not increase total cortical Gln and Gln-C4 13C enrichment was ≈2%, 38 while it cannot be ruled out that hGln is efficiently transendothelially transported and subsequently rapidly sequestered in brain cells (e.g. astrocytes) and therefore not detected in ISF. However, the observed low and transient increase of Gln transport is suggested to be due to the low affinity of the BBB expressed Gln transporters, LAT1 and SNAT3. This is predicted based on the Km values for Gln that are on the order of post-IP injection plasma Gln concentrations (1–2.3 mM).
LAT1 transporter regulates ISF influx of plasma Gln
The potential regulatory contributions of system A (astrocyte and neuronal expression) and system L (endothelial) transporters were tested by brain perfusion with MeAIB or BCH, respectively. Following MeAIB perfusion ISF Gly is sustainably increased in ISF (Figure 3(a)) while total ISF Gln is only transiently significantly elevated (Figure 3(b)). Both SNAT1 and SNAT2 transport MeAIB, Gln, and Gly with similar affinities (MeAIB Km of SNAT1, 1.1 mM, and SNAT2, 0.5 mM; Gln Km of SNAT1, 0.3 mM, and SNAT2, 1.7 mM; Gly Km of both SNAT1&2 ∼0.5 mM).12,39 Roughly at equilibrium, extraction of MeAIB from the 20 mM perfusate corresponds to 2–4 mM, which represents a large excess relative to its Km (for SNAT1 and SNAT2) and the concentrations of Gln (80 µM) and Gly (8 µM) in the ISF. Therefore, it is consistent with a greater relative competition of Gly than Gln transport. However this does not account for the “ping-ponging” of Gln ISF levels during MeAIB perfusion (Figure 3(b)). Gln rebounding to baseline may be due to an unknown compensatory mechanism to restore ISF Gln (but not Gly) homeostasis. Figure 1 shows that Gln is transported by a number of highly expressed AATs in the neurovascular unit including LAT1, SNAT1&2, and SNAT3&5, of which LAT1 and SNAT3 selectively transport Gln and not Gly.12,31,40 BCH stimulation of LAT1 results in a ≈400% increase in total ISF Gln (Figure 4(a)). Further, BCH in the presence of increased peripheral hGln dramatically stimulates net Gln transendothelial transport to the ISF ≈100-fold, i.e. from ≈6% hGln (IP injection without BCH perfusion) to ≈600% (IP injection with BCH perfusion) (Figure 4(b)). Since SNAT3 does not bind BCH, the data indicate LAT1 can mediate large changes in Gln influx from the plasma. This strong effect of BCH may be accomplished by driving the transendothelial transport of Gln from the blood into the ISF via transstimulation of LAT1 exchanger expressed in endothelial cell membranes. Indeed, the high BCH concentration in ISF could transstimulate Gln transport from the endothelial cells into the ISF. And BCH thereby accumulating in the endothelial cells would in turn transstimulate the uptake of Gln from the blood into endothelial cells. This hypothesis is consistent with a key role for the endothelial BBB expressed LAT1 in regulating Gln ISF homeostasis.
Footnotes
Funding
The author(s) disclosed receipt of the following financial support for the research, authorship, and/or publication of this article: This work has been supported by the SNF grant 31-147093/1 and a grant from Ajinomoto (2010–2012).
Acknowledgements
The authors would like to thank and acknowledge the contributions of the Functional Genomics Center Zurich, in general, and Dr. Peter Hunziker specifically for invaluable technical support for the UPLC amino acid analysis.
Declaration of conflicting interests
The author(s) declared no potential conflicts of interest with respect to the research, authorship, and/or publication of this article.
Authors' contributions
FV and VM contributed equally to this article. ED, EL, TW, FV and VM participated to the conception and design of the experiments. ED and SI performed all the experiments and surgeries. ED, EL, TW, FV and VM were involved in the collection, analysis and interpretation of data. ED, VM and FV wrote the manuscript with contributions of EL and TW. All aspects of the project were supervised by VM and FV. All authors approved the final version of the manuscript and all authors qualifying for authorship are listed.
References
Supplementary Material
Please find the following supplemental material available below.
For Open Access articles published under a Creative Commons License, all supplemental material carries the same license as the article it is associated with.
For non-Open Access articles published, all supplemental material carries a non-exclusive license, and permission requests for re-use of supplemental material or any part of supplemental material shall be sent directly to the copyright owner as specified in the copyright notice associated with the article.