
Abstract
Positron emission tomography (PET) data related to neurodegeneration are most often quantified using methods based on tracer kinetic modeling. In contrast, here we investigate the ability of geometry and texture-based metrics that are independent of kinetic modeling to convey useful information on disease state. The study was performed using data from Parkinson’s disease subjects imaged with 11C-dihydrotetrabenazine and 11C-raclopride. The pattern of the radiotracer distribution in the striatum was quantified using image-based metrics evaluated over multiple regions of interest that were defined on co-registered PET and MRI images. Regression analysis showed a significant degree of correlation between several investigated metrics and clinical evaluations of the disease (p < 0.01). The best results were obtained with the first-order moment invariant of the radioactivity concentration values estimated over the full structural extent of the region as defined by MRI (R2 = 0.94). These results demonstrate that there is clinically relevant quantitative information in the tracer distribution pattern that can be captured using geometric and texture descriptors. Such metrics may provide an alternate and complementary data analysis approach to traditional kinetic modeling.
Keywords
Introduction
In-vivo positron emission tomography (PET) imaging of neurological disorders has contributed significantly to the understanding of disease-induced neurochemical changes in the brain, and its relevance is anticipated to increase as treatments become available. The methods of image analysis that relate imaging outcomes to underlying neurobiology typically include two components: 1) the selection of modeling techniques and metrics which relate the radiotracer distribution to biological parameters; and 2) criteria for defining regions of interest (ROIs) over which the parameters of interest are evaluated. For example, the simplest type of modeling is the estimate of the standard uptake values, where the ROI values from a single (static) image are divided by the injected tracer dose normalized to subject's body mass. More rigorous methods rely on kinetic modeling (KM) to compute the biological parameters such as the non-displaceable binding potential (BPND), and require the knowledge of the time course of the tracer distribution in the selected ROI. Thus, dynamic scanning and either a plasma- or tissue-derived input function must be acquired. These requirements typically lead to increased scan durations, introduce additional sources of error and reduce patient comfort. Therefore, it is of interest to explore new image-derived metrics that correlate with disease, convey useful information regarding the relevant physiological processes, and can be obtained from relatively simple scanning procedures. Metrics that quantify image histogram and texture have been already used in cancer-related PET imaging,1,2 and analyses of co-variance patterns have been proposed in neuroimaging for tracers with diffuse brain distribution, such as 18F-fluorodeoxyglucose (18F-FDG) and 11C-Pittsburgh compound B (11C-PIB).3,4 However, to our knowledge, the usefulness of a wider set of geometry-based metrics in neurodegeneration has not been explored, specifically for the tracers that have a rather localized distribution pattern.
The aim of this work was to investigate the correlation between KM-independent image-derived metrics that quantify spatial activity distribution in the brain and clinical metrics of neurodegenerative disease; the investigation was performed using co-registered PET and MRI images of subjects suffering from Parkinson’s disease (PD), which is known to progressively affect the integrity of the pre-synaptic dopaminergic neurons with minimal or no anatomical atrophy. 5 Based on the observation that neurodegenerative disease usually affects tracer binding in a distinct spatio-temporal pattern, our hypothesis was that metrics such as region compactness, spatial activity variance and eccentricity evaluated for the regions of high activity concentration would correlate well with the clinical disease progression.
The descriptive strength of image metrics may depend on the particular ROI definition method; this was indeed observed in oncology. 6 The selection of the most appropriate ROI over which to evaluate a specific metric may be ambiguous in presence of neurodegeneration; while specific aspects of the neurochemical function may be impaired, other functional or structural aspects may be preserved, leading to large differences in region identification ability between different modalities and tracers. Typically, the ROI choice is dictated by the available data, the primary aim of investigation, and overall robustness of the method.7,8 In the case when anatomically defined regions are required, they can be delineated using the MRI image of the subject. Other approaches include using atlas-derived ROIs,9–11 or a more simple definition of ROIs using geometric primitives placed over the brain structure of interest.12,13 In addition, it has been shown that inter-modality ROIs (PET-CT, PET-MRI) can be better suited for certain diagnostic tasks than the traditional single-modality ROIs.14–17 Given these considerations, here we evaluate the performance of the PET-image analysis metrics for a range of possible ROI definitions derived from the PET and MRI images; this methodology was utilized to investigate metrics more systematically and to test the generality of the analysis outcome beyond a specific method of ROI definition.
The study was performed using images of two dopaminergic tracers in PD subjects and healthy controls. The dopaminergic function was evaluated using the 11C-dihydrotetrabenazine (DTBZ), a marker for the vesicular monoamine transporter type 2. The BPND of DTBZ is substantially reduced in PD patients compared to controls, exhibiting a typical PD-related rostro-caudal gradient. The other tracer was 11C-raclopride (RAC), which captures the spatial distribution of the D2 (dopamine) receptors. The D2 receptor density is relatively preserved with PD, and thus the region of high RAC binding resembles the anatomical shape of the striatum. It was expected that the investigated metrics computed using the DTBZ activity values within the striatal ROIs would capture the progressive aspect of PD, while no significant disease-related trends would be observed for metrics derived from the RAC activity values.
The analysis methodology consisted of three main steps: 1) ROI definition: a series of single-modality and inter-modality PET-MRI ROIs were generated. These ROIs included PET-defined regions of high activity concentration, MRI-defined regions corresponding to anatomical structures (putamen and caudate), and a range of intermediate regions. The intermediate ROIs were taken from a “mixed” ROI space that was established using a linear combination of the single-modality PET and MRI segmentations. We explored DTBZ-MRI and RAC-MRI ROIs that were generated using images of the corresponding tracer; 2) metric computation: the investigated metrics were computed within the generated ROIs from the DTBZ and RAC activity values; 3) metric evaluation: the correlation between metric values and clinical PD severity measures (disease duration (DD) and motor performance) was analyzed as a function of the used ROIs.
In the following sections, our method and results are reported in detail. In “Methods” section, we describe the imaging protocol, the ROI generation procedure, the utilized image metrics, and the analysis approach. In “Results” section, we first report data obtained with DTBZ-derived metrics, followed by a more brief description of findings with RAC-derived metrics. In “Discussion” section, we summarize and analyze the results, identify limitations of the study, and outline future work.
Methods
Data acquisition and pre-processing
The study was approved by the University of British Columbia Ethics Board and all experiments were conducted in accordance with the university ethics guidelines. All subjects gave written informed consent. The study used data from 16 PD and three control subjects acquired as part of an ongoing clinical study. The mean age of the PD subjects was 61.2 ± 7.3 (range 52–79 years), with the clinical disease severity ranging from mild to moderate on the unified Parkinson’s disease rating scale (UPDRS). Given that PD can affect two sides of the brain to different degrees, the motor part of the UPDRS was evaluated separately for the left and right side (off-medication). The mean lateralized UPDRS score was 11.6 ± 6.5 (range 1–26). The mean DD measured from the time of clinical onset was 7.3 ± 4.5 years (range 1–15 years).
T1-weighted MRI and DTBZ PET images of the brain were acquired for all subjects; RAC images were acquired for all but one PD subject. The MRI images were obtained with a Philips Achieva 3 T scanner at the UBC MRI Research Centre using a T1-weighted Turbo Field Echo sequence (TR 7.724 seconds). MRI image dimensions were 256 × 256 × 170 with voxel size (1.0 mm)3. The PET data were acquired in list mode using the Siemens High Resolution Research Tomograph (HRRT) at the UBC PET Imaging Centre and reconstructed using the 3D OSEM-OP algorithm. 18 Two image types were used for metric evaluation: activity concentration images acquired over 30 min (30–60 min post-injection) and parametric BPND images produced from 16 temporal frames using a simplified reference tissue model 19 ; the occipital cortex and cerebellum were used as the DTBZ and RAC reference regions, respectively. PET image dimensions were 256 × 256 × 207 with voxel size (1.219 mm)3. PET images were rigidly co-registered to the respective MRI images, which were resampled using trilinear interpolation to match PET voxel size. The SPM software package (www.fil.ion.ucl.ac.uk/spm/) was used for rigid, mutual information-based co-registration.
Single-modality and mixed PET-MRI ROIs
MRI-based ROIs for each subject (
The method of mixed ROI generation followed the mathematics of localized N-d shape transformations25,26 and is outlined in Figure 1. For each pair of corresponding Flowchart of the algorithm employed to generate mixed PET-MRI ROIs. The main processing steps are shown using the transaxial slices through the representative PET/MRI volume images.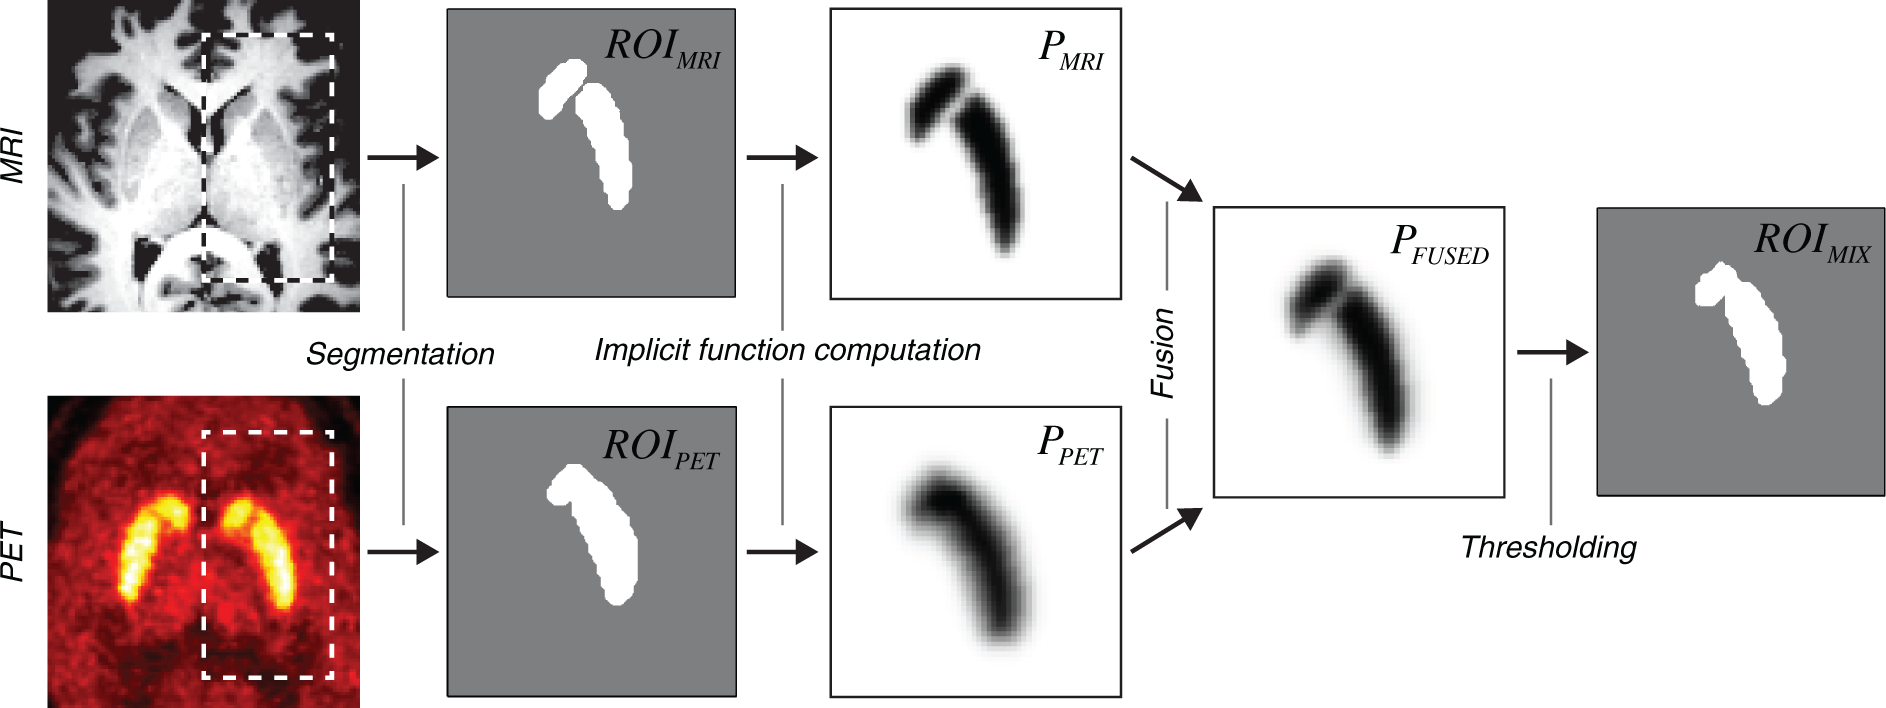

The implicit PET and MRI functions corresponding to the same subject and structure were fused as follows:

Image metrics
The choice of the investigated metrics was based on the prior knowledge of the specific rostro-caudal directional pattern of dopaminergic function loss in PD. It should be pointed out that in the PET images analyzed in this work, the activity was concentrated in a single area (striatum), and not distributed over the entire brain as, for example, in the case of imaging with 18F-FDG; the investigated metrics were chosen accordingly. The metrics were separated into three classes: value, geometry, and texture, computed using α-defined
The value group included (see Table 1 for abbreviation reference):
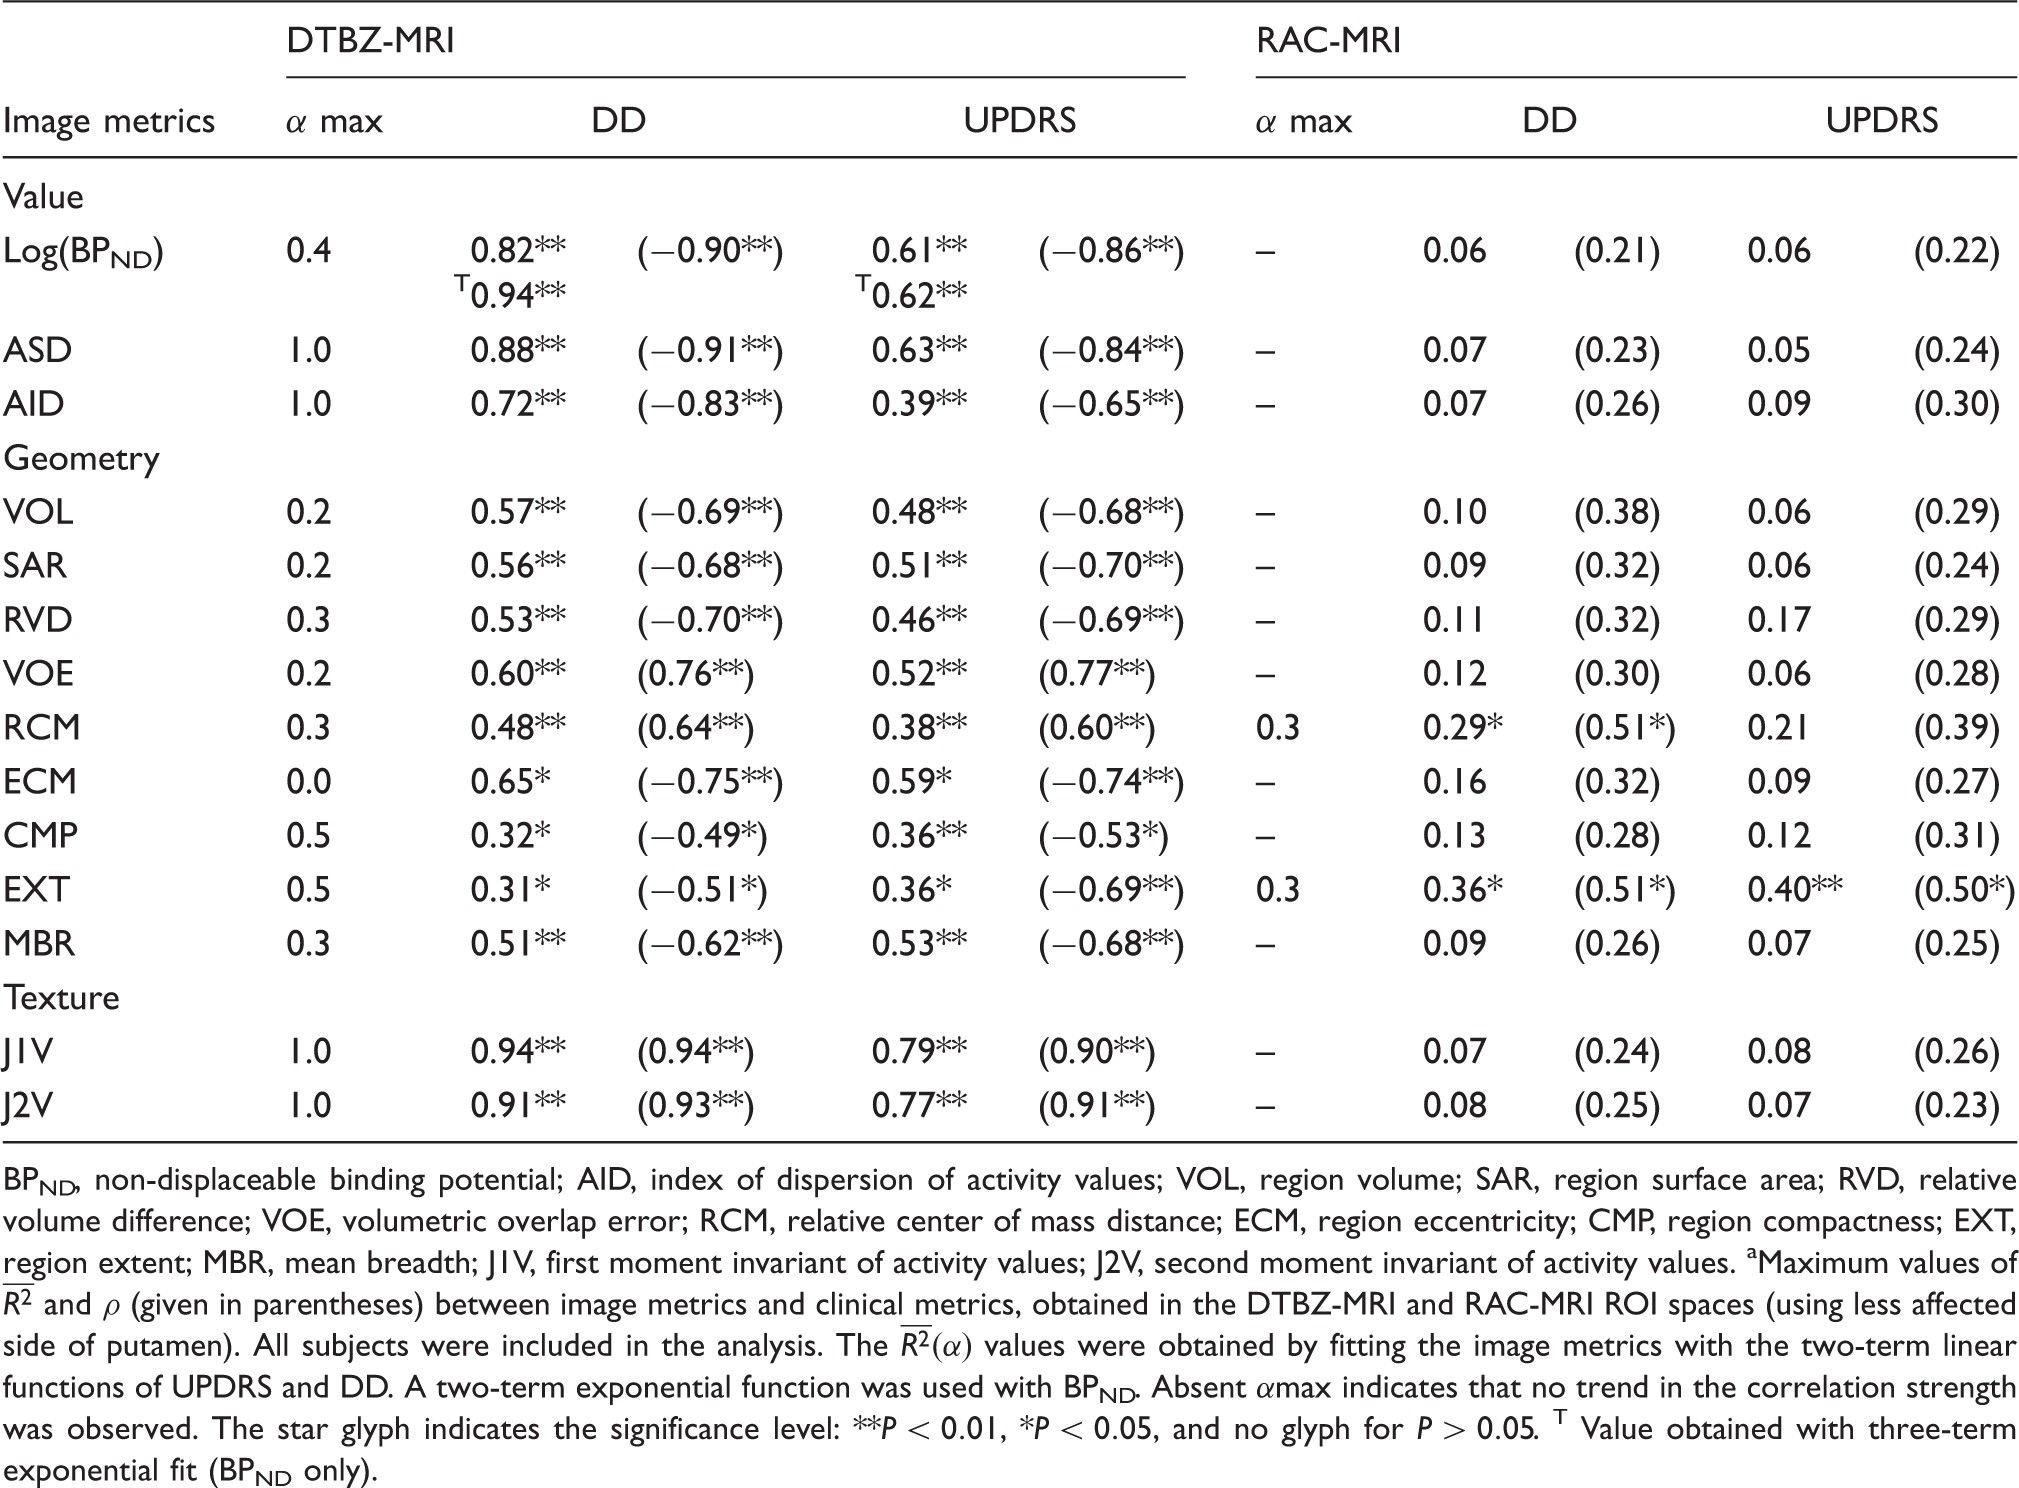
– The mean BPND that was obtained from the parametric binding potential images. This was the only metric that was based on KM, and the performance of other metrics (in terms of correlation with the clinical data) was evaluated in comparison to BPND. Unless noted otherwise, DTBZ BPND was measured in the DTBZ-MRI mixed ROI space, and RAC BPND was measured in the RAC-MRI mixed ROI space; – The standard deviation of activity (ASD) and index of dispersion of the activity values (AID). These metrics captured the non-uniformity of tracer binding, which becomes more prominent with advanced disease. Values of the correlation coefficient for the explored image metrics.
a
BPND, non-displaceable binding potential; AID, index of dispersion of activity values; VOL, region volume; SAR, region surface area; RVD, relative volume difference; VOE, volumetric overlap error; RCM, relative center of mass distance; ECM, region eccentricity; CMP, region compactness; EXT, region extent; MBR, mean breadth; J1V, first moment invariant of activity values; J2V, second moment invariant of activity values. Maximum values of
The geometry group included:
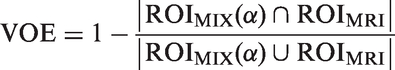
– Region volume (VOL) and region surface area (SAR). With disease progression, the functionally active dopaminergic regions become smaller. These metrics were expected to capture this reduction in size; – Relative volume difference (RVD) and volumetric overlap error (VOE):
– Distance between the centers-of-mass of – Eccentricity of ellipsoid fitted to – Region compactness (CMP) defined as the inverse ratio of the ROI surface area to that of a same-volume sphere, and extent (EXT) defined as the ratio of the ROI volume to that of the ROI-bounding box. With disease progression the functional regions become more irregular, and both of these metrics were expected to reflect this aspect; – Mean region breadth (MBR) measured the mean region width along 13 spatial axes. MBR was expected to diminish with more severe disease.
where 
As texture metrics, we employed the J1 and J2 moment invariants defined previously elsewhere.27–29 In short, the J1 moment (denoted as J1V) reflects the distance-weighted variance of activity values within the ROI, and the J2 moment (denoted as J2V) reflects the corresponding covariance; both metrics are invariant to the affine transformations. These descriptors are classified as “texture” here in a sense that they quantify the spatial distribution of voxel values and thus combine two types of information (value and location); however, it should be noted that they do not quantify repeated patterns in the images.
Metric evaluation
The values of the image metrics were obtained using DTBZ-MRI and RAC-MRI mixed ROIs that were generated using Equation (2) with
The regression analysis was performed with (N = 19) and without (N = 16) the inclusion of the control subjects in the test sample. The inclusion of the controls allowed to examine the behavior of metrics when transitioning from healthy to disease state. In addition, control subjects provided a reference for tracking the change in metric value with disease progression. The exclusion of the controls from the analysis, on the other hand, allowed a potentially less biased assessment of the correlation between the disease severity and image metrics.
The main measure of correlation was the square of the correlation coefficient R2, obtained by fitting the data to the two-term models of the form
The analysis procedure was performed separately for the DTBZ-derived metrics in the DTBZ-MRI ROIs and RAC-derived metrics in RAC-MRI ROIs and for the clinically worse and better sides of the striatum. In addition, we explored the relationship between the clinical data and DTBZ-derived metrics evaluated in the RAC-MRI space. This provided an assessment of the relative metric sensitivity to the anatomic fidelity of the ROI, i.e. whether the metrics remain suitable for analysis with RAC-based ROIs used as surrogate anatomical guidelines. Here we make an assumption that there are no spatial differences between the pre-synaptic and post-synaptic binding targets.
We describe in detail the results obtained with DTBZ-derived metrics in the DTBZ-MRI ROI space, including the variability of metrics with α and
Results
The correlation was found to be stronger when the clinically better side was evaluated, consistent with previous studies. 30 Therefore, we report in detail the results obtained with image metrics extracted from the less affected (better) side; using the more affected side yielded the same general outcomes.
Metric values and variability
Examples of ROIs from the DTBZ-MRI ROI space used for metric evaluation are shown in Figure 2(a). With PD subjects, the activity-defined PET regions were smaller than the corresponding MRI regions, as expected. Greater values of α produced ROIs with finer spatial detail (particularly in the areas of interior capsule and posterior caudate) and lower surface irregularity. Figure 2(b) further demonstrates the degree of alignment between the activity and anatomy-defined regions: even in areas presumably unaffected by the disease, the MRI ROIs did not always align well with the functionally active regions (indicated by arrows). This misalignment was greater with the caudate ROIs, where the ROI shape differences between DTBZ and MRI were more significant (likely due to the more pronounced partial volume effect and registration imperfection). With control subjects, the mean VOE was 0.64 ± 0.08 for the caudate and 0.33 ± 0.05 for the putamen; with PD subjects, the mean VOE was 0.67 ± 0.08 and 0.82 ± 0.11 for the caudate and putamen regions, respectively.
(a) The shape of 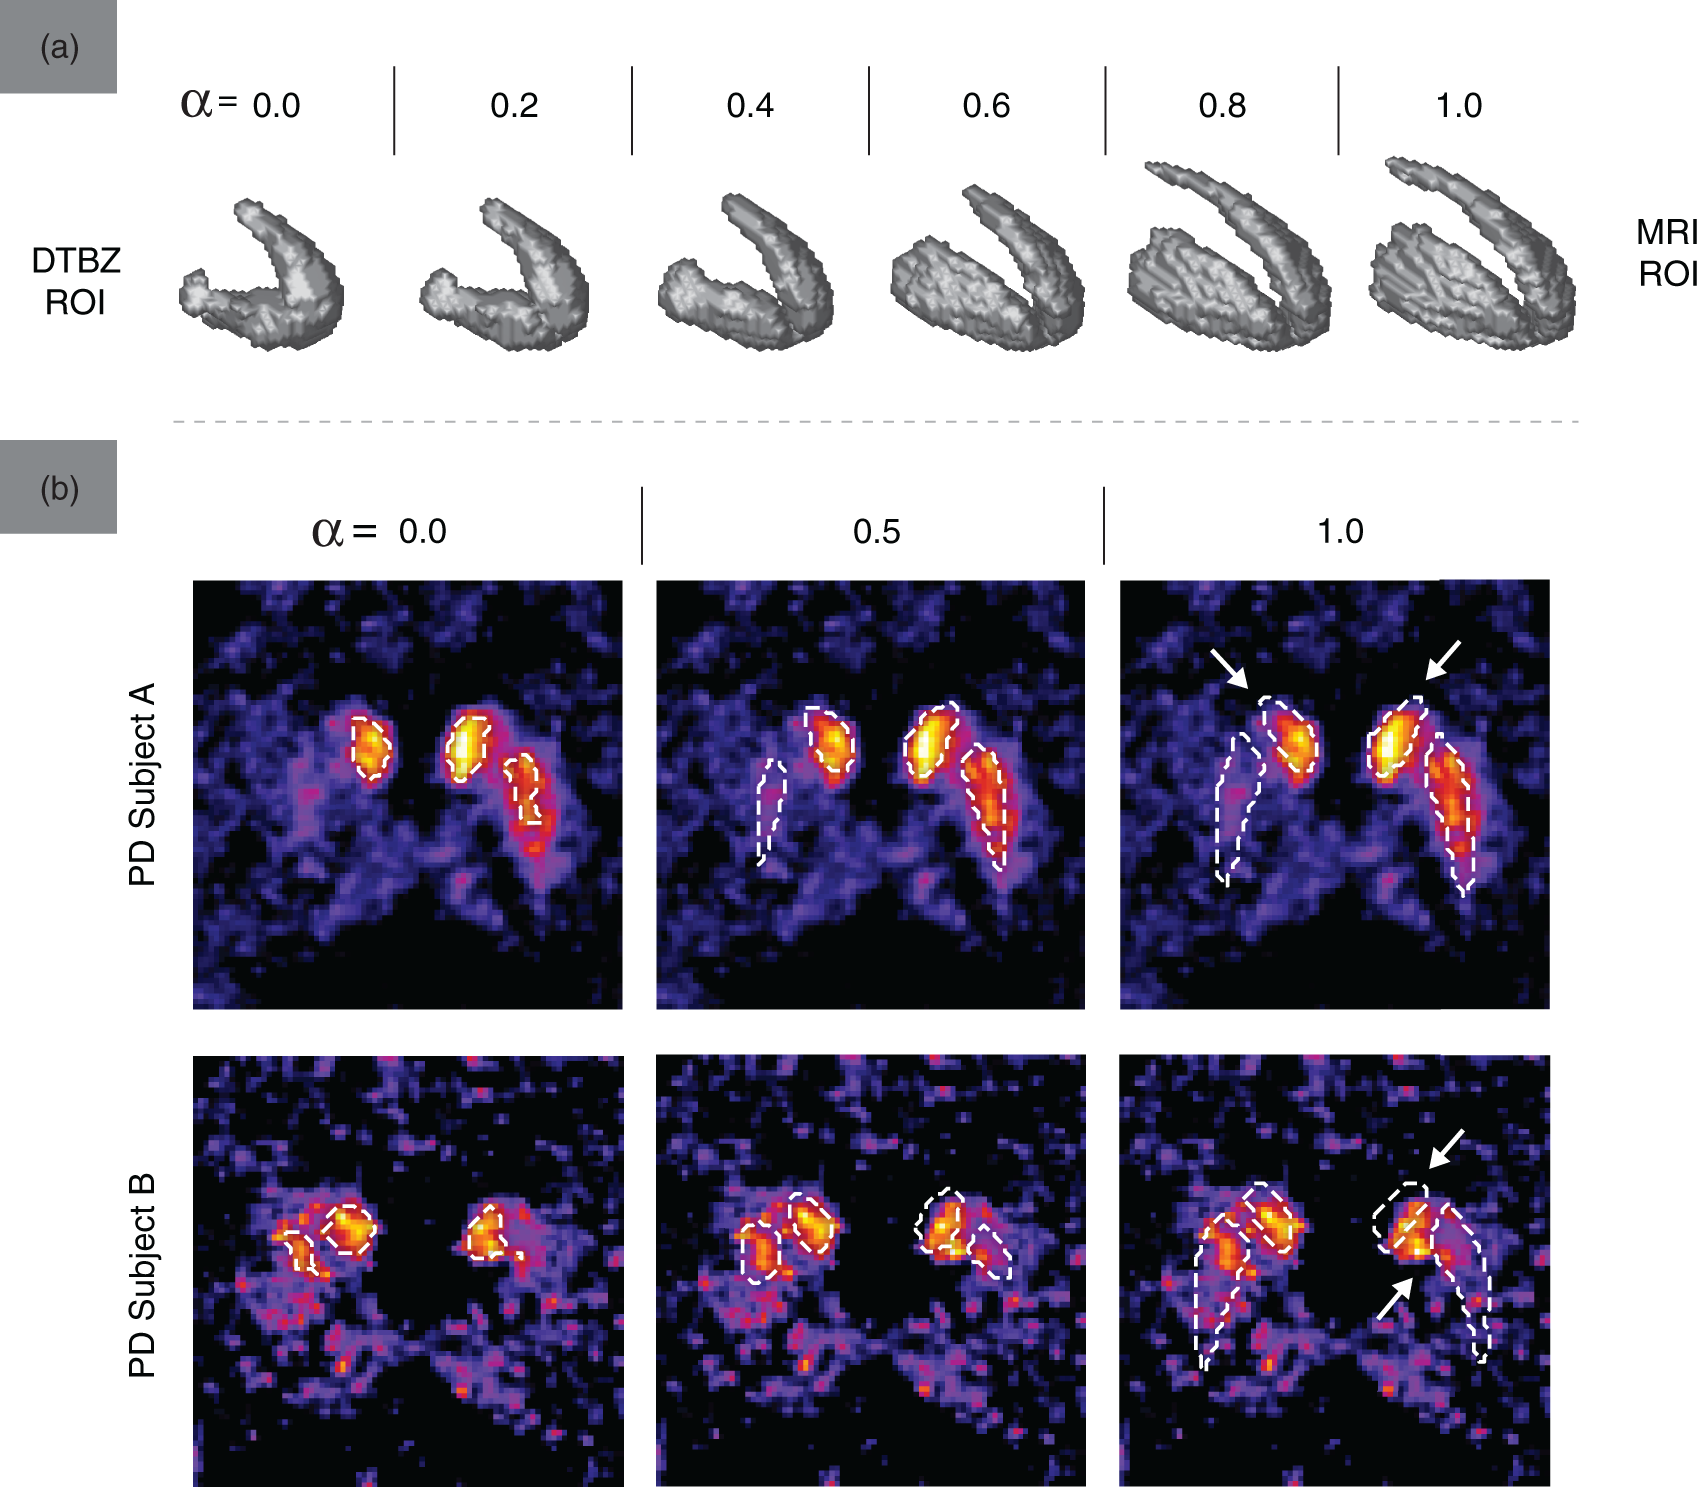
Several representative metrics (VOL, BPND, CMP, J1V) are plotted in Figure 3 as functions of α. The VOL values reveal the various degrees of functional atrophy in PD subjects; different metric behavior between the less affected and more affected subjects is observed. The values of BPND were highest with Graphs of VOL, BPND, CMP, and J1V in the DTBZ-MRI ROI space for all subjects, evaluated using mixed ROIs of the putamen (less affected side). Higher DD generally corresponded to more significant metric variability with α. The three subjects with DD of zero correspond to control subjects.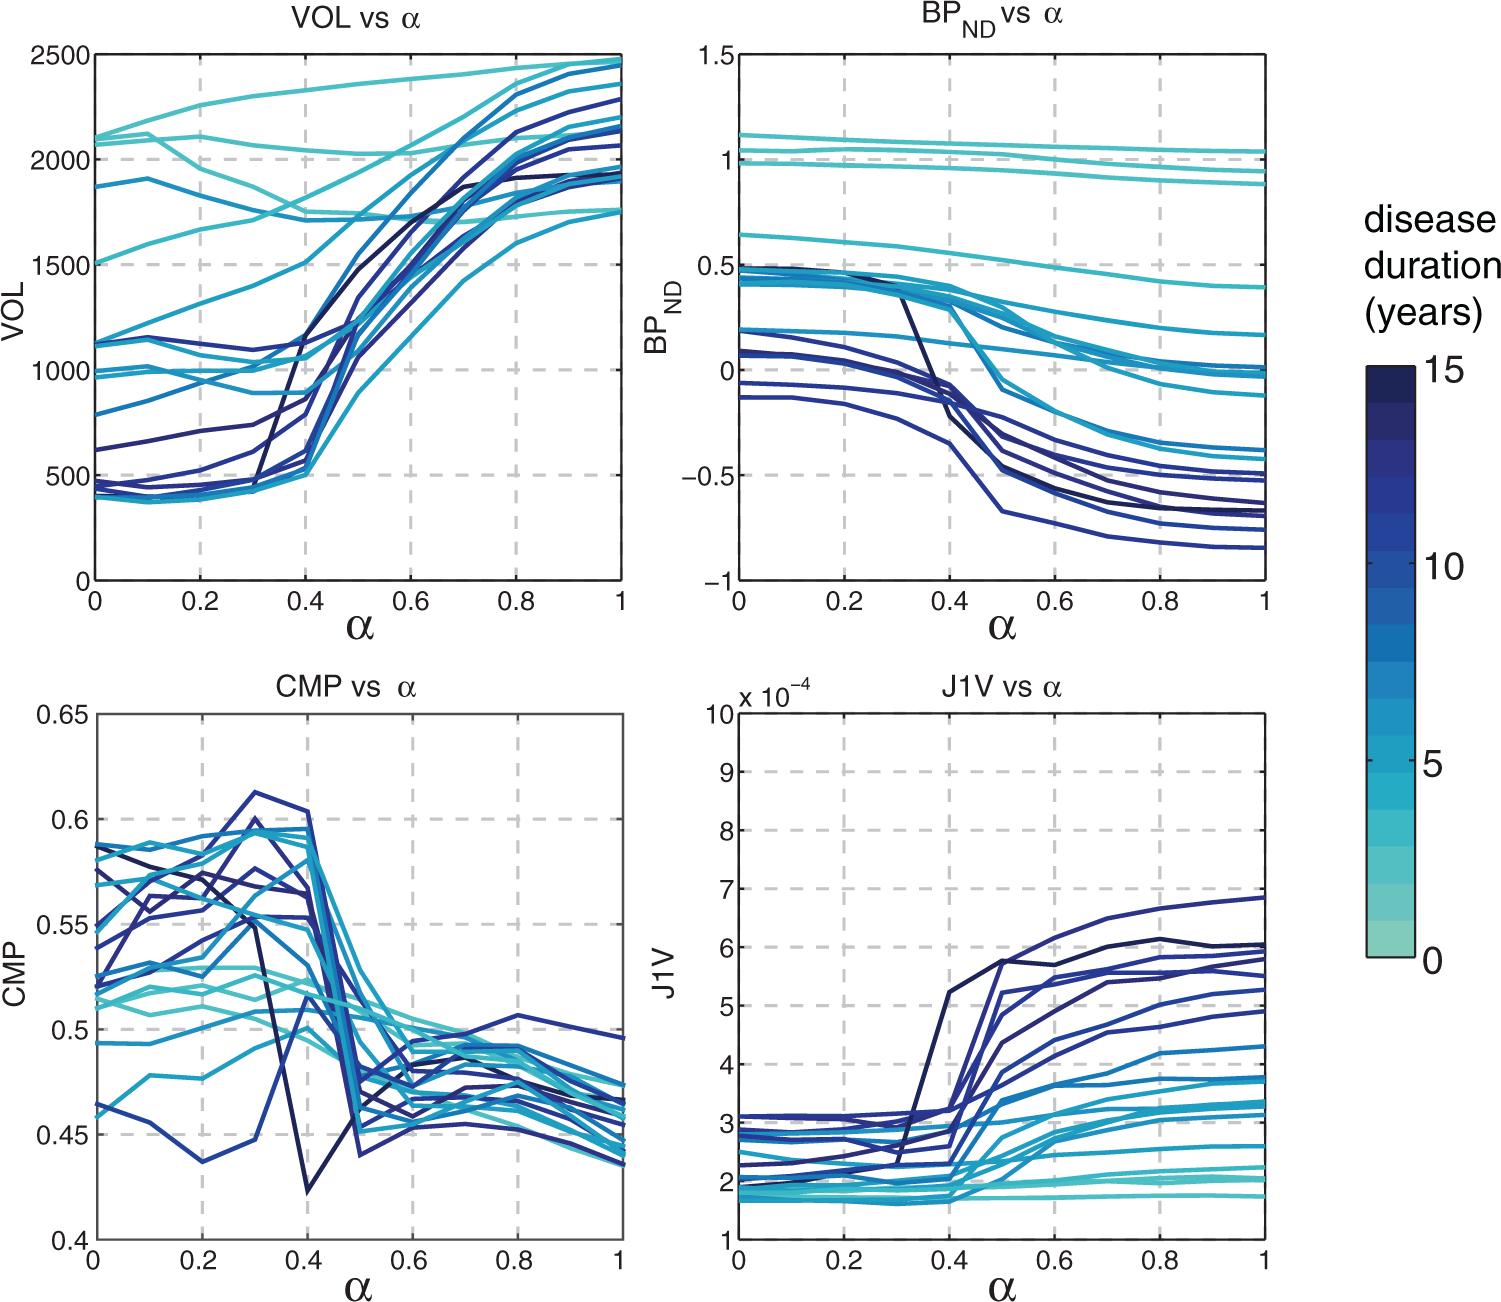
Correlation between image and clinical metrics
The maximum values of
Among the value group, ASD had the strongest correlation with the clinical measures, similar to that of BPND and followed by AID. The corresponding values of ρ generally followed the same pattern. The (a) Mean bootstrapped values of R2 with standard deviation (error bars) and 95% confidence intervals (filled regions), plotted against α for BPND (left), RVD (middle), and CMP (right). The correlation with DD (blue) and UPDRS (green) was evaluated using putamen mixed ROIs; (b) representative scatter plots of log(BPND), RVD, and CMP against DD and UPDRS. Non-bootstrapped values of R2 are shown for the cases with the control subjects were included (CL + PD) and excluded (PD) from the analysis.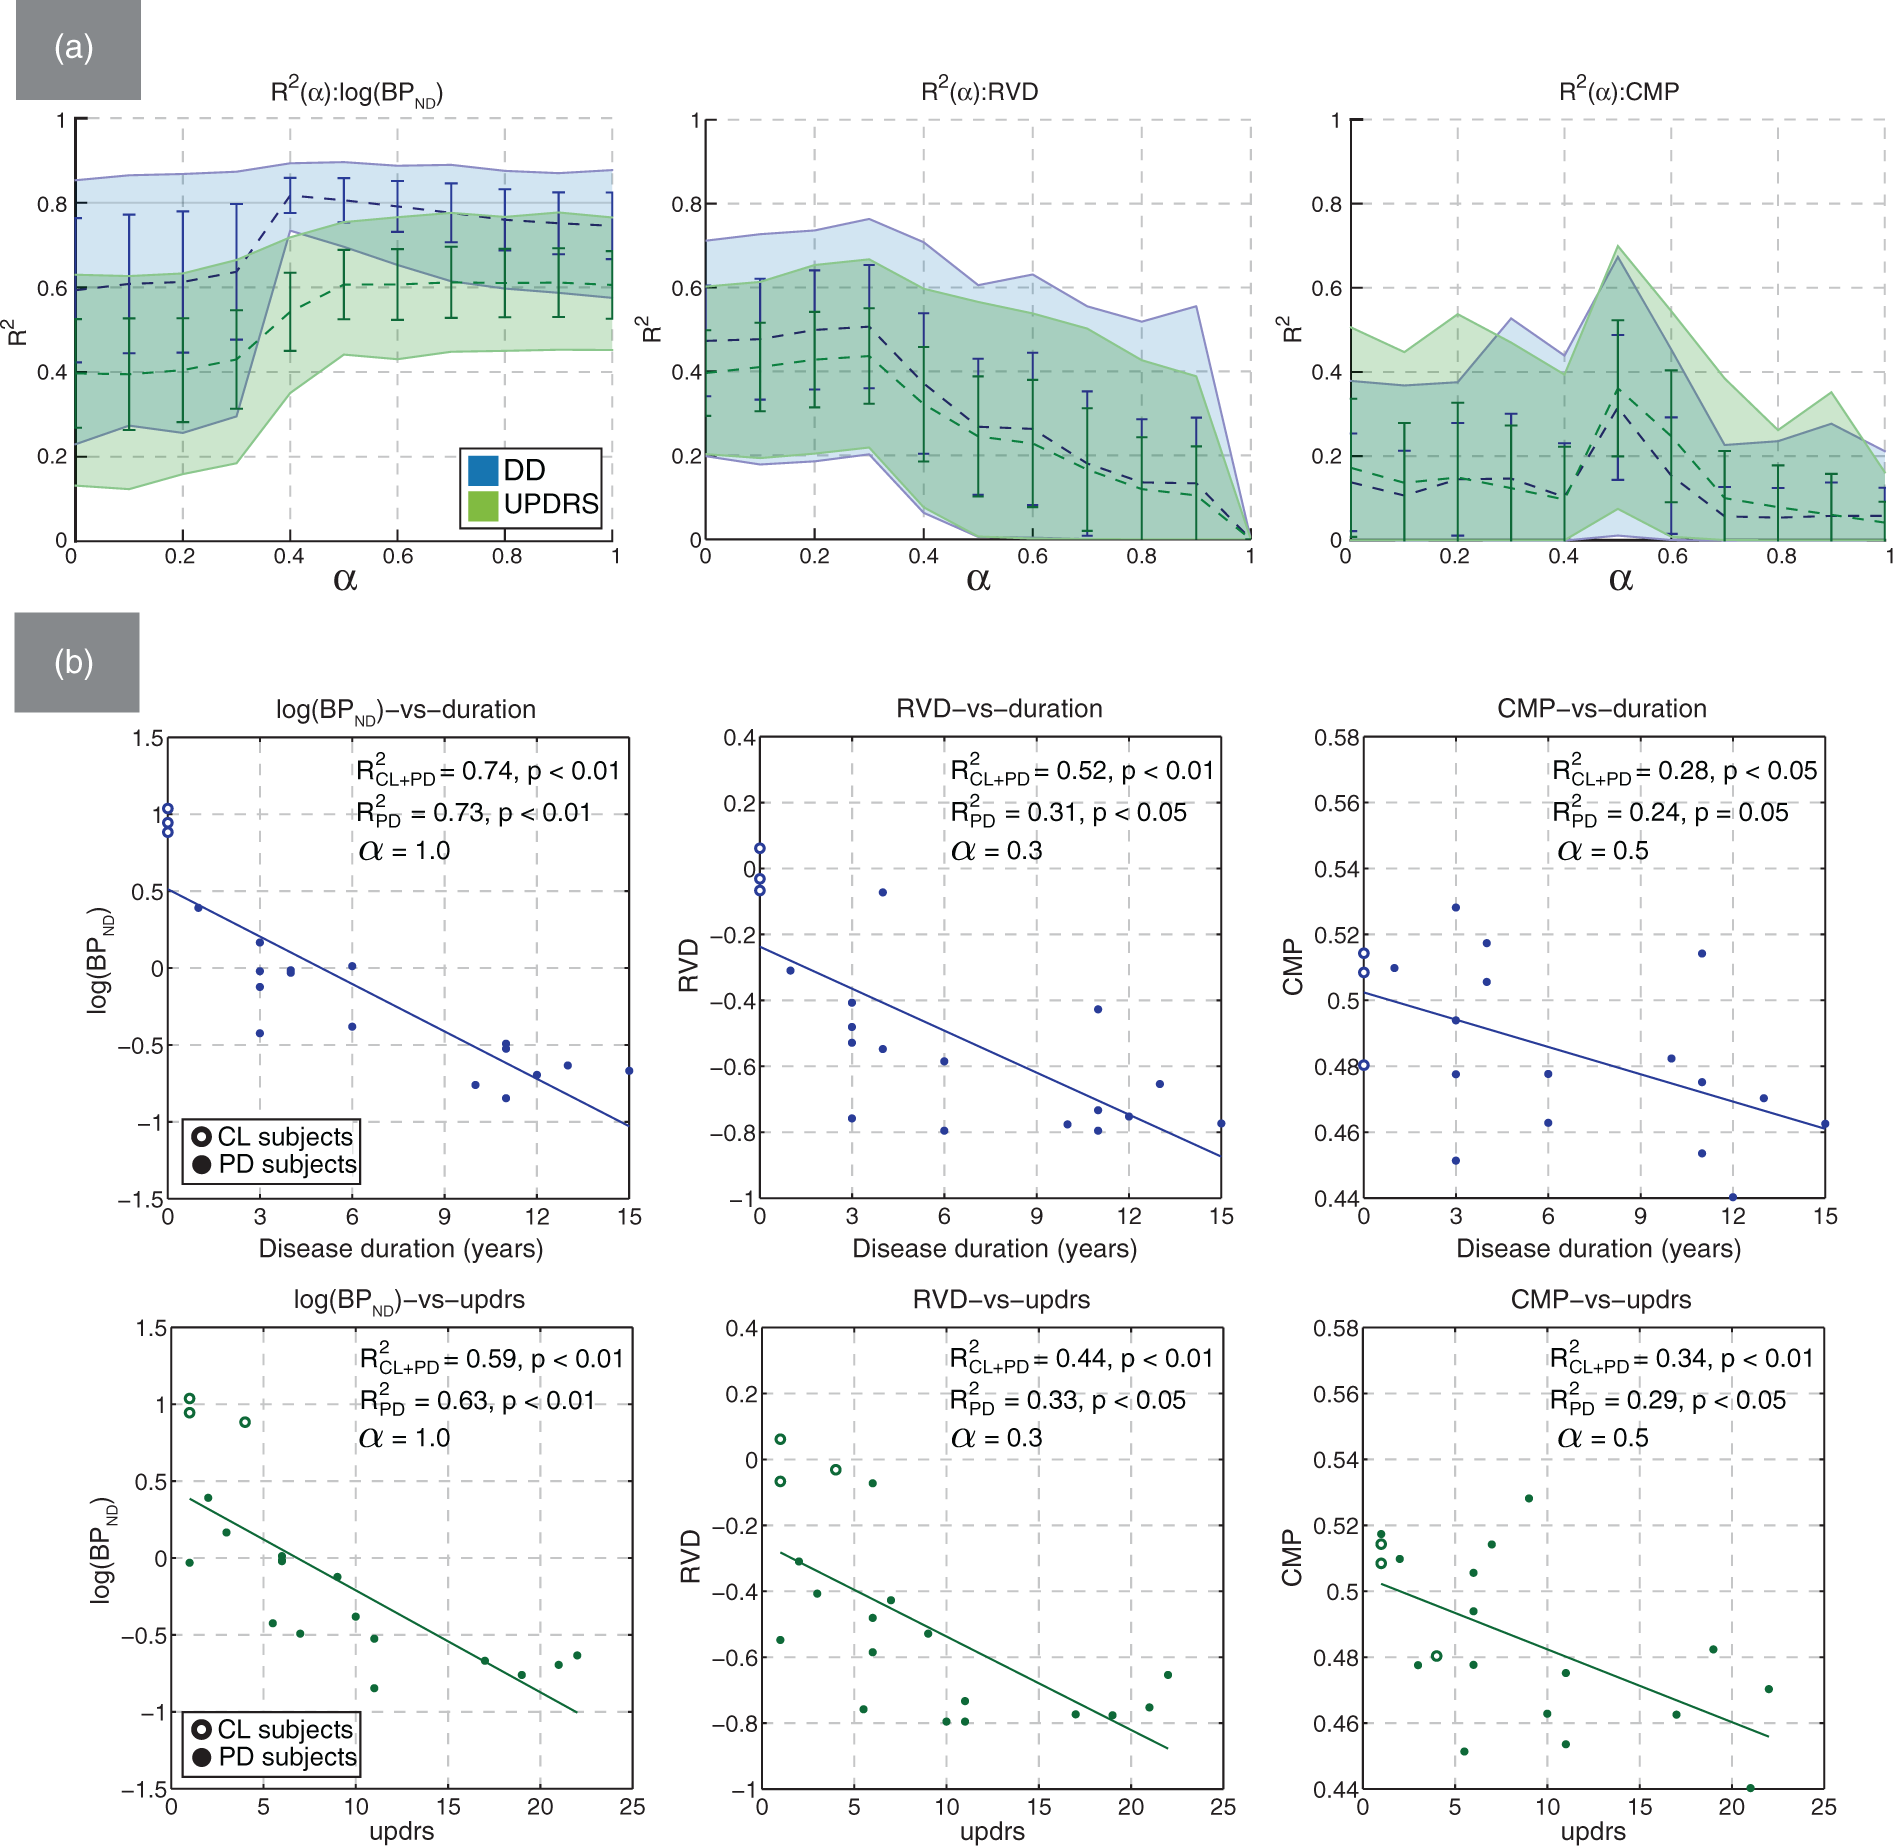
The correlation between clinical data and metrics in the geometry group was statistically significant but lower compared to the value group. The correlation was statistically significant only with PET ROIs or mixed ROIs, and negligible with MRI ROIs. Metrics related to the size of the region (VOL, VOE, RVD, SAR) had the highest values of
The texture metrics J1V and J2V had the strongest correlation with the clinical data among all other metrics; the highest values of Mean bootstrapped values of R2 with standard deviation (error bars) and 95% confidence intervals (filled regions) plotted against α for J1V (top) and J2V (bottom). The representative scatter plots of metric values against DD (blue) and UPDRS (green) are shown for MRI-based putamen ROIs. Non-bootstrapped values of R2 are shown for the cases with the control subjects were included (CL + PD) and excluded (PD) from the analysis.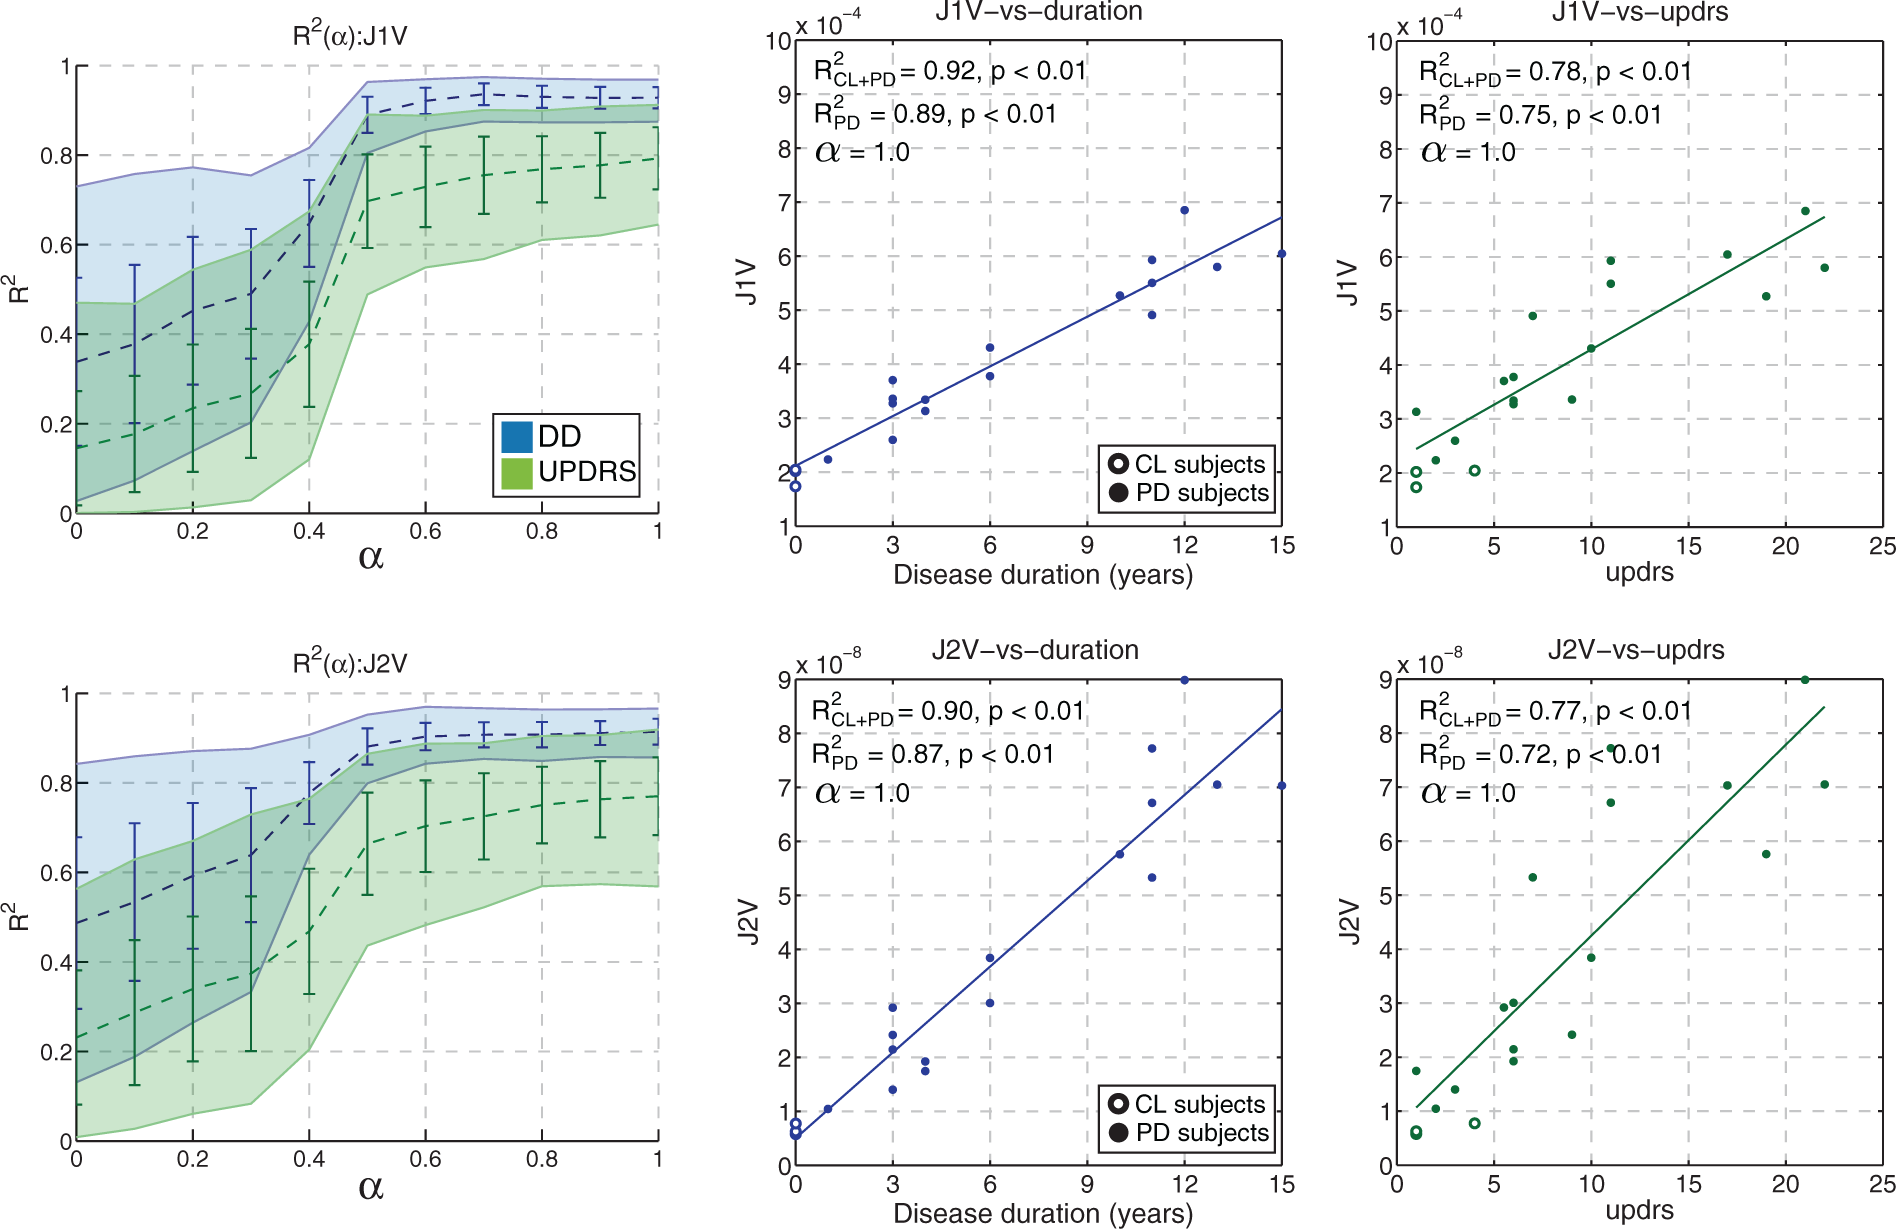
When the control subjects were excluded from the regression analysis, the correlation analysis for BPND produced values
The degree of dependency between the image metrics varied depending on the considered metric pair. When metrics of similar character were combined in a bivariate model (e.g. VOL and RVD), the value of adjusted
Metric correlation in the RAC-MRI ROI space
Examples of mixed RAC-MRI ROIs are shown in Figure 6(a). The RAC ROIs had approximately the same size as the MRI ROIs, and the VOL metric averaged across subjects was approximately constant with α, consistent with the notion that the post-synaptic function is relatively preserved in PD. However, even with co-registration and tracer binding unaffected by the disease, we found that the MRI ROIs did not accurately encompass the regions of high RAC uptake. The mean VOE between RAC ROIs and MRI ROIs for control and PD subjects was 0.58 ± 0.05 for the caudate and 0.36 ± 0.04 for the putamen.
(a) The shape of 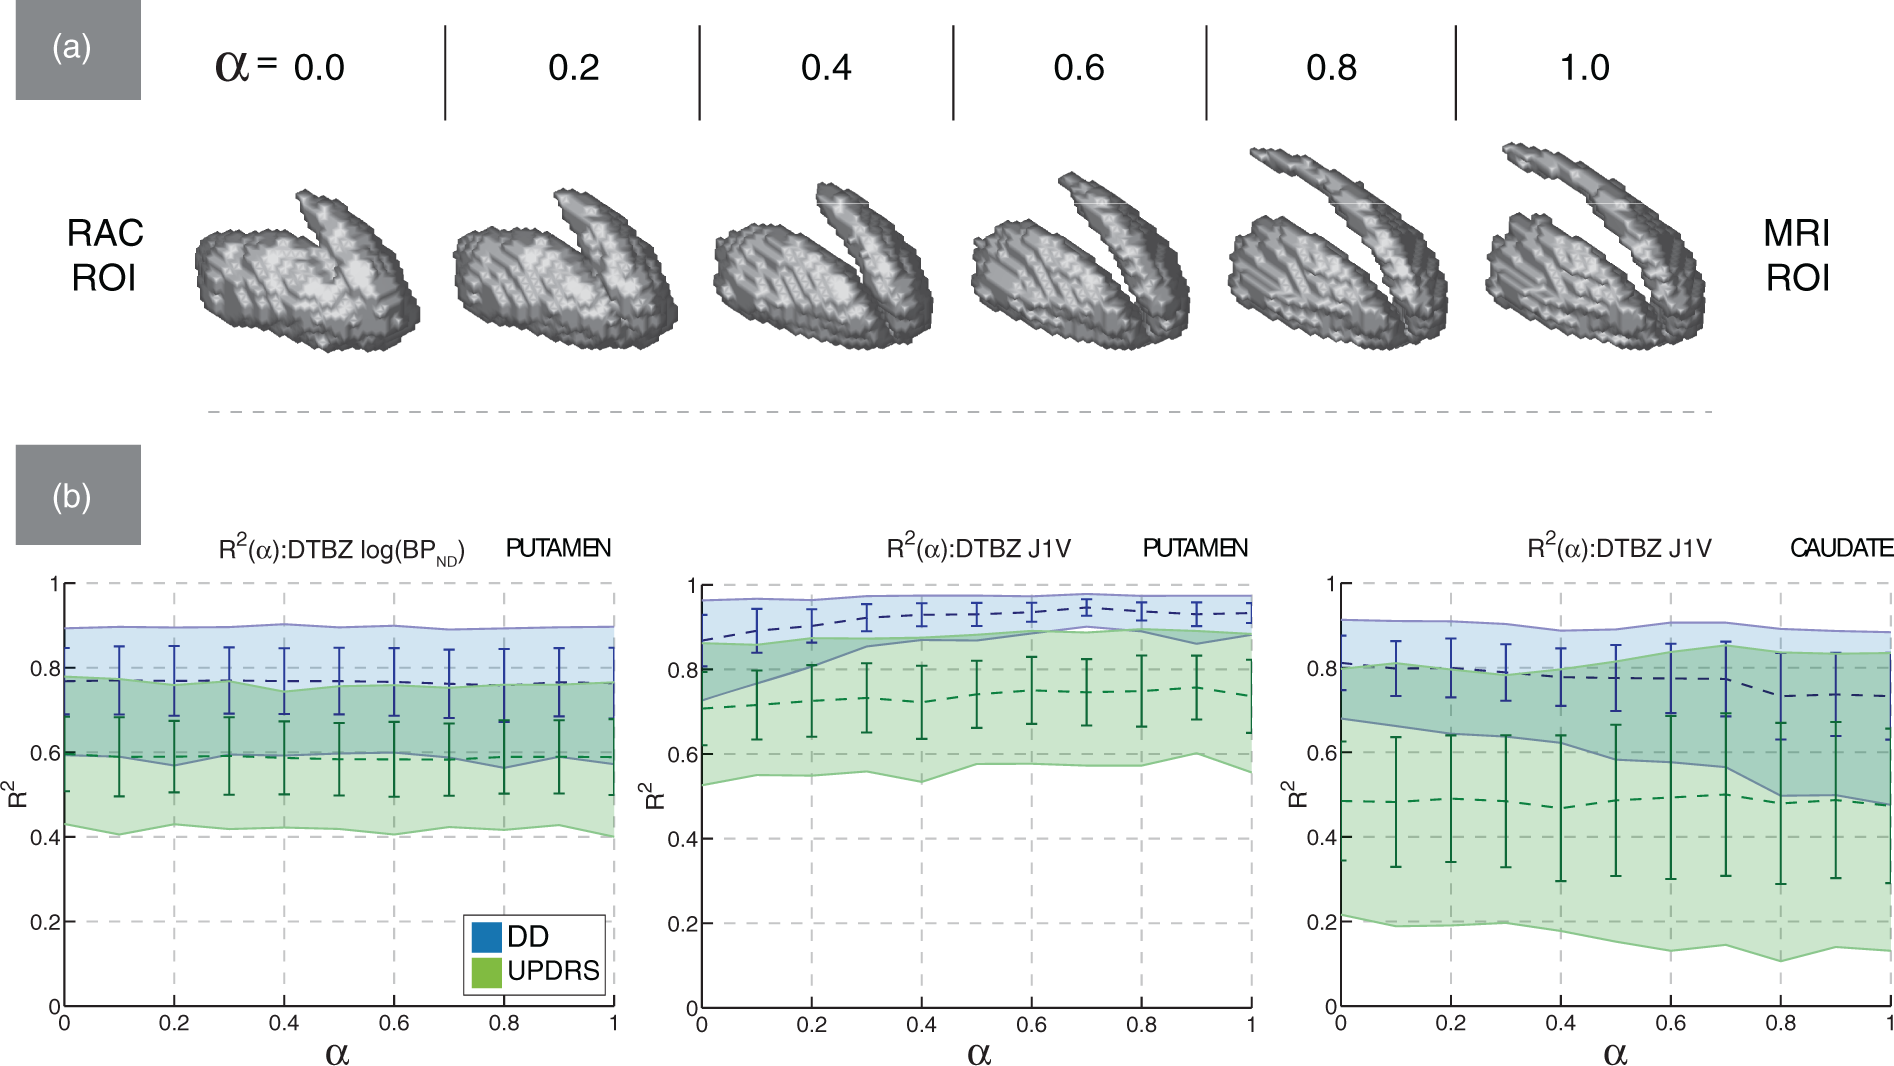
The correlation between RAC-derived image metrics and clinical data was statistically insignificant (Table 1), and the values of
With DTBZ-derived texture and value metrics in the RAC-MRI ROI space, the correlation with clinical data was generally preserved with α and comparable to that obtained in the DTBZ-MRI ROI space. However, the degree of preservation depended on the specific metric and analyzed structure (i.e. putamen or caudate). This is illustrated by the representative
Discussion
Neurological imaging studies often rely on KM to compute physiologically relevant parameters, such as the BPND. While producing interpretable results, KM has some drawbacks that may limit its use in a wider clinical setting. In this work, we investigated the ability of several metrics that do not require KM to serve as descriptors of the clinical disease severity and duration, in the context of imaging PD subjects. Since the metric performance could be dependent on the ROI selection criteria, the correlation between image metrics and clinical scores was evaluated over a family of single-modality and mixed PET-MRI ROIs obtained using a controlled region fusion method.
The study revealed that the correlation between the image metrics and clinical data may indeed depend on the ROI definition method: metrics varied in terms of their sensitivity to the anatomical accuracy of the ROI. For example, comparing the DTBZ-MRI and RAC-MRI ROI spaces, the correlation between DTBZ BPND and clinical metrics remained unchanged regardless of what ROI space was used, indicating that regions of high RAC uptake could be used as a substitute for the accurate anatomical reference regions. On the other hand, the correlation between DTBZ J1V and clinical metrics was highest with MRI ROIs, and degraded by ∼10% with RAC ROIs. This implies that 1) J1V and J2V metrics have higher sensitivity than BPND to ROI definition method and 2) with texture metrics, a fairly accurate anatomical reference may be required to achieve maximum correlation.
Among the investigated metrics, the moment invariants J1V (
Compared to value and texture metrics, the geometry metrics had moderate-to-low correlation with the clinical metrics and performed worse than BPND. Nevertheless, the measured values of the correlation coefficient between clinical assessments and these metrics evaluated for DTBZ in the DTBZ-MRI ROI space were statistically significant, unlike the geometry metrics evaluated for RAC in the RAC-MRI ROIs. This observation strengthens the conclusion that the moderate levels of correlation observed in the DTBZ-MRI ROI space were indeed meaningful and informative of the neurochemical changes associated with PD. The low correlation values indicate that, in the context examined, such metrics are of limited value by themselves; they become more useful if combined with complementary metrics (e.g. they can be combined with value metrics to improve the predictive strength of the corresponding multivariate model).
Visualizing the metric and R2 values for the established ROI space also revealed potentially interesting patterns. For example, the single-modality PET or MRI ROIs were not always optimal in terms of maximizing the R2 values. With region size metrics such as VOL, RVD, and SAR, the correlation strength was maximized when PET ROIs combined with a small MRI contribution were used (max
There are some limitations to this study; the obtained p values were not corrected for multiple comparison (several metrics were tested using a relatively limited number of subjects). This could lead to worse than expected generalization outside of the studied sample. However, conceptually similar metrics produced similar correlation values, providing an additional indication that the analysis results were robust. We also did not explore in detail the optimal form of the functions relating the outcomes of the imaging metrics to clinical data; the limited number of data points did not allow for such an exhaustive comparison. The trends observed with the Spearman’s correlation coefficient ρ replicated those obtained with R2, which at least in part indicates that the results were not specific to the used linear (or exponential) fits. Although a search for an optimal functional form would likely tweak the rank order of the correlations in terms of R2 (but not ρ), its absence does not detract from one of the main messages of this work that there is indeed clinically relevant quantitative information in the spatial distribution of the tracer and that such information can be captured using geometry and texture descriptors. A drawback pertaining to such descriptors is that it may be difficult to directly relate them to the physiological parameters that characterize the underlying neurochemistry. On the other hand, these descriptors may have enough sensitivity to effectively identify subtle disease-induced abnormalities; they also present the advantage of not requiring dynamic scanning with known plasma or tissue input function.
To summarize, the most important finding of this study is that quantifying the activity distribution pattern can be a useful approach for the analysis of tracers that explore neurodegenerative diseases characterized by distinct spatial progression. While in this case an excellent correlation between clinical metrics and a single image derived metric was found, this may not always be the case and combining several metrics in a single model that convey different kinds of information may prove beneficial, particularly in situations where subtle changes need to be detected. While our findings are very likely tracer-dependent, the results indicate that further exploration of similar methodologies is warranted. Our results also show that the evaluation of imaging metrics should be performed in the context of specific ROI definition criteria, possibly tailored to the specific function of structure under consideration.
Footnotes
Funding
This work was supported by the Natural Sciences and Engineering Research Council of Canada and the Canadian Institutes of Health Research grant #177236.
Declaration of conflicting interests
The author(s) declared no potential conflicts of interest with respect to the research, authorship, and/or publication of this article.
Authors’ contributions
ISK and VS designed the methodology, collected data, performed the analysis, and wrote the manuscript; MG designed the methodology and edited the manuscript; ES and NV assembled and pre-processed subject data; all authors discussed the results and commented on the manuscript at all stages.