
Abstract
Changes in cerebral blood flow are an essential feature of Alzheimer’s disease and have been linked to apolipoprotein E-genotype and cerebral amyloid-deposition. These factors could be interdependent or influence cerebral blood flow via different mechanisms. We examined apolipoprotein E-genotype, amyloid beta-deposition, and cerebral blood flow in amnestic mild cognitive impairment using pseudo-continuous arterial spin labeling MRI in 27 cognitively normal elderly and 16 amnestic mild cognitive impairment participants. Subjects underwent Pittsburgh Compound B (PiB) positron emission tomography and apolipoprotein E-genotyping. Global cerebral blood flow was lower in apolipoprotein E ɛ4-allele carriers (apolipoprotein E4+) than in apolipoprotein E4− across all subjects (including cognitively normal participants) and within the group of cognitively normal elderly. Global cerebral blood flow was lower in subjects with mild cognitive impairment compared with cognitively normal. Subjects with elevated cerebral amyloid-deposition (PiB+) showed a trend for lower global cerebral blood flow. Apolipoprotein E-status exerted the strongest effect on global cerebral blood flow. Regional analysis indicated that local cerebral blood flow reductions were more widespread for the contrasts apolipoprotein E4+ versus apolipoprotein E4− compared with the contrasts PiB+ versus PiB− or mild cognitive impairment versus cognitively normal. These findings suggest that apolipoprotein E-genotype exerts its impact on cerebral blood flow at least partly independently from amyloid beta-deposition, suggesting that apolipoprotein E also contributes to cerebral blood flow changes outside the context of Alzheimer’s disease.
Introduction
Alterations in regional cerebral blood flow (CBF) in subjects with Alzheimer’s disease (AD) or mild cognitive impairment (MCI) have been consistently described.1,2 These changes largely overlap with abnormalities in cerebral metabolism measured by 18F-fluorodeoxyglucose positron emission tomography (FDG-PET). 3 While CBF has been measured traditionally in the clinical setting using radioactive tracers, arterial spin labeling (ASL) MRI offers a non-invasive approach to CBF measurement 4 that can be obtained in conjunction with structural MRI scanning. ASL-MRI utilizes magnetically labeled blood protons as an endogenous tracer for quantification of brain perfusion and does not require injections or exposure to ionizing radiation. In several recent reports, ASL-MRI has been applied to prodromal and clinical AD patient cohorts, displaying sensitivity to early disease stages such as amnestic MCI.5,6 Additionally, CBF measured with ASL-MRI showed predictive value in the detection of cognitive decline and conversion from MCI to dementia. 7 However, conflicting results were found in a recent large multi-site study, in which ASL-MRI was performed across a spectrum including cognitively normal (CN) adults to cognitive impaired subjects (early MCI and late MCI) and AD. 8 Significant hypoperfusion relative to CN was only observed in late MCI and AD, questioning the sensitivity of ASL-MRI for detecting early cognitive impairment.
However, as MCI may be an etiologically heterogeneous diagnostic entity, pathological factors that might contribute to CBF changes in preclinical or prodromal AD need to be considered. Non-fibrillar, soluble assembly states of amyloid beta (Aβ)-peptides constituting the neurofibrillary tangles 9 are believed to disrupt synaptic function, even before significant neurodegeneration occurs. By the time cognitive impairment becomes clinically significant, a significant number of synapses have already been lost. 10 Currently, biomarkers are systematized as either pathological markers, e.g. amyloid-PET, CSF-Aβ, CSF-Tau/pTau versus topographical or progression markers, such as FDG-PET or structural MRI 11 or amyloid-markers versus markers of neuronal injury. 12 Alterations of brain structure and CBF were previously demonstrated in CN 13 and in MCI 6 with significant amyloid load. However, in animal models investigating the effect of Aβ on CBF, changes in CBF have only been found in aging Aβ knock-in mice, 14 while direct injections of Aβ in rat hippocampus inhibited excitatory synaptic function but had no effect on CBF. 15 In addition, it has been shown in (amyloid precursor protein) transgenic mouse models of AD that in the presence of cerebral beta-amyloid angiopathy (CAA) a decline of regional CBF could be observed, but not in a mouse model of beta-amyloidosis and negligible CAA, suggesting that CAA may be essential for CBF reductions. 16
The APOE ɛ4 allele conveys the strongest genetic risk for late-onset AD 17 and is a robust predictor of elevated amyloid-deposition in cognitively healthy subjects. 18 However, there are conflicting results on the influence of the ɛ4 allele on brain metabolism. 19 APOE genotype alters CBF 20 and the changes reported depended on cognitive/disease status. 21 Using ASL in CN with a family history of AD, APOE4+ was associated with elevated baseline perfusion in the medial temporal lobe. 19 However, locally reduced CBF (e.g. in the frontal association cortex) has also been reported for APOE4+ CN and AD,20,21 while APOE4+ MCI demonstrated elevated regional CBF. 20 ApoE4+ CN elderlies were found to have higher regional CBF at baseline but a greater longitudinal decline in regional CBF over an observation period of ten years. 22
Although some studies have looked either at APOE4− or Aβ-induced CBF changes, 23 current literature reporting CBF differences between CN and MCI or AD does not take into account both of these early disease-sensitive markers.
In this study, we examined CN and aMCI subjects using ASL-MRI for CBF, PiB-PET for amyloid load, and APOE genotyping. Based on the previous studies examining the role of amyloid-deposition or APOE ɛ4 allele on CBF, we hypothesize that CBF is specifically altered in PiB+ and APOE4+ participants but not in the aMCI group independently of PiB and APOE status. To determine the factor (i.e. group (controls/aMCI), amyloid (PiB−/PiB+) and genetic risk (APOE4−/APOE4+)) with the strongest influence on global CBF, we applied univariate general linear model analyses.
Methods
Participants
Study participants were recruited from two cohort studies and the resulting study sample overlaps with a previously published sample. 24 All subjects provided written informed consent. Cognitive health was defined by a Mini-Mental State Examination (MMSE) score ≥27 and a clinical and neuropsychological assessment not indicative of MCI or other cognitive disorders. Amnestic MCI was diagnosed according to standard criteria. 25 Participants had to be of age ≥55 years. Exclusion criteria were somatic or psychiatric conditions or use of any medication that would significantly affect cognition. Patients were excluded for this project if they had contraindications for MR or PET imaging or evidence of focal lesions in critical memory structures. ASL analyses were performed by investigators blinded to the APOE and PiB status. The study was approved by the ethics committee of canton Zurich, Switzerland (E_22_2009 and E_64_2009) and was done in accordance to the World Medical Association Declaration of Helsinki (2013).
Clinical and neuropsychological assessment
All participants underwent a comprehensive clinical assessment including clinical history, physical and neurological examination. Further, individuals underwent neuropsychological examination using the CERAD-Plus test battery, 26 including MMSE, letter fluency, verbal learning, recall and recognition, figure copy and recall, Boston naming test, trail making tests A and B, category, and letter fluency. Also the German version of the Verbal Learning Memory Test (VLMT, subtests: delayed and recognition), the Visual Paired Associates test from the Wechsler Memory Scale Revised, and the Stroop Test were analyzed. Raw scores were z-transformed based on test-specific normative data adjusted for age and gender.
Structural imaging
MR scans were acquired on a 3T Philips Ingenia scanner (Philips Healthcare, Best, The Netherlands), equipped with a 16-channel head coil. A T1-weighted 3D-MPRAGE anatomical scan was recorded prior to the ASL scan (TR/TE: 8.2/3.8 ms, voxel resolution: 1 × 1 × 1 mm, field of view: 240 mm and 170 slices). Grey matter (GM) and white matter (WM) differences were compared between CN and aMCI using voxel-based morphometry (data will be reported elsewhere).
ASL acquisition
ASL data were acquired using the Philips 2D pseudo-continuous ASL (pCASL) sequence. 27 The acquisition parameters were: time of repetition (TR)/time of echo (TE) = 4200/16 ms, flip angle: 90°, FOV = 240 mm, voxel size: 3 × 3 mm, 20 slices, thickness: 6 mm (no gap), imaging matrix = 80 × 80, labeling duration: 1.65 s, post-labeling delay: 1.53 s, SENSE factor: 2.5, and duration 6:26 min. Background suppression was used with two pulses: 1.68 s and 2.76 s.
Equilibrium brain tissue magnetization (M0) images were recorded in a separate run for each subject using the same parameters as described for the pCASL sequence, apart from the TR (10,000 ms) and TE (15 ms).
ASL analysis
ASL images were preprocessed using the pipeline implemented in ASLtbx. 28 The first step was motion correction and denoising. Subjects were excluded from subsequent analysis if any of the three translation parameters exceeded half of the voxel size (i.e. 3 mm) or if rotation values exceeded 1°. Denoising included spatial smoothing with an isotropic Gaussian at full-width-at-half-maximum (FWHM) of 6 mm3 to reduce interindividual anatomical differences and further increase the signal-to-noise ratio. The next step was pair-wise subtraction and CBF quantification using the one-compartment model. 29 All CBF images were normalized to the Montreal neurological image (MNI) template space to allow for statistical group comparison (see below).
CBF quantification
CBF was calculated on a voxel-wise basis according to the formula
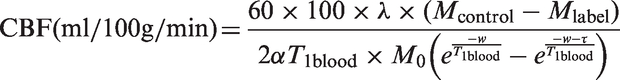
The labeling efficiency and the T1 of blood were taken from literature values, derived from previous experimental studies.31,32 The equilibrium magnetization of blood was calculated from the equilibrium magnetization of CSF, measured in 4 ROIs, multiplied by a correction factor for T2* decay and the relevant blood H2O partition coefficient taken from the literature. 30
For the calculation of the perfusion difference images (Mcontrol – Mlabel), simple subtraction was used because it has been demonstrated to efficiently minimize spurious BOLD contaminations within the CBF signal in the case of resting-state recordings. 33 Furthermore, it has been demonstrated that simple subtraction in resting-state CBF data works with the same performance as special filtering approaches. 33 CBF maps were shown in mL/100 g/min.
Global CBF calculation
First, a brain mask template was created (using the FSL software package, http://fsl.fmrib.ox.ac.uk/fsl/fslwiki/) to exclude all non-brain voxels. Then, a mean whole-brain CBF map (uncorrected for partial volume effects) was calculated by the mean of all voxels within the mask for each subject.
Voxel-wise CBF analysis
Additionally, partial volume effect (PVE) correction was applied to the normalized CBF maps using the SPM8 and MATLAB compatible (open-source) toolbox Grocer (version 2.11, http://www.nitrc.org/projects/fmri_grocer/) to correct for GM atrophy, as recommended for ASL analysis in neurodegenerative disorders. The Grocer toolbox offers several tools to analyze ASL-based CBF data (and also fMRI data). For our study, we used a batch to extract global PVE (here grey matter) corrected CBF values for each individual. In order to match the spatial resolution of the (smoothed) CBF images, the same isotropic Gaussian filter (6 × 6 × 6 mm) was applied to the GM mask as for the CBF images. Local CBF (and amyloid load) analysis was performed in 90 cortical and subcortical (excluding all sub-regions of the cerebellum) regions of interest (ROI) from the Anatomical Automatic Labeling (AAL) atlas. 34
Time of flight angiography
To envisage whether baseline cerebral perfusion within- or across groups was compromised by any vascular pathology in the large and medium sized vessels supplying the brain (e.g. shows lateralization effects in any group), we performed a 3D time of flight angiography (parameters: TR/TE: 25/3.5 ms, slices: 140 (gap 10 mm), scan resolution: 0.35 × 0.61 × 0.55 mm, FOV: 200, SENSE factor: 3, duration: 4.39 min) focusing on the internal carotid arteries and the circle of Willis.
PiB-PET
The method for PET-scanning has been described in detail elsewhere. 35 The cut-off for amyloid-positivity (i.e., PiB+) was ≥1.265 and was derived from 93 CN, which underwent PiB-PET in the context of a previously published cohort study. 24 Image processing was performed using PMOD V3.5.
Genotyping
APOE genotyping was performed as previously described. 36 Participants were classified (APOE4− status) as either carriers (APOE4+) or non-carriers (APOE4−) of the ɛ4 allele.
Statistical analysis
Chi-square (χ2) test was applied for comparisons of categorical data (e.g. gender, PiB status, APOE status). Mann-Whitney U test for continuous variables. For the statistical analysis on global CBF effects, a two-tailed t-test was applied for the three contrasts of interest: group (CN versus aMCI), amyloid status (PiB− versus PiB+), and genetic risk status (APOE4− versus APOE4+). Next, a univariate general linear model (GLM) was applied to assess voxel-wise (not masked by any brain tissue content) CBF effects for these three contrasts. Participants’ specific GM volume was used as covariate of no interest to eliminate any residual PVE at the intra-voxel level so that the observed group differences are not due to a reduced GM fraction in MCI subjects (relative to controls). Next, voxel-wise PVE-corrected ASL differences were assessed using unpaired t-test statistics for four contrasts: (1) CN versus aMCI (2) APOE4− versus APOE4+ (3) PiB− versus PiB+ and (4) CN APOE4− versus CN APOE+. All results are reported at a voxel-threshold of p < 0.01 (t ≥ 2.44, with an additional cluster threshold of k > 51 voxel to achieve a cluster-corrected threshold of p < 0.05). The total intracranial volume (TIV) and age were included as covariates of no interest. Local CBF group comparisons were only tested for the contrast (1) to (3), and were reported at p < 0.05 (uncorrected). We refrained from testing for local associations of CBF and local Aβ, as visual inspection of scatterplots did not reveal a monotone relationship (data not shown), as Aβ was not normal distributed. A univariate GLM was applied to test for the influence of factors ‘APOE4,’ ‘PiB,’ and ‘diagnostic group’ on global CBF. Age was included as covariate. We subsequently eliminated some of the interactions to optimize the GLM and report the effect sizes indicated by partial eta 2 . Further we provide parameter estimates for the three main contrasts (i.e., contrasts (1) to (3)) of the PVE-corrected analyses. All statistical analyses were performed with SPSS (IBM, Version 22).
Results
Sample characteristics
Sample characteristics.
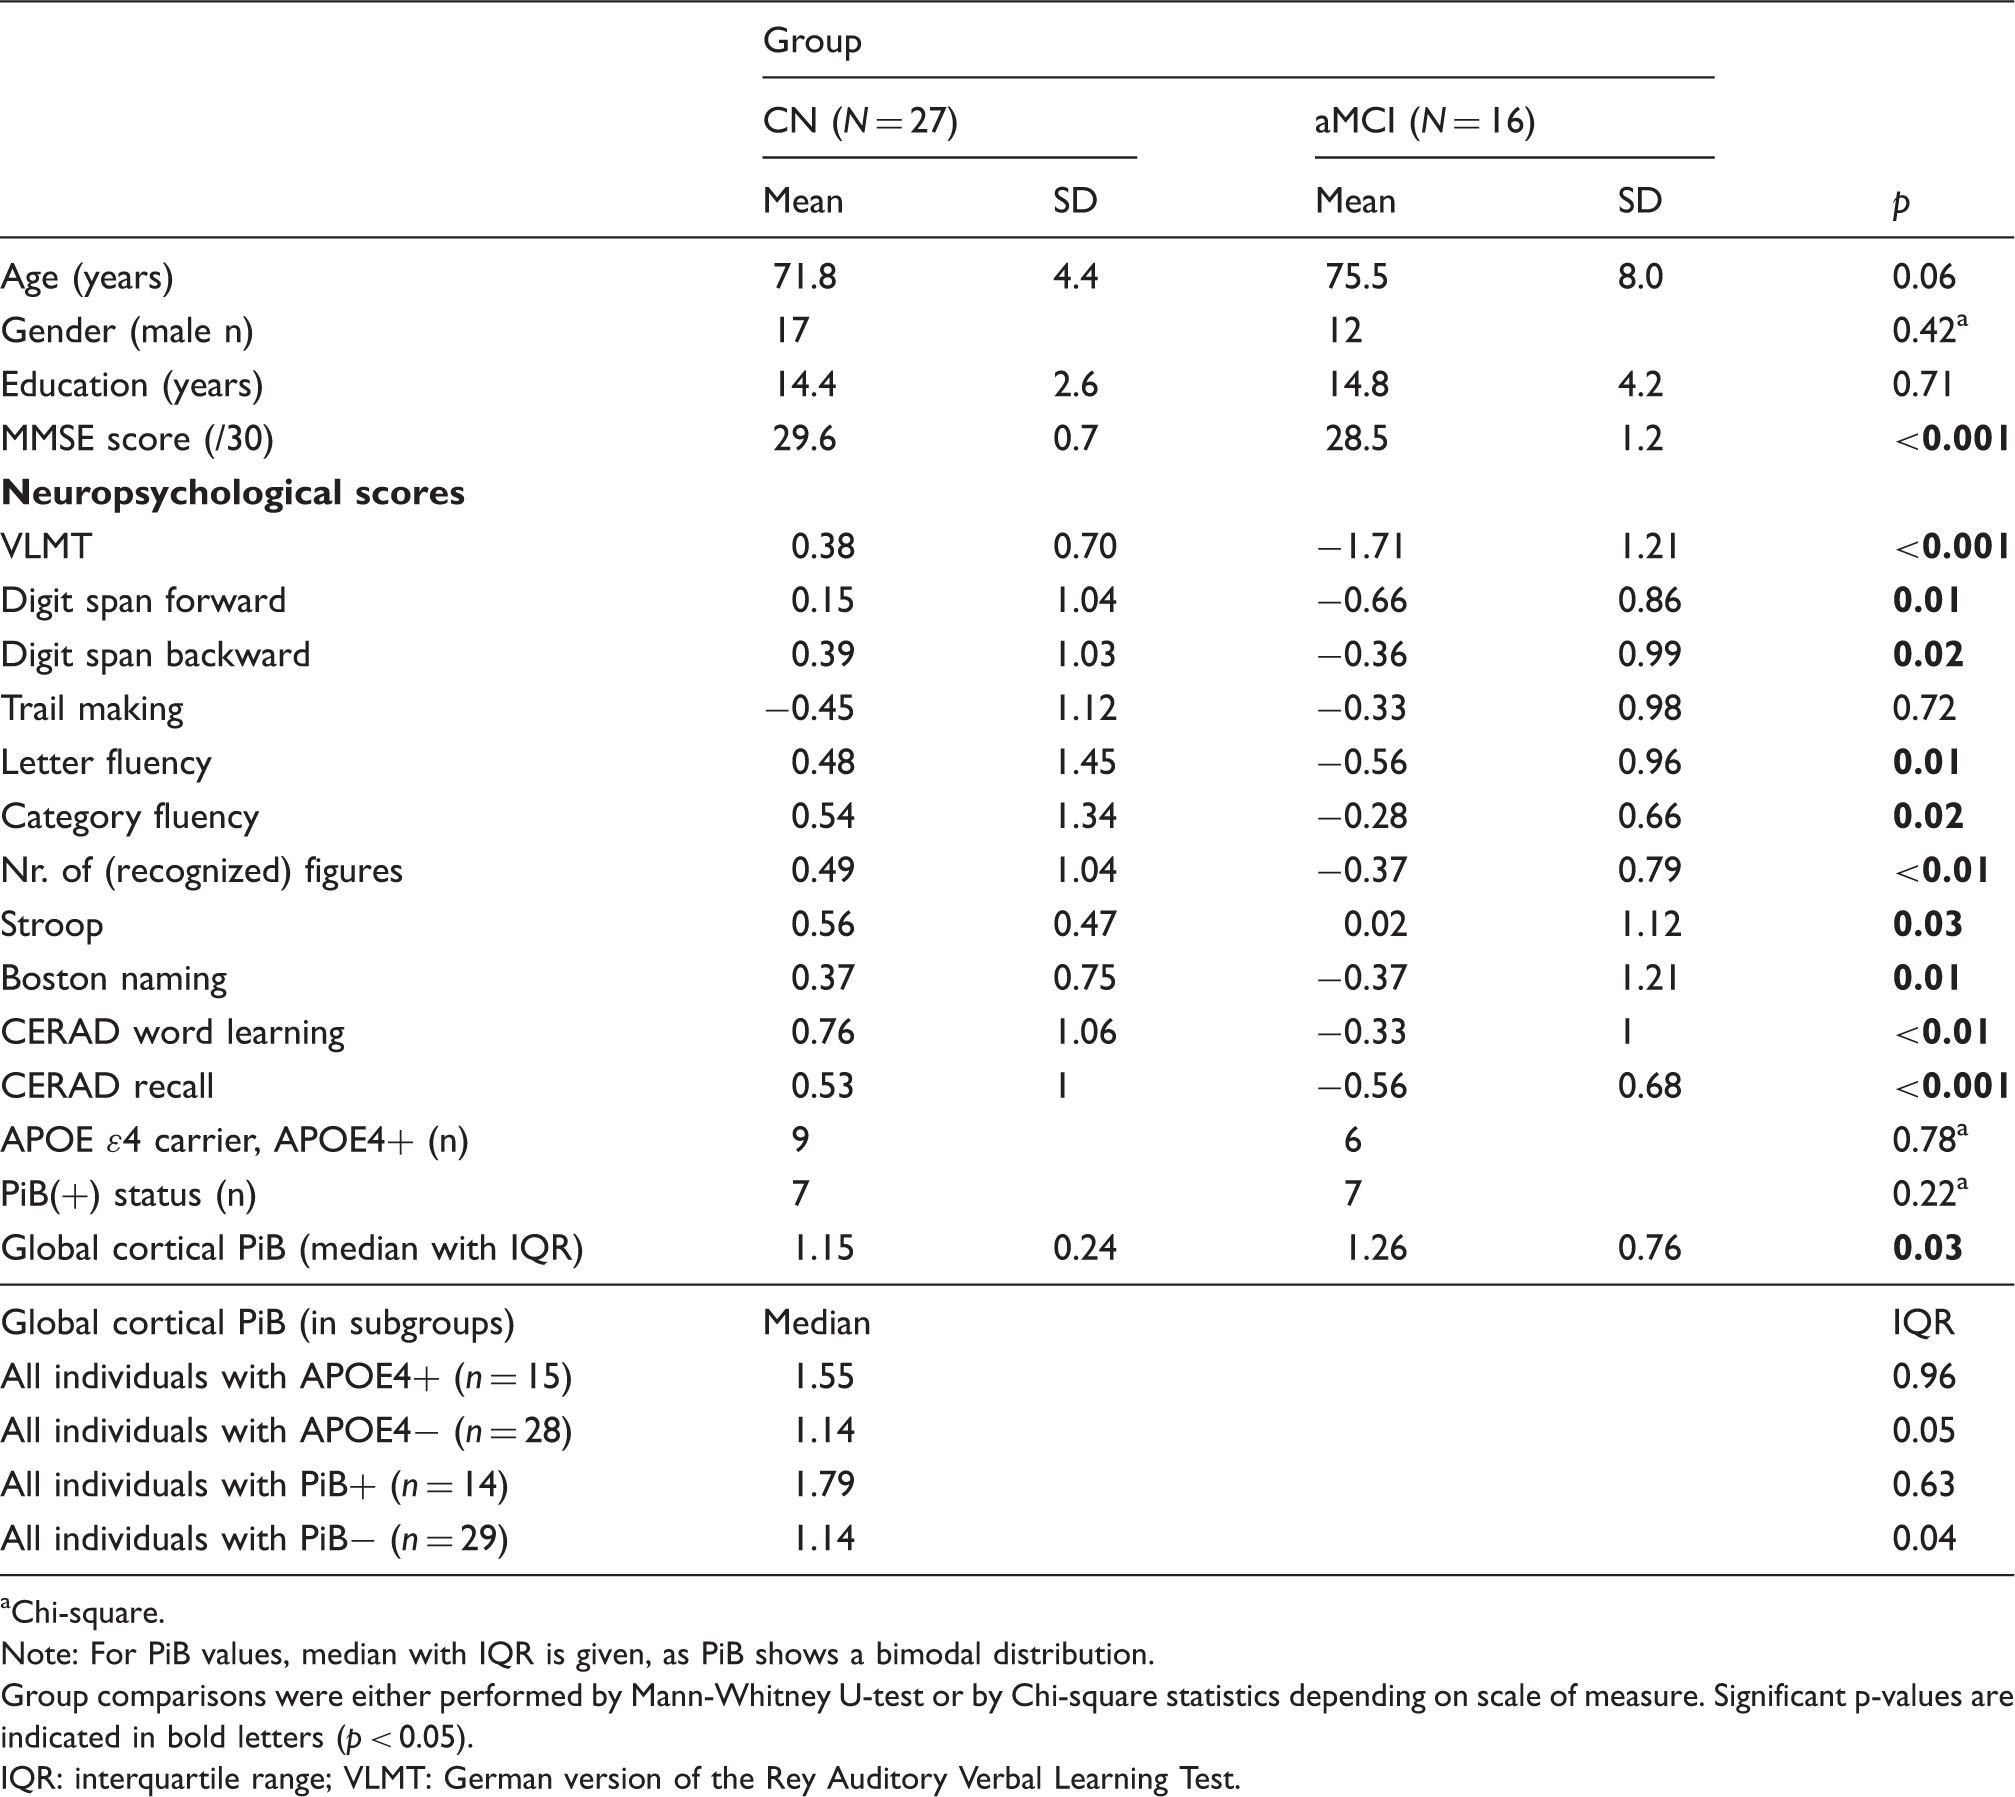
Chi-square.
Note: For PiB values, median with IQR is given, as PiB shows a bimodal distribution.
Group comparisons were either performed by Mann-Whitney U-test or by Chi-square statistics depending on scale of measure. Significant p-values are indicated in bold letters (p < 0.05).
IQR: interquartile range; VLMT: German version of the Rey Auditory Verbal Learning Test.
Drug regimen for controls (CN) and aMCI.
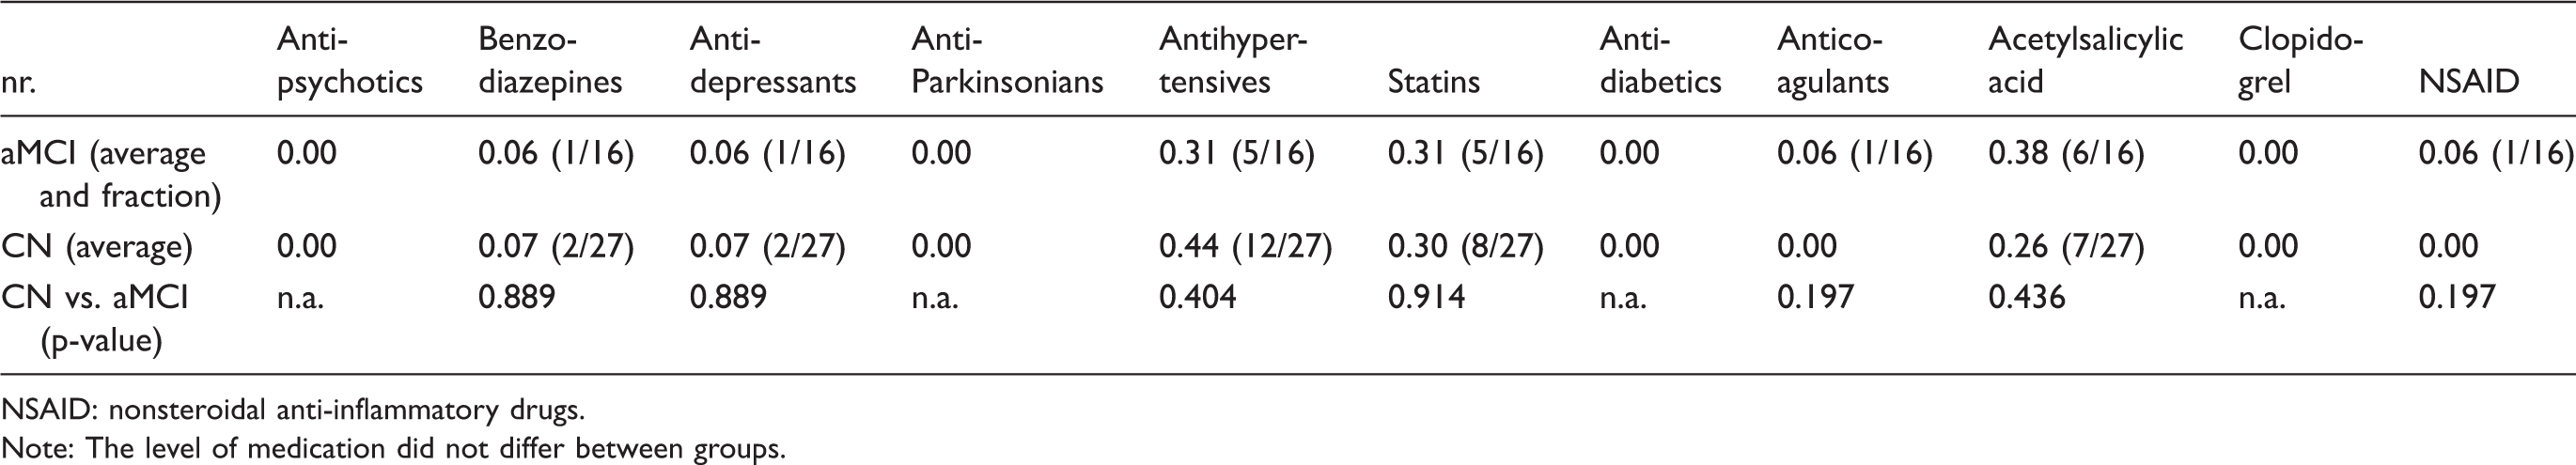
NSAID: nonsteroidal anti-inflammatory drugs.
Note: The level of medication did not differ between groups.
CBF analysis
Between group differences in cerebral blood flow.

Note: Brodmann areas are given if applicable. n.a.: not applicable; PVE: partial volume corrected (using grey matter).
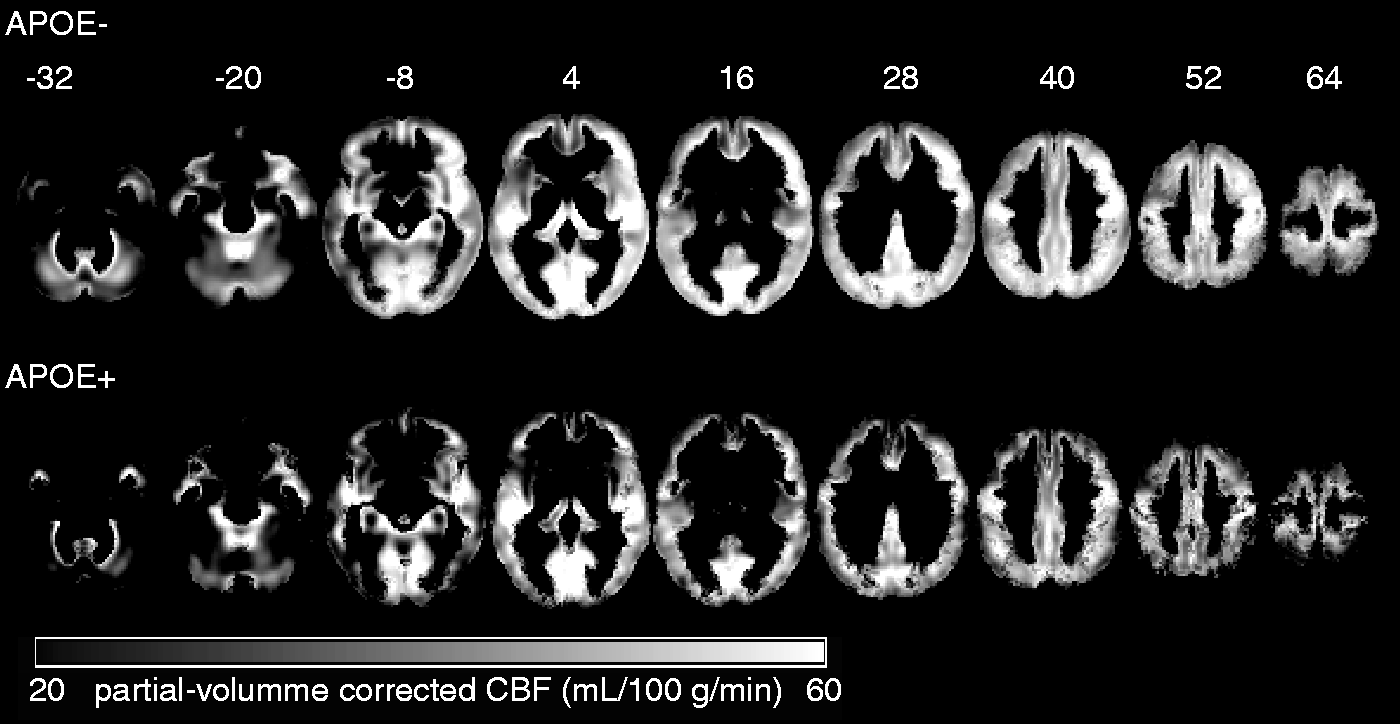
PVE-corrected CBF maps for the groups APOE4− and APOE4+. Lighter areas represent areas with higher CBF. CBF maps are shown on axial slices: range z = −32 to z = 64 (gaps: 12 mm) and are given in mL/100 g/min. PVE: partial volume corrected (using grey matter).
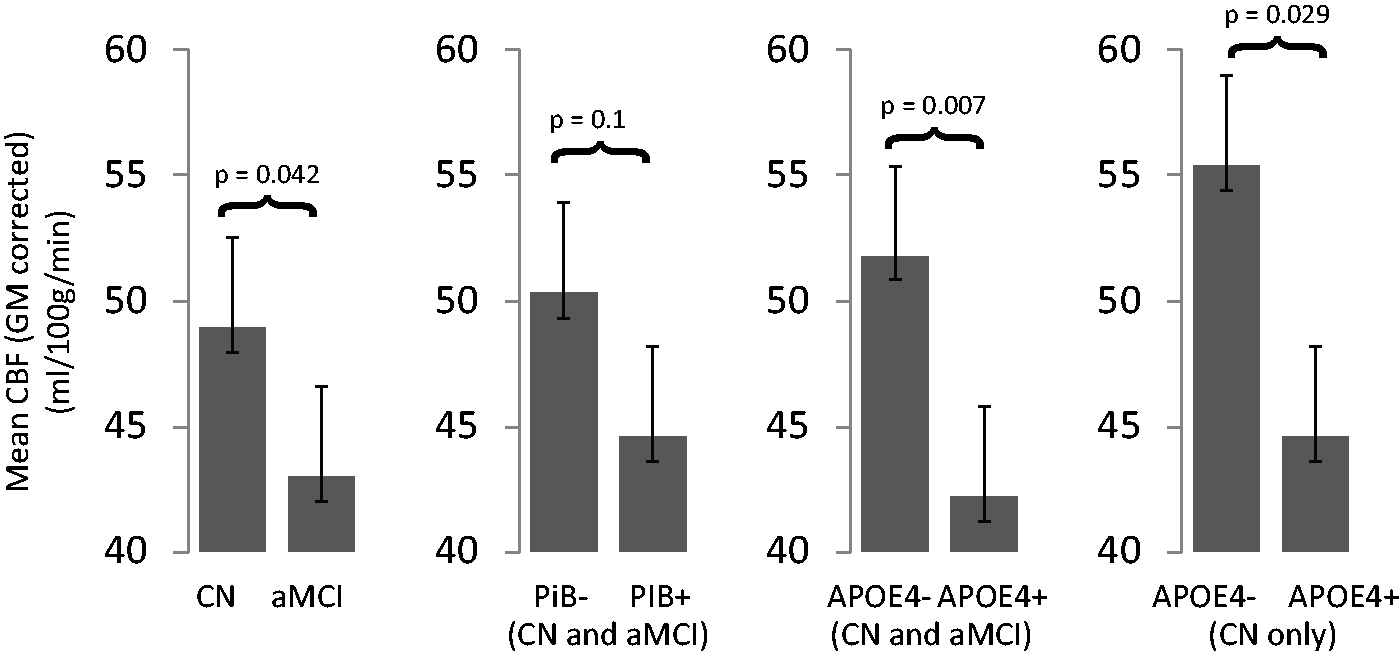
Statistical grey matter based CBF group comparisons. All comparisons (CN versus aMCI, APOE4− versus APOE4+, and CN APOE4− versus APOE4+) showed statistical differences (p < 0.05) or a trend (PiB− versus PiB+). The comparison PiB− versus PIB+ yields a trend, with higher mean CBF for PiB−.
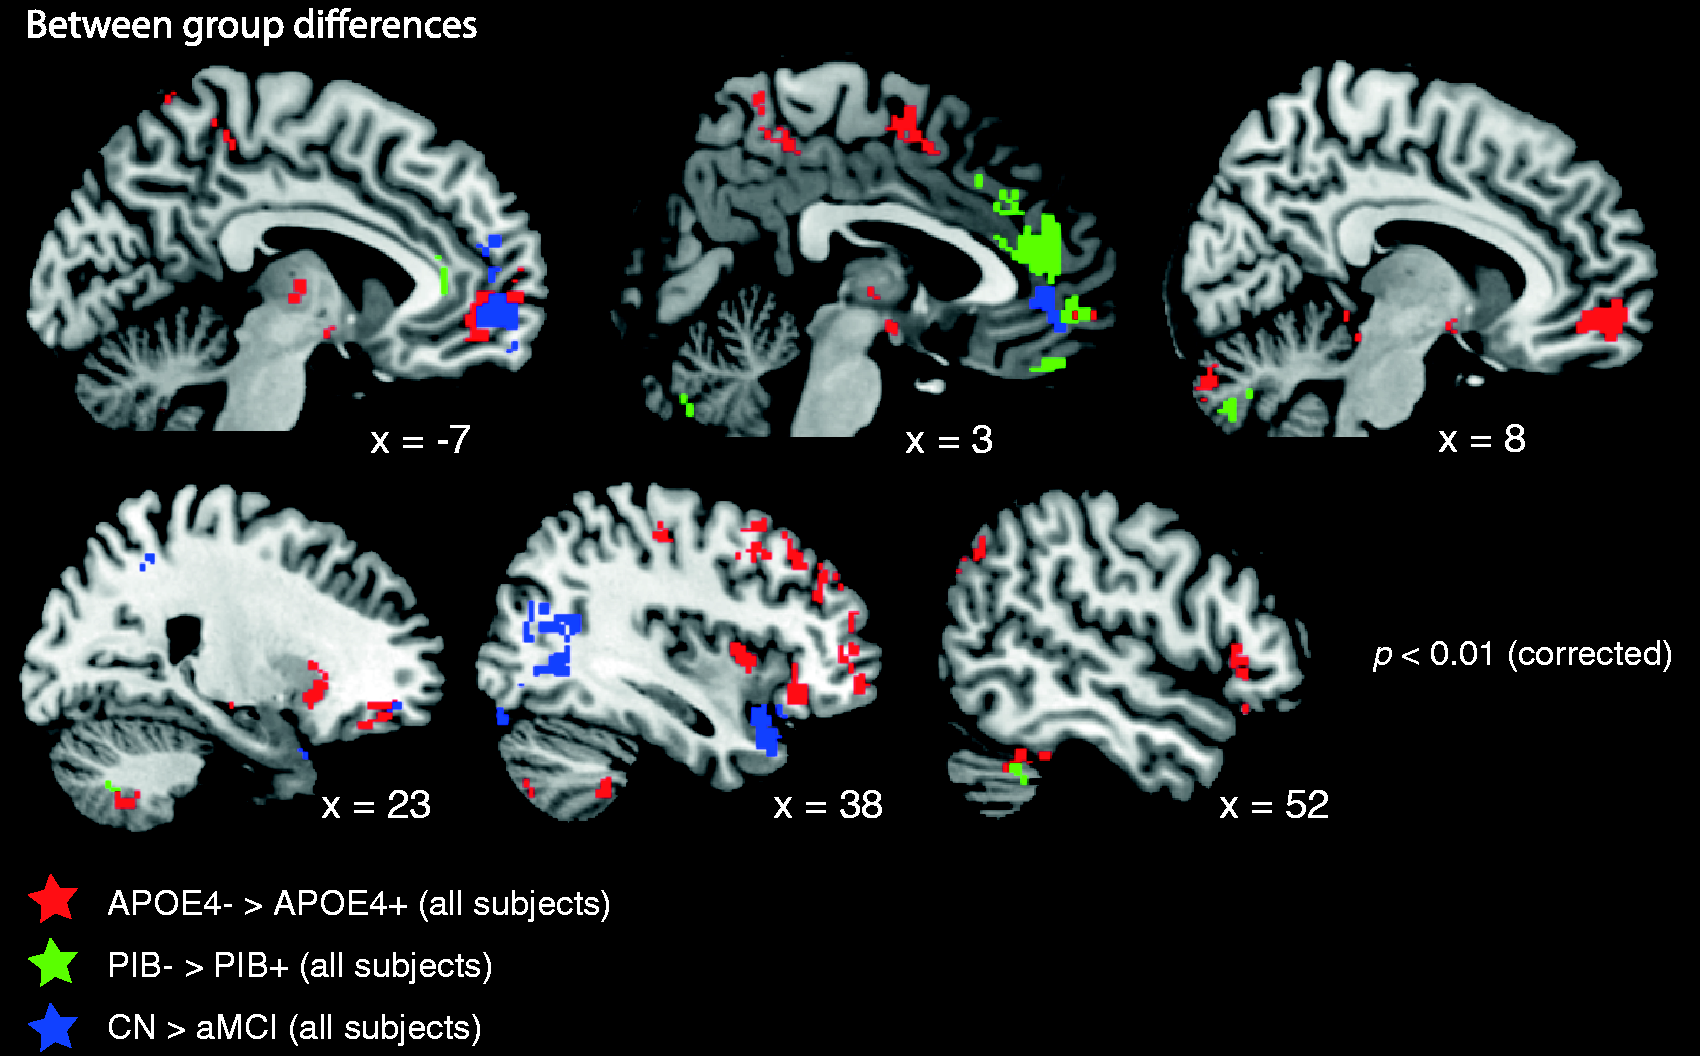
Voxel-wise PVE-corrected CBF group differences. The different colors indicate three statistical comparisons: APOE4− versus APOE4+ (red), PiB− versus PiB+ (green), CN versus aMCI (blue). All results are shown at p < 0.01 (cluster-enhancement correction, k > 51 voxel; and corrected for age, total intracranial volume). APOE4+: carriers of the ɛ4 allele, PiB+: global Aβ > 1.265 (group cut-off value). PVE: partial volume corrected (using grey matter).
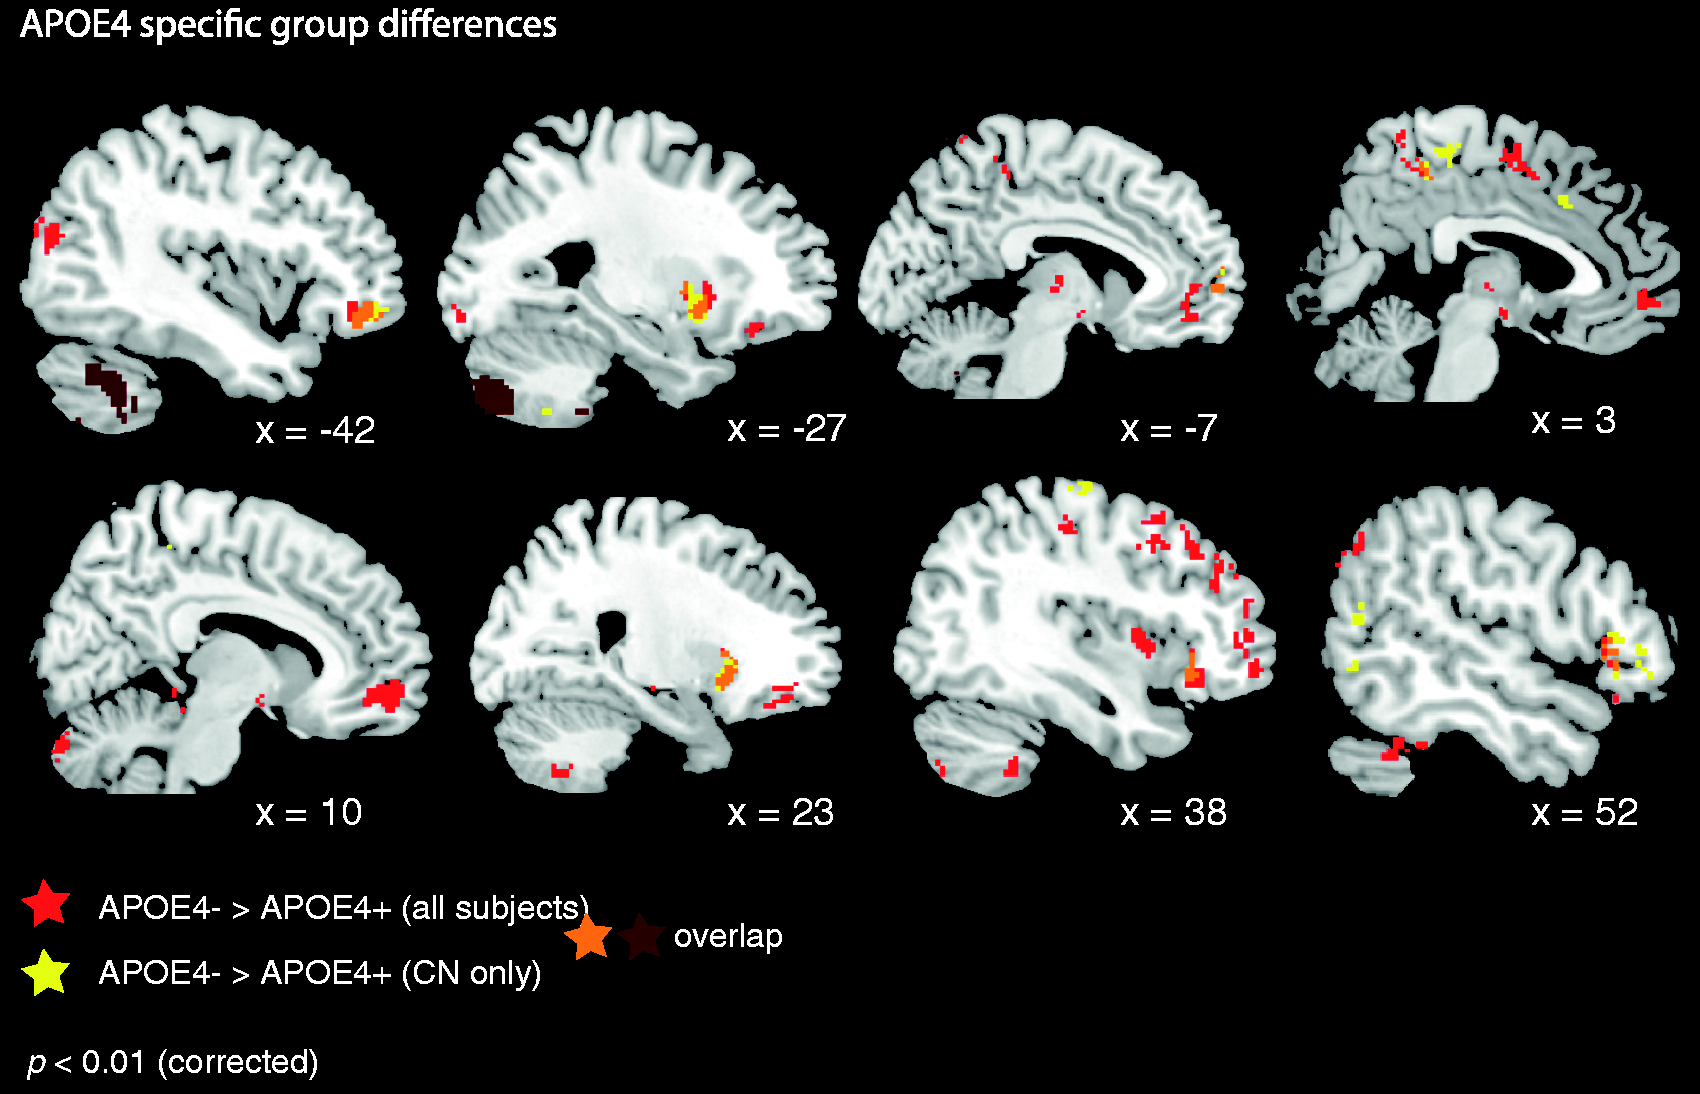
Voxel-wise PVE-corrected CBF differences for the contrast CN APOE4− versus CN APOE4+ (yellow) and APOE4− versus APOE4+ (red). APOE4+: carriers of the ɛ4 allele; CN: controls. Orange/dark red areas indicate overlap of CBF across both contrasts. PVE: partial volume corrected (using grey matter).
To test for the strongest influence of the factors of main interest (APOE4, PiB, and group) on PVE-corrected CBF, we applied a univariate GLM (corrected for age). The overall significant GLM (F(6,36) = 4.07, p = 0.003, partial eta2 = 0.404) contained the following independent factors and interactions: group, PiB, APOE4, age, PiB x age interaction, and PiB × group interaction. We found the highest effect sizes (partial eta 2 ) for the factor APOE4 (F(1,36) = 5.01, p = 0.031, partial eta2 = 0.122), followed by a trend for PiB (F(1,36) = 3.3, p = 0.078, partial eta2 = 0.084). In contrast, factor group was not significant. The analysis of the parameter estimates further revealed the highest partial eta 2 values for the contrasts: APOE4− versus APOE4+ (partial eta 2 : 0.122) relative to the PiB contrast (PiB− versus PiB+: 0.092) and group contrast (CN versus aMCI: 0.092). A full list of PVE-corrected CBF group differences is reported in Table 3.
ROI-based CBF analysis
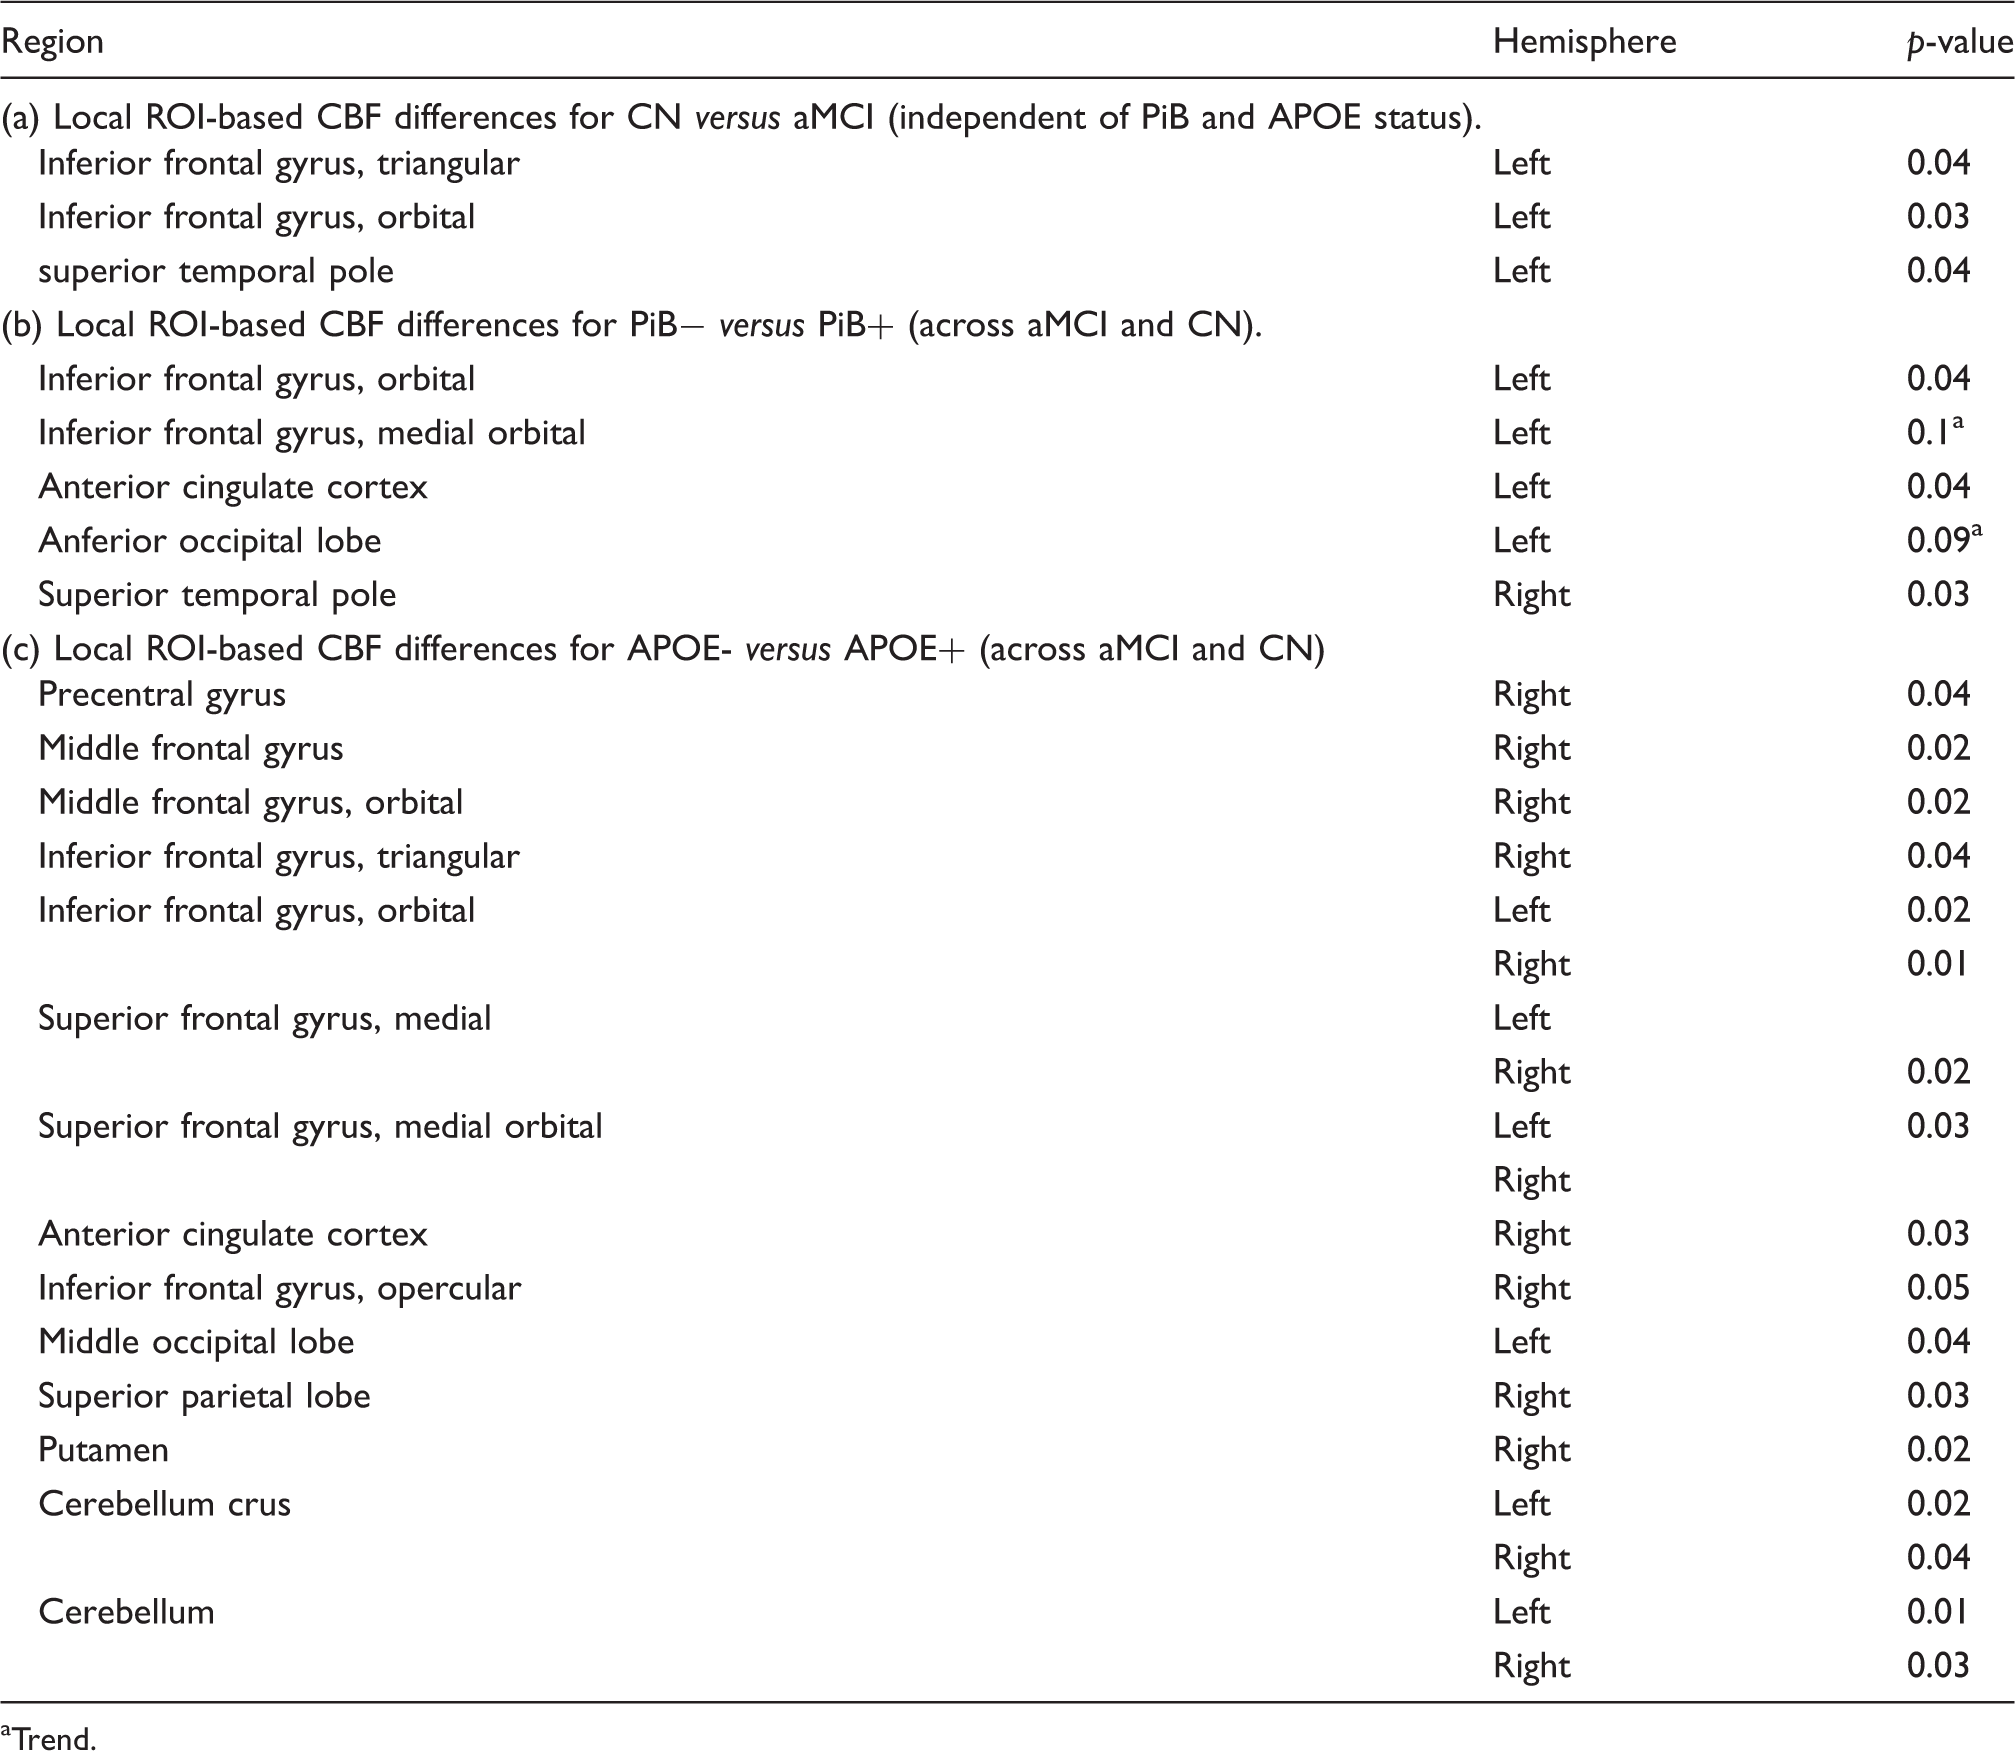
Between group differences in cerebral blood flow in regions of interest.
Trend.
Discussion
In this study, we evaluate differences in CBF in CN and aMCI using ASL-MRI. Furthermore, we have studied the influence of elevated amyloid-deposition and APOE-genotype on CBF. Our study demonstrates that ASL-MRI is capable of assessing perfusion changes associated with amnestic MCI, APOE-status and cerebral amyloid-deposition. The major finding of this study was that APOE4+ show lower global CBF than APOE4−. Lower CBF was found in frontal, parietal and temporal areas. Furthermore, PiB+ and aMCI also showed reduced overall CBF (relative to PiB− and CN, respectively) but effects were weaker and did not reach statistical significance for the contrast PiB− versus PiB+. Local CBF reductions were more widespread for the contrast APOE4−carriers versus non-carriers.
ASL in discrimination of MCI and CN
Global CBF was lower in MCI than in CN which was not caused by occlusion of larger cerebral vessels. Several regions survived PVE-, TIV-, age, and cluster-size correction for all group differences. PCASL has been recommended as the most sensitive ASL technique for the assessment of perfusion differences driven by metabolic changes due to neurodegeneration. 8 Recently, one 3D PCASL study found weaker CBF differences between CN and MCI in fronto-parieto-occipital regions than the contrast CN > AD. 37 In our study, CN > aMCI CBF differences were seen in some frontal regions, the (middle) occipital and temporal cortex and additionally in the left putamen. The relatively small CBF differences between CN versus aMCI (i.e. relative to the spatially more widespread CBF differences for the contrast APOE4− versus APOE4−) are in line with a recent study which did not find CBF differences between MCI and CN if other structural markers (here Aβ) were not taken into account. 6 The subjects analyzed in this study are part of a larger sample, where lower CBF, estimated by early tissue uptake of the PiB tracer (ePiB), was found in the left posterior cingulate cortex, bilateral hippocampus, and left IFG in aMCI. Though the methodology among the studies is not entirely comparable (regions selected hypothesis based, different read out, atlas, absence of partial volume correction in the former study) we also identified a group difference in the left IFG in this smaller sample, which is in line with the importance of this region for a variety of cognitive abilities.38–40 Furthermore, we were able to identify clusters of lowered CBF in the left angular gyrus/inferior parietal lobe and in the left precuneus in the voxel-based approach in regions where FDG hypometabolism has also been described.41,42 We did not identify changes in the hippocampus and in the posterior cingulate as in the previous study and as has been consistently found in the FDG-PET-literature.
Influence of APOE and PiB on CBF
APOE exerted the strongest effect on global CBF assessed by ASL. The most widespread CBF differences were seen for the contrasts: APOE4− versus APOE4+ (across all participants) and for APOE4− versus APOE4+ (within controls), and these findings were not driven by vascular abnormalities (as assessed by TOF angiography). Similar to our study, one recent pulsed ASL-MRI study found reduced regional CBF in APOE4+ participants in several brain regions. 20 However, the effects were found in CN and AD but not in MCI, where CBF was increased in discrete regions. We first decided to pool CN and aMCI groups to increase the sensitivity to APOE effects due to the overall small number of ɛ4 allele carriers within aMCI. However, even in the analysis within the CN group (19 APOE4− versus 9 APOE4+) we found widespread fronto-parietal CBF reductions in APOE4+, also including important subcortical regions, such as the thalamus, caudate nucleus, and putamen, which have been shown to be structurally or functionally abnormal in aMCI (or AD).43–45
In the ROI-based approach, we did not identify differences in typical AD regions, with the exception of the right precuneus, consistent with our previous report on ePiB. 24 Additionally, the reductions in CBF were not seen in typical AD regions for the contrast PiB+ versus PiB−. A very recent study examined the link between amyloid load and CBF in AD-dementia and MCI 6 in 182 subjects in total, including 105 MCI subjects. Similar to our findings, CBF was lower in subjects with high Aβ (independent of diagnostic group). In the two MCI groups (i.e. early and late MCI), however, ASL reductions in PiB+ subjects were seen in the inferior parietal and temporal cortex but not in the precuneus, entorhinal cortex or in the frontal cortices (where changes were observed only in AD dementia). As the authors acknowledge, the APOE genotype and amyloid-pathology may have independent statistical effects on CBF. This notion is also supported by a recent FDG-PET study. 46 Our findings on the CBF difference between APOE4 carriers and non-carriers are consistent with findings of FDG-PET results showing hypometabolism as widespread throughout the brain. 47 In addition, the regions we examine partially co-localize with regions that exerted a longitudinal decline in CBF assessed by H20-PET. However, this study described higher baseline CBF in ApoE4 carriers at baseline, which we only observed in the anterior cingulate cortex. A recent meta-analysis 48 identified the right middle frontal gyrus, the region which is most consistently identified to be hypometabolic in FDG-PET studies. This region also showed reduced CBF in our analysis. Interestingly, one study only identified effects of APOE4 and age on cerebral glucose metabolism but not of amyloid-status measured by florbetapir-PET. 49 Together with these findings, our results strongly suggest that APOE4 contributes to changes in global CBF and that these changes are widespread and not bound to amyloid-pathology or limited to typical regions showing early hypometabolism in AD. Several reasons may account for this. First APOE4 may contribute to neurovascular dysfunction independently of amyloid-deposition. 50 In mice expression of APOE4 but not E3 or E2 led to blood brain barrier dysfunction and CBF reductions. 51 Other factors by which APOE4 may cause changes in CBF are its interaction with mitochondrial function, and its influence on neuroinflammation, which have been reviewed in detail elsewhere. 52
Limitations
As our study is cross sectional we cannot elaborate on the predictive diagnostic value of ASL, e.g. whether reduced CBF in addition to PiB+ and APOE4+ status is predictive for more rapid cognitive decline. The data for the regional CBF analyses are not corrected for multiple comparisons and must thus be considered explorative. However, the regions identified do include clusters where we also found lowered global CBF. Additionally, further evidence for the value of perfusion measurements with ASL-MRI as a biomarker for neuronal dysfunction and injury (e.g. structural MRI, CSF total tau/phosphorylated tau) in MCI and AD must be collected. Technically, the ASL signal is directly related to local blood flow but quantification in physiological units critically depends on the transit delay time. Although large changes in the transit time due to the presence of significant stenosis were excluded in this study by the MR angiography, observed group differences might also reflect inter-individual differences in transit time.
In contrast to multi inversion-time ASL recording schemes, the standard pCASL implementation does not allow for estimation of the arterial transit time. However, the advantage of PCASL is that the SNR is maximized. Due to the known decrease of perfusion in cognitively impaired elderly patients, the perfusion SNR is expected to be lower than in other (e.g. younger healthy) populations. For this reason, pCASL was selected over other ASL implementations for the present study. However, the population examined is also arguably likely to demonstrate prolonged transit times. As it is known that the delivery time is slower in the elderly, 53 it is possible that complete delivery of the labeled bolus was not fully achieved in our study, as the labeling delay was 1.53 s (albeit identical for both CN and subjects with aMCI). However, the use of longer than optimal post-labeling delay times would result in strong T1 decay of the label and reduced signal to noise ratio.
In cases with prolonged transit times and without a separate estimate of the arterial transit time, perfusion may be either overestimated (due to the longer T1 of blood relative to tissue, resulting in intraluminal spins at the time of image readout with artefactually increased perfusion) or underestimated. In our data, the masked, PVE-corrected GM CBF maps mostly did not include vascular regions prone to transit time artefacts from delayed perfusion, so transit time effects are more likely to result in an underestimate rather than an overestimate of the CBF, since transit time effects are not accounted for in the single time point pCASL measurement. One subject did show focused (parietal) hyperintensities indicative of a potential transit time artifact (MCI38, see supplemental Figure 1). However, this artifact seems unlikely to affect the statistical result, as this subject was APOE4+ and group-results rather indicate higher CBF in parietal regions for the APOE4− group (Figure 3).
Finally, it would have been informative to perform a hierarchical (regression) analysis, in order to examine the most causal factor (e.g. APOE4 > PiB > group) on CBF. However, we want to emphasize that only a path analysis (using structural equation modeling or partial least square path modeling) can provide such information about the causal interactions. This was not applicable for our study. Firstly, because of our small sample size (at least 30 observations would be required in each sample group, considering just the three predictors APOE4, PiB, and group) and second because such an analysis would require a priori knowledge about both the main variables (e.g. APOE4) and relevant latent variables (e.g. lifestyle, other risk factors for AD such as diabetes, depression, etc.), which might also influence CBF.
Conclusion
From a clinical diagnostic perspective, we provide additional evidence that ASL-MRI is capable of identifying subjects at risk of Alzheimer’s dementia. From the neurobiological perspective, we conclude that CBF is strongly influenced by inheritance of an APOE epsilon4 allele and that this influence is at least partly independent of the contribution of APOE to amyloid-deposition.
Footnotes
Funding
The author(s) disclosed receipt of the following financial support for the research, authorship, and/or publication of this article: This study was made possible by SNF Grant Nos. 33CM30_124111, 33CM30_140335 and 320030_125378.
Acknowledgments
We thank all subjects for their participation in this study. We furthermore thank Isabella Blum, Esmeralda Gruber and Faith Sieber (study nurses), Diana Bundschuh and Wiebke Buck (technical assistance), Sabine Spoerri, Stefan Kluge and Stefan Doppler (data management), and all study physicians and neuropsychologists for help with data acquisition. We also thank Sarah Grimm for her help on the statistical analyses.
Declaration of conflicting interests
Christoph Hock is co-founder and board member of Neurimmune Holding AG, Schlieren. The other authors have no conflicts of interest.
Authors’ contributions
LM, AG, CH, and SK designed the study. LM, FR, RM collected the data. LM, GM, ROG, GW, AG, AK, and SEL analyzed the data. LM, AG, FR, AB, SK, ROG, and GW wrote the paper. LM and GW contributed equally to the article. SK and AFG shared senior authorship.
References
Supplementary Material
Please find the following supplemental material available below.
For Open Access articles published under a Creative Commons License, all supplemental material carries the same license as the article it is associated with.
For non-Open Access articles published, all supplemental material carries a non-exclusive license, and permission requests for re-use of supplemental material or any part of supplemental material shall be sent directly to the copyright owner as specified in the copyright notice associated with the article.