
Abstract
Objective:
To compare the one-year postoperative outcomes of anti-gravity treadmill rehabilitation with those of standard rehabilitation in patients with ankle or tibial plateau fractures.
Design:
An open-label prospective randomised study.
Setting:
Three trauma centres.
Subjects:
Patients were randomised into the intervention (anti-gravity treadmill) or control (standard protocol) rehabilitation group.
Main measures:
The primary endpoint was changes in the Foot and Ankle Outcome Score for ankle fractures and Knee Injury and Osteoarthritis Outcome Score for tibial plateau fractures from baseline to 12 months after operation. Secondary endpoints were the subscores of these scores, muscle atrophy (leg circumference at 20 cm above and 10 cm below the knee joint) and the Dynamic Gait Index.
Results:
Initially, 73 patients (37 vs 36) underwent randomisation. After 12 months, 29 patients in the intervention group and 24 patients in the control group could be analysed. No significant difference was noted in the Foot and Ankle Outcome Score (80.8 ± 18.4 and 78.4 ± 21.1) and Knee Injury and Osteoarthritis Outcome Score (84.8 ± 15.2 and 81.7 ± 17.0). The change in the Dynamic Gait Index from 12 weeks to 12 months differed significantly between the groups (P = 0.04). Patients with tibial plateau fractures had a 3 cm wider thigh circumference in the intervention group than those in the control group (95% confidence interval: −0.2 to 6.3 cm, P = 0.08).
Conclusion:
One year after surgery, patients who had undergone anti-gravity treadmill rehabilitation showed better gait than patients in the control group, and those with tibial plateau fractures had less muscle atrophy.
Introduction
In everyday routine, surgeons require patients to not or only partially bear weight after surgically treated lower limb fractures. There is little evidence for this routine postoperative approach. However, reduced weight bearing may be justified for tissue protection and depending on the osteosynthesis material used.1–4
The most significant consequence of partial weight bearing is muscle atrophy. Several studies have shown that the lower extremity, in particular, reacts with muscle atrophy when its regular load is entirely or partially removed.5–9 The assumption of training with an anti-gravity treadmill is that a specific gait and muscle training can be performed during the period of partial weight-bearing. We recently compared a structured gait programme on an anti-gravity treadmill with a standardised rehabilitation programme in patients with postoperative partial weight-bearing, and to our knowledge, we are the first to show significant less muscle atrophy in treadmill training after six weeks. 10 However, the effect of an anti-gravity treadmill programme after the immediate postoperative mobilisation phase has not yet been reported. Therefore, we assessed the outcomes in the patients of our previous study after one year to understand the mid-term effect of anti-gravity treadmill rehabilitation. Little is known about this, and inconsistent results concerning partial weight bearing have been reported by others so far.4,11–13
This prospective randomised study aimed to test our hypothesis that anti-gravity treadmill mobilisation has beneficial effects after one year over a standard rehabilitation protocol in patients with tibial plateau or ankle fractures who had partial weight-bearing for six weeks postoperatively.
Patients and methods
This prospective, randomised, controlled study was performed in patients with tibial plateau or ankle fractures who had undergone surgery at three level 1 trauma centres in Germany between August 2016 and June 2018.
The protocol was approved by the ethical review committee of the University of Leipzig (reference number: 176/14-ff) and the ethics review committee of the State Chamber of Physicians of Saxony (reference number: EK-allg-7/16–1). The study was conducted in accordance with the Declaration of Helsinki 1964 and its later amendments and the International Conference on Harmonisation (Good Clinical Practice guidelines). The trial was registered at clinicaltrials.gov (NCT02790229). After a detailed explanation of the purpose, procedures and the potential benefits and risks, patients were required to provide written informed consent to participate in the study.
The methodology of the trial is described in detail in our previous reports.10,14 We report the final results of the study after one year.
Eligible patients were allocated according to the inclusion and exclusion criteria into an intervention (anti-gravity treadmill rehabilitation) group and a control group (standard rehabilitation). The intervention was performed in the first six weeks postoperatively.
The primary endpoint in this study was the change in the overall Foot and Ankle Outcome Score or the Knee Injury and Osteoarthritis Outcome Score during the first year postoperatively. Both scores are calculated on the basis of a 42-item questionnaire that includes Symptoms, Pain, Function in daily living, Function/sports and recreational activities and Quality of Life.15–17
The secondary endpoints were (a) changes in the five subscores of the Foot and Ankle Outcome Score and Knee Injury and Osteoarthritis Outcome Score; (b) Muscle atrophy as assessed by measuring the leg circumference at 20 cm above and 10 cm below the knee joint line; (c) The range of motion in both flexion and extension of the ankle/knee and (d) Gait assessed using the Dynamic Gait Index. This test considers eight facets of gait: walking on a flat surface, walking at different speeds, walking while performing horizontal or vertical head turns, walking and turning 180° before stopping, stepping over or around obstacles and climbing stairs. Each of the test tasks is graded on a four-point scale from 0 (indicates the lowest level of function) – 3 (indicates the highest level of function), with a maximum total score of 24 indicating normal performance. 18
Follow-up interviews and examinations were performed at the following points in time: at baseline, before discharge from the hospital (range 1–17 days), and in the outpatient clinic approximately three weeks (range 14–23 days), six weeks (end of intervention, range 34–45 days), twelve weeks (range 76–96 days) and twelve months (range 322–396 days) after surgery.
Statistical analysis
Patients in the full analysis set were analysed following the intention-to-treat principle. Data were analysed separately for the two subgroups of injury where appropriate. A detailed description of the statistical analyses can be found in our report of the initial study results. 10
Patient measurements were described as the mean ± standard deviation, the minimum and maximum values for continuous data and scores data and absolute and relative frequencies for count data. The primary and main secondary endpoints were analysed using linear mixed models with random intercepts. This method has the advantage that it can be applied if values are missing. The mean differences in the endpoints at six weeks, twelve weeks and twelve months and the differences in their changes over time between the intervention and control groups with the 95% confidence intervals were estimated by contrasts. The Westfall method was used to correct for multiple testing. 19 The mean estimates with the 95% confidence intervals provided the basis for error bar plots showing the change in the total Foot and Ankle Outcome Score, the Knee Injury and Osteoarthritis Outcome Score and their subscores.
The data preparation and descriptive statistics were performed using IBM SPSS Statistics for Windows, version 26 (IBM Corp., Armonk, NY, USA) and linear models using R, version 4.0 (R Core Team (2013). R: A Language and Environment for Statistical Computing. R Foundation for Statistical Computing, Vienna, Austria, URL http://www.R-project.org/). The level of significance was set at P < 0.05 for two-tailed testing.
Results
The flow of patients through this study is shown in Figure 1. We randomised 73 patients into the intervention group (n = 37) and control group (n = 36). At the final follow-up 12 months after surgery, 53 of 73 patients (72.6%) could be analysed. The patient characteristics were balanced between the groups at the final follow-up (Table 1). In the study period between week 12 and 1 year, a total of three patients discontinued the study. During the study period presented here, between 12 weeks and 1 year, a total of three patients discontinued the study. One patient discontinued the study due to traveling too far to follow-up visits. Two other patients could not be reached for scheduling follow-up and were thus excluded.
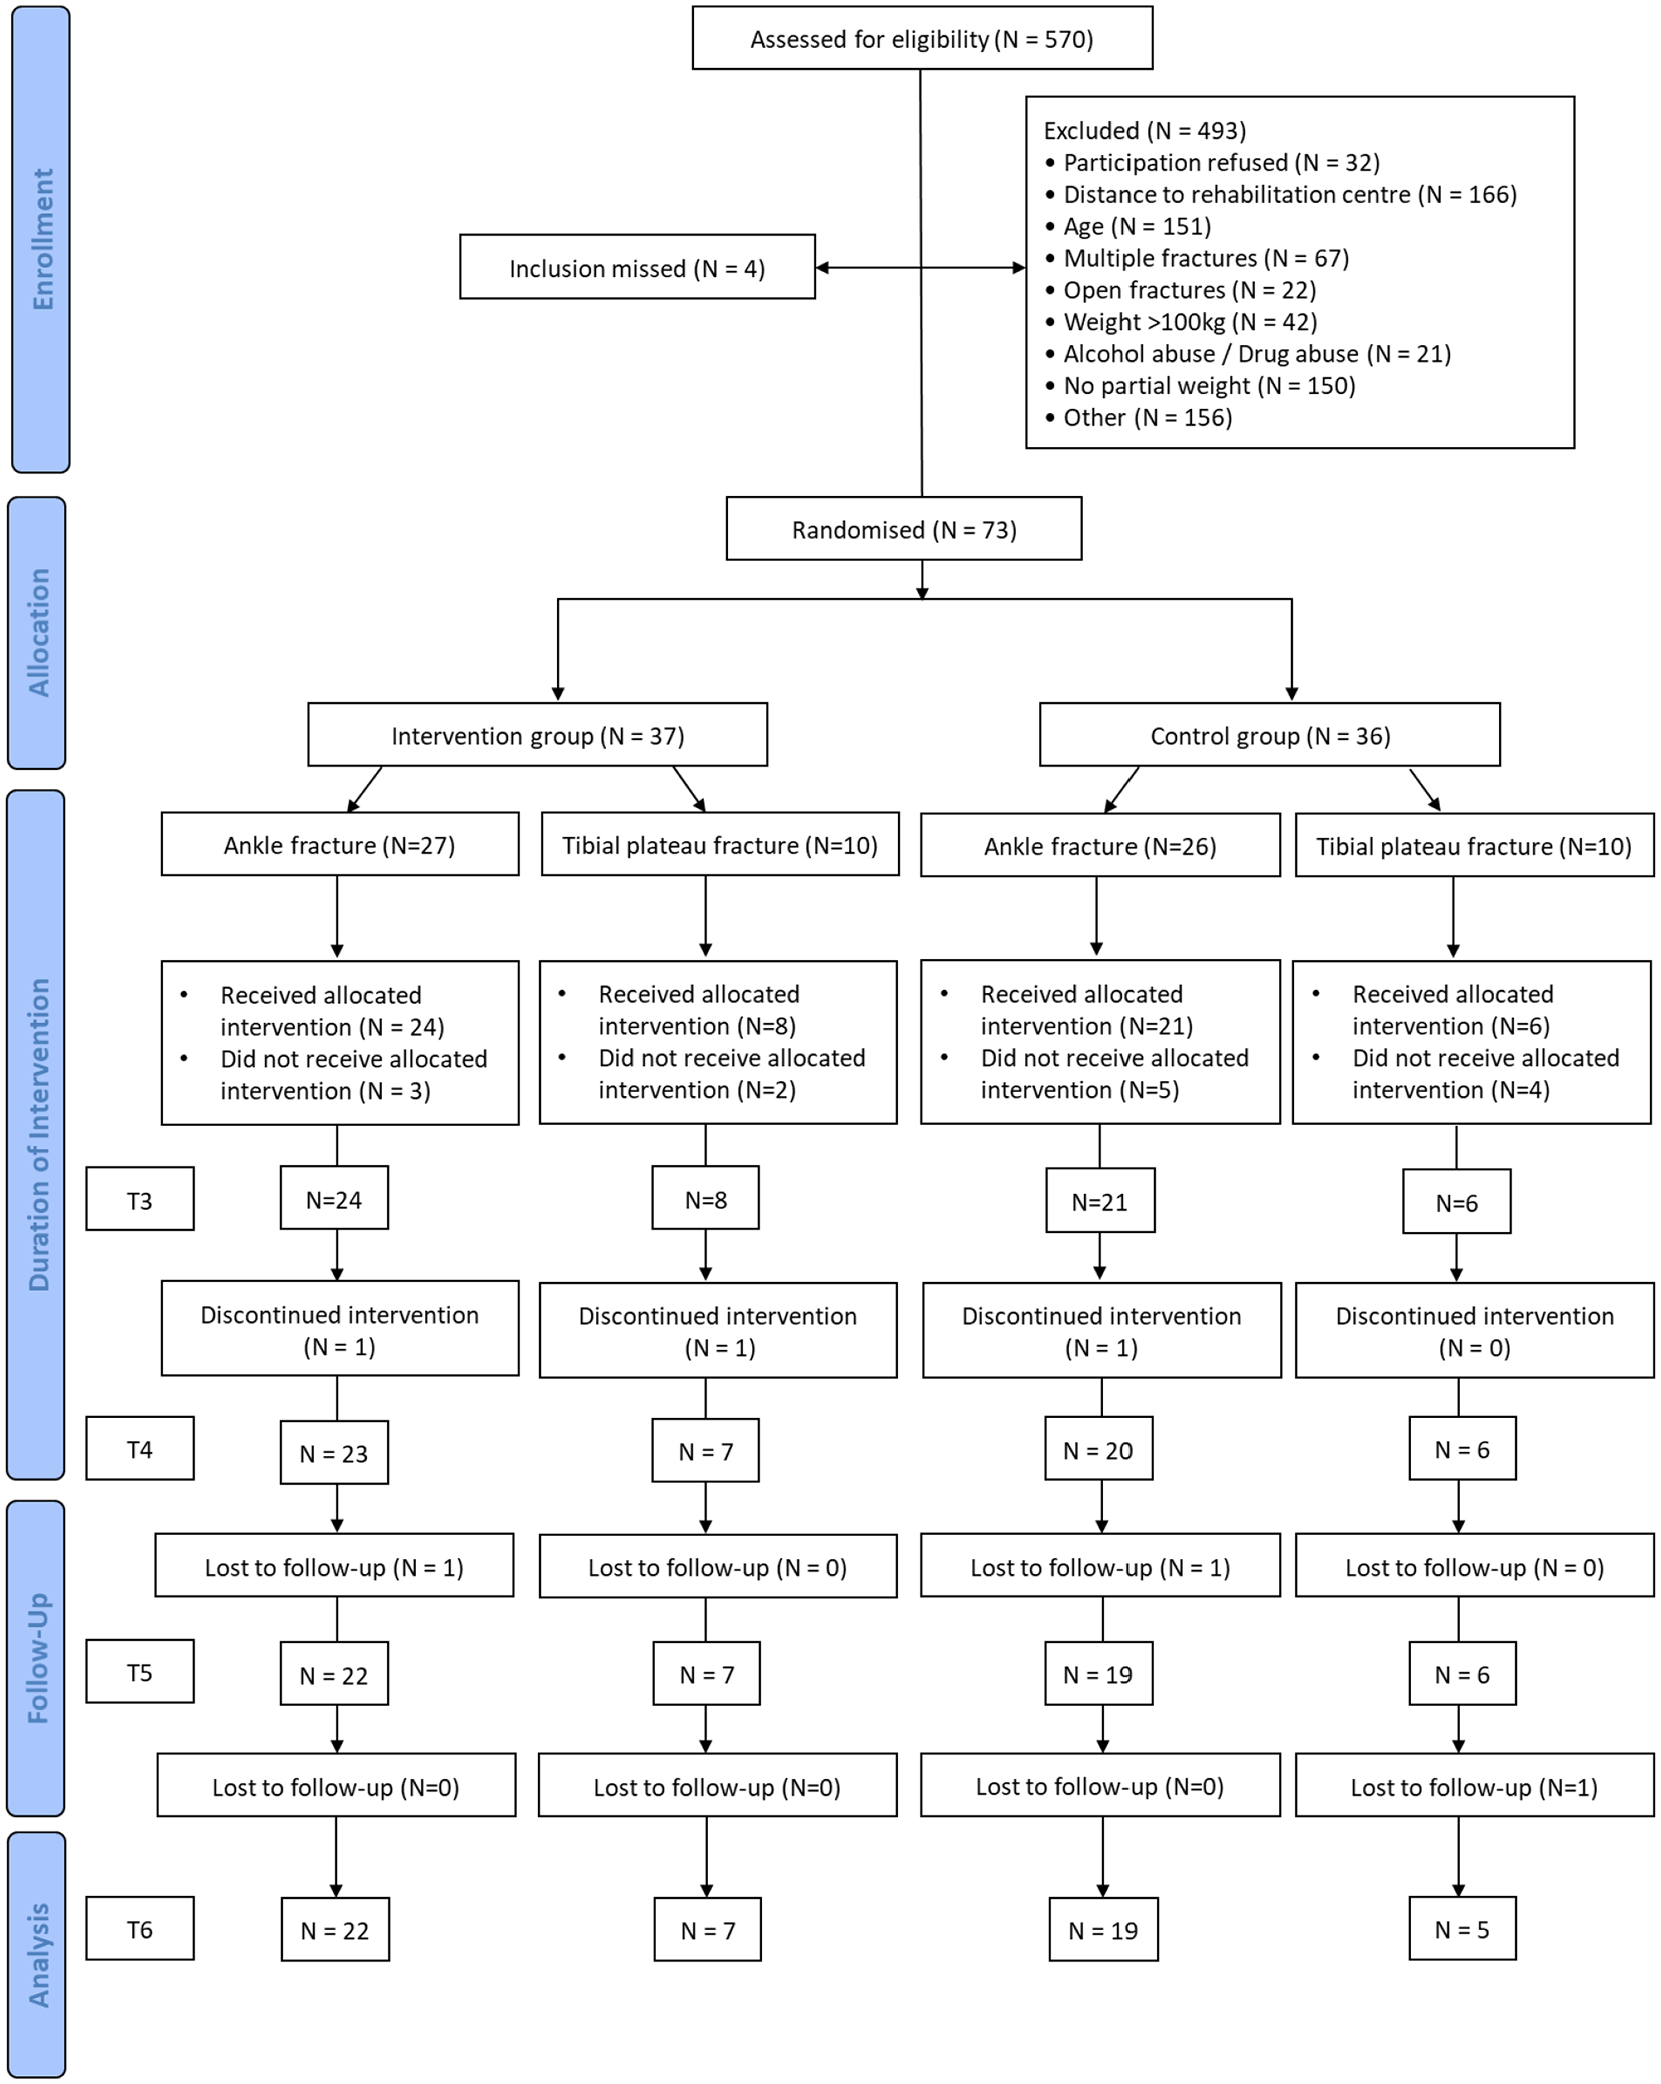
CONSORT flow diagram of the progress of patients (n = 570) with lower limb surgery who underwent either postoperative anti-gravity treadmill or standard rehabilitation through this study.
Demographic and clinical characteristics of patients (N = 53) who underwent either anti-gravity treadmill or standard rehabilitation postoperatively at the final follow-up 12 months after lower limb surgery.
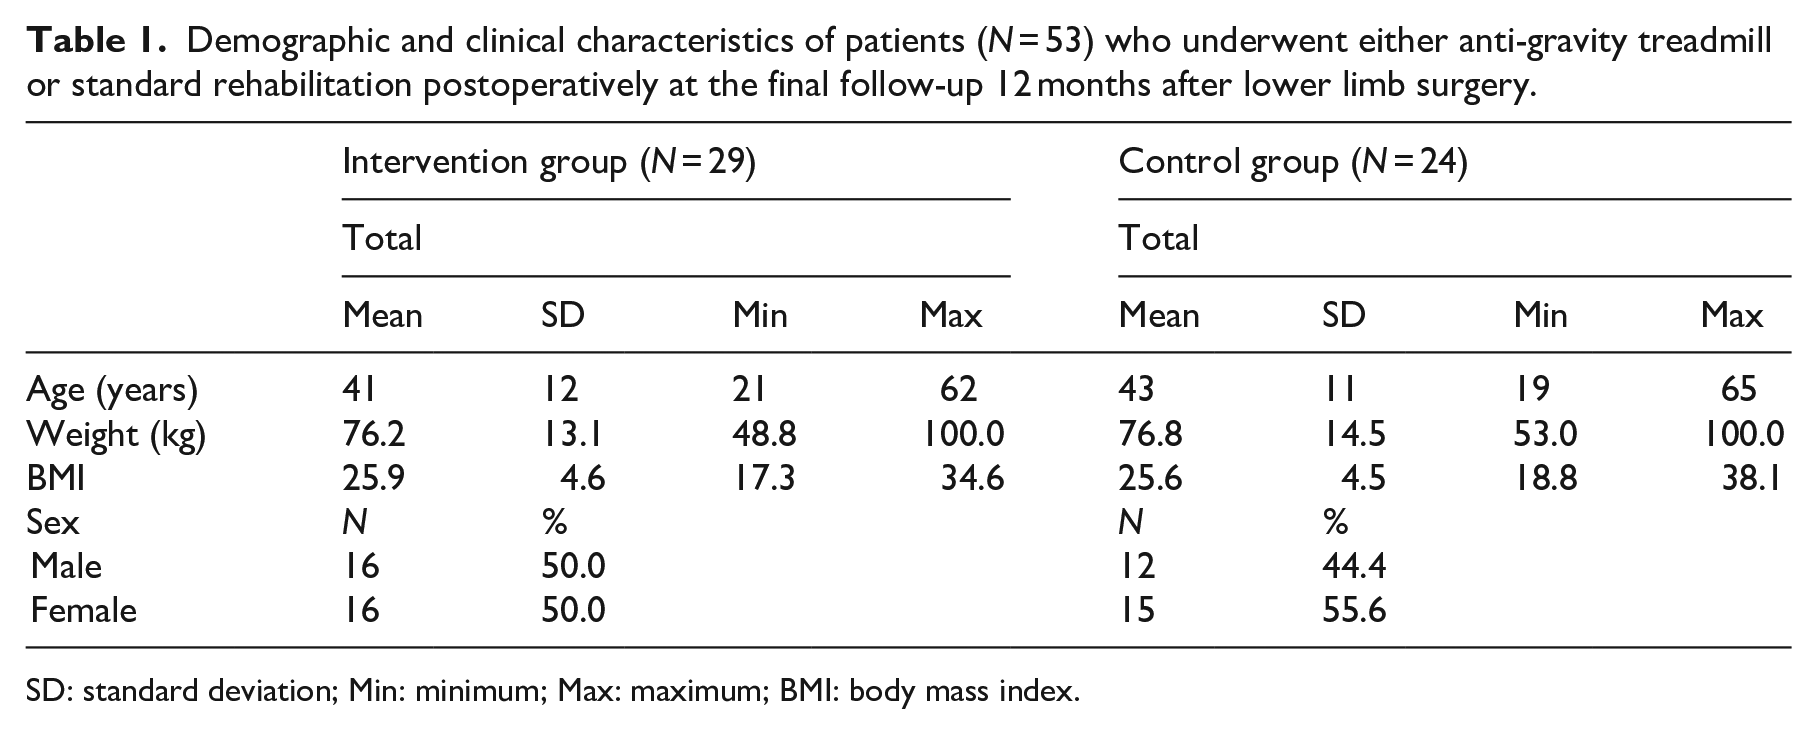
SD: standard deviation; Min: minimum; Max: maximum; BMI: body mass index.
The primary endpoints (total Foot and Ankle Outcome Score or Knee Injury and Osteoarthritis Outcome Score) showed statistically insignificant differences between the groups in the magnitude of changes at each point in time. Likewise, the changes in the subscores differed between the groups (Tables 2 and 3). However, we observed clinically relevant changes in the Knee Injury and Osteoarthritis Outcome Score subscales Symptoms (intervention group 86 ± 21 vs control group 77 ± 14) and Quality of Life (intervention group 71 ± 26 vs control group 59 ± 25) according to available minimal detectable changes values.17,20 Gait analysis using the Dynamic Gait Index showed a constant improvement over time in both groups. In both subgroups of patients with tibial plateau fractures and ankle fractures, there was a difference in the index between the intervention and control groups favouring the intervention (Table 4). The difference between the intervention group and control group was statistically significant in the overall population for the contrast from six weeks to twelve months.
Total Knee Injury and Osteoarthritis Outcome Score and subscale scores in patients (N = 14) with tibial plateau fractures who received either anti-gravity treadmill or standard rehabilitation postoperatively during one-year follow-up.
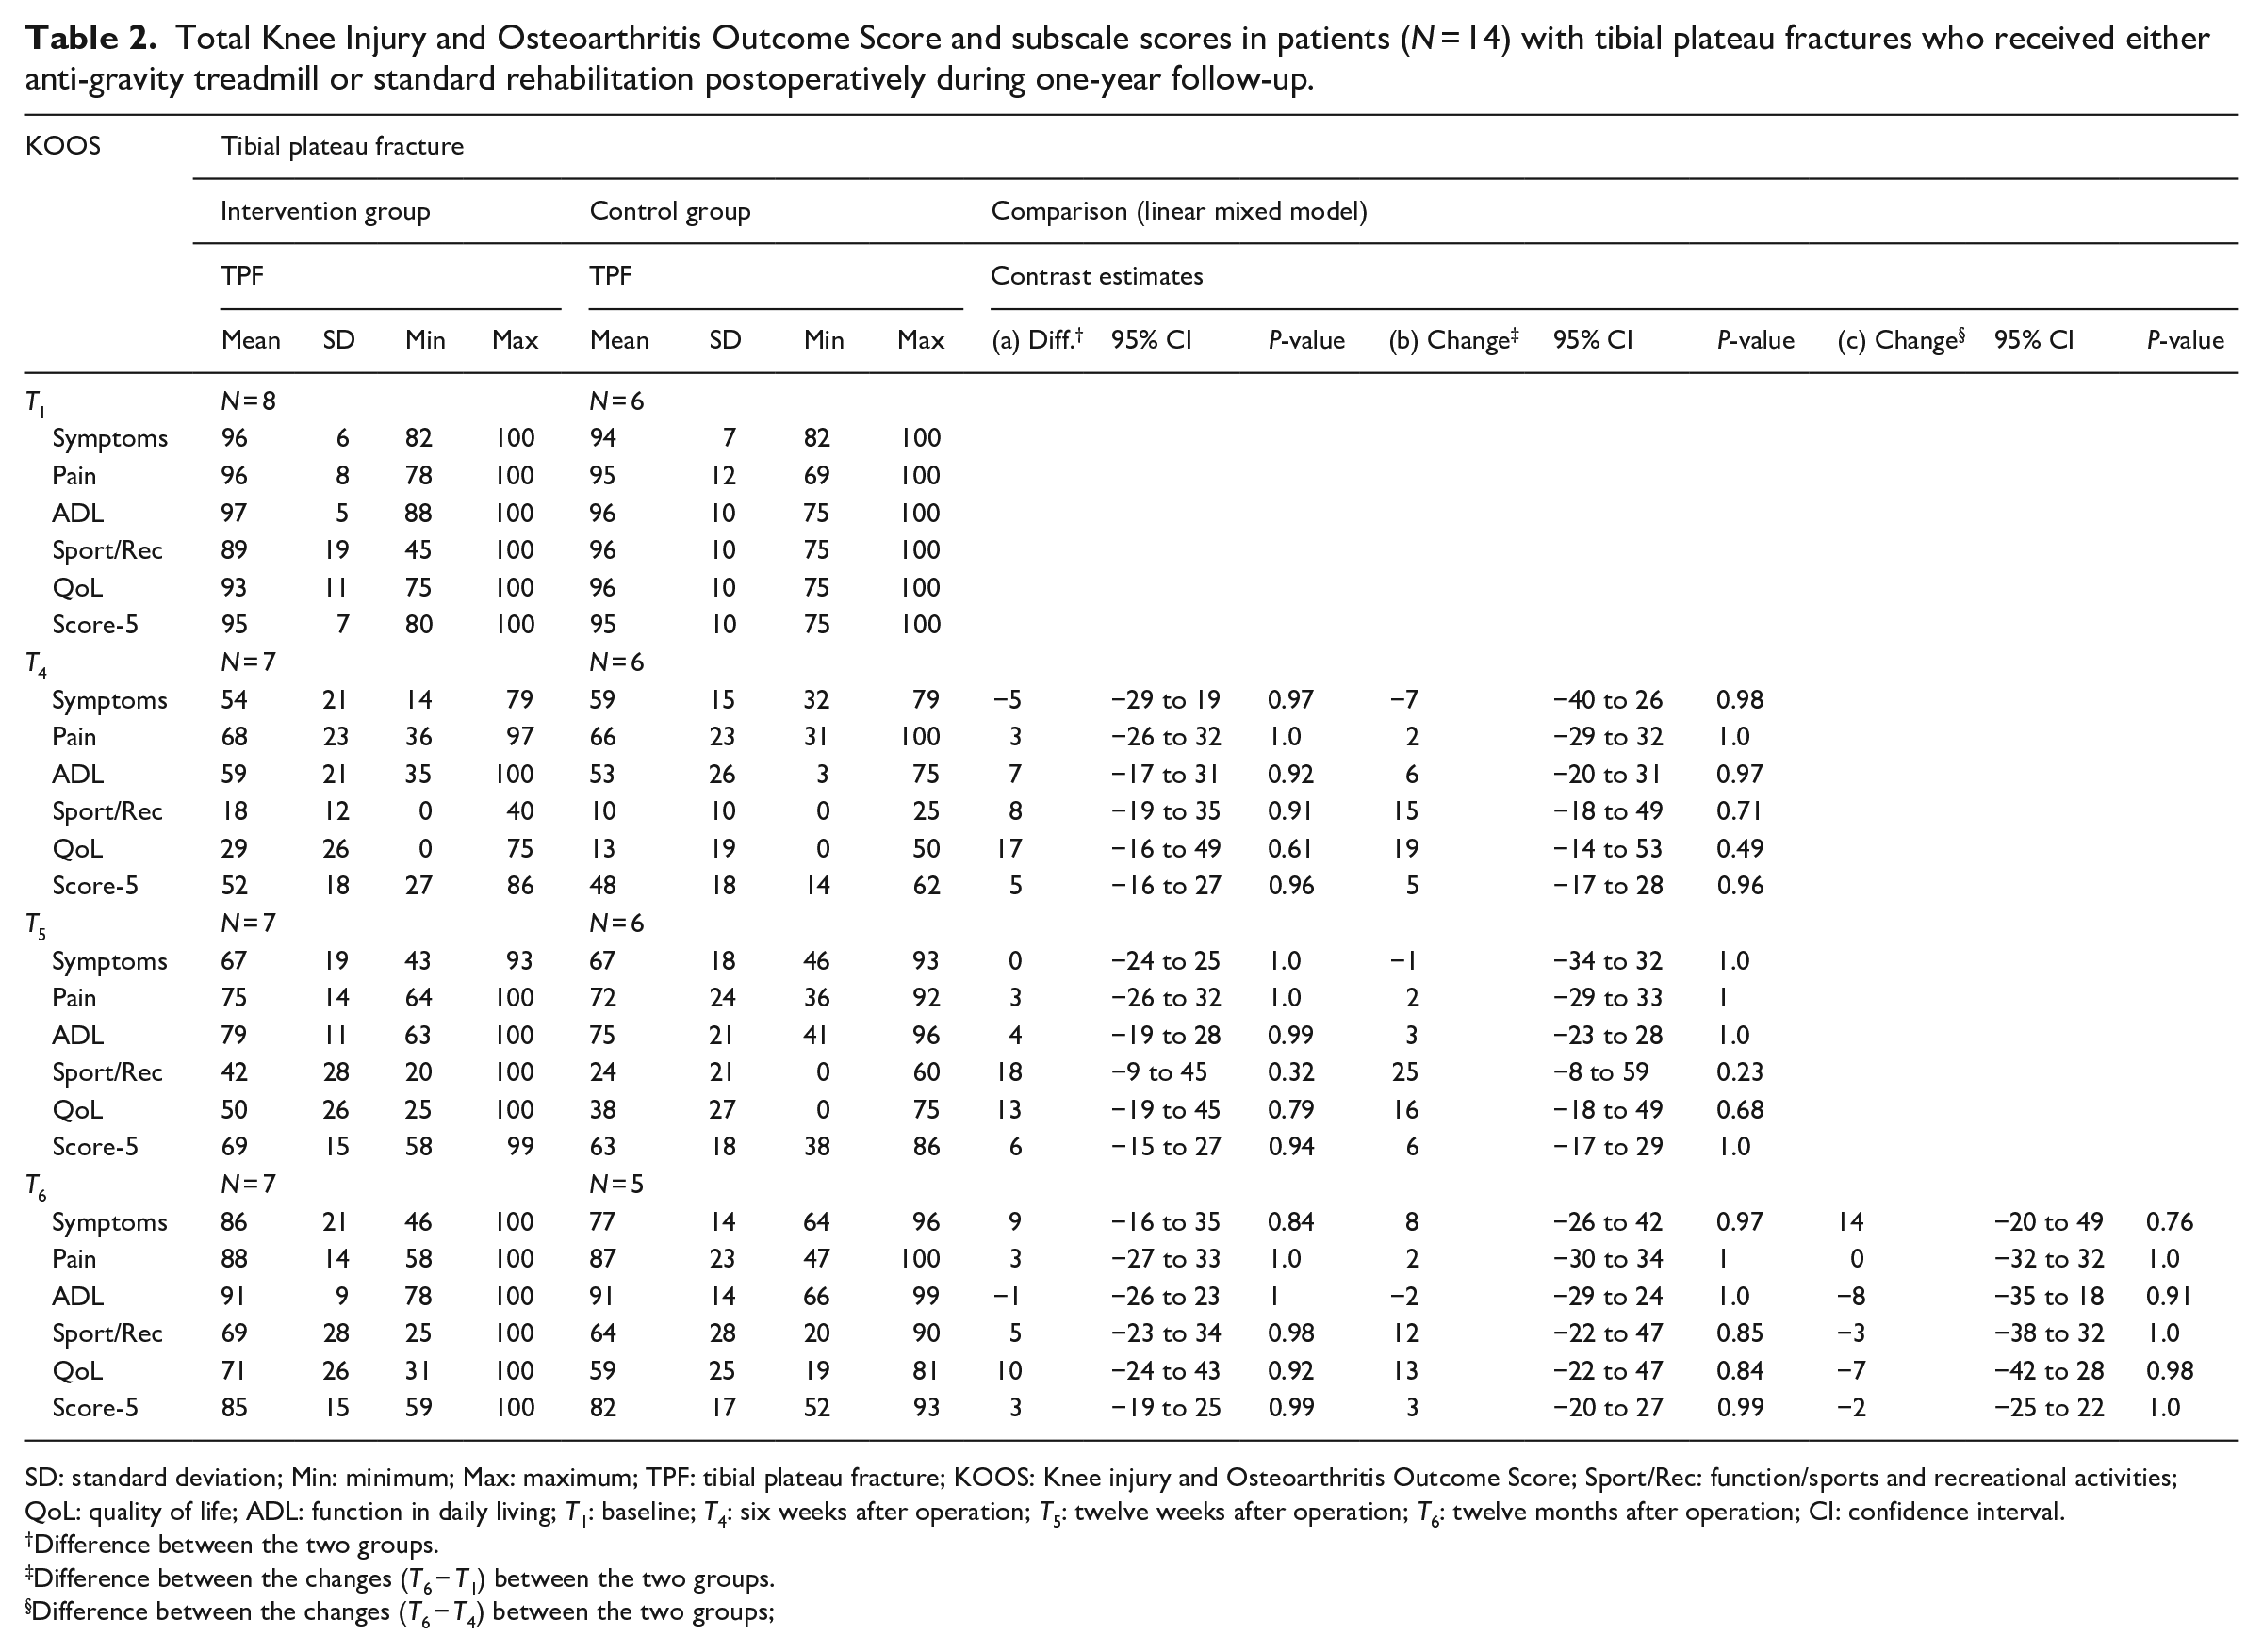
SD: standard deviation; Min: minimum; Max: maximum; TPF: tibial plateau fracture; KOOS: Knee injury and Osteoarthritis Outcome Score; Sport/Rec: function/sports and recreational activities; QoL: quality of life; ADL: function in daily living; T1: baseline; T4: six weeks after operation; T5: twelve weeks after operation; T6: twelve months after operation; CI: confidence interval.
Difference between the two groups.
Difference between the changes (T6 − T1) between the two groups.
Difference between the changes (T6 − T4) between the two groups;
Total Foot and Ankle Outcome Score and subscale scores in patients (N = 14) with ankle fractures who received either anti-gravity treadmill or standard rehabilitation postoperatively during one-year follow-up.
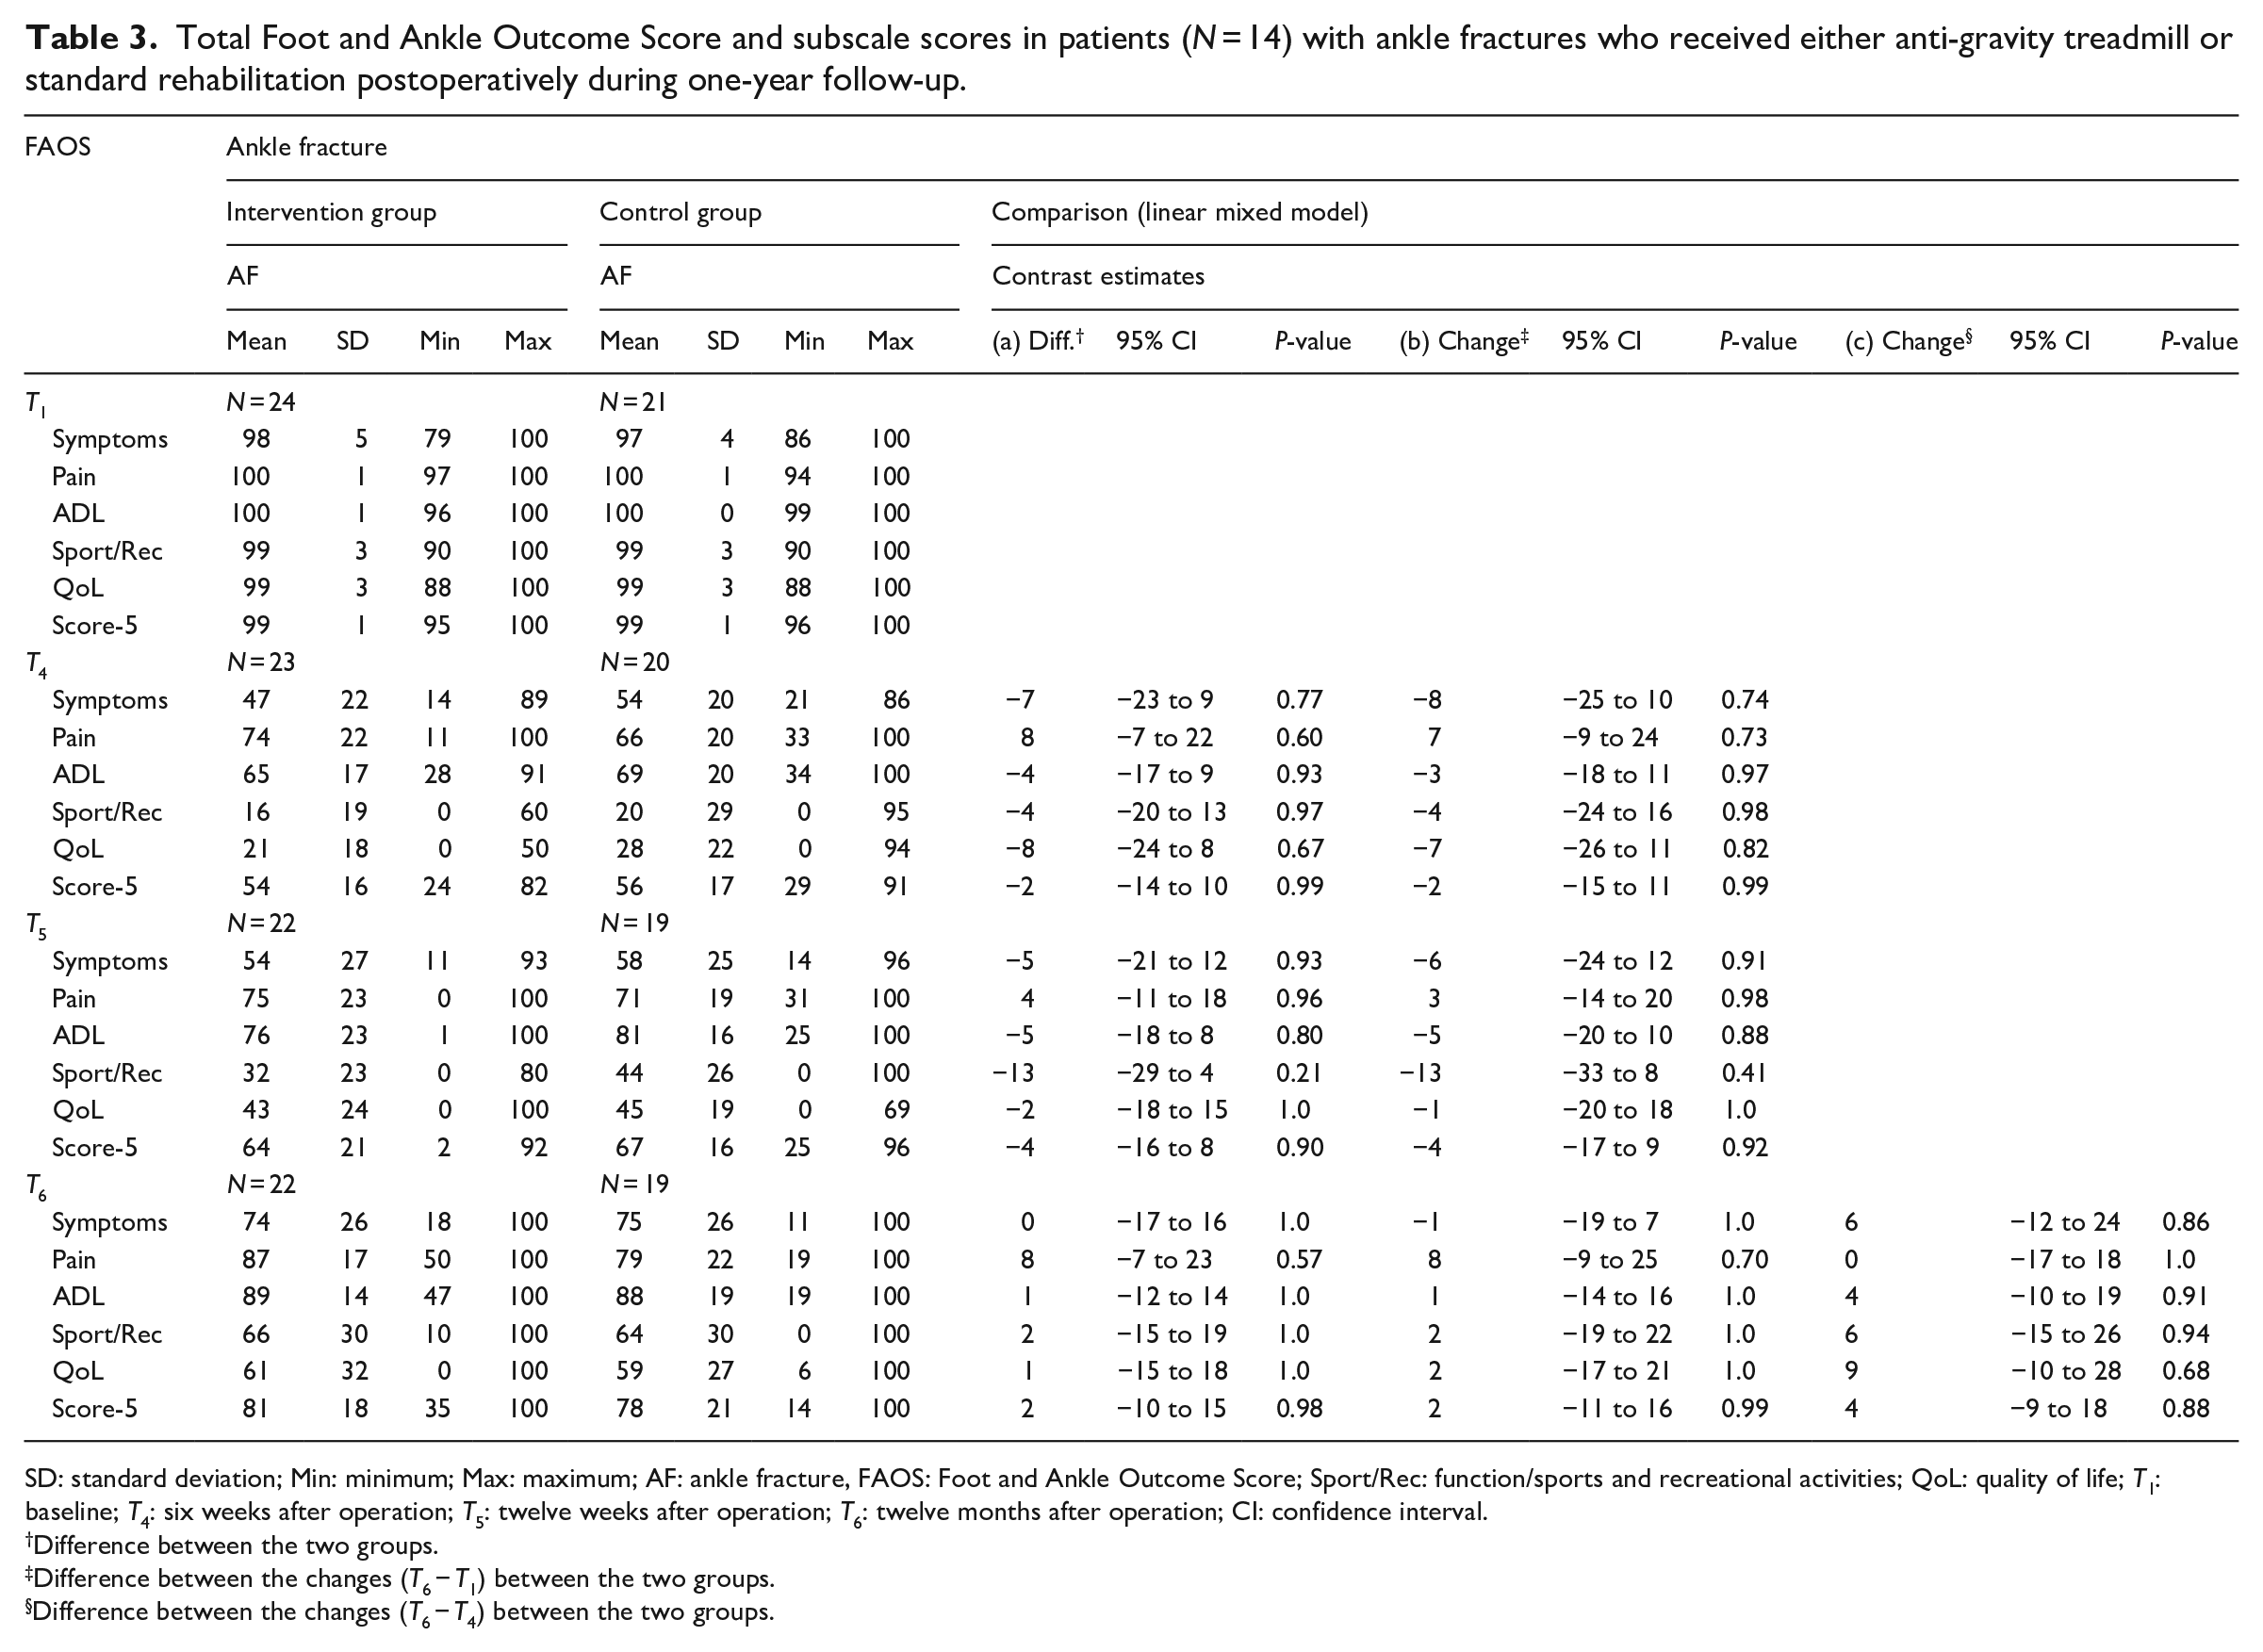
SD: standard deviation; Min: minimum; Max: maximum; AF: ankle fracture, FAOS: Foot and Ankle Outcome Score; Sport/Rec: function/sports and recreational activities; QoL: quality of life; T1: baseline; T4: six weeks after operation; T5: twelve weeks after operation; T6: twelve months after operation; CI: confidence interval.
Difference between the two groups.
Difference between the changes (T6 − T1) between the two groups.
Difference between the changes (T6 − T4) between the two groups.
Dynamic Gait Index before discharge from the hospital, at the end of the intervention and 12 weeks and 12 months postoperatively in patients (N = 53) with lower limb fractures who received either anti-gravity treadmill or standard rehabilitation postoperatively.
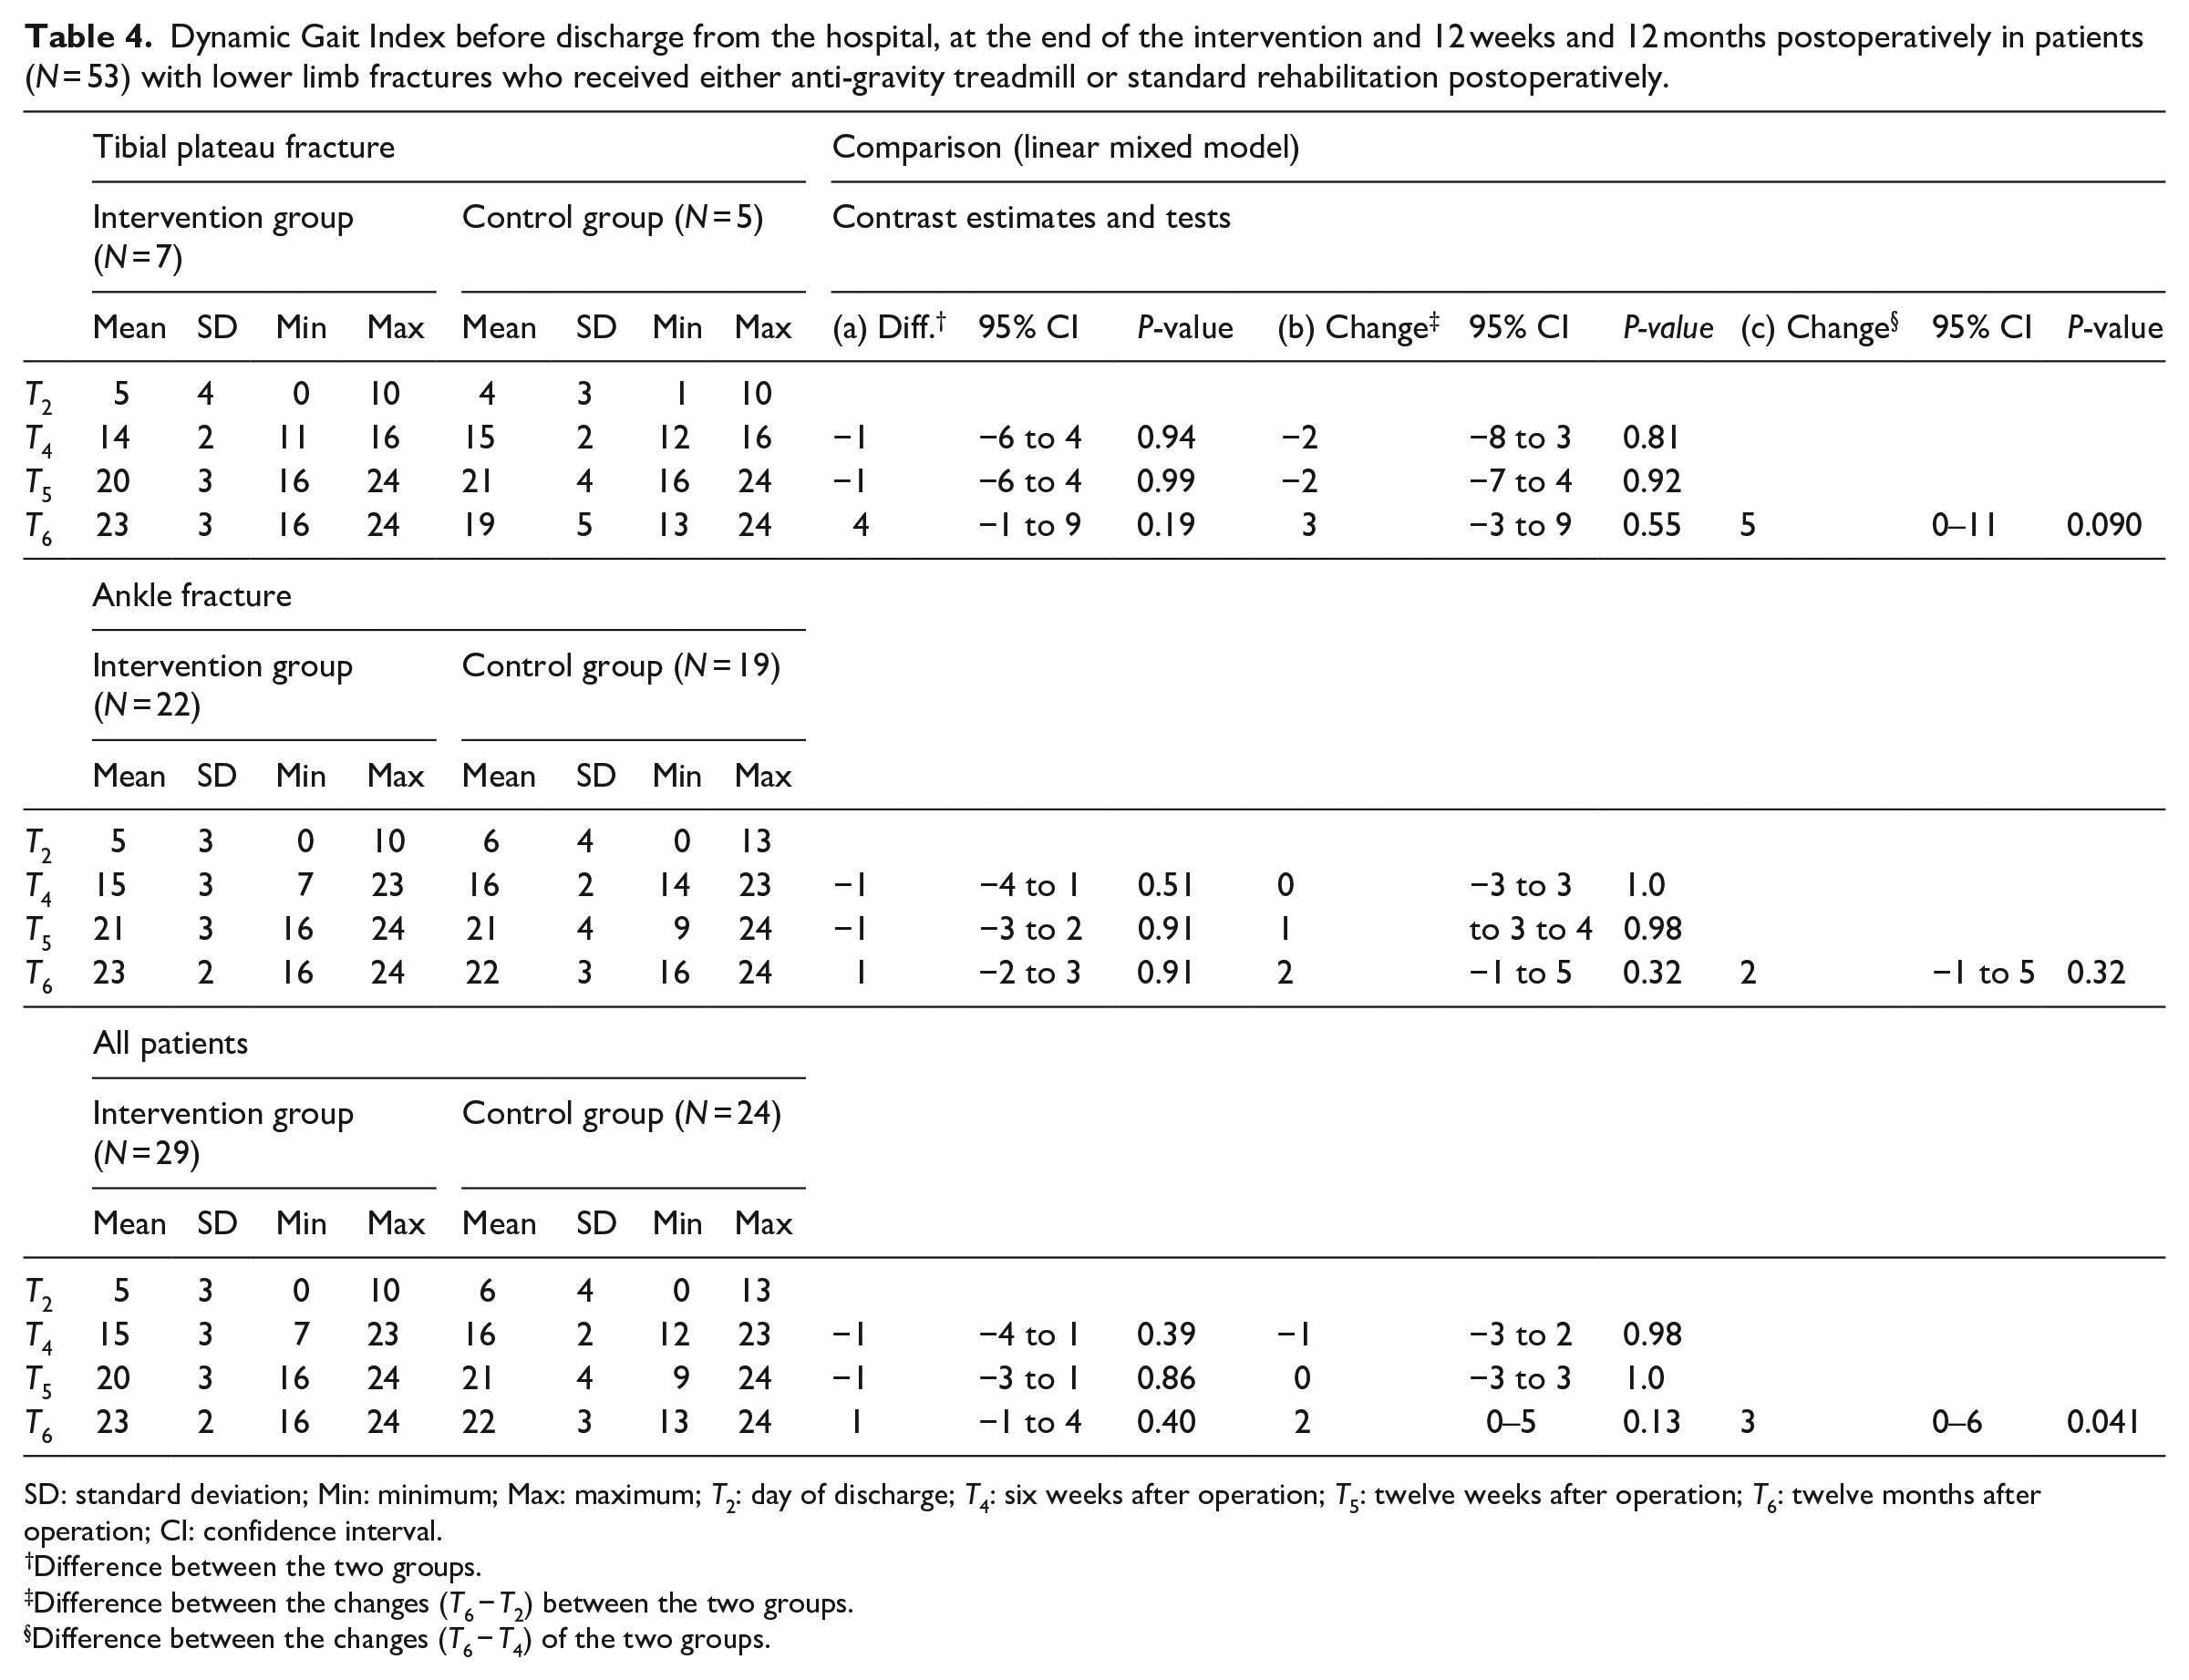
SD: standard deviation; Min: minimum; Max: maximum; T2: day of discharge; T4: six weeks after operation; T5: twelve weeks after operation; T6: twelve months after operation; CI: confidence interval.
Difference between the two groups.
Difference between the changes (T6 − T2) between the two groups.
Difference between the changes (T6 − T4) of the two groups.
For both patients with tibial plateau fracture and ankle fracture, there was an improvement in the range of motion from postoperative to 12 months with no statistically significant difference between the intervention group and control group between six weeks and twelve months (Supplemental Table 1).
Furthermore, the change in the circumference 10 cm below and 20 cm above the knee joint line from baseline to the final follow-up showed a difference of 3 cm (−0.2 to 6.3 cm, P = 0.08) and 3.1 cm (−1.3 to 7.6 cm, P = 0.28) between the intervention group and the control group for patients with tibial plateau fractures only (Table 5). The respective data of patients with ankle fractures and all patients can be found in the Supplemental Table 2 but showed no statistically significant difference.
Leg circumference measurements above and below the knee joint at different points in time in patients (N = 14) with tibial plateau fractures who received either anti-gravity treadmill or standard rehabilitation postoperatively.
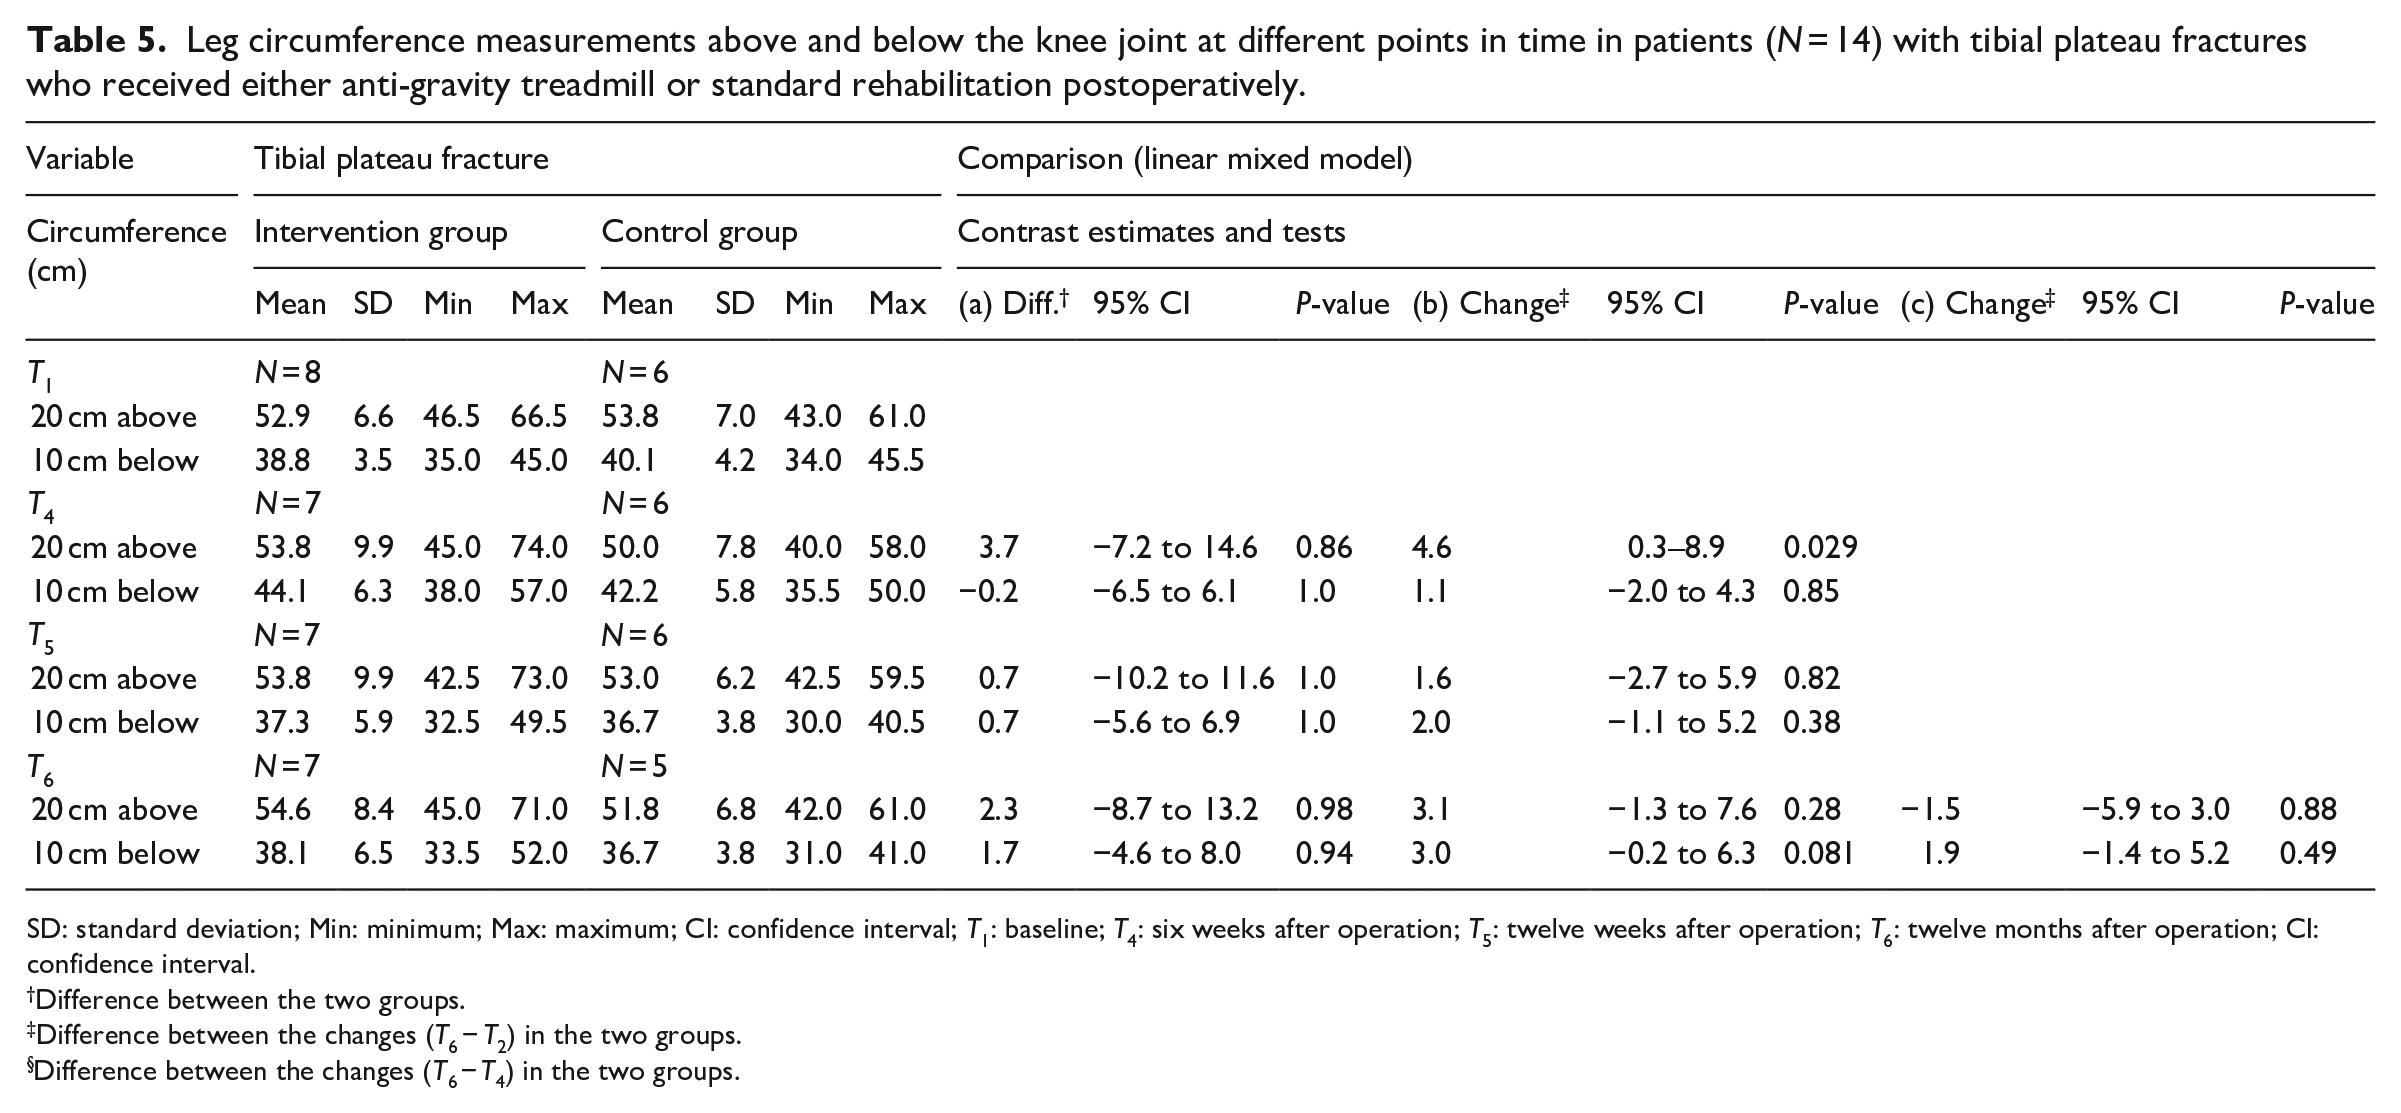
SD: standard deviation; Min: minimum; Max: maximum; CI: confidence interval; T1: baseline; T4: six weeks after operation; T5: twelve weeks after operation; T6: twelve months after operation; CI: confidence interval.
Difference between the two groups.
Difference between the changes (T6 − T2) in the two groups.
Difference between the changes (T6 − T4) in the two groups.
Between the end of the intervention and final follow-up, 50% in the intervention group and 48.1% in the control group had an additional inpatient or outpatient rehabilitation. In the tibial plateau fracture subgroup, the respective data in the intervention and control group were 50% and 66.7%, respectively, and in the subgroup with ankle fractures 50% and 42.9%, respectively.
In total, 74 adverse or serious adverse events had occurred by the end of the study in 41 patients (control group, 32 adverse events and 6 serious adverse events; intervention group, 33 adverse events and 3 serious adverse events). None of the events had a causal association with the intervention. A detailed description can be found in Supplemental Table 3.
Discussion
At the final follow-up 12 months postoperatively in this study, there was no significant difference in the primary endpoints total Foot and Ankle Outcome Score or Knee injury and Osteoarthritis Outcome Score and the secondary endpoints Foot and Ankle Outcome Score or Knee Injury and Osteoarthritis Outcome Score subscores between the intervention and the control group.
In patients with tibial plateau fractures, there was a better outcome in the intervention group compared to the control group in terms of Symptoms (8 ± 21 vs. 77 ± 14) and Quality of Life (71 ± 15 vs. 59 ± 25). This outcome is clinically relevant in terms of the available and validated minimal detectable changes of the subscores Symptoms (5–8 points) and Quality of Life (7 points). 20 However, this finding was not statistically significant because of the wide range of data and small sample size. Compared to other studies that investigated tibial plateau fractures using the Knee Injury and Osteoarthritis Outcome Score, our patient population had markedly better results overall after 12 months. Elsoe et al. reported an overall score of 56.6 (95% CI: 50.5–62.6) after 12 months, and Evangelopoulos et al. 21 reported Symptoms score of 62.3 ± 9.8 and Quality of Life score of 79.5 ± 21.4 with an overall score of 76.5 after 56 months of follow-up.
In terms of the results for the Foot and Ankle Outcome Score, there was no difference compared to other studies.22,23
As already reported, in patients with tibial plateau fractures, the change in the leg circumference 20 cm above the knee joint from baseline to the end of the intervention after six weeks differed significantly by 4.6 cm (P = 0.029). 10 This difference was still present after 12 months but to a lesser degree (3.1 cm; 95% CI 1.3–7.6 cm; P = 0.081). Furthermore, a difference in the change between baseline and the final follow-up was found for the leg circumference 10 cm below the knee joint (3.0 cm; 95% CI 0.2–6.3 cm; P = 0.28).
The relationship between muscular atrophy and the duration of immobilisation is an important consideration in the postoperative rehabilitation of patients. It has been shown that the loss of muscle mass increases exponentially with the duration of the immobilisation. 24 Maximal contractile muscle strength starts to decline after four days, independently of age.5,25–29 A similar muscle reduction over time, as we described for the musculature of the thigh, was also defined by Stevens et al. 8 on the calf. Their study further revealed that a muscle deficit of 20% after 10 weeks of specific rehabilitation under full weight bearing was still evident.
As a possible consequence of the continued muscle loss and the resulting lack of strength, comparison of the intervention group and control group showed a significant difference in their gait between the beginning and the end of the one-year follow-up, which was evaluated with the Dynamic Gait Index. The applicability of this index to assessing the gait in patients of different age and gender was investigated in a large adult collective by Vereeck et al. 30
Furthermore, we evaluated the Dynamic Gait Index in a pilot study in conservatively treated patients with pelvic fractures, and found that an improvement of the index was analogous to better gait, measured with standardised gait analysis. 31 Iliopoulos et al. 32 showed that, while the gait pattern of a leg with tibial plateau fracture seems to return to that of the uninjured extremity over a period of six months, closer examination demonstrates that the terminal stance phase, during which the quadriceps muscle has a leading function, remains impaired. Further studies with a longer follow-up period of up to three years confirmed that the recovery of a normal gait pattern is a prolonged and demanding process.12,13 In this study, the patients in the intervention group achieved an average score after 12 months that was equivalent to normal gait according to the established values, whereas in the overall control group, patients differed by one point (23 ± 2 vs. 22 ± 3) and patients with tibial plateau fractures by four points (23 ± 3 vs 19 ± 5). However, the patients in the intervention group were shown to benefit significantly from the intervention in the post-intervention period up to final follow-up compared with the control group.
A possible influencing factor in this context is a deficit in the range of motion. We found no differences in the range of motion between the intervention and control groups overall and between the ankle and tibial plateau fracture subgroups, our results are in line with other studies that reported the range of motion of the ankle and knee.32–36
Our findings should be interpreted within the limitations of this study. The main limitation was the significant proportion of patients who dropped out. This resulted in a relatively small number of patients in the subgroups.
In summary, patients benefit from a postoperative rehabilitation programme with an anti-gravity treadmill. This is evident in the results after 12 months in the leg circumference measurement and the gait analysis as well as in the subscores Symptoms and Quality of Life of the Knee Injury and Osteoarhritis Outcome Score.
Clinical messages
Patients with tibial plateau fractures benefitted more from anti-gravity treadmill rehabilitation than patients with ankle fractures.
Patients who had undergone postoperative anti-gravity treadmill rehabilitation had lesser Symptoms and higher Quality of Life and a significantly better gait with lesser muscle atrophy of the leg than those on standard rehabilitation.
Supplemental Material
sj-pdf-1-cre-10.1177_02692155211037148 – Supplemental material for Anti-gravity treadmill rehabilitation improves gait and muscle atrophy in patients with surgically treated ankle and tibial plateau fractures after one year: A randomised clinical trial
Supplemental material, sj-pdf-1-cre-10.1177_02692155211037148 for Anti-gravity treadmill rehabilitation improves gait and muscle atrophy in patients with surgically treated ankle and tibial plateau fractures after one year: A randomised clinical trial by Lisa Palke, Sebastian Schneider, Bernhard Karich, Meinhard Mende, Christoph Josten, Jörg Böhme and Ralf Henkelmann in Clinical Rehabilitation
Footnotes
Acknowledgements
We would like to thank Dr. Brosteanu (Centre for Clinical Trials) for the initial advice on study planning and Ms. Eike Hänsel for her work as a study assistant.
Author contributions
Ralf Henkelmann and Lisa Palke were responsible for data acquisition, data control, study supervision and writing of the manuscript draft. Sebastian Schneider and Bernhard Karich performed the data control and monitored the intervention to detect possible adverse events. Meinhard Mende performed data curation, formal analysis, validation and visualisation of the study data, as well as critically revised the manuscript. Christoph Josten, Jörg Böhme and Ralf Henkelmann were responsible for the development of the study design, study financing and project coordination. Christoph Josten and Jörg Böhme critically revised the manuscript for important intellectual content. All the authors have approved the final version of the manuscript to be submitted.
Declaration of conflicting interests
The author(s) declared no potential conflicts of interest with respect to the research, authorship, and/or publication of this article.
Funding
The author(s) disclosed receipt of the following financial support for the research, authorship, and/or publication of this article: The project was supported by the Deutsche Gesetzliche Unfallversicherung (FR 244) and the Ambulante Reha Zentren, Germany. The responsibility for the content of the studies remained with the authors. The financing of the studies was approved after a peer-review procedure by the Deutsche Gesetzliche Unfallversicherung. For this purpose, the study design was prepared in coordination with the Centre for Clinical Trials, including the biometrics. The study was conducted by the study leaders and study nurses. The data analysis was carried out together with the biometrician. Details can be found in the author contributions section.
Supplemental material
Supplemental material for this article is available online.
References
Supplementary Material
Please find the following supplemental material available below.
For Open Access articles published under a Creative Commons License, all supplemental material carries the same license as the article it is associated with.
For non-Open Access articles published, all supplemental material carries a non-exclusive license, and permission requests for re-use of supplemental material or any part of supplemental material shall be sent directly to the copyright owner as specified in the copyright notice associated with the article.