
Abstract
The Nelson Mandela Bay Metropolitan Municipality is situated on the Eastern Coastline of South Africa. The metropolitan itself has the potential for major local and regional economic growth but has experienced significantly low growth over the past few years. Internal constraints that the province faces include high production costs, limited economic development and support, deteriorating infrastructure and limited financial resources. To assess the local economy of the Nelson Mandela Bay Metropolitan Municipality, the methodological techniques used include the location quotient and shift-share analysis. The empirical analysis showed that the municipality is highly specialised in industries such as agriculture, forestry and fishing, and transport equipment. The evaluation of the top five industries revealed that business services, wholesale and retail trade, transport and storage, catering and accommodation, and social and personal services have the highest growth potential and may contribute to future development initiatives. Efforts to stimulate industrial growth include the promotion of tourism, increasing the market share of wholesale and retail trade, establishing an integrated approach to the services industry, and finally, expanding the market share of the transport and storage industry.
JEL Classification
R10, R15, L60, O18
Introduction
The article aims to evaluate the competitiveness and potential of industries in the Nelson Mandela Bay Metropolitan Municipality (now onward referred to Nelson Mandela Bay Metro) in South Africa. Situated in the Eastern Cape Province, the Metro hosts the COEGA IDZ which is the largest IDZ in the African continent. The article analyses the competitiveness, economic growth, specialisation and employment growth of the industrial development zones (IDZs) of this region, which are purpose-built industrial estates linked to the international seaport or airport (Industrial Financing, 2020).
According to the Eastern Cape Socio-Economic Consultative Council (ECSECC, 2020: 4), the tertiary sector of the Eastern Cape economy is among the largest in the country. However, despite this, economic growth in the province lags behind the national average. Factors contributing to this include high production costs, limited economic development and support, deteriorating infrastructure, limited financial resources and a restricted enabling environment, as noted by Mishi et al. (2022: 4). The article argues that policymakers, local government, investors and the people within the communities can gain valuable insights from these industries, which may provide much development and growth within the region (Niyimbanira, 2018: 96).
The article examines the competitiveness of the industries within the Nelson Mandela Bay Metro using location quotients and shift-share analysis to measure the relative economic growth of industries in the region compared to national trends and to determine the level of diversification within the industry (Quintero, 2007: 1). Industry analysis plays an essential role in market assessment and helps policymakers and businesses to apprehend the market conditions and make decisive decisions that help to estimate demand and supply as well as future decisions for the business in general (Czaplicka-Kolarz et al., 2020: 63). Utilising these measurement techniques will enable policymakers to make informed decisions about the development of existing industries while also being used as a proxy method to assess other regions that need regional evaluation. The section provides a review of existing literature, applicable models, theories and approaches. This is followed by a discussion of the region under study. The section to follow presents the empirical results of the analysis, followed by a discussion of the results. The last section concludes the article and provides some recommendations for the region to obtain significant industrial growth and an increased share in the national economy.
Literature review
The literature review aims to provide a theoretical foundation for regional economic development, exploring the historical perspectives of theories that explain the concept and role of local growth and development. This will lead to a better understanding of models and theories that help to interpret regional economic growth. In order to describe how regions, strengthen and grow, it is essential to consider various theories, such as the cumulative causation model and the comparative advantage approach. Additionally, this literature review will provide a summary of previous empirical studies on regional economic analysis and assessments.
The cumulative causation model
The cumulative causation model aims to articulate the static and dynamic economies of scale, also known as increasing returns. This theory is universally used to articulate the potential role that industries play within specific regions and its focus on demand-side economics (Araujo, 2013: 131). The cumulative causation model plays a major role in increasing returns through the division of labour and specialisation (Setterfield, 2001).
The cumulative causation model was first justified by the Swedish economist Gunner Myrdal who stated that the economy tends to deviate from the traditional thoughts and focused more on the endogenous economic development theory rather than the exogenous effects (Fujita, 2007: 276). The cumulative causation can either be negative causing poverty traps, or positive, benefiting new Special Economic Zones (SEZs) within a specific region.
The establishment of a new industry will lead to countless benefits such as job creation and significant purchasing power, while also increasing capital, which will lead to a higher population rate. When a new industry is established, it will likely create jobs in the region. This means that more people will be employed and paying income tax. There could also be increased sales tax revenue and corporate tax revenue, which will increase the overall tax revenue for the government. This can then be used by the government to invest in infrastructure development, social welfare programs, and other public goods and services (Bartolini et al., 2016). The new industry or SEZ within the Nelson Mandela Bay Metro enables a new growth pole and leads to more innovation within the specific sector, which in turn, attracts similar industries.
Comparative advantage approach
The comparative advantage of a region can be defined as the potential of a demographic area to produce products more effectively and efficiently, with the least opportunity costs, suggesting these areas have a comparative advantage over a certain product in comparison with other regions that produce similar products (Todaro and Smith, 2011: 575; Smit, 2010: 109).
Comparative advantages play an essential role in countries or international trade. Comparative advantages are also necessary for the development of specific regions. The level of comparative advantage is influenced by a region’s physical distinctiveness (Knight et al., 2020: 591). Even though physical distinctiveness is important, several other factors influence a region’s competitiveness, such as infrastructure inducement of new organisations, policies situated within the region, as well as overall market size (Knight et al., 2020: 591).
As South Africa has a moderate number of SEZs including the Altantis IDZ, Richards Bay IDZ, Saldanha Bay IDZ and Dube Trade Port, it is important to have a comparative advantage approach whereby firms can produce goods at a competitive level within these IDZs. Manufacturing has a significant impact on employment and economic growth within the country, and policymakers need to improve manufacturing processes through investment in SEZs to create technological enhancements, and human capital and achieve significant returns to scale (Signé, 2018: 2).
Similar studies on regional development analysis
Other studies examining regional competitiveness and economic development are explored in this section, with a focus on the methodological approaches used and any shortcomings of those studies. It is important to evaluate these studies within the context of regional analysis and, specifically, with regard to the shift-share analysis in order to distinguish between other studies and the current one. By doing so, we can better understand the contributions of previous studies and the unique aspects of this study.
Niyimbanira (2018) studied the comparative advantage and competitiveness of the main industries in four provinces of the north-eastern region of South Africa. The study made use of location quotients and shift-share techniques for 5 years. A shortcoming of this study was that it did not focus on a specific region of the country; however, it focused on various provinces within the boundaries of South Africa. The study also did not focus on the various region’s strengths and weaknesses. The results were therefore challenging, especially for policymakers.
Quintero (2007) analysed regional economic development with an economic base study and shift-share analysis of Hays County, Texas. The study adopted the shift-share analysis to the West Virginian economy situated in the central-eastern mainland of America. The study applied employment data from 1970 to 2007. The findings denoted that the real estate, financial and services industries supply more than 90% of the total employment growth of the region. Shortcomings of the study were that it only employed data from 1970 to 2007. The data period is more than 37 years, which indicates that the authors did not employ an analysis of industries in recent times, but rather a time series analysis of the industries evaluated. The examples given in this section indicate that there exists an important gap in the literature that the present study wishes to address.
Methodology
This section explains the techniques used in the current study to determine the strengths and weaknesses of the industries within the Nelson Mandela Bay Metro. The first sub-section explains the research design that illustrates the specialisation of the industries in terms of the employment percentage within the region as compared to the employment statistics of South Africa and includes an analysis of the location quotient and conducts a shift-share analysis. The next sub-section indicates the study area and sample size of the data utilised, while the last sub-section indicates the data collection method.
Research design
The research design indicates the different types of methods utilised to evaluate the regional economic development methods for the Nelson Mandela Bay Metro.
The location quotient
The location quotient indicator evaluates the strength of an industry in a region. It is utilised to evaluate the employment performance per sector in this particular study. This indicator presents the chance to subordinate industries that fluctuate in scale since the estimation utilises the employment segments on the national as base weight to calculate regional estimates, and therefore the location quotient for region i can be presented as follows (Strotebeck, 2010: 20):
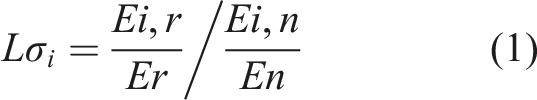
Where
The assessment criteria of the location quotient are as follows: • If the LQ is larger than 1, it means that the sector in the municipality has a higher degree of specialisation level than that of the region (province). • If LQ equals 1, the magnitude of specialisation of the region equals that of the overall region (province). • If LQ is smaller than 1, the sector has a lower degree of specialisation level than that of the encompassing region (province).
Location quotient and its implication.
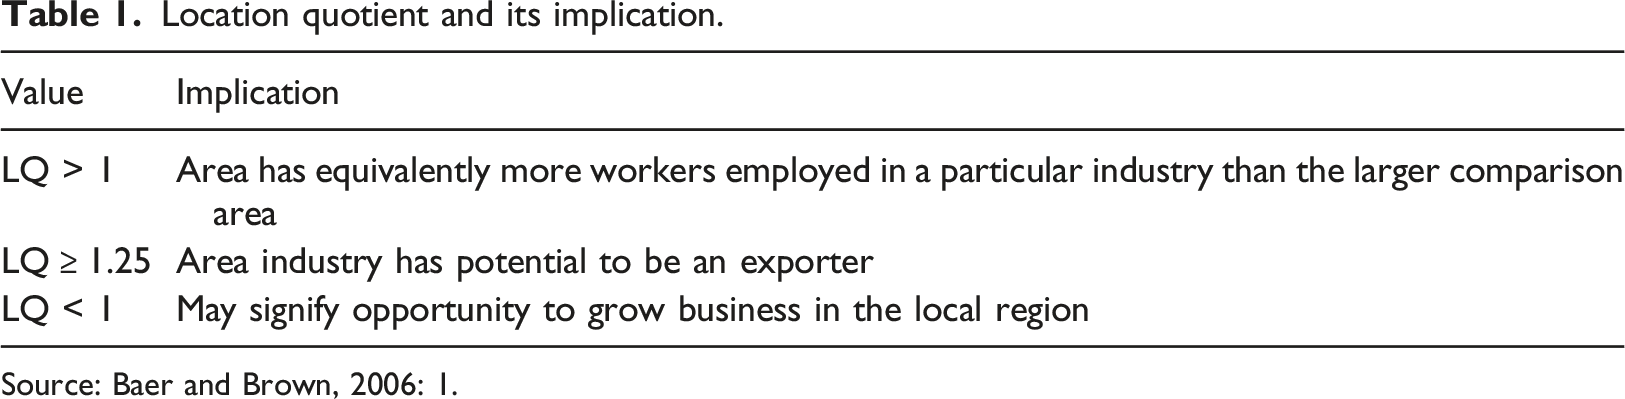
Source: Baer and Brown, 2006: 1.
The objective to utilise the location quotient as a tool for baseline analysis within the Eastern Cape is to ensure which sectors have a relatively higher competitive advantage in comparison with the other sectors of the economy. The location quotient utilised in the study can be illustrated as follows:
The location quotient for the Nelson Mandela Bay Metro (NMB) of the Eastern Cape Province (EC) can be illustrated in equation (2):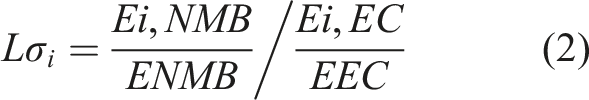
where NMB is similar to r and EC to n in equation (1).
The shift-share analysis
The second measurement tool of regional analysis utilised is the shift-share analysis, which analyses the influences of the economical, fundamental and operational elements of the growth rates in the region (Khusaini, 2015: 741).
Shift-share analysis is a prominent indicator since the data is reasonably easy to obtain, yet offers policymakers, economic development practitioners, researchers and academics constructive information (Sirakaya et al., 1995: 55). Employment and income figures are used to calculate economic development statistics, and employment data is usually available and easy to apply (Kleynhans and Sekhobela, 2008). Employment data is therefore used in the present study.
Equation (3) represents the calculation for the national share, equation (4) indicates the industrial mix equation, and lastly, equation (5) represents the regional share analysis. The numerical value of these three equations can be used to determine the effect of each component on regional economic growth.
The shift-share analyses can be presented as follows:
When


The alteration of employment figures within a region is viewed as the effect of three factors, which are (i) the national growth (NG), (ii) the industrial mix (IM) and (iii) the competitive share.
National share
The national share is the part of the change responsible for overall national trends (Elburz and Gezici, 2012: 4). When the national economy experiences progression in employment, it is rational to predict that this growth will influence employment growth in a local region, as illustrated in equation (6) (Ziuznys, 2021).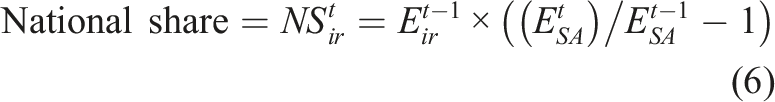
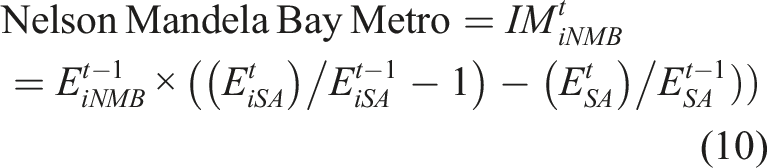
Industrial mix
The IM focuses on the effects that certain industrial trends have on a national scale compared to the industries of a specific region (Kleynhans, 2012). The function of the IM is to assess the impacts that national sectoral growth or declining growth has on a regional industry formation and therefore quantify the comparative adjustments due to changes in industry growth between the region and country as seen in equation (7) (Ziuznys, 2021). A negative IM signifies that the employment within the region flourished beyond the general national average, while a positive IM shows the exact opposite (Elburz and Gezici, 2012: 5).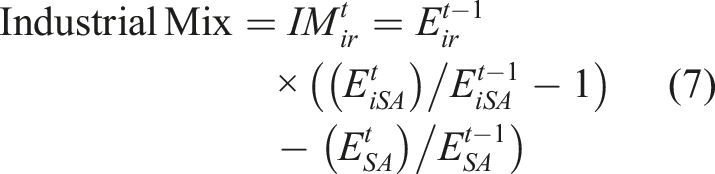
Regional shift
The regional shift, also known as the competitive effect, measures the part of alteration specified to the regional competitiveness and advantages (Selting and Loveridge, 1992: 5). The regional share element is utilised to distinguish between a region’s comparative advantages and economic strengths. The regional share focuses comprehensively on the size of employment created because of the competitiveness of the region and is one of the most essential elements of shift-share analysis since it groups the leading and lagging industries within a specific location. The regional shift is illustrated in equation (8).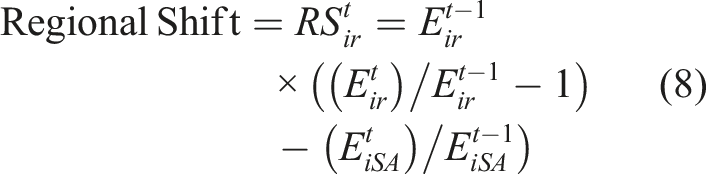
Study area and sample
The study was conducted in the Nelson Mandela Bay Metro within the Eastern Cape Province and the particular locality was chosen as the Coega IDZ (situated in Gqeberha), which is the largest seaport and IDZ in Southern Africa (Municipalities of South Africa, 2019).
Data collection method
The first investigation was to analyse the location quotient for the Eastern Cape, compared to the national location quotient, for the Nelson Mandela Bay Metro relative to the province, for all 22 sectors to identify the level of specialisation in the region.
The data used to evaluate the shift-share analysis for Nelson Mandela Bay Metro was obtained from Quantec Easy Data (2022). The shift-share analyses employed regional data, which included the total employment number data for 22 sectors in the Eastern Cape and the Nelson Mandela Metro for the years 2014 and 2019, since the shift-share needs a growth rate of 5 years to calculate the employment growth rates for each region. The period was also chosen specifically to exclude the effect of the COVID-19 pandemic.
The shift-share analysis investigates the national share, IM and regional shift in a region over time (Kleynhans and Sekhobela, 2011). The national share (NS), industrial mix (IM) and the regional shift (RS), also known as the competitive effect, will show whether the industry in the region is more competitive compared to those of the country.
Empirical analysis
Results obtained in the empirical analysis of the Nelson Mandela Bay Metro are given in this section and include the analysis of the location quotient and the shift-share analysis based on figures from Quantec Easy Data.
Location quotient
Location quotient per sector for the Eastern Cape and Nelson Mandela Bay Metro.
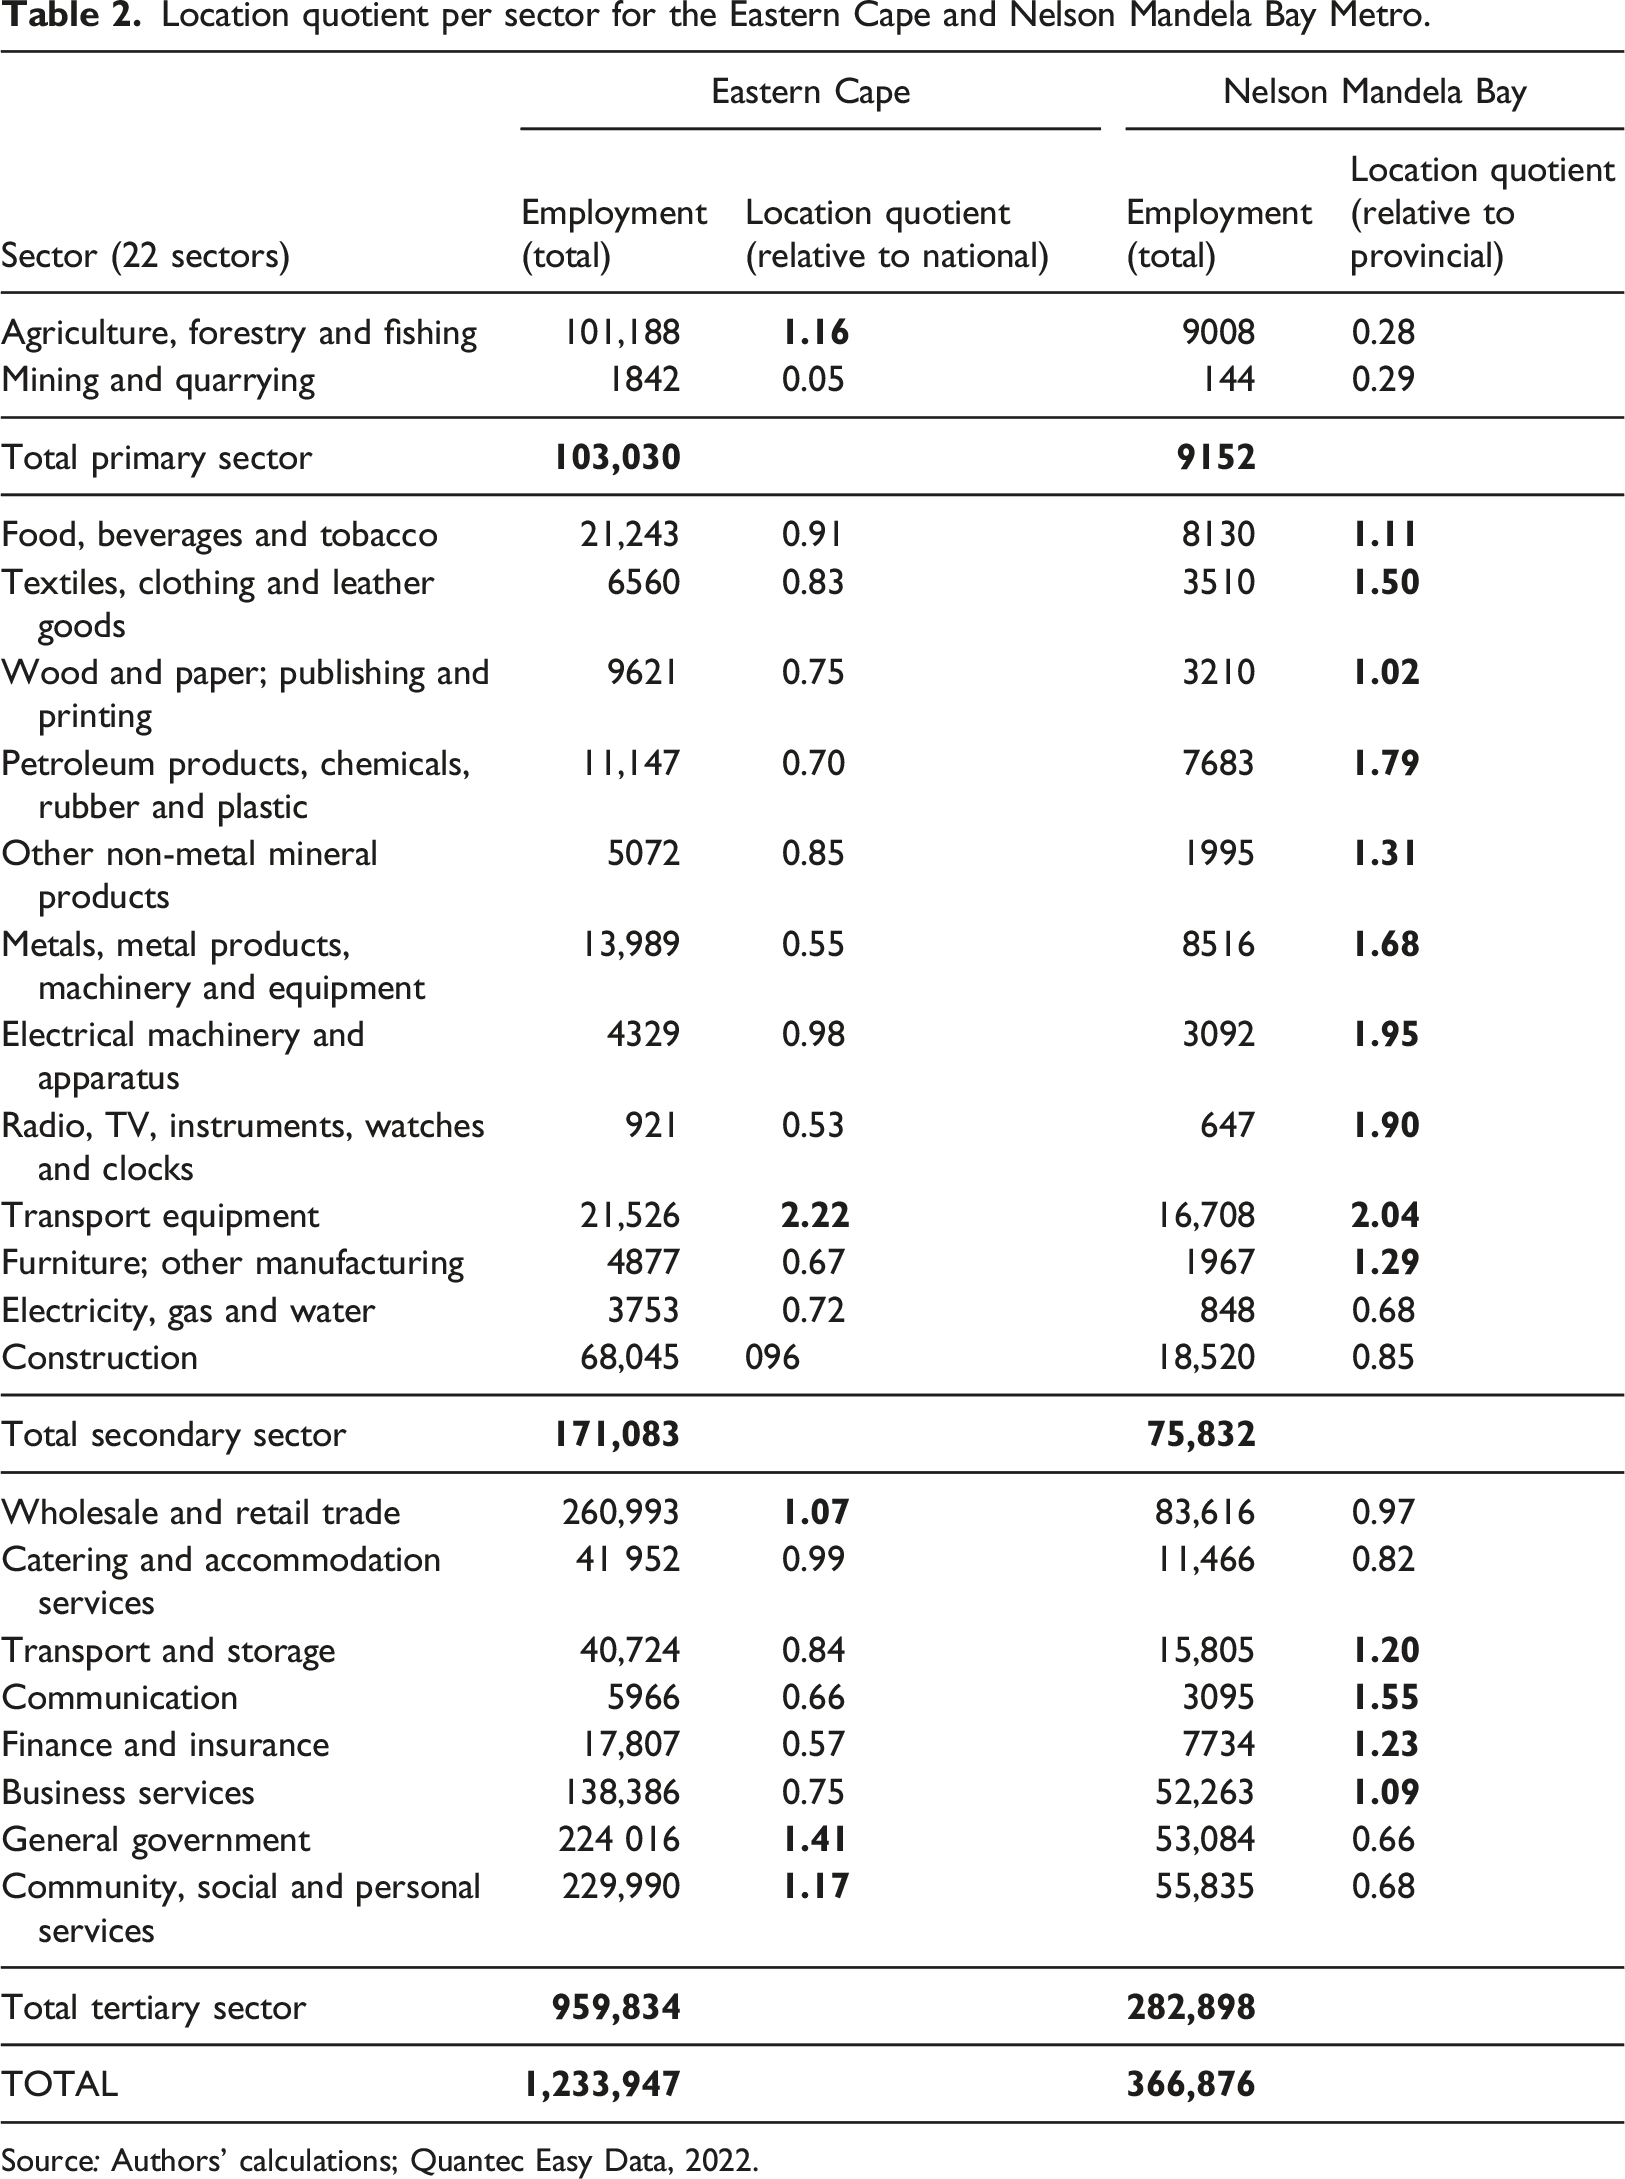
Source: Authors’ calculations; Quantec Easy Data, 2022.
Table 2 also indicates that different industries have various strengths within the Nelson Mandela May Metropolitan region. The sectors in which the Metro can focus on exportation include textiles, clothing and leather products, petroleum products, chemicals, rubber and plastic, other non-metal mineral products as well as mineral and metal products.
Shift-share analysis
The shift-share analysis is a calculating tool for sustainable development performance analysis. The higher the overall competitiveness of an industry or region, the higher the community’s income and welfare (Khusaini, 2015: 739). This section evaluates the shift-share analysis for the Nelson Mandela Bay Metro. The analysis focuses first on the employment figures per sector, the employment percentage, as well as the employment percentage change over 5 years. The succeeding sections evaluate the various industries in Nelson Mandela Bay concerning the national effect, the IM analysis, the regional shift and finally the shift-share analysis, which will be used to include the level of competitiveness of the various sectors within this region.
Employment growth rates per industry
Growth rate of employment in the economic sector of Nelson Mandela Bay, 2014 to 2019.
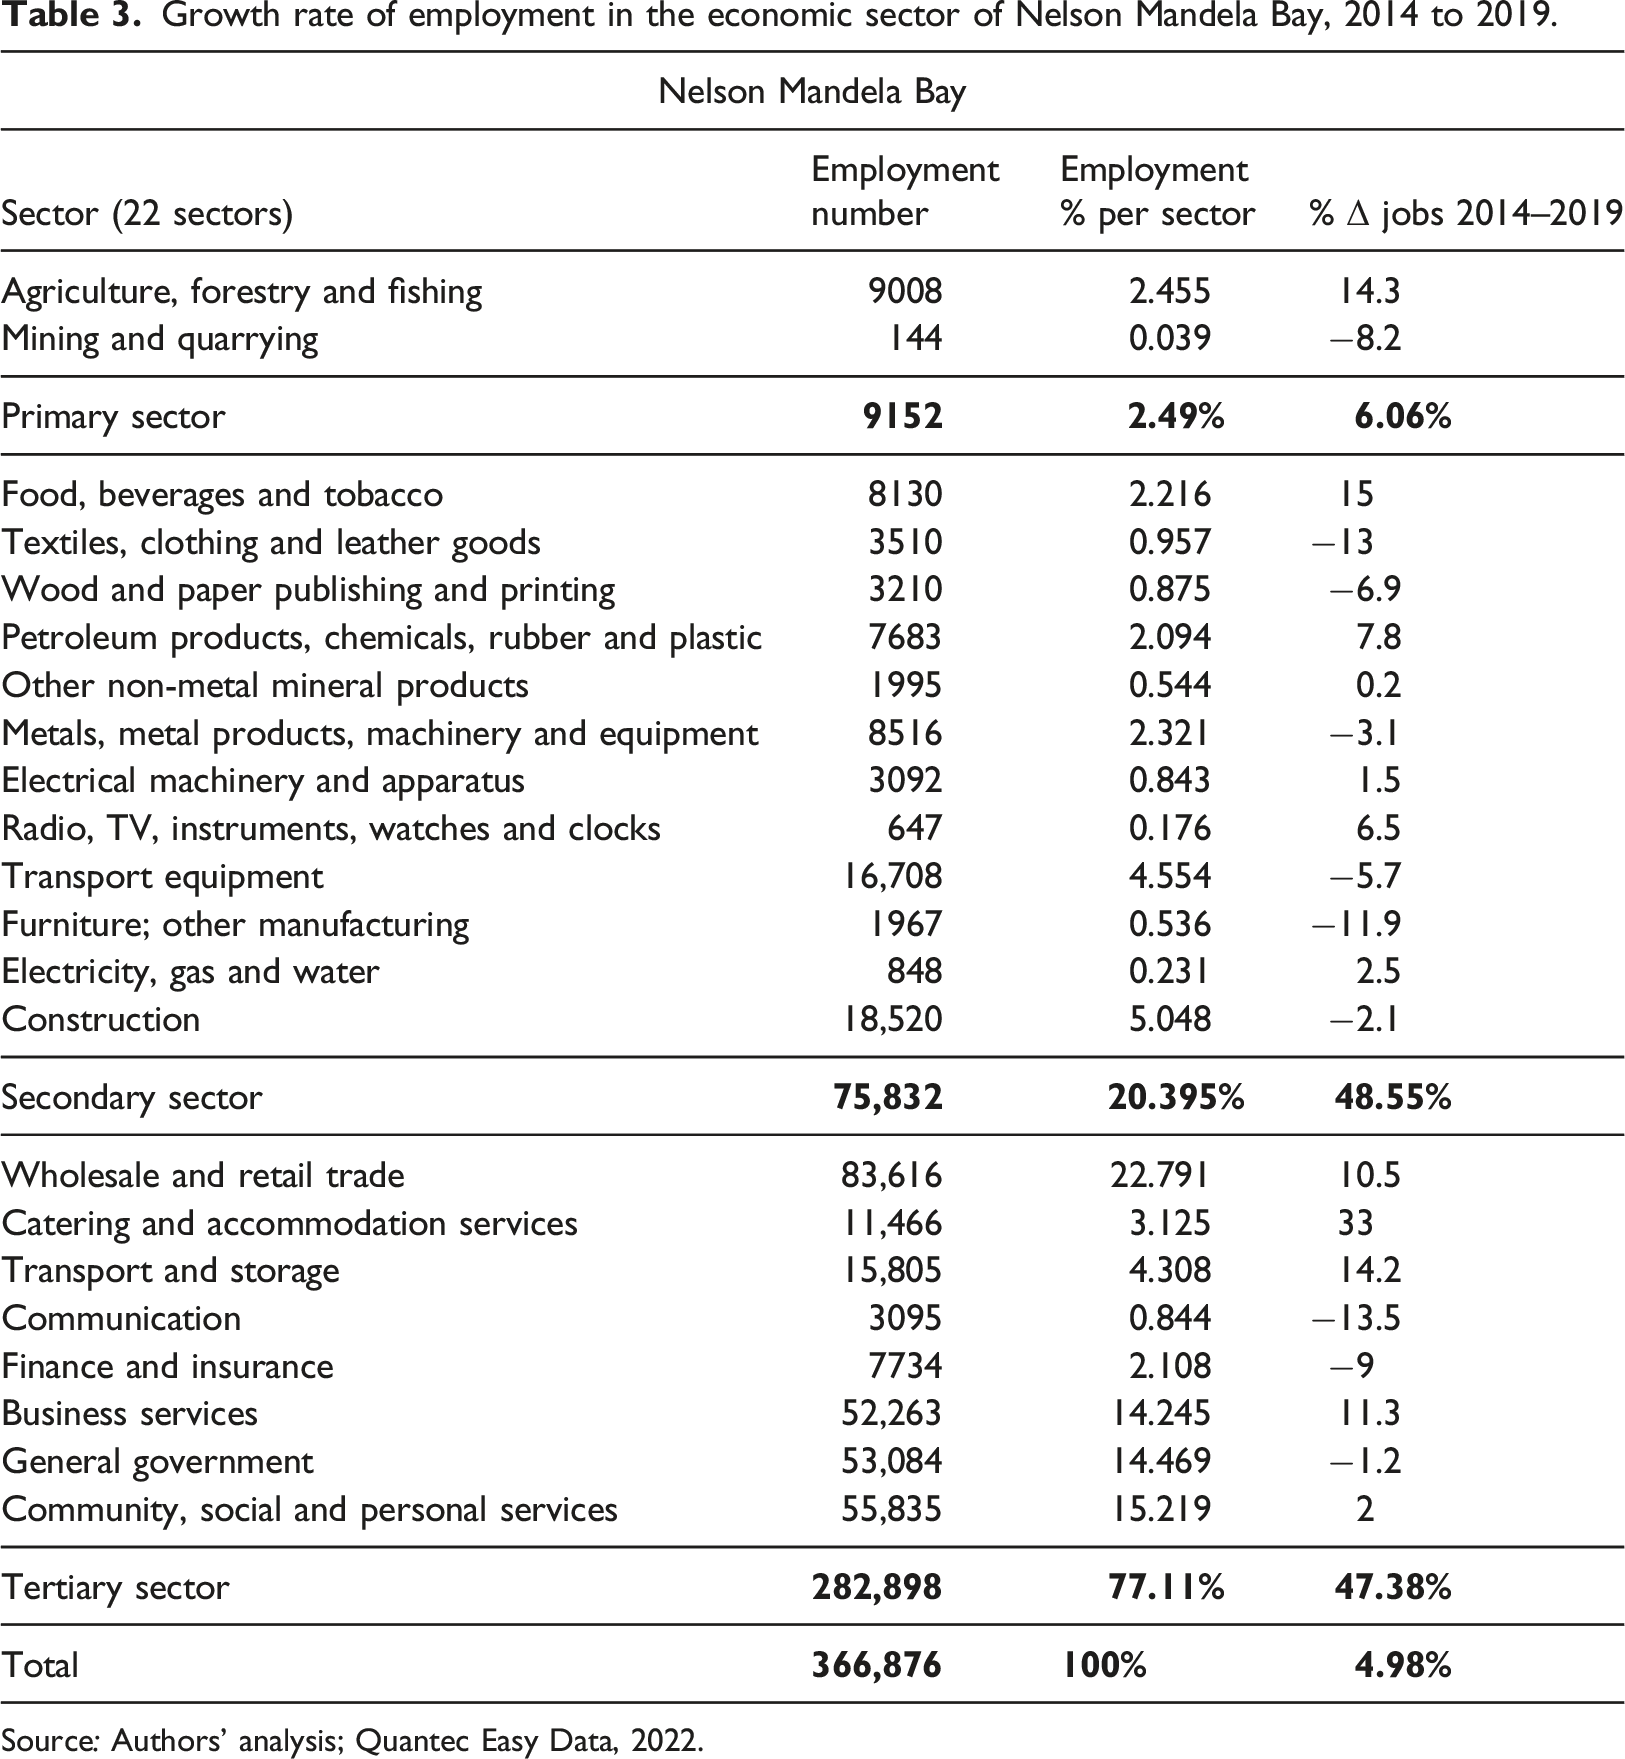
Source: Authors’ analysis; Quantec Easy Data, 2022.
The overall growth rate for all industries in the Nelson Mandela Bay Metro is 4.98% between 2014 and 2019. The sectors that grew significantly include agriculture, forestry and fishing (14.3%), food, catering and accommodation services (33%), wholesale and retail trade (10.5%), business services (11.3%), transport and storage (14.2%), as well as beverages and tobacco (15%). Other sectors that contributed significantly towards employment include community, social and personal services, business services, general government and construction between 2014 and 2019.
National share and industrial mix analysis
The IM component is useful since it illustrates the significance of growth attributed to the locality’s industrial composition and also illustrates the job losses or gains due to the changes in industrial and total national growth rates. The IM and national share are calculated as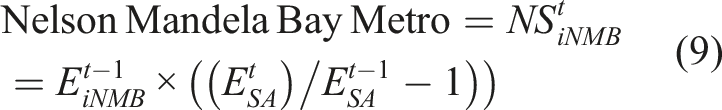
Industrial mix effect.
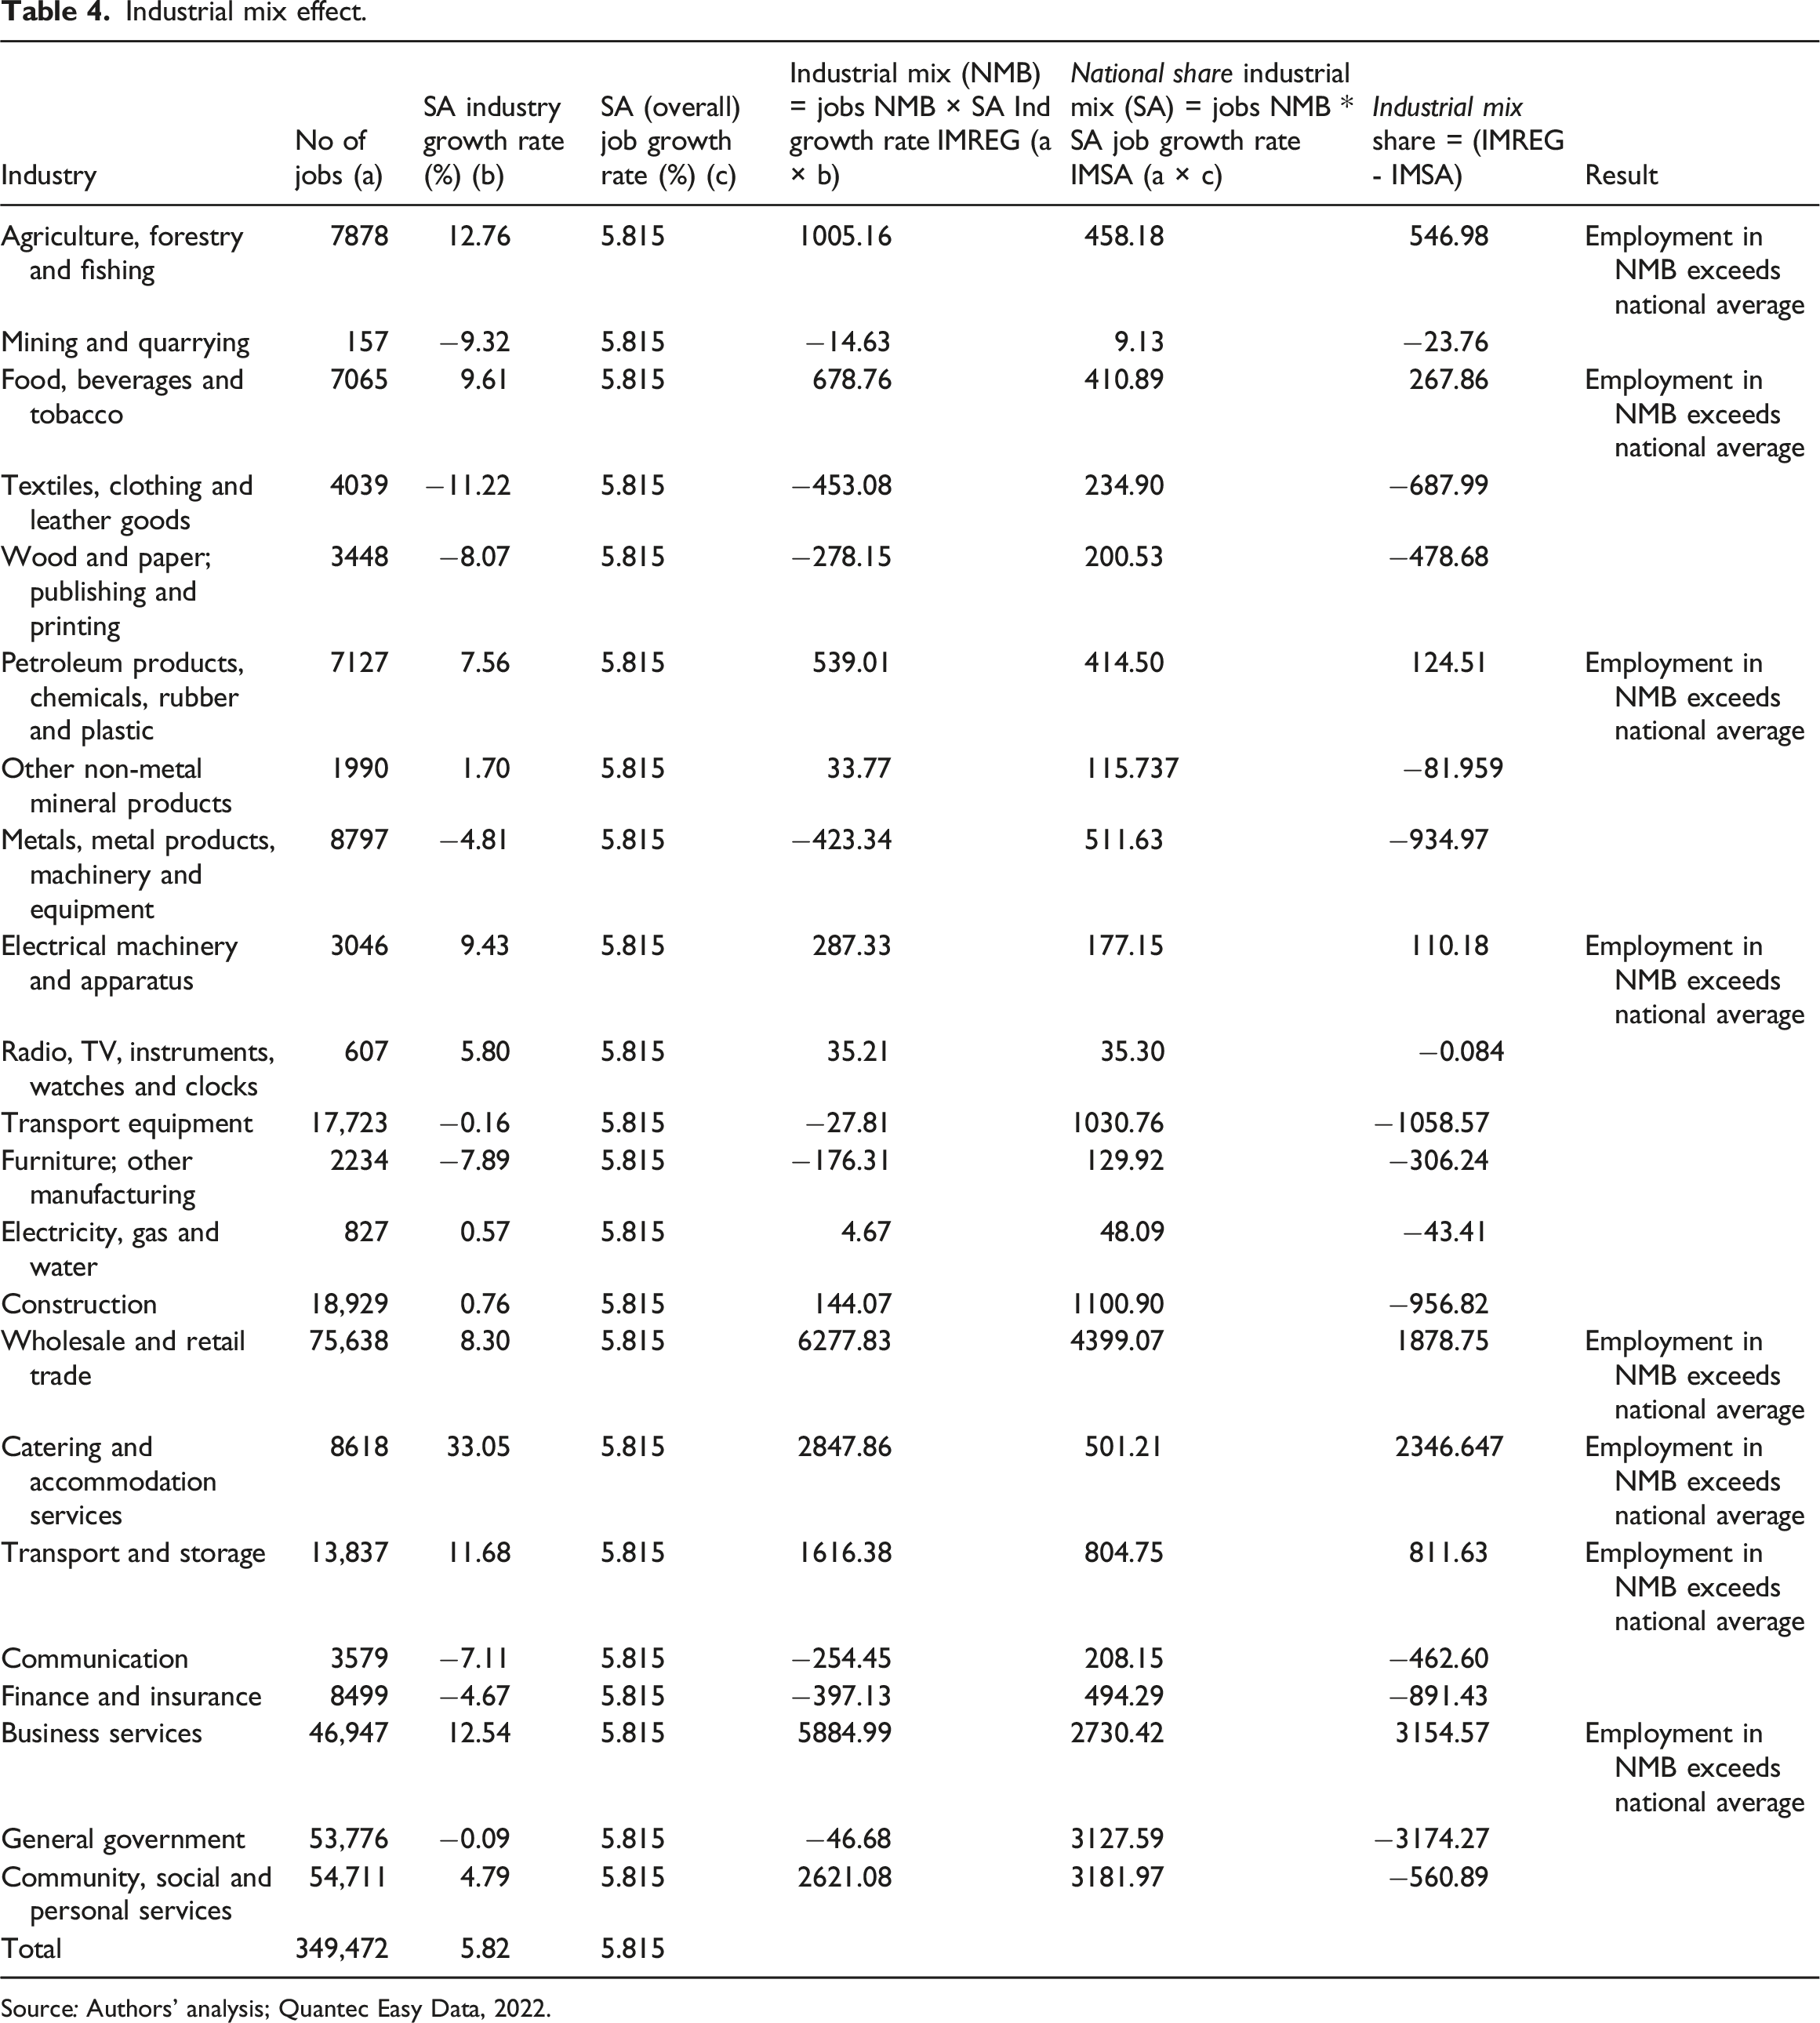
Source: Authors’ analysis; Quantec Easy Data, 2022.
The national share for South Africa equals the total number of jobs within the Nelson Mandela Bay region multiplied by the South African average growth rate (IMSA). The industrial mixes are calculated based on the regional industrial mix (IMREG) minus the South African industrial mix (IMSA), which are equal to the industrial mix share (IMREG-IMSA).
The results show that the employment in the region within some specific industries grew significantly more than others, which include food, beverages and tobacco, agriculture, forestry and fishing, electrical machinery and apparatus, petroleum products, chemicals rubber and plastic, as well as transport and storage.
Regional shift analysis
The regional shift focuses on the number of employment opportunities created or destroyed because of the level of competitiveness within the region and can be seen as one of the most important key factors of the shift-share analyses, since it categorises the lagging and leading industries within a specific region.
The regional shift (or competitive effect) can be calculated as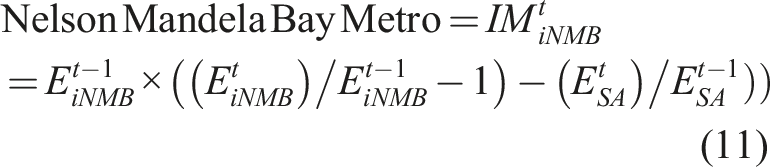
The regional shift indicates the competitiveness of each industry based on the calculations that exemplify the competitiveness within the region.
Competitive component.
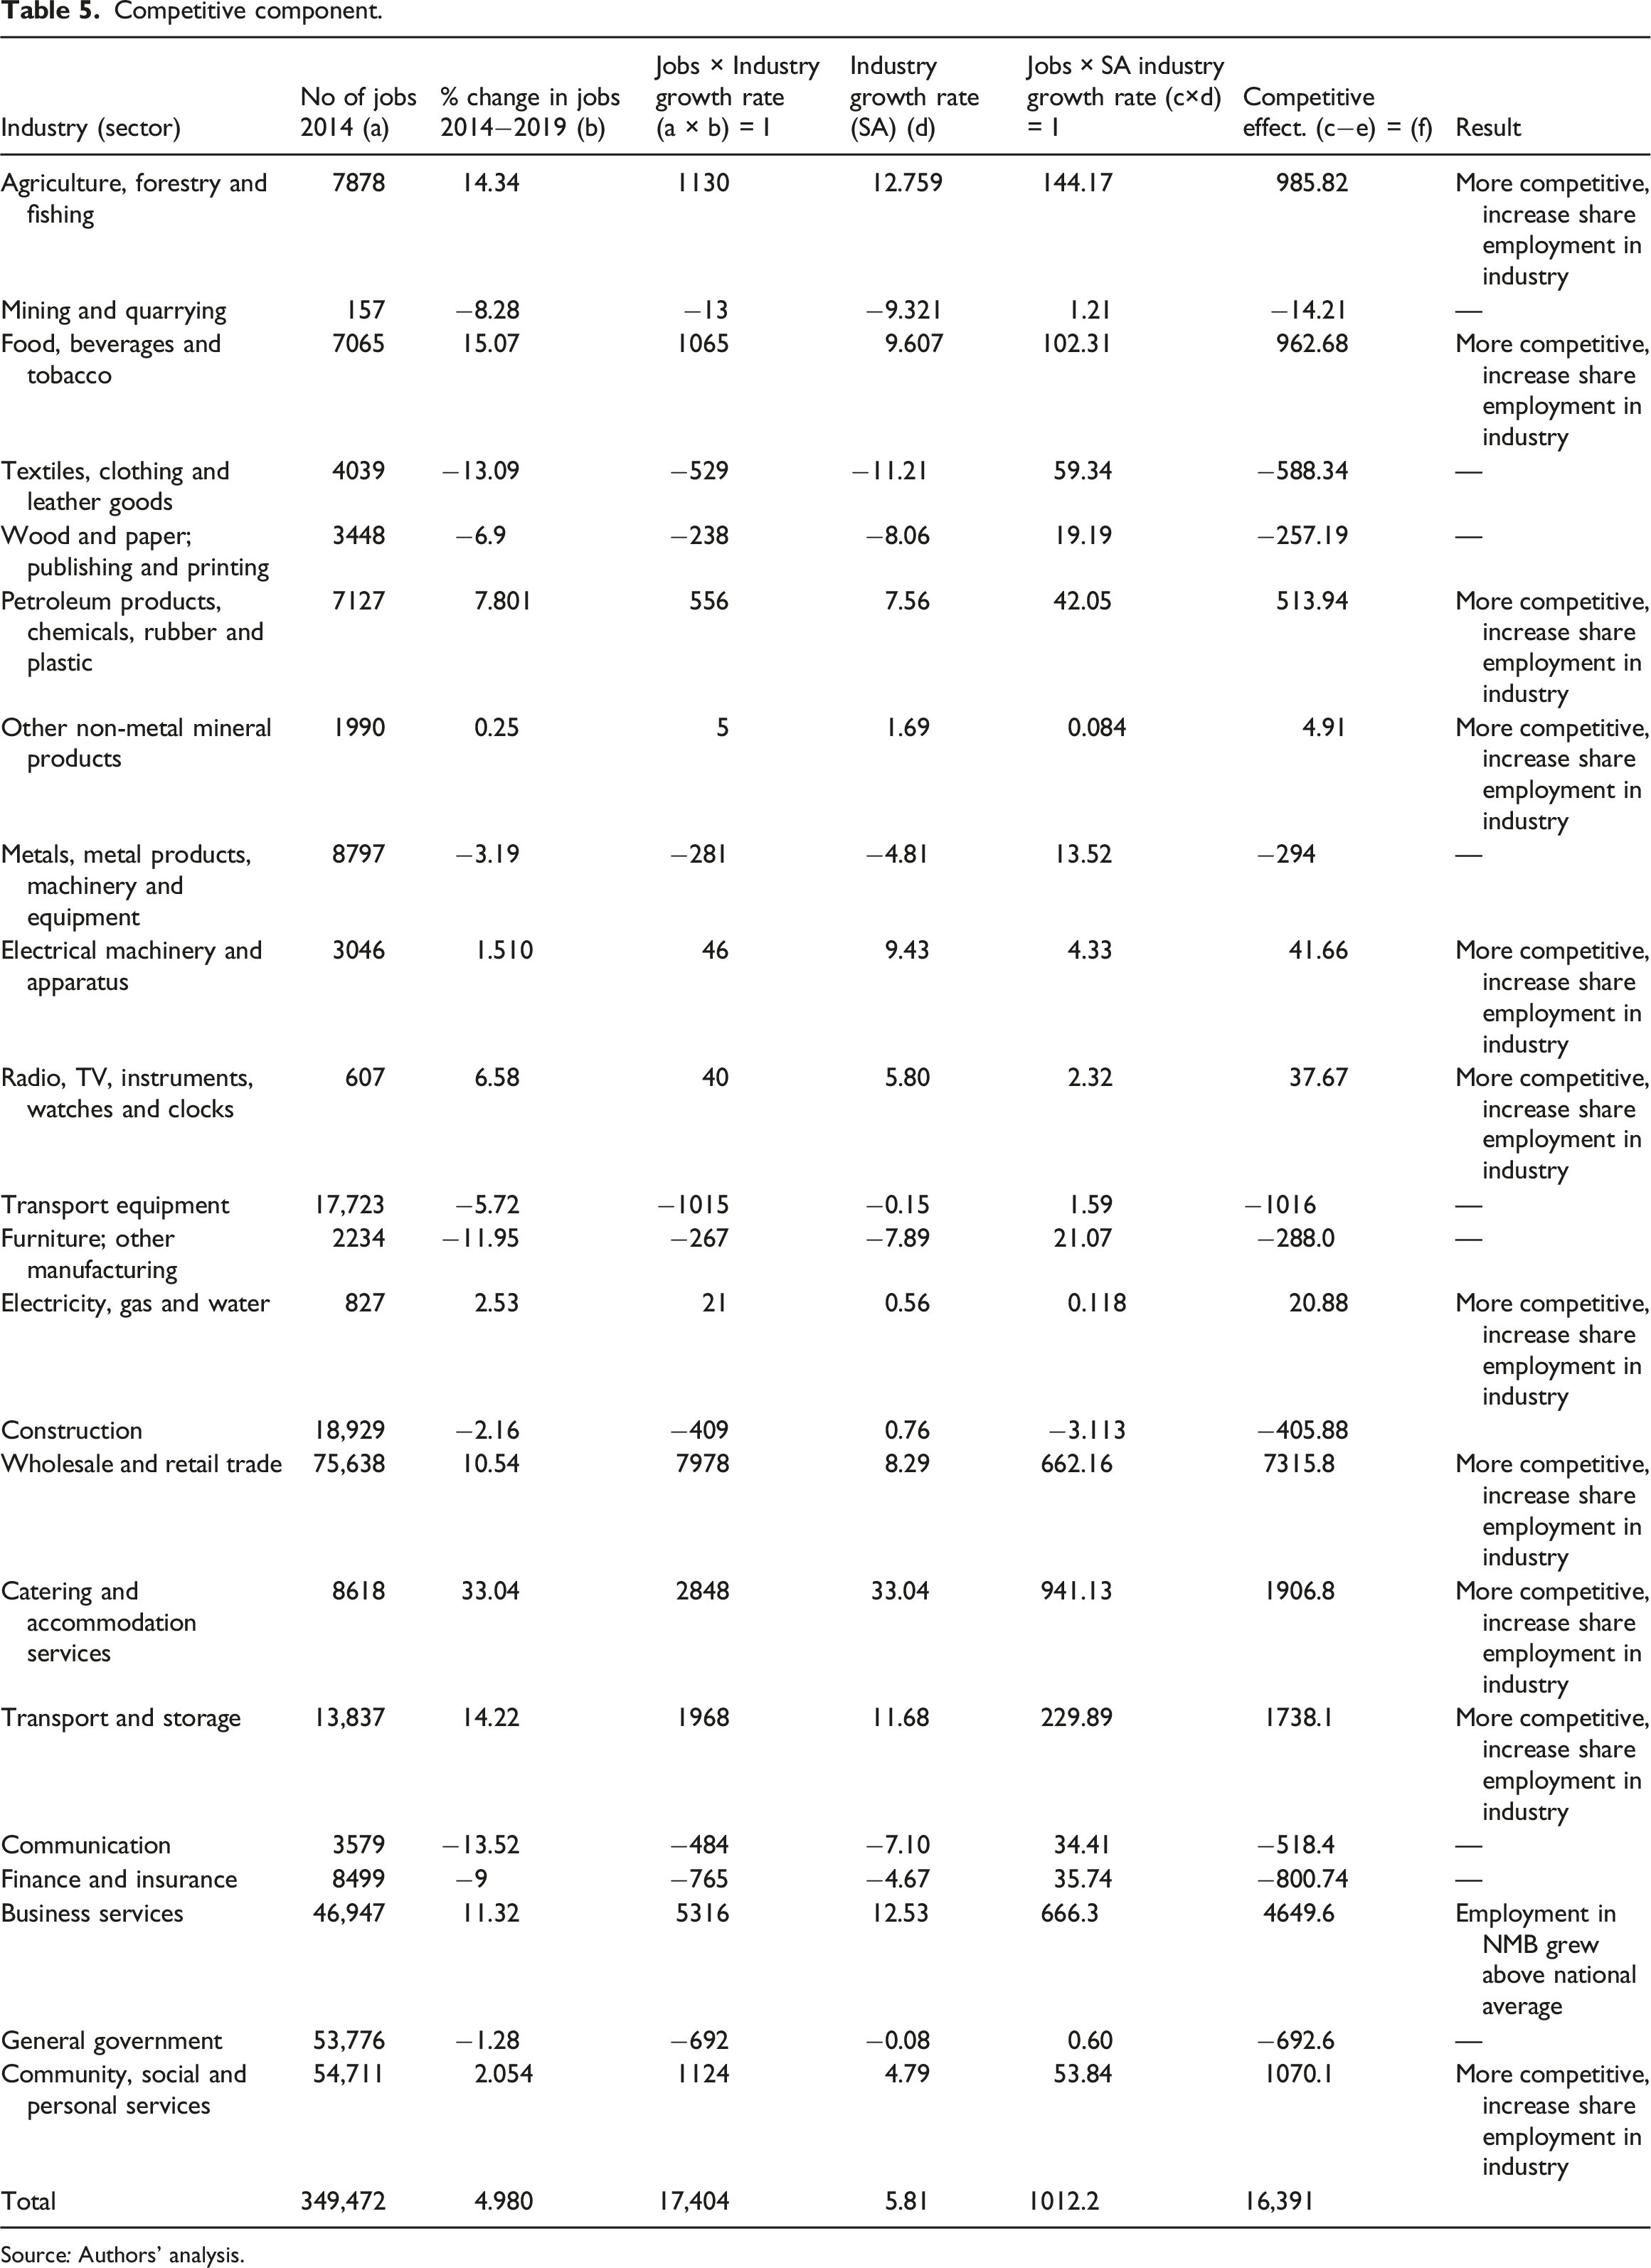
Source: Authors’ analysis.
Column a in Table 5 depicts the total number of jobs in the base year (2014) for the Nelson Mandela Bay Metro. Column b illustrates the percentage change in employment over 5 years, that is, from 2014 until 2019. Column I signifies the total number of jobs within the specific industry for the Nelson Mandela Bay Metro multiplied by the percentage change in jobs within the Metro for 5 years, while column d shows the industry growth rate for the specific sector. The second Column I signifies the total job percentage change multiplied by the South African growth rate per industry. Column f illustrates the competitive effect, which is equal to the jobs multiplied by the industry growth in the region minus the total number of jobs multiplied by the SA industry growth rate.
Total shift-share analysis of the Metro
The concluding step to analyse the shift-share analyses is to add all the effects calculated, that is, the national effect, industrial mix effect as well as regional shift (competitive effect). If the final numerical value was positive, then the industry within the metro is performing better than the national average, meaning the region has an advantage in that specific sector to create employment, the efficiency of the industry as well as overall competitiveness.
Shift-share analysis.
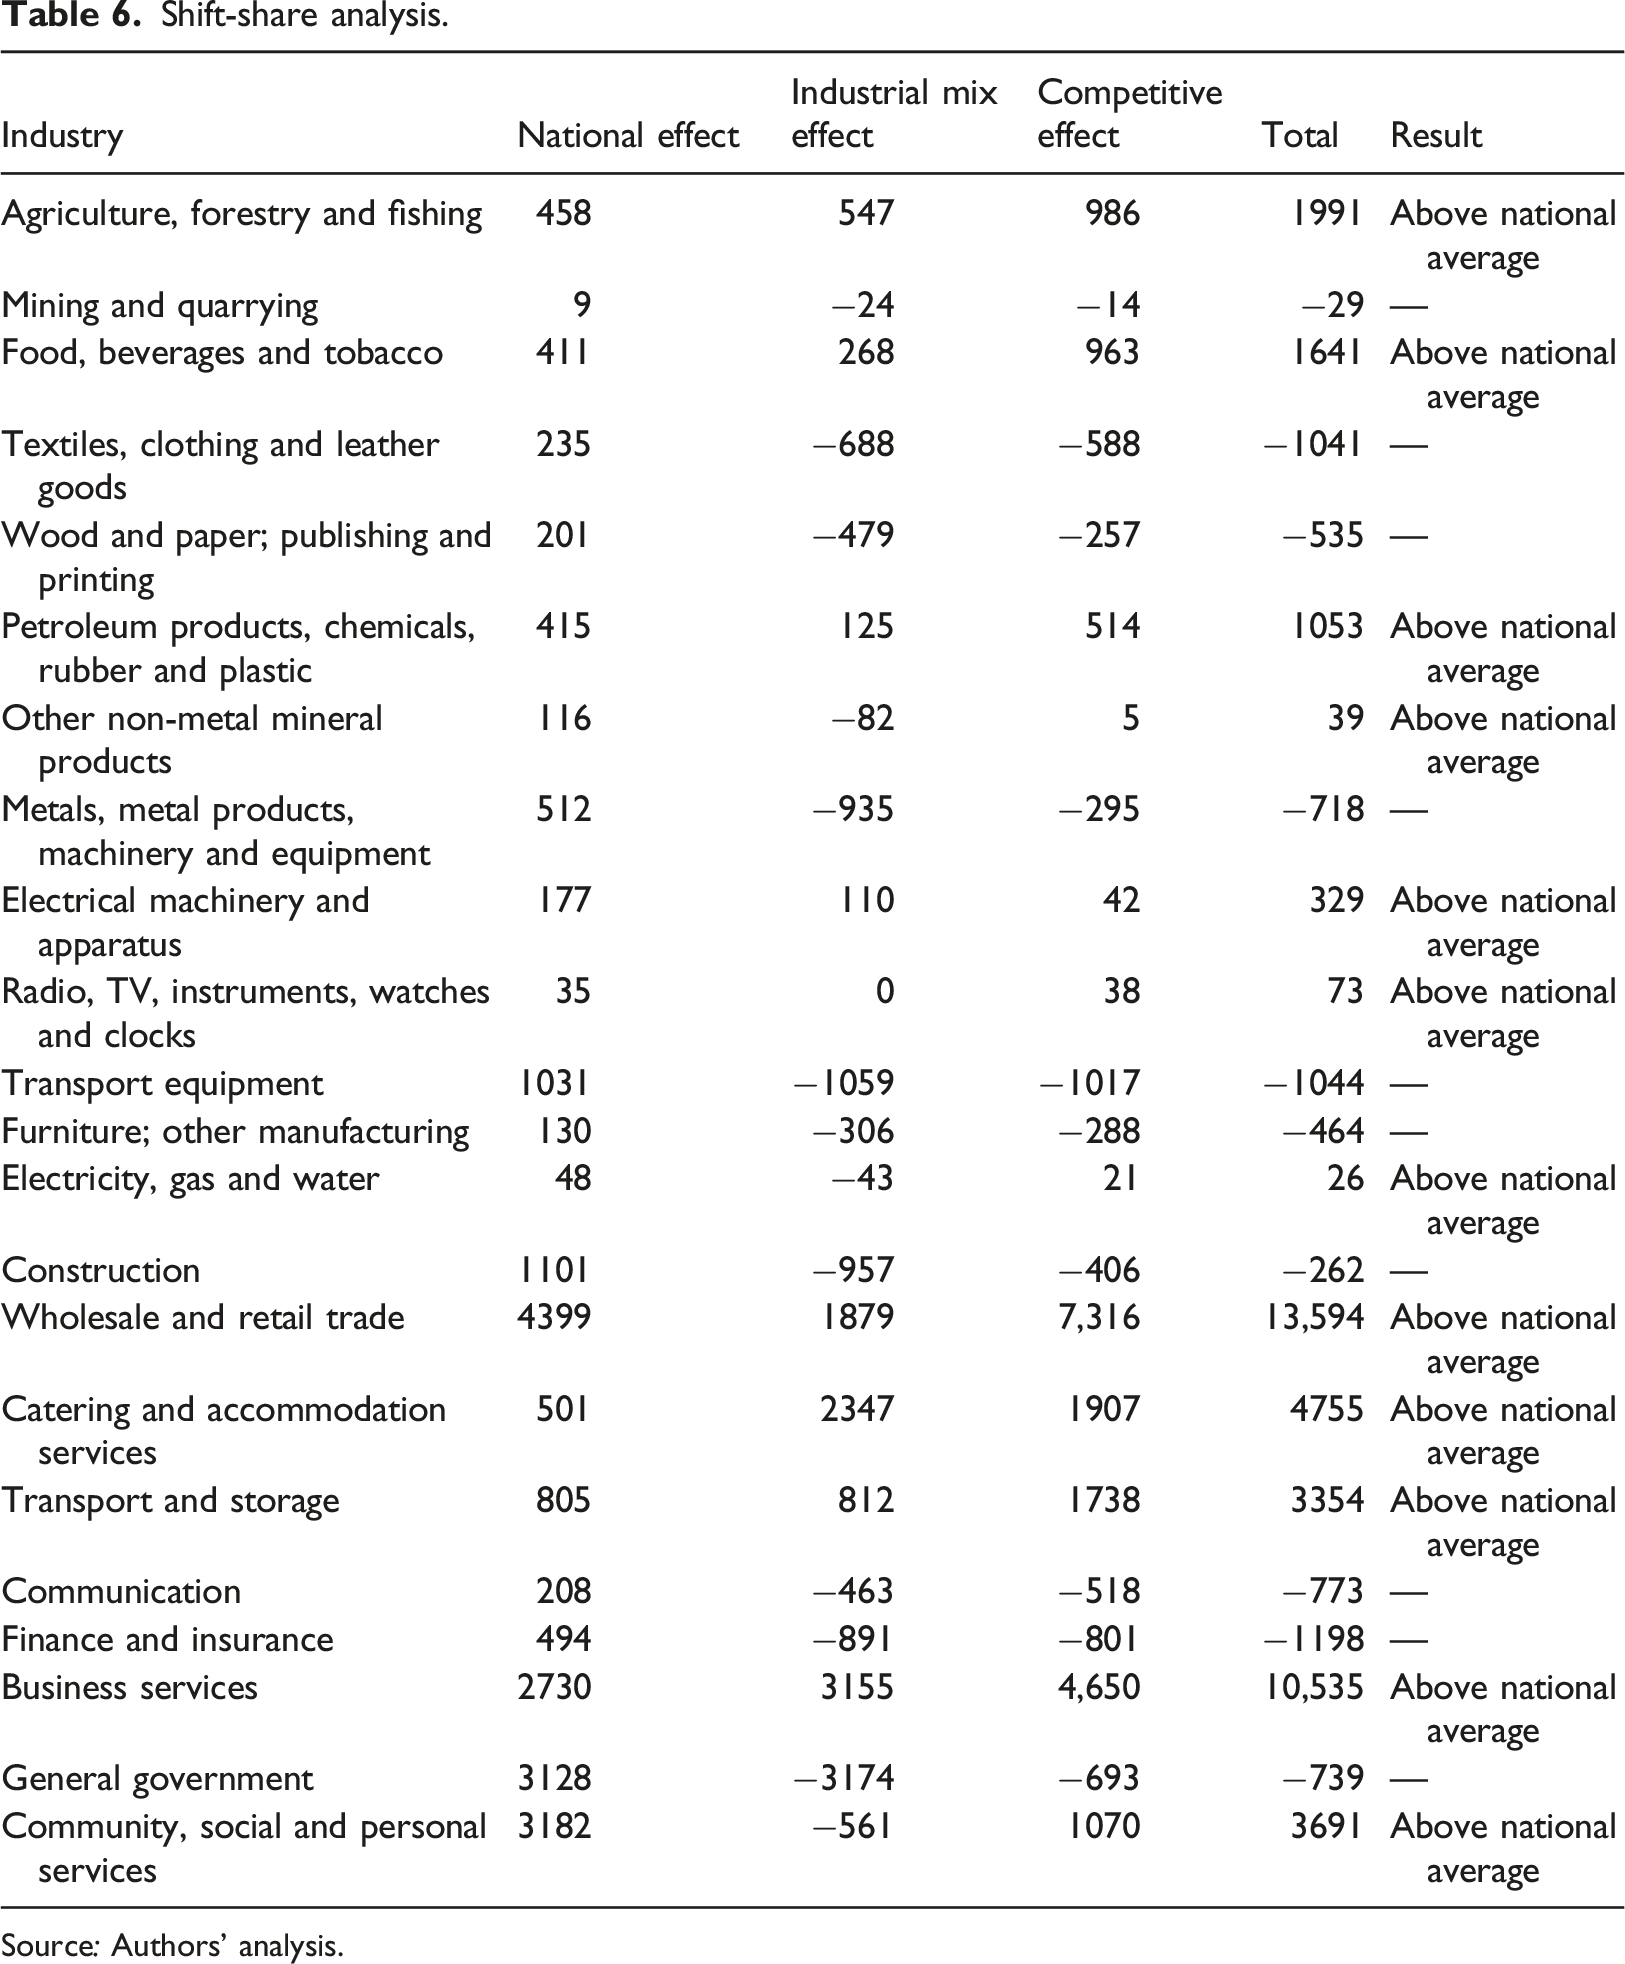
Source: Authors’ analysis.
Results and discussion
The empirical analysis showed that the Eastern Cape is highly specialised in certain industries such as agriculture, forestry and fishing, and transport equipment, which include vehicle parts and accessories and transport equipment. The automotive sector in the Eastern Cape is one of the best performing sectors in terms of modernisation and superiority, and this is factual with the manifestation of the long-term presence of international motor vehicle manufacturers such as Volkswagen and Mercedes-Benz and with the addition of other manufacturing companies such as Ford and Isuzu. The transport industry is growing exceptionally, especially with the multi-phase R11 billion investment by the Beijing Automotive Group at the COEGA IDZ (Young, 2020). The empirical analysis established that the total employment for transport equipment is 16,708 workers, which is 78% of the total employment in the Eastern Cape, and the LQ also indicated a numerical value of 2.044, which is much higher than the maximum of 1, which indicates that the region itself is highly reliant on the automotive sector for the generation of employment and income.
Sectors in the municipality in which employment grew exponentially include the agricultural sector (14.3%), food, beverages and tobacco (15%), as well as catering and accommodation (33%). The industries that did not grow significantly and declined in terms of job creation include textiles, clothing and leather goods (−13%), furniture and other manufacturing (−11.9%), as well as wood, paper and publishing (−6.9%).
The declining industries in terms of job losses may be as a result of the industrial decline of agglomerations as a natural occurrence, equivalent to the progress of a product lifecycle. According to the export base theory of growth, these declining industries might be because of a total decline in demand for products within the industry or sector (Boschma and Lambooy, 1999: 391).
The research results indicate that the industries that are more competitive in comparison to the national totals should increase their share in employment within the industries within the Metro, and these include agriculture, forestry and fishing, food, beverages and tobacco, petroleum products, other non-metal and mineral products, electrical machinery and apparatus, radio, TV, instruments watches and clocks and electricity gas and water.
The results from the shift-share analysis indicated that there are some industries in which the Nelson Mandela Bay Metro is performing better in terms of employment and these sectors include agriculture, forestry and fishing, food, beverages and tobacco, petroleum products, electricity, gas and water, wholesale and retail trade, catering and accommodation services, transport and storage, business services, as well as community, social and personal services.
These findings confirm the significance of the cumulative causation model as well as the comparative advantage effect as discussed in the literature review section. The specialisation and growth of sectors articulate the dynamic and static economies of scale and play a significant role in explaining the increase in returns through specialisation and division of labour. In the same way, the comparative advantage theory shows the potential of a region to produce products more efficiently and effectively with the least opportunity costs, indicating certain regions (such as the Nelson Mandela Bay Metro) have a comparative advantage on certain services and sectors (such as the transport services sector). The theory also stipulates that the physical distinctiveness and regions competitiveness such as the infrastructure stimulus of new firms as well as the overall market size also influences the competitiveness of a region.
Conclusion and recommendations
The study investigated the regional competitiveness and specialisation of various industries in the Nelson Mandela Bay Metro of South Africa and its potential to create employment, using the location quotient and the shift-share analysis. The shift-share analysis is typically utilised to identify employment changes at much lower aggregate levels, which makes it easier to identify valuable insight into employment changes in the various sectors of the economy and ultimately provides better planning for regional economic development.
The empirical analysis signified that the region is highly specialised in the secondary sector, given that the region is not as specialised in the agricultural and mining sector, which is in major contrast to the rest of South Africa. One industry that showed significant specialisation is transport equipment, since the automotive sector in the Nelson Mandela Bay Metro contributes significantly to total income and employment.
The Eastern Cape is historically known for its transport industries; however, as illustrated by the results obtained, it is comprehensible that the transport and storage sector should expand its overall output and employment opportunities. The declining industries in terms of employment creation and uptake include textiles, clothing and leather goods, furniture, and other manufacturing as well as wood, paper and publishing material. Concerning the shift-share analysis, it was indicated that the agricultural, forestry and fishing, petroleum products, food, beverages and tobacco, radio, TV, instruments, electricity, gas and water, catering and accommodation services, business services and the transport and storage sector should increase their total share in employment to grow the economy and achieve optimal economic diversification.
Recommendations that should be considered to obtain more significant industrial growth and increase their share in the regional economy are as follows: ⁃ Promotion of tourism: An effective approach should be utilised to incorporate user-friendly communication services, including mapping and navigation (Esipova and Gokova, 2020: 604). ⁃ Increasing the market share of wholesale and retail trade: Strategic planning is needed to open retail and wholesale stores in strategic locations where the businesses will have a more competitive advantage over certain retail groups, which include wholesale and retail trade businesses such as Massmart, Pick n Pay, Shoprite and Edcon. ⁃ Expanding its market share in the transport and storage industry. The region itself should have a viable plan to expand its overall market share in the transport and storage industry, including industries such as airlines, maritime industry, transport infrastructure and logistics.
The main implications of the findings are that other sectors of the economy such as agriculture, forestry and fishing, beverages and tobacco, petroleum products, chemicals and rubber, wholesale and retail trade, catering and accommodation, transport and storage services as well as business services, should increase their share in the region to grow and develop the regional economy of the Nelson Mandela Bay Metro. Even though some industries did not grow, such as textiles, clothing and leather, furniture manufacturing and wood, paper and publishing material, policymakers need to have adequate plans and strategic tools for the future to grow industries where the employment share should increase and thereby create more work opportunities and creating a competitive advantage over certain industries within the boundaries of South Africa.
Footnotes
Acknowledgements
The authors acknowledge the support from the World Trade Organization (WTO), the National Research Foundation (NRF) and the Faculty of Economic and Management Sciences, North-West University (NWU). The findings, views and opinions expressed and conclusions arrived at in this article are those of the authors and should not necessarily be attributed to the funding institutions.
Declaration of conflicting interests
The author(s) declared no potential conflicts of interest with respect to the research, authorship, and/or publication of this article.
Funding
The author(s) disclosed receipt of the following financial support for the research, authorship, and/or publication of this article: This work was supported by the World Trade Organization (WTO), National Research Foundation (NRF).
Ethical approval
With regards to this manuscript: “A regional analysis of the competitiveness of industries in the Nelson Mandela Bay Metropolitan Municipality, South Africa” for publication in the Local Economy Journal: We declare that all ethical practices have been followed concerning the development, writing, and publication of the article.