
Abstract
Second-order cities are generally seen as disadvantaged places in the literature on globalisation, but in recent years they have staged a revival in several countries. This article uses two data sources to examine the employment change recorded by Britain’s Core Cities between 2012 and 2017, breaking it down by type of worker, occupation and industry. It aims, firstly, to identify which elements of their growth are distinctive compared to the country as a whole and, secondly, to see how far their growth has been emulated by the areas around them that contain the majority of Britain’s ‘left-behind’ places. The article demonstrates the great strides made by the nine provincial cities combined, substantially exceeding the national rate of increase for male, female, full-time, part-time, employee and self-employed work, notably in the three highest status occupational groups and in all industrial sectors apart from manufacturing and transport, especially business services. It is also found that their growth outstripped that of their local, regional and EU comparators, underlining the importance of direct policy intervention for ‘left-behind’ places rather than relying on ‘trickle-down’ processes, especially given uncertainties about the sustainability of Core City growth in the wake of COVID-19 and Brexit.
Introduction
In many countries second-order cities tended to rebound in the 2010s after many years of trailing their premier cities. This was certainly the case in Britain with its main regional centres recording a substantial economic upturn from around 2012 after a decade of relatively lacklustre performance. Moreover, according to commentators like The Economist (2013), it was a ‘growth spurt’ that ‘left behind’ many places in the rest of their regions (rather than leading to trickle-down effects for them), causing greater intra-regional inequality and prompting a political backlash including support for Brexit and pleas for a less city-centric policy stance (Martin et al., 2016; Pike, 2018).
Second-order cities are generally seen as relatively disadvantaged places in the literature on globalisation and the associated triumph of the ‘world cities’ that have benefited most from the rise of what Gottmann (1961) termed the ‘quaternary sector’ in his ground-breaking study of Megalopolis on the north-eastern seaboard of the USA. They are seen to lack the critical mass of human capital and other agglomeration economies to be found in the likes of London, New York and Tokyo. As a result, they have tended to miss out on the phenomenal growth that has been occurring in finance, banking, insurance, auditing, legal services and other transactional activities that rely on the dense networks and opportunities for face-to-face contact offered by the largest urban concentrations.
The possibilities for a resurgence of second-order cities at least in the pre-pandemic era should have come as no surprise to those who have been studying the impact of new forms of communication on both working practices and social behaviour. Indeed, there has been statistical evidence that such a revival of their growth fortunes has already been underway. Census data on some of the Britain’s regional cities revealed considerable growth between 2001 and 2011, building on the revival of city-centre populations in 1991–2001 (Nathan and Urwin, 2006; Rae, 2013). Eurostat data for the 2010s suggests that employment growth of the largest second-order EU27 city regions has on average been exceeding the overall EU rate, especially in the key sectors of professional, financial and business services.
What is newer is the coining of the phrase ‘left-behind’ applied to towns arguably overshadowed by the growth of provincial cities, together with a related real contrast in people’s felt experience, expressed in a marked divergence in voting behaviour between the metropolitan and other areas of developed countries (see, for example Guilluy, 2019, with regard to France). For a considerable time, the standard London-based view was that the best prospect for such towns was for their incorporation, primarily through improved transport links, in city regions strengthened by forces of agglomeration and ‘trickle-down’ (Swinney et al., 2018). Many of the opportunities taken up by the English Regional Development Agencies lay in city projects such as concert halls or waterside offices and flats. The more recently emergent view that there is a strong ‘towns versus cities’ issue is still refuted by Centre for Cities and Core Cities Group (2018), the UK 2070 project (UK2070, 2020) and Carter (2018), following McCann (2016) writing that the UK prosperity gap (measured in terms of GVA per worker) between large cities, small cities, towns and villages was very small.
Even before voting in the 2016 Brexit referendum (Rodriguez-Pose, 2018) and the 2017 general election (Jennings et al., 2017), however, analysis by Martin et al. (2016) showed that there was a very significant disjuncture between the growing prosperity of cities and their hinterlands and that a policy focus on cities with new combined authorities was inequitable. Economic analyses (e.g. by Beatty and Fothergill, 2019) showed the narrowness of the economy of post-industrial areas, notably their dependence on call centres and distribution depots. In recognising the situation, academics argued for a ‘less centred’ spatial policy structure (Martin et al., 2019; Pike, 2018), and considered possible development policies for ‘left behind towns’ (Industrial Communities Alliance, 2020; Maclennan and McCauley, 2018; Tomaney and Pike, 2018). Politically, Lisa Nandy, significantly the MP for Wigan, founded the ‘Centre for Towns’, and the Conservative governments played on the plight of targetable Labour constituencies (often post-industrial towns) in the 2019 election and established the Stronger Towns Fund (Ministry of Housing, Communities and Local Government Towns Fund prospectus, 2019) across a surprising number of English towns, defined at a sub-local-authority level.
This article aims to serve two purposes. The first is to explore the recent experience of Britain’s second-order cities in greater depth and discuss its significance, building on previous work that has tracked their economies through the three main recession and recovery periods between the late 1970s and 2012. Secondly, it makes formal comparison of these cities with their surrounding towns, both those located within their ‘metropolitan rings’ and those situated further afield in their wider regions. A detailed dissection of two kinds of employment record is used to find the principal ingredients of the cities’ differential growth in terms of the mixes of skills and industrial sectors involved. These analyses provide a platform for the better understanding of how sustainable this new-found growth of the second-order city-region cores is likely to be. This is a key issue both in the context of the ‘levelling-up’ policy agenda concerning the divide between London and the rest of the country, and also in relation to the Core Cities Group’s claim that a policy of concentrating public investment on their cities remains the most effective way of regenerating their wider regions through a ‘trickle-down’ process. It also provides a basis for assessing how the major fall-out from the imposition of the COVID-19 lockdown from March 2020 may alter the geography of economic prospects in these two fundamental policy arenas.
Economic context
There is growing concern about the so-called ‘left-behind places’ (LBP) across Europe and North America, both in the political arena and in academic circles, associated with issues about their contribution to (or drain on) national economies, about increasing inequalities of deprivation and life chances between places and about a political backlash including anti-establishment voting behaviour (as for Donald Trump in the 2016 US Presidential Election and for Boris Johnson in the 2019 UK General Election). In the UK case, the roots of the disaffection of the LBP can be traced back nearly a century, as they were prominent among the places suffering from the shrinkage of demand for the products of mining and heavy industry immediately after the First World War and especially in the Great Depression years following the Wall Street Crash in 1929. Being accompanied by the growth of light engineering and services in London and the south of England more widely, this engendered a ‘North-South drift’ in population that mushroomed in the 1950s and 1960s and led to the designation of areas for regional-policy support. These areas became particularly extensive in the late 1970s, blanketing most of northern and western Britain including the far South West and reaching into the West Midlands in the 1980s following the phase of most rapid deindustrialisation (Townsend, 1983).
Even then, however, it was recognised that the North-South divide – which was being represented as a line running approximately from the Bristol Channel to the Humber estuary (see, for example, Champion et al., 1987: 13, Figure 1.4) – was not separating two entirely homogeneous halves of the country. In their Booming Towns (BT) report, Champion and Green (1985) revealed that, while the southern half of the country accounted for the vast majority of the places scoring highly on the BT Index, it also contained several places that were classified in the lower half of the rankings, mainly around its coastline but also including London at this time. Similarly, a fair number of places north of the line featured in the top half of the rankings, though these were mainly based on smaller centres and reflected a sharp rural–urban contrast here then – a point echoed by a study entitled ‘The Northern Lights’ (Breheny et al., 1987; see also Champion and Townsend, 1990).
Three decades on, the current picture reflects both continuity and change compared to then. The main element of continuity is the North-South divide, which if anything appears to have become more entrenched over time, not least due to the dramatic turnaround in London’s fortunes dating from the late 1980s and associated primarily with the deregulation of the financial services sector in the ‘Big Bang’ of 1986. This has resulted in a long-term widening of the wealth gap between the two halves of the country, as reflected in a wide range of datasets including on household incomes and worker productivity as documented most comprehensively by McCann (2016). In current writing about the slow growth of UK productivity, concern is expressed that output per head is lagging in both the regions and their Core Cities (OECD, 2020). However, Beatty and Fothergill (2019) asserted that a very large part of the discrepancy can be attributed to the effects of differential sectoral and occupational structures.
At the same time, London’s recovery denotes a sea change from the urban-to-rural shift that is well documented for the 1970s and 1980s to one where agglomeration economies and other facets of globalising have preferenced the largest urban concentrations in the world economy. There is growing evidence that this tendency may also have been having a positive effect on the trajectory of second-order cities. In the UK, this would certainly seem to be the case for some members of the Core Cities Group that was established in the mid 1990s in order to persuade central government to channel more investment to these secondary agglomerations on the assumption that in this changed world these larger cities stood the best chance of competing with London as well – it was argued – as reviving the fortunes of their wider hinterlands through trickle-down effects. By the mid 2010s employment in these cities was growing faster than the national average, though their recovery to 2015, while marked, was slower than London’s (Cambridge Econometrics, 2018).
This impressive development raises the question as to whether the urban-to-rural shift has become less marked or even reversed in the regions in which these cities are located. The literature on the UK’s regional patterns of growth suggests a fluctuating situation. An analysis covering the long period 1984–2007 by Champion and Townsend (2011) showed that, while employment growth for England’s eight Core Cities was generally lower than for the rest of their city regions, it was higher for one of their five periods, namely 1998–2002. Recent research on the latest decade by Beatty et al. (2019) shows that their ‘main regional cities’ matched the national rate of growth in employee jobs for 2012–2017 – a finding that is broadly in line with our initial analysis for the present article, though when the self-employed and so-called ‘flexible working’ (see below) are included, then the Core Cities as a group were growing faster than Great Britain as a whole at this time. Beatty et al’s (2019) study was focused primarily on the relative performance of their ‘former coalfields’, whereas here our purpose is to compare the Core Cities with the whole of their wider regions.
Aims and approach
Against this background, this article investigates two main areas of inquiry. One relates to the Core Cities themselves – both in aggregate and individually – and seeks to establish the extent to which they exceeded the national rate of growth in the 2010s and to discover what combination of activities lies behind this superior performance in terms of types of work, focusing on occupational status and industrial sector. The other area concerns the question of how the growth of the Core Cities compares with that of their immediate hinterlands and their wider surrounding regions. There might conceivably be evidence of a ‘trickle-down effect’ but, if not, is this because this process might occur only after a time lag or is it because the strong growth achieved by the Core Cities is not of a type that would be expected to flourish in the smaller cities, towns and rural areas around them?
Our study focuses on the nine members of the Core Cities that we have studied previously (Champion and Townsend, 2011, 2013; Townsend and Champion, 2014). These comprise Birmingham, Bristol, Glasgow, Leeds, Liverpool, Manchester, Newcastle, Nottingham and Sheffield, i.e. excluding the more recent joiners Cardiff and Belfast as well as the capitals of England and Scotland which are not members. We define these on the basis of their unitary local authority areas and compare their performance with that of their regions, the latter being split two ways between their immediate hinterlands (defined as the remainders of their former metropolitan counties where relevant and the equivalent NUTS3 areas for the others) and the rest of their regions (where region refers to the current statistical regions of England and the rest of Scotland for Glasgow).
In terms of our data on employment change, as we are concerned primarily with the economy of these places, we use workplace-based counts, referring to where the work is based rather than where the workforce is living. We derive these from two main sources, namely the Annual Population Survey (APS) and Business Register and Employment Survey (BRES). The APS, which is an expanded version of the Labour Force Survey, uses a questionnaire which is administered to a sample of households and collects information on all types of paid work. BRES collects data from employers about their workforce, with full coverage of larger firms together with estimates derived from a sample of smaller firms, but omitting most of those which have no employees. Our focus is on change for the five-year period 2012–2017, but because both our sources are based – entirely or in part – on sample surveys that give less robust results for finer-grained geographies, we use three years’ worth of counts to give an average for each of our specified years, i.e. 2011–2013 for 2012 and 2016–2018 for 2017. It is important to note that full-time students are omitted from the APS’s sub-regional data on employment and, while BRES includes those with part-time jobs, its reference point is mid-September, i.e. before the start of term for most universities. Further details about these two sources and the degree of confidence we place in them are given in the relevant sections of results that follow.
Relative employment growth
This section addresses three main questions: (1) How strongly have our set of Core Cities been growing in terms of employment relative to the national average and does this vary by type of worker? (2) How strongly have they grown compared with their immediate rings and their wider regions, again by type of worker? (3) How much do both these vary across the nine Core Cities individually? As mentioned above, our focus is on the five-year period 2012–2017, though our data spans 2011–2018 because we have calculated employment numbers for the start and end of the reference period using three-year averages around those years to reduce the effect of sampling error.
The answers to the first two questions are provided in Figure 1, where the columns represent the overall workplace-based employment change rates for the five-year period for the aggregate of the nine Core Cities compared with those for their rings and for the non-metropolitan remainders of their regions and finally with the national (Great Britain) rate. The first panel gives the rates for total employment as defined by the BRES, i.e. employees and those of the self-employed that are registered for VAT or PAYE, while the remaining seven panels are derived from the APS and include all self-employed people and also flexible employment. Despite covering somewhat different definitions of employment, nationally the BRES and APS indicate very similar rates of total employment growth (cf. the first two panels), but for the Core Cities aggregate the APS gives a faster growth rate than the BRES, which would seem to be mainly due to their strong growth in self-employment.
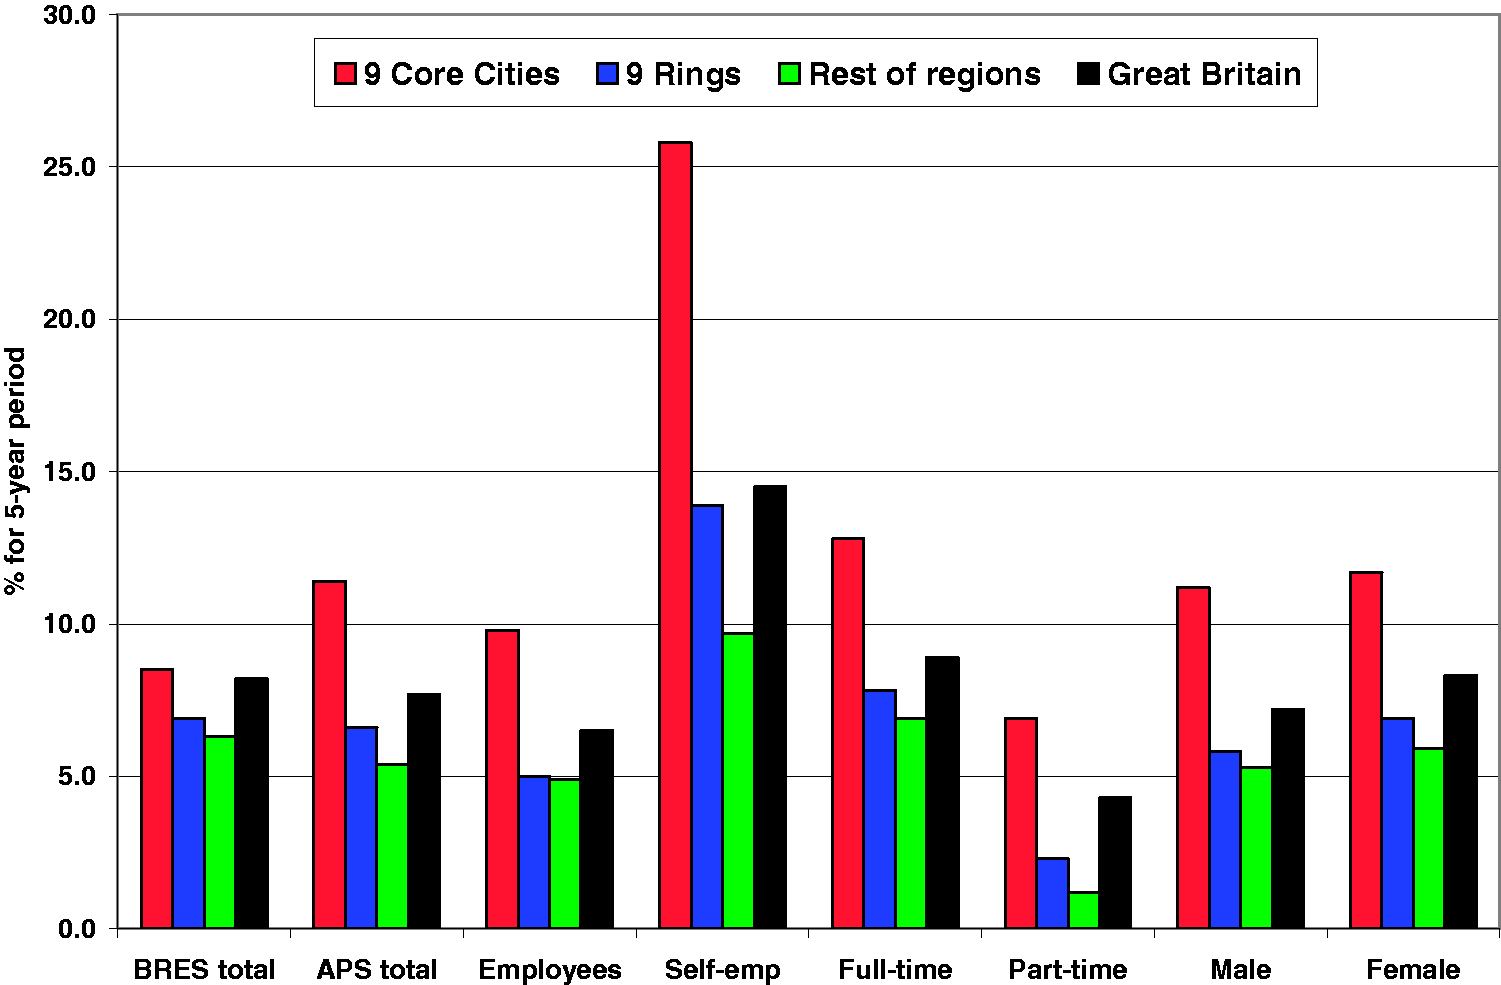
Employment change, 2012–2017, for the nine Core Cities and their wider regional context, by type of worker (Source: first panel calculated from BRES data, the other seven panels from APS data. Self-emp: self-employment).
To set this growth of 338,800 jobs in its APS labour market context, it has provided no less than 10.2 net new jobs per 100 of the resident working-age population of the Core Cities at the start of the period, compared with as few as 4.1 in the metropolitan rings and 5.9 in Great Britain as a whole. This is a stark contrast and one that has major repercussions for activity rates, migration and travel-to-work, along with problems of road congestion and railway timetabling between these cities and their surrounding areas.
Precisely to understand the origins of this important “towns versus cities” contrast, the article concentrates on the supply of new employment itself, where the chart shows substantial changes in the structure of change. The two pairs of two-way splits of workers in the further panels are perhaps surprising in revealing appreciably stronger growth of full-time than part-time working over this period, but very little difference between male and females, both nationally and in terms of the pattern across the three types of place.
As regards the first of our three questions, the answer could hardly be more emphatic. The nine Core Cities in aggregate increased their employment numbers at a faster rate than Great Britain as a whole over this five-year period and this applies to all the worker types identified here from the APS – self-employed as well as employees, part-time as well as full-time workers, and females as well as males. Only for the BRES-derived rate is the excess of the Core Cities over the national change rate shown to be rather marginal, which would seem to be at least partly due to this measure including only some of the self-employed. It is appreciated that self-employment as a whole is very varied in nature; while average income in these small enterprises remains firmly below the average nationally, their growth in our study period is spread across almost the full range of occupations and industries.
The strong performance of the Core Cities over this period is further underlined by the fact that, again for the nine-cities aggregate, their rings and the rest of their regions display rates that, while positive across all the measures of employment change shown in Figure 1, are not as high as the relevant Great Britain rate in any of the cases. In answer to our second question, therefore, this means that the Core Cities were powering ahead of their surrounding areas at this time. Additionally, it can be seen that the rate of growth steps down progressively with distance from the cities themselves, with the rest of their regions beyond their rings registering the lowest growth rate of the three types of place.
This is compatible with a view of a strong reversal of the urban-to-rural shift that was so dominant in the 1970s and 1980s. However, on the one hand these data do not include the regions around London, i.e. the East and South East regions. On the other, the populations of the regions that we are considering as ‘remainders' are principally urban and containing archetypal LBPs, notably North Staffordshire, Lancashire, Tees Valley, Humberside and the Derbyshire Coalfield. It is therefore no surprise that, as their geographies merge into those of the Metropolitan Boroughs attached to Core Cities, the difference between the two outer types of LBP is in all cases much smaller than the gap between these two and the Core Cities themselves, emphasising how much the latter have powered ahead over this period, leaving their surrounding areas and their wider regions as a whole trailing well behind.
That is the aggregate picture across the Core Cities combined. Moving to our third question that concerns how much the picture varies across the nine cases individually, the answer is provided in Figure 2 in terms of APS-based total employment. Impressively, city dominance over their rings and wider regions is found for seven of the nine cases, with this embracing all those at the heart of the major industrial conurbations. Moreover, the difference between the city itself and its ring is very large in three cases (Leeds, Liverpool and Manchester) and is marginal only in the case of Newcastle. Indeed, the latter’s city rate is below the national rate of 7.7%, as it is too for the cases of Bristol and Nottingham, whose tight boundaries may explain why their rings appear the most dynamic at this time. Generally, the cities’ rings have been growing more strongly than the rest of their regions, the main exceptions being Birmingham’s ring – principally the Black Country, outpaced by the rest of the West Midlands region – and Liverpool’s ring.
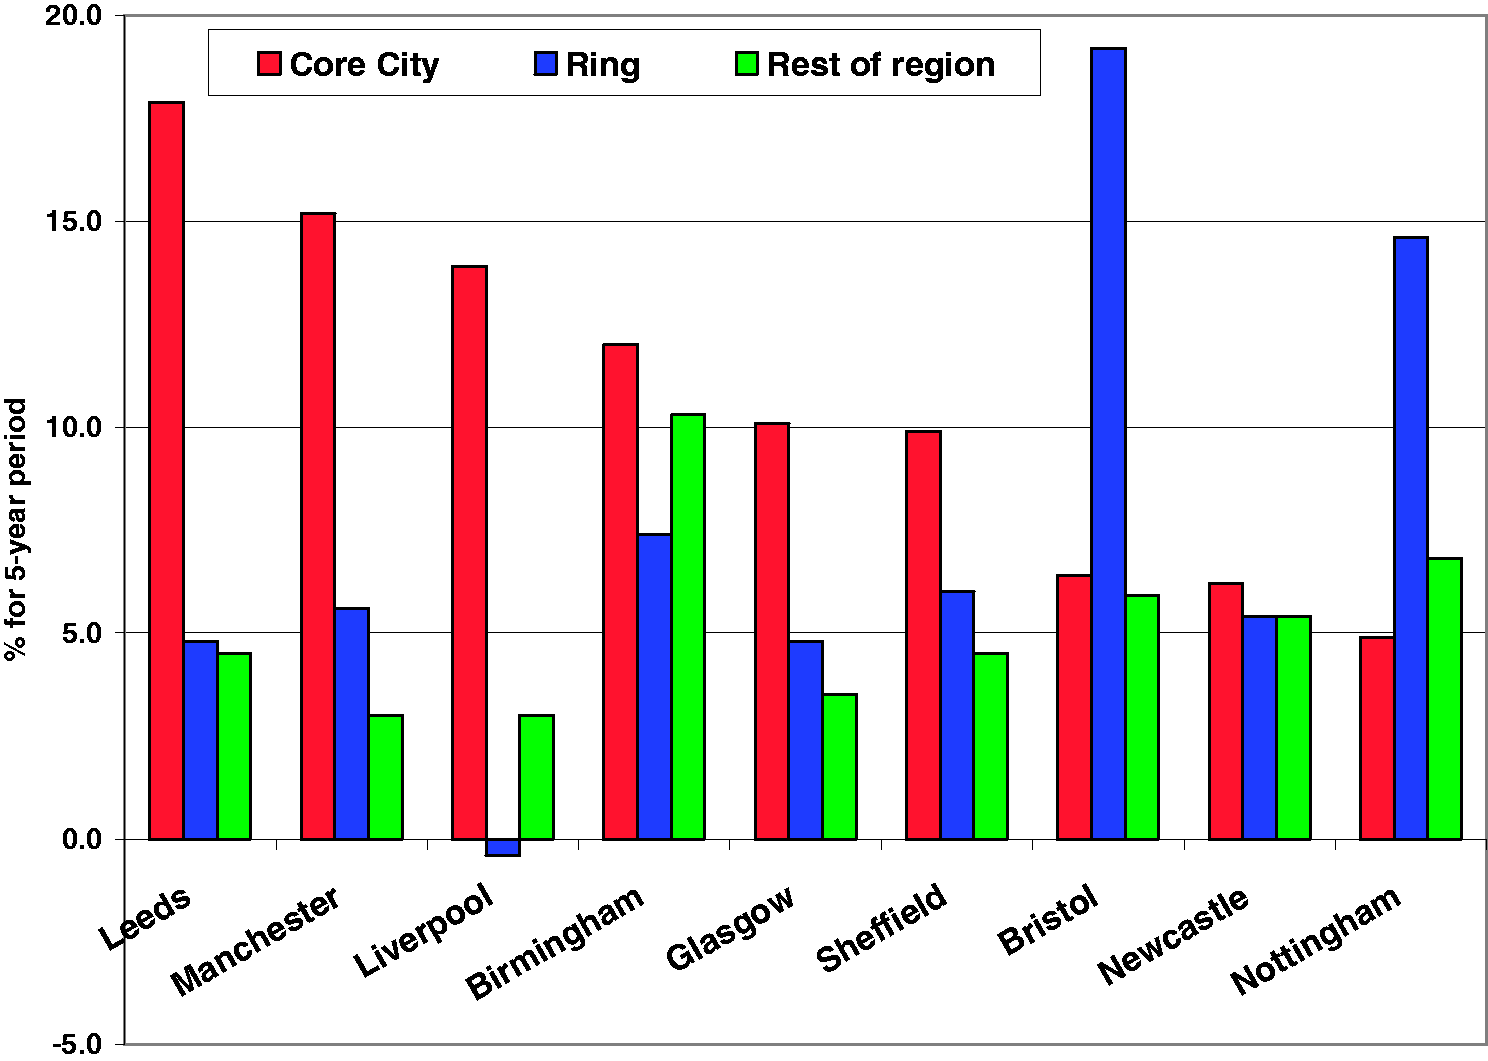
Change in workplace-based total employment, 2012–2017, by Core City (Source: calculated from APS data. Cities are arranged by Core City rate. The national comparator rate for Great Britain is 7.7%).
Clearly, therefore, the aggregate pattern of employment growth falling with increasing distance from the city is by no means universal. Indeed, it is substantial in only three of the nine cases, namely Manchester, Glasgow and Sheffield. It is the very strong growth of their rings that stand out for Bristol and Nottingham. Apart from the latter, though, the prevailing pattern is one of city dominance, most notably for Glasgow, Leeds, Liverpool, Manchester and Sheffield where the cities far outstrip the two other types of places.
In terms of differential growth by the types of worker shown in Figure 1, a breakdown for the nine separate cases (data not shown here) reveals a fairly common swing back to full-time employment and a rough parity of growth rates between males and females. Both of these features show fairly systematically a reversal of the post-recession trends which were reported by Townsend and Champion (2014) among others. Moreover, the pattern of a regular drop-off in rates of change away from the cities is particularly evident in the statistics for self-employment. The cities themselves show stronger percentage growth than the other types in seven of the nine cases, with increases of a third or more in six of the nine cases, and an average of 25.8%. In all, this growth in the numbers of self-employed accounted for more than a fifth of Core Cities’ employment growth.
We contend therefore that self-employment is rather central to the recent economic expansion of these cities. This is why this article moves on from our previous practice (Champion and Townsend, 2011, 2013) of relying exclusively on BRES and its predecessors to now defining total employment from the APS as in Townsend and Champion (2014 in this journal) which allows full coverage of the self-employed within the analysis. The APS also affords the opportunity for socio-economic insights including the identification of disproportionate increases in white collar and professional employment.
Types of employment growth
What lies behind the outstanding employment growth of the Core Cities over the past decade? Was their strong performance compared to the national rate and those of their rings and regional remainders due to an increase in particular types of economic activity or did it take place across the board? In this section we answer this question by reference to two key dimensions of employment, namely occupational status and industrial sector, mainly at the broadest level of their classifications but with more detailed sector breakdowns where appropriate and also with some cross-tabulation of occupation within industry. In order to minimise the effects of sampling error but also to concentrate on the main features of these breakdowns, we treat our nine cities as a single aggregate, as also for their nine rings and the rest of the seven regions in which they are situated.
The results for the breakdown into nine occupational Standard Occupational Groups (SOCs) on this basis are shown in Figure 3. Focusing initially on the Core Cities (the top bar in each panel), it can be seen that it is the three highest-status groups that have spearheaded their employment growth in relative terms, led by Associate Professional and Technical (SOC 3) with an increase of 22% over the five-year period 2012–2017, followed by the 21% increase registered by Managers, Directors and Senior Officials (SOC 1) and 18% for the Professional group (SOC 2). These three growth rates are around twice as high as the roughly 8–10% recorded by next strongest groups (SOCs 5, 6 and 9, comprising skilled trades, elementary work and caring, leisure and other service occupations). Meanwhile, their numbers of administrative/secretarial (SOC 4) and process/plant/machine-operative (SOC 8) occupations grew much more modestly and that of sales/customer-service (SOC 7) actually contracted in this period, albeit only marginally. With the latter exception, it would therefore appear that the cities’ growth was across the board in terms of occupational groups, but unevenly so. On the basis of the actual numbers (not shown here), fully three-quarters (77%) of the overall increase in their employment was generated by the three professional and managerial groups.
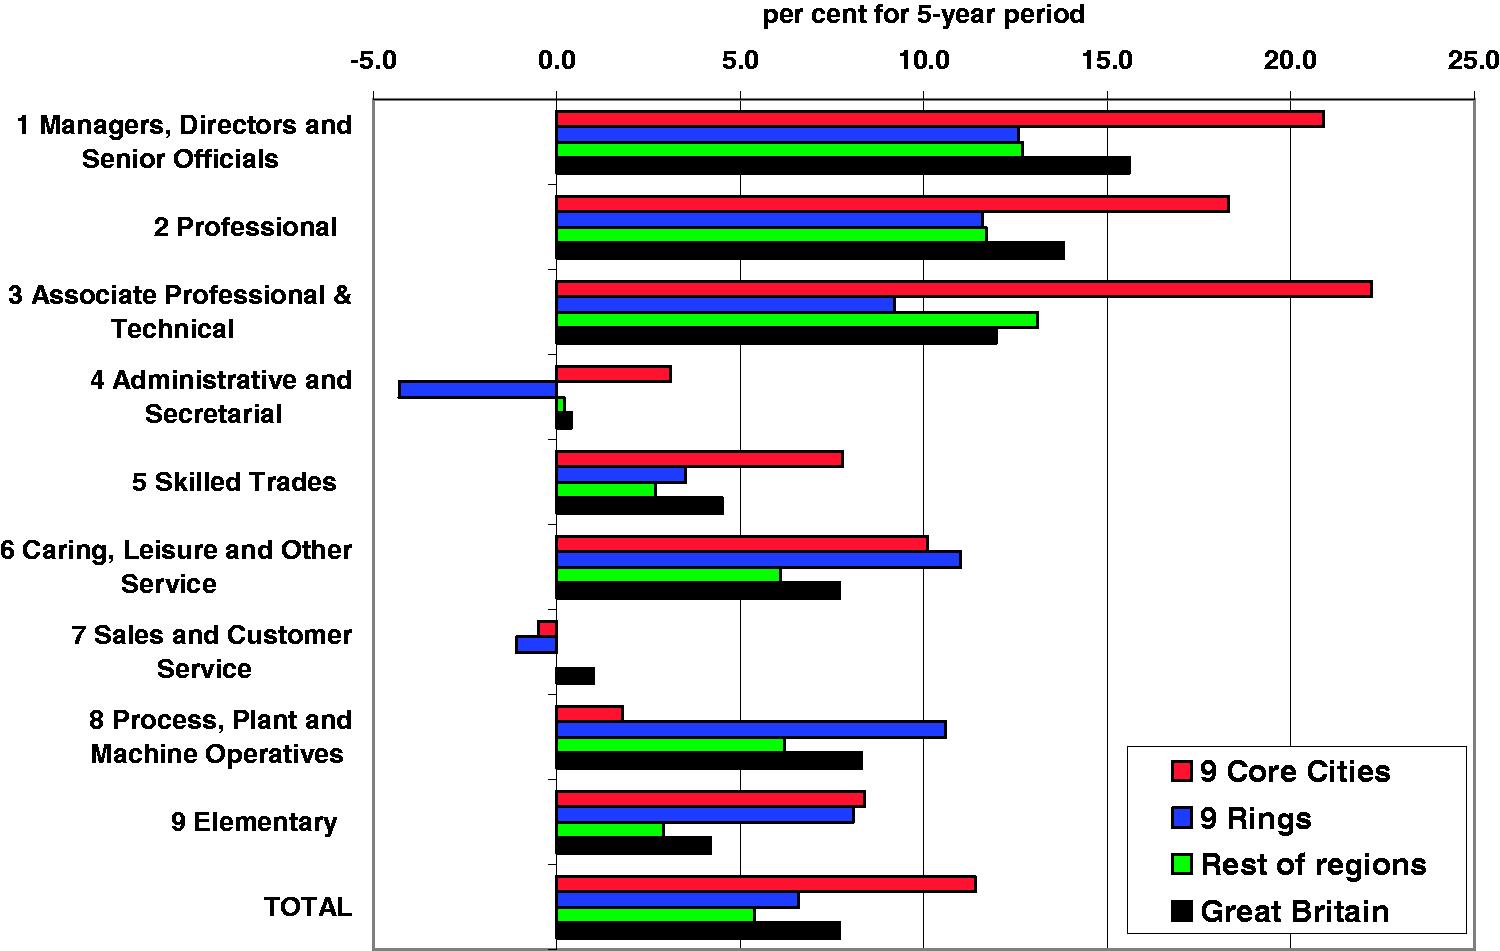
APS workplace-based employment change, 2012–2017, by SOC 2010: Core Cities compared with their rings, regional remainders and Great Britain (Source: calculated from APS data).
In this achievement, the nine cities were somewhat ahead of the national pattern, because for Great Britain as a whole the proportion of total employment growth contributed by SOCs 1–3 was somewhat lower at 72%. In fact, the cities might have been further ahead of the national share if they had not also performed relatively strongly in most of the lower-status occupational groups. In fact, as shown in Figure 3 (by comparing the top and bottom bars in each panel), it was for only two groups of occupations – sales/customer service and process/plant/machine-operatives (SOCs 7 and 8) – that the city aggregate fell short of the national rate, these reflecting their further advance down the path of transfering out of manufacturing and physical services. For the three highest-status occupational groups and especially SOC 3, the cities eclipsed the national performance to an impressive degree.
Similarly, the way that the cities’ rings and wider regional remainders performed more poorly than both their cities and the national average for total employment (as shown in the bottom panel of Figure 3 as well as in the previous section) is replicated for the majority of the nine occupational groups. Amongst the three highest-status groups, there is only one exception; namely that their regional remainders saw their SOC 3 grow slightly faster than the national figure, though still well short of the cities’ rate. Across the lower groups, the pattern is somewhat more variable. The main roles found here for the city rings is that they performed relatively strongly for three of the six groups, exceeding the national rate for caring/leisure/other-service, process/plant/machine-operative, and elementary occupations and outdoing the cities’ rate in the first two.
The overall picture in terms of employment change by occupation over this five-year period is thus one in which our Core Cities appear to be in the vanguard of the national tendency towards the stronger growth of the higher-status groups. Secondly, while there is some evidence of growth weakening with increasing distance from the cities, as is the case for total employment, the main impression evident from the nine-way grouping is of the cities outstripping both their immediate rings and the rest of their wider regions, this being most notably the case for the top five occupational groups. By contrast, the rings have performed relatively strongly lower down the skills ladder and suggest a more broadly based resurgence from recession with a greater reliance on more routine types of work than the cities. Meanwhile the regional remainders tend to match the rings at the higher-status end of the spectrum, but to lag behind them (and the national rate) at the lower end.
Turning to the other key dimension of employment structure, Figure 4 adopts the same format as used in Figure 3 in order to break down employment growth by industrial sector. If anything, the general dynamism of the cities themselves is even more evident here. Of the seven separate sectors shown (which exclude the farming, fishing, energy and water industries that account for very few city jobs), there are only two cases where the cities’ growth rate for 2012–2017 does not exceed the national rate for the sector. The manufacturing sector stands out particularly starkly, with its net loss of almost 8% of jobs contrasting with the strong growth otherwise. Even for the other sector where the cities grew at below the national average – transport and communications – they managed to achieve a 7.5% increase in jobs, while they exceeded 10% in all the others, including a rise of almost 20% in their ‘other services’ sector. In three of these cases – construction, distribution/hotels/restaurants and especially public-administration/education/health – their growth was getting on for twice the national rate.
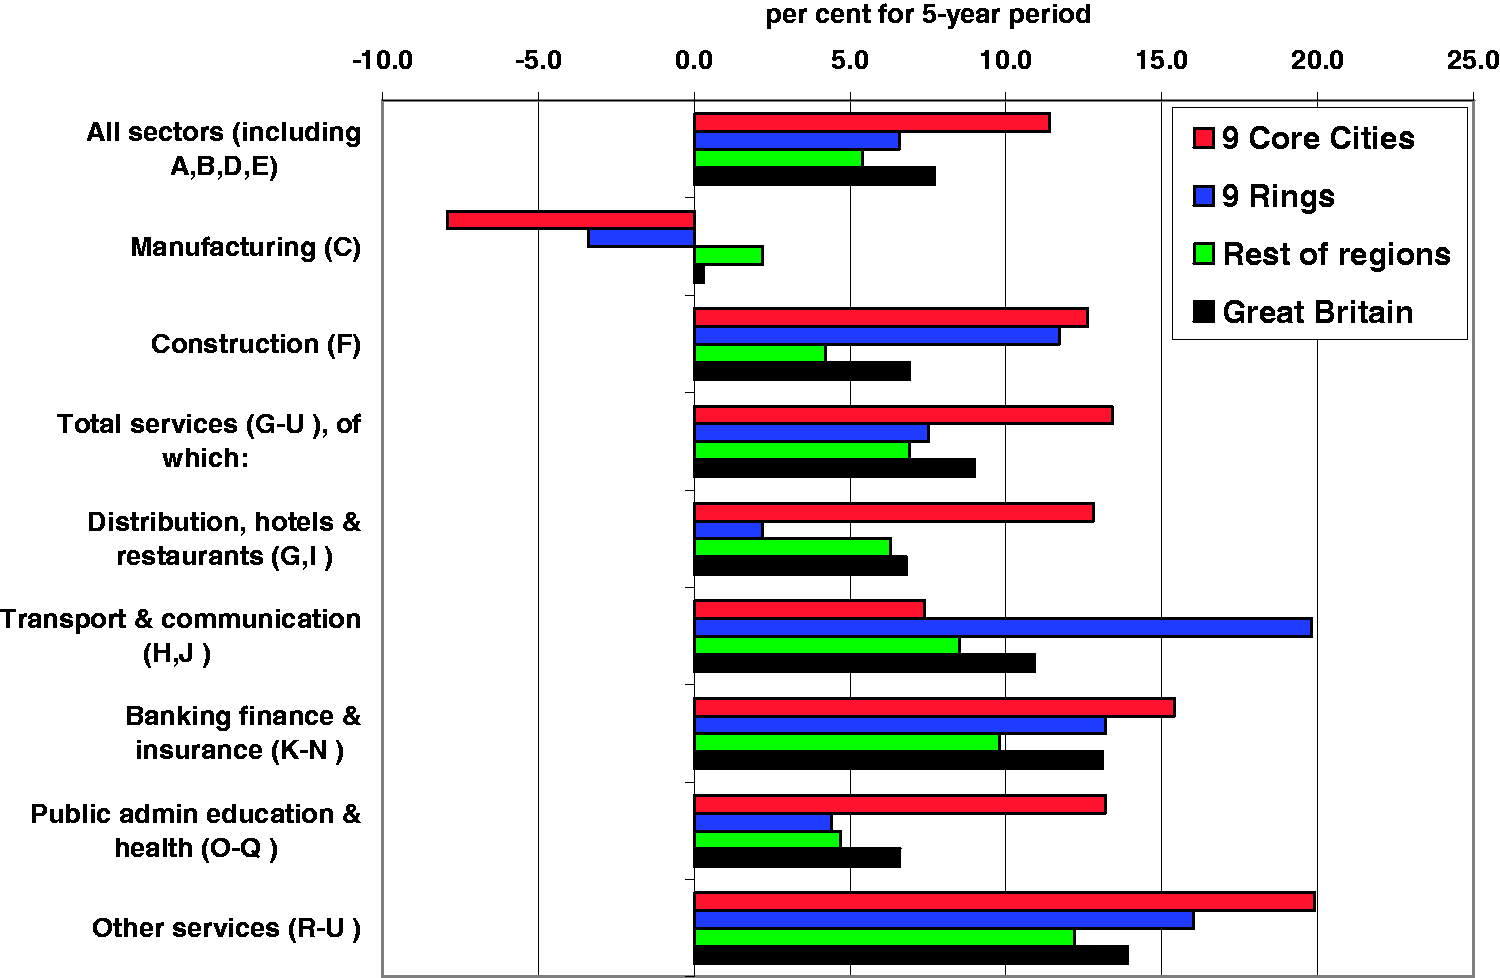
APS workplace-based employment change, 2012–2017, by SIC 2007: Core Cities compared with their rings, regional remainders and Great Britain (Source: calculated from APS data).
Not surprisingly, this means that in most sectors the cities grew faster over this five-year period than their hinterlands, as also shown in Figure 4. One exception is that of transport and communications where the rings grew hugely faster than either the cities themselves or the regional remainders, reflecting the strong growth of warehousing and logistics ‘out of town’. There are three cases where there is a regular reduction in growth rate from the cities through their rings to the rest of their regions that parallels total employment change, these being the construction, banking/finance/insurance and the ‘other services’ sectors. For the sectors labelled distribution/hotels/restaurants and public-administration/education/health, however, there is no such regular pattern, while the most distinctive case is that of manufacturing, where the reverse pattern of more positive change further away from the cities is reminiscent of the urban–rural shift of 30–40 years ago.
Figure 4 demonstrates the overwhelming importance of services in the employment resurgence of the nine Core Cities, with an overall increase of 13.4% over the five-year period (see the panel labelled G-U). For further insight into their growth, this APS-based data can be broken down into the type of work involved, distinguishing the self-employed and the ‘flexibly employed’ from the main group of employees. This is done in Table 1 for the five separate service-sector components.
Service-sector employment change, 2012–2017, by type of work, for nine Core Cities compared with the rate for Great Britain.
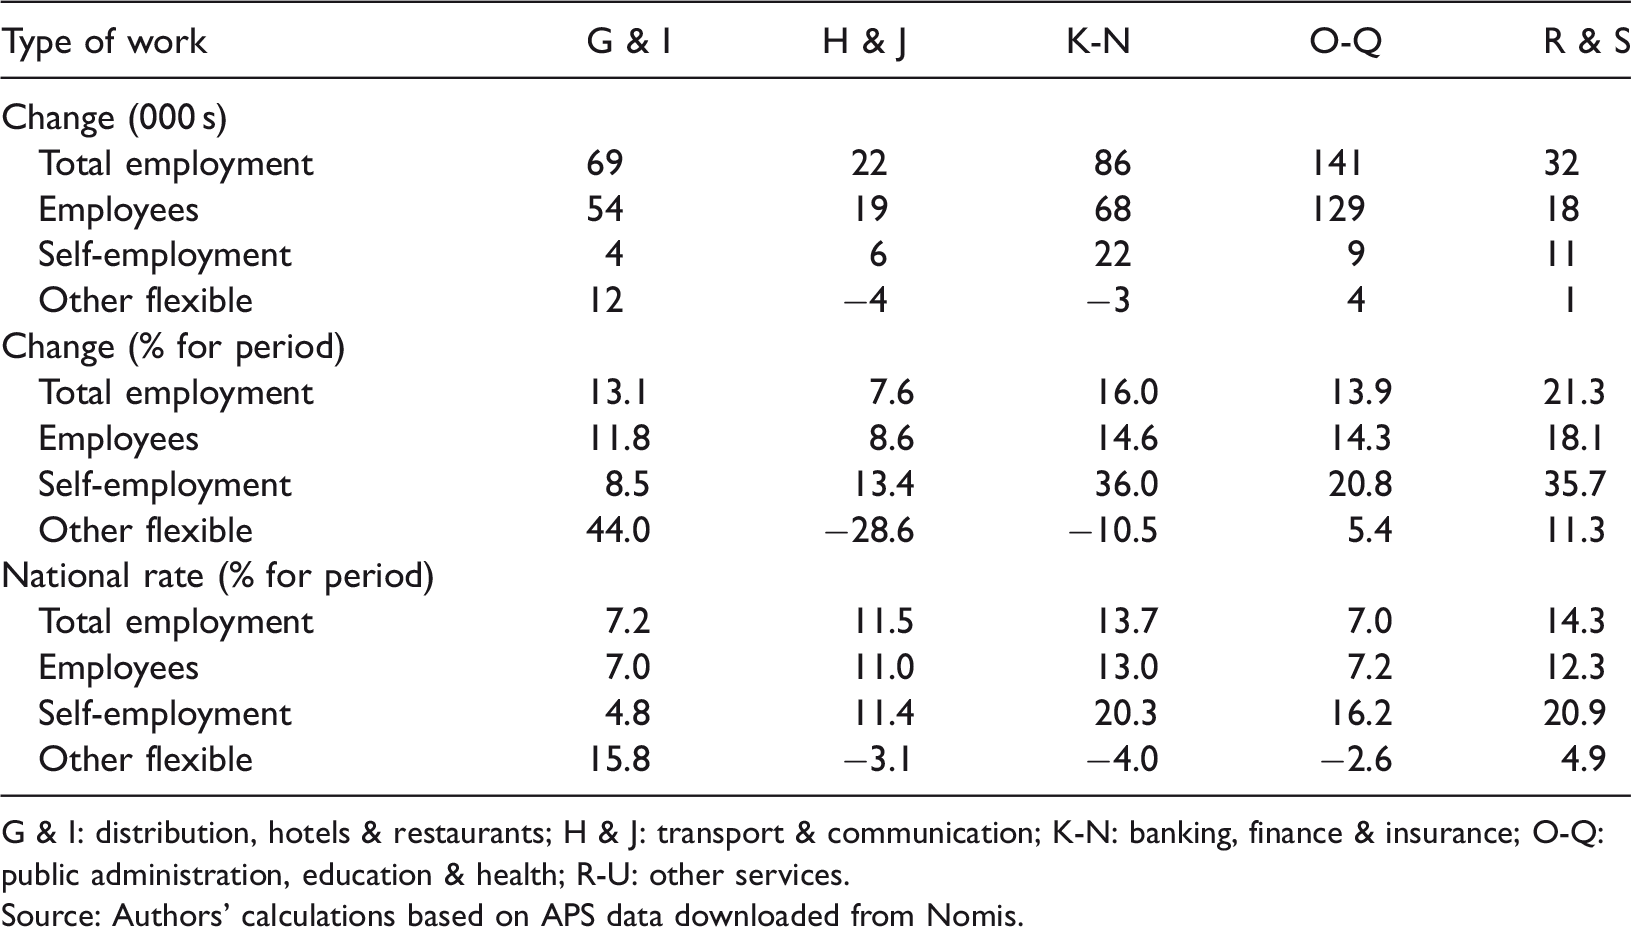
G & I: distribution, hotels & restaurants; H & J: transport & communication; K-N: banking, finance & insurance; O-Q: public administration, education & health; R-U: other services.
Source: Authors’ calculations based on APS data downloaded from Nomis.
The relative dynamism of self-employment in the Core Cities’ service-sector growth is very evident from this. As shown in the middle panel of Table 1, this grew at a faster rate than employees in four out of the five components, in fact by 52,000, accounting for 14.7% of the nine cities’ total service-sector increase over the five years. Moreover, for all five components their self-employed numbers increased faster than the national rate (shown in the bottom panel), with the strongest differential shifts being in K-N (but this probably more in small enterprises rather than the named groups of ‘banking, finance, insurance etc.’ – see below for more on this) and in R-U (the miscellaneous group containing arts, entertainment and recreation).
A further net gain of some 10,000 in the Core Cities’ service-sector growth over this period is accounted for by ‘other flexible’ people. These comprise temporary employees whose job is not permanent, not the respondent's intentions about that job, and include seasonal and casual work, fixed-term contracts and agency temping. As Table 1 shows, they are – perhaps surprisingly given the attention given them in recent journalistic and political commentary – not a major feature here, with the major point being that growth was confined principally just to the distribution, hotels and restaurants (G and I) component, and was not recorded as the main feature there.
More precise insights into the distinctive nature of Core Cities’ service-sector employment growth at this time can be obtained from the more detailed sectoral breakdowns available from the BRES, albeit with its data including only certain types of self-employment (see ‘Aims and approach’ section). Table 2 highlights the four-digit service-sector industries that changed most in job number between 2012 and 2017, i.e. by at least 7200 jobs in either direction, giving a total of 12 gainers and just two losers. The table also compares the five-year rate of growth for the nine cities with the rates for their two types of hinterland and also the national rate.
Change in employment for the four-digit service-sector industries recording the largest job changes for the nine Core Cities, by type of area, 2012–2017.
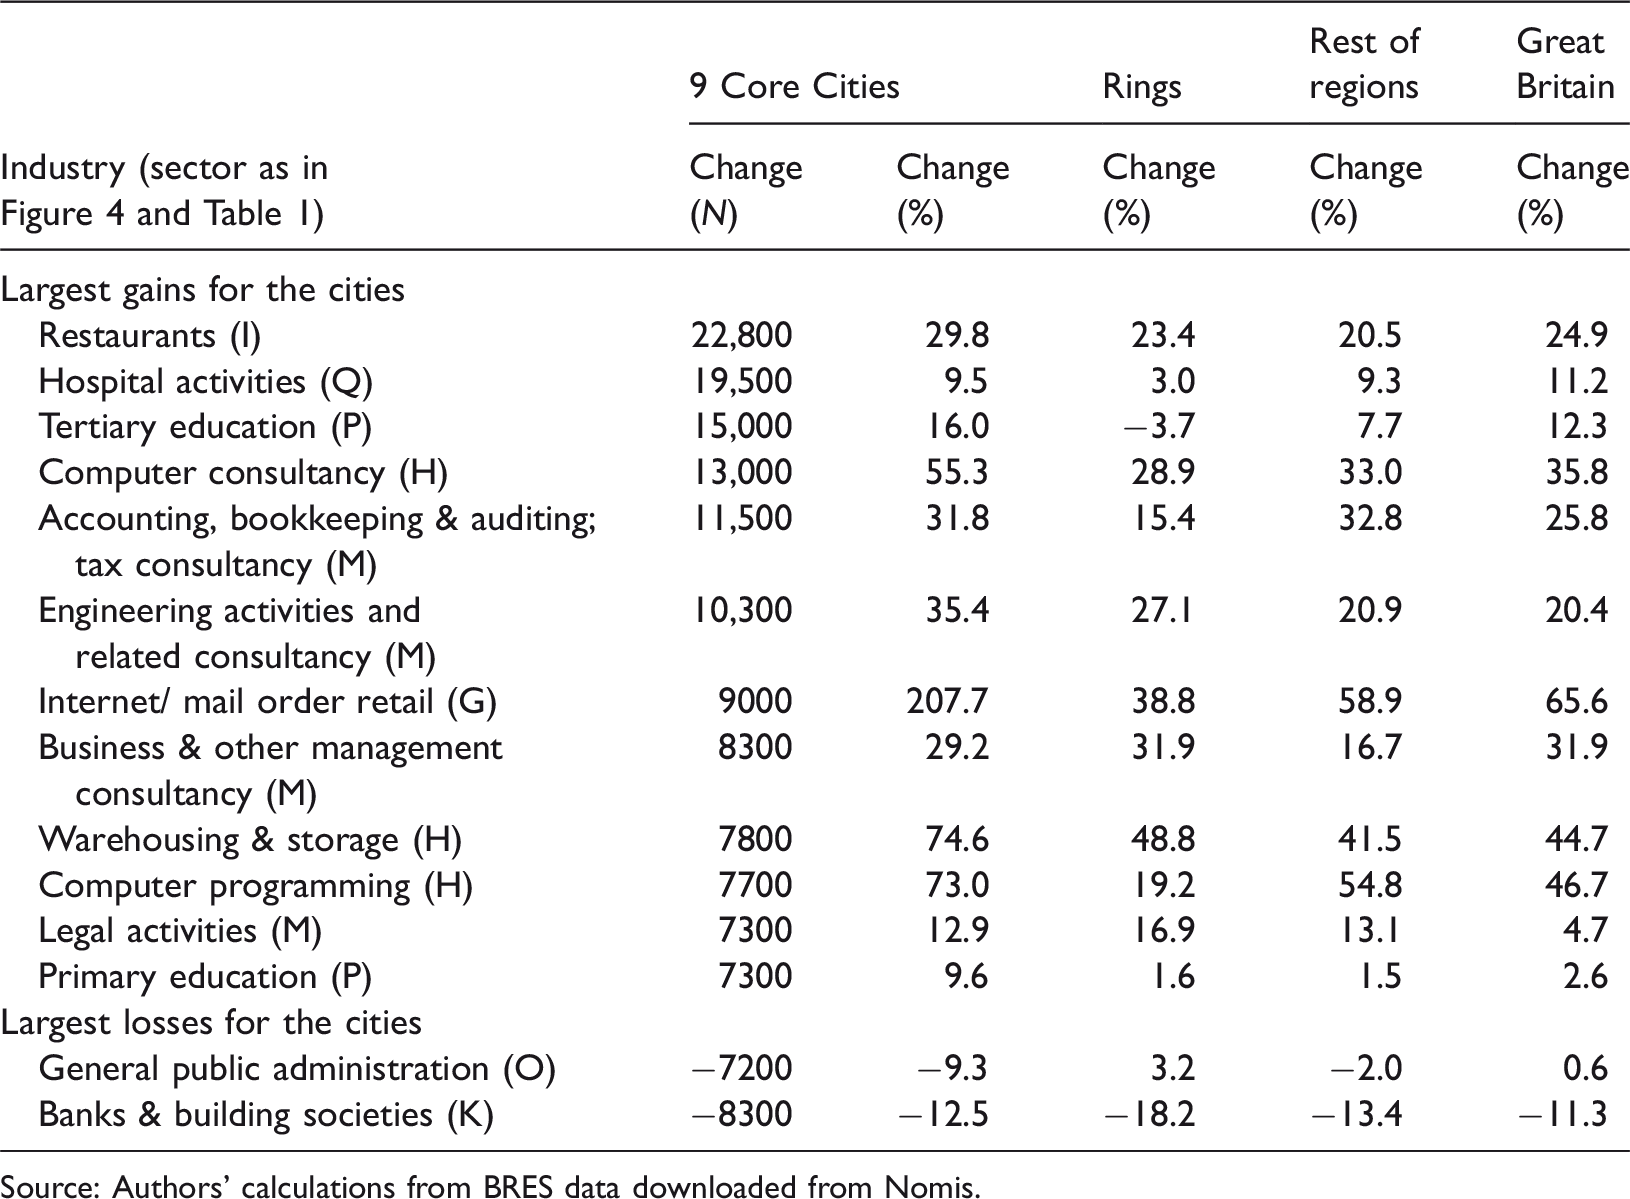
Source: Authors’ calculations from BRES data downloaded from Nomis.
What emerges from dividing up the higher-level groups used in Figure 4 and Table 1? As regards ‘public administration, education and health’ (O-Q), we find the Core Cities benefiting from being disproportionately home to two of the main national growth industries of ‘tertiary education’ and ‘hospital activities’. The role of tertiary, principally university, growth in this period will itself have generated many service multipliers (but these overall BRES data cannot include many student part-time employees, being for mid-September, i.e. before the start of the academic year). By contrast, the analysis from which this table is constructed also reveals that technical colleges and general medical practice, which are more widely distributed across the metropolitan rings and beyond, lost employment at around the national rate in all types of area (data not shown here because their total change was under 7200). At the same time, continuing from the 2008–2009 recession, Core Cities lost jobs in public administration itself – a significantly worse record than our other categories of area (see the penultimate row in Table 2).
In the case of ‘banking, finance and insurance etc’ (K-N), it can be seen that the very title of this group is out of date, this being due to internal structural change. On the one hand, continuing the restructuring initiated by the recession of 2008–2009, the number of those working in the Core Cities’ banks and building societies fell by over 8000 over the five-year period, a drop of one in eight in their staff – similar to that elsewhere in Britain except that the cities’ rings sustained an even greater relative hit (see the bottom row of Table 2). On the other, we see the strong growth of four industries classified as M, many of these tending to be serving other firms as producer and business services rather than the general public and thus growing faster in the Core Cities than in their surrounding areas. Nonetheless, as shown previously in Table 1, this sector overall diversified in Core Cities through a 36% growth in self-employment (suggestive of ‘tech start-ups’) together with growth at the national rate of 14.6% in employees. In this case, there was no general ‘differential shift’ in performance compared with national rates of change, simply strong growth due to the Core Cities’ inherited structural advantage in this sector.
These heads contain many of the leading business services which expanded each by 7200 or more employees in Core Cities, 2012–2017, as shown in Table 2 – notably activities in accountancy and law, together with engineering, management and taxation consultancy. Closer inspection of the table shows that these professional groups expanded at a higher rate in Core Cities than they did on the national scale, while they exert what appears to be a ‘shadow effect’ on the metropolitan rings, which expanded at a lower rate than the Core Cities, and in some cases the ‘remainder of regions’.
The ‘transport and communications’ group (H,J) provides three examples of growth at rates greater than 50% for the Core Cities, ranging across industries associated with both white collar and blue collar activities. From Table 2 we see not only the growth of computer programming and computer consultancy – no doubt including tech. start-ups – at rates far above the national average and the rates for the other two types of area, but also warehousing and storage featuring much stronger growth for the cities than elsewhere. There is even more of a shadow effect on metropolitan rings from ‘distribution, hotels and restaurants’ (G,I), with a high rate of growth from internet-based retail and mail-order activities, and faster than national growth in Core Cities in the largest single group of the list, restaurants, with a higher than national share of full-timers. This feature is supported by the growth of ‘pubs, bars and licensed clubs’, albeit this being too small to appear in Table 2 listing.
In sum, with all but two of the Core Cities’ 12 leading growth industries of 2012–2017 exceeding the national rate of growth, the main generators of their recent economic growth are broadly three-fold. In particular, they have greatly benefited from their very large institutional infrastructure of universities and hospitals. Secondly is their expanding role in the emerging internet economy of computer programming, consultancy and internet sales. Thirdly, they have seen the strong growth of professional business services (rather than banking, building societies and public administration), together with supporting hospitality services.
By contrast, the cities’ rings – while expanding their employment in all but one of the Core Cities’ 12 main growth sectors – fell behind the Core Cities in all but two, as well as falling behind the national rate in the majority of these headings. Although there is research evidence of office decentralisation in particular circumstances (as to Manchester Airport or to the M4 strip north of Bristol), it appears that even the geographically closest of ‘left-behind towns’ to the Core Cities are poorly equipped with a sectoral and professional structure to re-assert their economic position (Industrial Communities Alliance, 2020; Maclennan and McCauley, 2019; Tomaney and Pike, 2018).
It is not within the scope of this article to prescribe solutions to the problems of the ‘left-behind towns’. While the use of workplace employment data is meant to provide a closer approach to causation in terms of location in economic geography, it is not meant to exclude the great importance of cross-boundary commuting to Core Cities from metropolitan rings and beyond, to be considered in relevant strategic and transport planning. However, the issues clearly extend far beyond this in terms of skills training, town-centre improvement and community regeneration in LBPs.
How far do these results reflect international trends?
In first and second sections, the article made international comparisons. The emphasis on white-collar services (K-N and O-Q) shown in the chart and tables of the last section carries new interest, both domestically for showing the stage of dominance which they have reached in the overall trends of the cities of provincial Britain, and also internationally because we find that these trends are also well established in other countries. It is relevant to hark back to Gottmann (1961). One wonders whether a new distinction should not be introduced in all the mass of nonproduction employment: a differentiation between tertiary services – transportation, trade in the simpler sense of direct sales, maintenance, and personal services – and a new and distinct quaternary family of economic activities – services that involve transactions, analysis, research, or decision-making, and also education and government. (p. 576)
‘This evolution is a world-wide phenomenon, certainly well advanced all over the United States and in several European countries’ (p. 566). ONS’s sharing of an SIC with Eurostat enables us to compare the record of our major sectors with those of the EU28 and its leading city regions. Chi-squared test scores (Townsend, 2019) were used for each of 19 industries to determine whether there was a significant difference between the expected frequencies and the observed frequencies by country for 2013–2018. In this case, the greatest similarity across the 28 countries in rate of change was shown by industry M, Professional and Scientific Services, followed by P, Education, J, Information and Communication, and Q, Health and Social Work. That is to say, the most expansive groups in Figure 4 and Table 2 in Britain’s Core Cities were sharing in a reliably widespread international growth of white collar employment.
At the EU scale, we have to make any comparison at the scale of city regions, specifically at the level of NUTS 2 areas. In the UK, these usually equate with former metropolitan counties, like our EU cases both including and surrounding second-order cities; in the EU the second cities of the seven largest other EU countries by population (see note to Figure 5). What is most marked, using Eurostat data throughout for the seven combinations of sectors used in Figure 5 and the previous tables and charts, is that:
Britain’s city regions exceeded the rate of employment growth in all service sector groups for the average of the seven EU city regions and in the EU as a whole; Remarkably Great Britain’s rates of employment increase exceed those of the EU in all the service sectors and in employment as a whole, though with the notable exception of manufacturing.
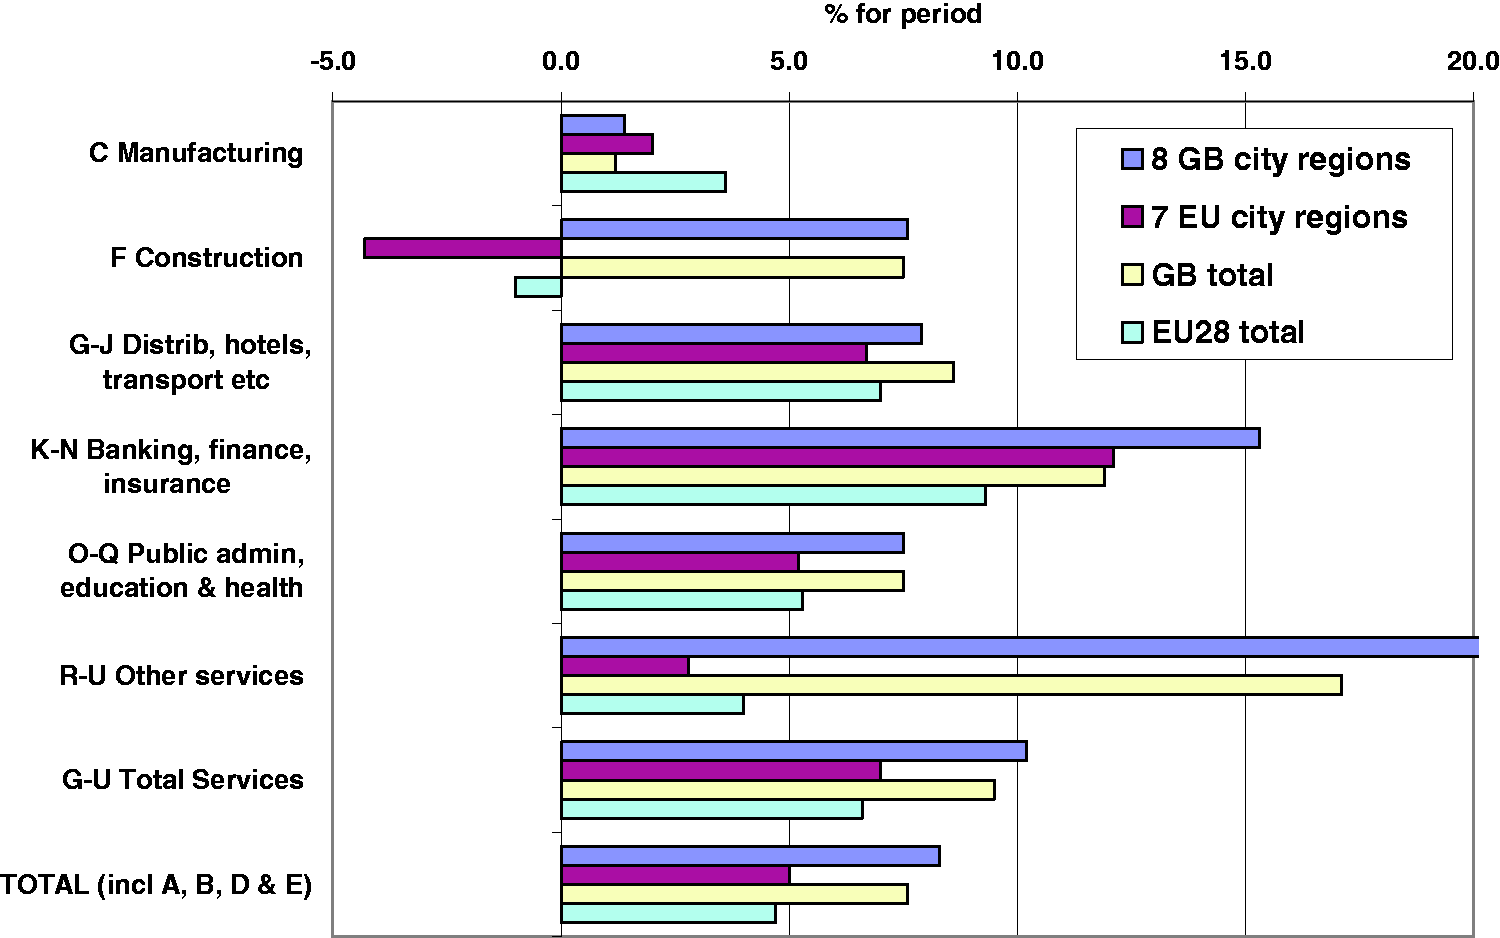
European employment change, 2012–2017, by sector, % for period (Source: Calculated from Eurostat data for NUTS2 areas. The eight GB city regions exclude Glasgow (West Central Scotland). The seven EU city regions are the second-largest NUTS2 areas of the EU27’s seven largest countries (by population): Antwerp, Hamburg, Barcelona (Catalunya), Marseille (Provence-Alpes-Cote d’Azur), Milan (Lombardia), Rotterdam (Zuid Holland) and Krakow (Malopolskia)).
These results are a reminder of a more fundamental feature of the UK economy, namely the widely commented lack of productivity improvements since the 2008 recession in both the country and its Core Cities (Core Cities UK, 2020), which themselves lie beyond the scope of this article.
Conclusion
This article has aimed at a better understanding of the growth spurt which Britain’s second-order cities recorded in the 2010s and its implications for the surrounding sets of smaller cities and towns that have collectively been labelled ‘left-behind places’ (LBP). We have approached this task by calculating change in workplace employment for 2012–2017, using three-year averages around these two dates to minimise the effect of sample error, and disaggregated the total change by type of worker, occupational status and industrial sector. Our primary focus has been on the nine cities that we have examined in previous work, namely the current members of the Core Cities Group bar its two most recent joiners, comparing their record with that of Great Britain as a whole and with their hinterlands, the latter being split between their adjacent ‘metropolitan rings’ and the rest of their regions.
Our results provide clear confirmation of the great strides made by Britain’s second-order cities in the 2010s indicated by other recent observations (e.g. Beatty and Fothergill, 2020). Given their generally lacklustre record in previous decades (Champion and Townsend, 2013; Townsend and Champion, 2014), it has been impressive to see the nine Core Cities’ growth over the five-year study period exceeding the national rate by a considerable margin. We have found this to be the case for all the main types of worker – male, female, full-time, part-time, employees and especially the self-employed – though, significantly, with declining shares of part-time and flexible jobs in the structure of growth. All but one of our seven Northern cities surpassed the national rate, the exception being Newcastle. Moreover, compared to the national average, the nine in aggregate are characterised by particularly strong growth in the three highest-status occupational groups, namely managerial, professional and technical work, and in all the broad industrial sectors apart from manufacturing and transport. In particular, they have benefited from being home to universities and hospitals, plus a wide range of business services and hospitality. Also, their growth outpaced that of a set of EU comparator city regions in all broad sectors apart from manufacturing at this time.
By the same token, however, the Core Cities’ employment growth over this period outstripped that of the areas forming their local and regional contexts, both in aggregate and for fully seven of the nine cases, the exceptions being Bristol and Nottingham. It was not that the their ‘rings’ and the rest of their regions experienced a decrease in jobs (except in the one case of Liverpool’s ring), but that this was a period of national job growth (+7.7% for the five-year period) and these areas fell short of that in all but three cases, these being the rings of Bristol and Nottingham and the rest of Birmingham’s region beyond its ring. Our aggregate analyses show that both parts of the cities’ hinterlands lagged behind the national rate of growth for all six types of worker that we examined. Even in terms of our main occupational and industrial breakdowns, there were relatively few instances of either of these area types significantly outperforming the national rate: somewhat more commonly for the rings – this for three out of the four lowest-status occupations along with construction, transport and ‘other services’ – but for the regional remainders only for manufacturing. On this basis, during the 2010s the parts of the country that are home to the majority of its ‘left-behind places’ were generally trailing the Core Cities in the quantity of their employment growth and, also to a large extent, in its quality. This suggests that the skills of the cities’ workforces were both cause and expression of their richness of jobs. But we must also remember that this richness is due not only to agglomeration providing efficient trading links between firms, but also to size underpinning their higher order activities, compared with other areas, whether in the retailing ‘hierarchy’ or the status of their hospitals and educational institutions.
Against the background of these findings, what would we expect for the prospects of our cities’ rings and their regional remainders? We have found very little evidence of trickle down: Table 2 shows divergence of trends between cities and their rings. In any case, normally ‘trickle down’ occurs as a national economic recovery matures, with growth spreading out regionally from the South East and – to a more limited extent – hierarchically from London to the second-order cities, but its strength often fades over time before diffusing to LBPs. But even more crucially perhaps, how sustainable is the sort of recent growth observed for the Core Cities themselves, and to what extent is it the sort of growth that could trickle down to the LBPs, remembering that we typified the larger ones as North Staffordshire, Lancashire, Tees Valley, Humberside and the Derbyshire Coalfield? The data we have analysed do not themselves lead to clear conclusions, but there are possibly two lines of argument, both negative: a lot of the Core Cities’ growth has been in the ‘quaternary’ types of economic activity that are associated with larger agglomerations; and a lot has been in low-productivity activities, as reflected in the lack of productivity increase in Britain’s regional cities since the 2000s. There is a broad policy conclusion here indicating that LBPs cannot rely on trickle-down even in normal times – direct interventions are needed and on a larger scale than the Town Deals, so as to achieve the ‘levelling up’ promised by the Johnson government both between and within the regions. As part of this, there should be a push on investment not only in transport (The Economist, 2019) but in Further Education, a sector that is more widely represented in LBPs than is the HE sector.
At the time of writing, however, the foreseeable future is dominated by the effects of Brexit and Coronavirus. Most analyses of Brexit expect its effects to be concentrated on physical trade, such that economic losses will be felt most in manufacturing areas – and, in the case of a ‘no-deal Brexit’, particularly in the so-called ‘Red Wall’ constituencies (Partington, 2020). By contrast, the main employment effects of the pandemic would seem to be much more nationwide, but places specialising in sectors like oil, air transport and vehicle and aircraft manufacture are expected to be badly affected, at least in the short term. In the medium term, cities are seen as enjoying a good structural position through their resilient service industries. However, some activities – even universities perhaps – may be subject to redundancies. Much of the recent job growth which we have identified is in firms that are not as well rooted as longer-established enterprises and also possibly in more precarious work as self-employed or flexible workers, even if mostly full-time. A further threat to the cities is the partial replacement of the pattern of office commuting by electronic working from home. If this is only for part of the week (helped by new part-time rail season tickets), it may not even be visible in future employment figures. Nonetheless, it is already the subject of wide comment about the fate of city hospitality sectors, notably the restaurants which headed the growth list in Table 2. A reduction in commuting would relieve the railways of the congestion and timetabling problems created by the job growth we have seen in Manchester, Birmingham and Leeds. If much of this home working continues after the relaxation of lockdown, then there will be some direct benefit to the LBPs’ local spending while the Core Cities’ hospitality and retail sectors continue to suffer. Indirectly, there is wide reporting (e.g. Gallagher, 2020) that more people may find it desirable to move home out of the major cities to the rings and wider areas around them, if they can work from home most of the time. Unusually, one firm went further (Kollewe, 2020) in saying that the pandemic has prompted a shift of offices themselves: ‘It’s a pivot into the suburbs and the rings around London, Birmingham and Manchester’. This is a useful reminder that the growth of Britain’s Core Cities has fluctuated considerably over the last 20 years, while a widespread revival of Midlands and Northern regions can only be viewed as tentative.
Footnotes
Acknowledgements
The authors are grateful to two anonymous referees for their helpful comments on the first version of this paper.
Declaration of Conflicting Interests
The author(s) declared no potential conflicts of interest with respect to the research, authorship, and/or publication of this article.
Funding
The author(s) received no financial support for the research, authorship, and/or publication of this article.