
Abstract
Policymakers often rely on pre-release polls to design and deploy public health apps. However, these apps often fail to realize their full potential because the actual size of the user population is significantly lower than expected, and the characteristics of those who use the app differ from those previously inclined to install it. This study aims to understand the success of public health apps by examining shifts between expected and actual user populations during app releases. Rooted in the context of public health apps, we identify factors that potentially intervene in the time between an initial poll of intentions and actual behavior. We delineate two deviations between stated installation intentions in polls and actual installations at an individual level, which have been commingled in literature thus far: inclined nonusers (Type I deviation) and disinclined users (Type II deviation). By introducing this distinction, we hypothesize that app releases can suffer from (1) a volume shift, which results in overly optimistic expectations of user numbers, and (2) a profile shift, which results in biased expectations of user profiles. Using data from a multi-wave survey, we find evidence for the postulated deviations. Our findings also unveil how contextualized factors from the health belief model can explain the occurrence and extent of these deviations. The findings contribute to information systems research that aims to predict technology adoption based on behavioral intentions. The results also offer actionable guidance for policymakers who rely on stated intentions in polls to tackle public health issues.
Introduction
The development and utilization of public health apps have become an integral part of the public response to societal health issues (Budd et al., 2020; Skatova and Goulding, 2019; World Health Organization, 2015). Considering that public health apps require citizen participation to realize their potential, expectations regarding the number of users and their characteristics (i.e., the user population) based on user polls are a key indicator for policy and investment decisions (Grundy and Bloomberg, 2022; Moreno López et al., 2021). However, a fundamental question arises: Can policymakers rely on polls that capture citizens’ intentions for technology acceptance (Binzer et al., 2024; Fox and Connolly, 2018; Sun et al., 2013; Vidal-Alaball et al., 2019) before the app is released? The accuracy of polls predicting user engagement with public health apps may be compromised by various factors, including the tendency of respondents to provide socially desirable answers, individual differences, as well as the inherent uncertainty about the app prior to its release (Hulland et al., 2018; Lin et al., 2021; Podsakoff et al., 2003).
Given this situation, it is unsurprising that actual public health app adoption often fails to meet the high expectations set by pre-release polls (BBC, 2022; LeMonde, 2018; The Guardian, 2022). A recent prominent example in which the actual user population deviated remarkably from polling data was COVID-19 contact-tracing apps. These apps promised effective tracing of infection chains to facilitate prompt quarantining of potentially affected individuals, thereby breaking the chain of infections (Ferretti et al., 2020). However, the app’s efficacy hinged on the size and characteristics of the user population (López et al., 2021). At the beginning of the COVID-19 pandemic, promising poll results on tracing apps led policymakers worldwide to expect population-wide readiness (Aitken et al., 2020; Civey, 2020; Ipsos Mori and Affairs, 2020). However, following the release of tracing apps, actual user populations often differed significantly from what officials had expected. In Germany, for example, uptake within the first 6 months was only half of what was expected (RKI, 2020). 1 Moreover, compared with expectations, the user population leaned strongly toward individuals who tended to have a low risk of infection (e.g., home office workers compared with on-site workers) and low risk of mortality from infection (e.g., younger citizens compared with elderly citizens), and away from selected social milieus (e.g., migrants) (Bertelsmann Stiftung, 2021). These deviations between expected and actual user populations surprised policymakers, thereby eliciting an unfortunate situation in which the app could not realize its full technological potential to fight the spread of the virus (Munzert et al., 2021; Vogt et al., 2022).
We argue that there is a strong need for a better understanding of the nature and reasons for shifts between expected and actual user populations of newly released technologies and their consequences for public health apps’ success. Extant research on predictions of user acceptance has identified behavioral deviations as the sources of shifts, thereby suggesting that fewer behavioral deviations yield more accurate predictions (Davis, 1993; Davis and Venkatesh, 2004). In turn, research on intention–behavior gaps in technology use has found that behavioral deviations tend to be the rule rather than the exception (Bhattacherjee and Sanford, 2009; S. S. Kim and Malhotra, 2005; Warkentin et al., 2016). Moreover, although pivotal IS research has identified contextual factors that explain intention–behavior inconsistencies (Limayem et al., 2007; Maier et al., 2012; Venkatesh et al., 2003; Williams et al., 2017), their perspective is predominantly correlational and fails to further characterize deviation types or provide contextual explanations for deviations that could serve as a basis for mitigation in the public health domain. Finally, while health app success has received significant attention in recent research (Chen et al., 2019), to the best of our knowledge, the consequences of biased expectations from polls during public health app releases remain unclear.
Against this backdrop, this paper aims to explore how and why deviations from polls affect the success of public health apps. To do so, we disentangle two types of shifts that are rooted in an app’s user population and need to be understood to exploit poll data more effectively: volume and profile shifts. The literature on intention–behavior inconsistencies and the concept of behavioral deviations at the individual level (Orbell and Sheeran, 1998; Sheeran, 2002) suggest that these shifts in the user population stem from two deviating behaviors at the individual level: inclined nonusers (i.e., individuals who expressed strong intent to adopt an app but did not follow through) and disinclined users (i.e., individuals who expressed weak intent to adopt an app but ultimately ended up adopting it). Better understanding the nature of behavioral deviations helps explain why expectations of an app’s user population are likely to be overly optimistic regarding the volume of users and may be biased regarding user profiles. Further, using contextual factors from the health belief model and longitudinal data from the introduction of a public health app in Germany, we provide empirical evidence on what explains the occurrence of different types of deviations that may threaten the success of public health apps. This study offers actionable guidance to policymakers on how to counteract behavioral deviations by anticipating specific biases in user predictions.
Our research aims to contribute to prior research in the following three ways. First, we contribute to the body of literature on the intention–behavior gap in technology use (Limayem et al., 2007; Venkatesh et al., 2003; Williams et al., 2017) by delineating the previously aggregated and one-dimensional concept of deviation into two distinct types of individual-level deviation: inclined nonusers (Type I deviation) and disinclined users (Type II deviation). In exploring individual-level deviations, we not only uncover disinclined users as a previously overlooked but important source of deviation, but we also enable research on inclined nonusers to better approximate the true impact of contextual factors on user behavior.
Second, we contribute to the literature on user predictions (Davis, 1993; Davis and Venkatesh, 2004) and showcase the importance of the disentangled perspective of behavioral deviations (i.e., volume and profile shifts) in the context of public health technologies. Our results suggest that both types of individual-level deviation elicit different negative consequences for the efficacy of public health apps. A volume shift results in a lower-than-expected user population, jeopardizing the public health app’s effectiveness, while a profile shift leads to a user population with different characteristics, potentially resulting in a flawed design of the app.
Third, we build on a unique longitudinal data set on COVID-19 tracing apps that allows us to explain individual-level deviations, and therewith volume and profile shifts, in the context of public health apps. That is, we examine why certain individuals inclined toward using the tracing app eventually decide against it (Type I deviation) and why certain disinclined individuals subsequently adopt the app (Type II deviation). Our results suggest that the well-established drivers of the health belief model play a moderating role in explaining behavioral deviations. Thereby, we provide contextualized insights into how our theoretical framework can yield novel insights and help uncover and explain unexpected biases in studies focusing on intentions and proxies for behaviors. Our insights into the magnitude and factors underlying the different types of deviations offer crucial, actionable guidance for policymakers who plan to introduce public health apps and intend to increase their chances of app success.
In the following sections, we first provide a taxonomy of technology (non)user groups, which serves as the foundation for the definition of inclined nonusers and disinclined users, and then provide a conceptual understanding of potential reasons for behavioral deviations from stated intentions. We proceed by discussing related literature on the intention–behavior gap and the health belief model, which are instrumental in developing our research model and hypotheses. We then present data from a three-wave survey collected before and after the release of the German contact-tracing app. Thereafter, we test our hypotheses and discuss their implications for theory and practice, the limitations of the study, and avenues for how our results can inspire future research.
Conceptual background
A taxonomy of technology (non)user groups in predictions of user acceptance
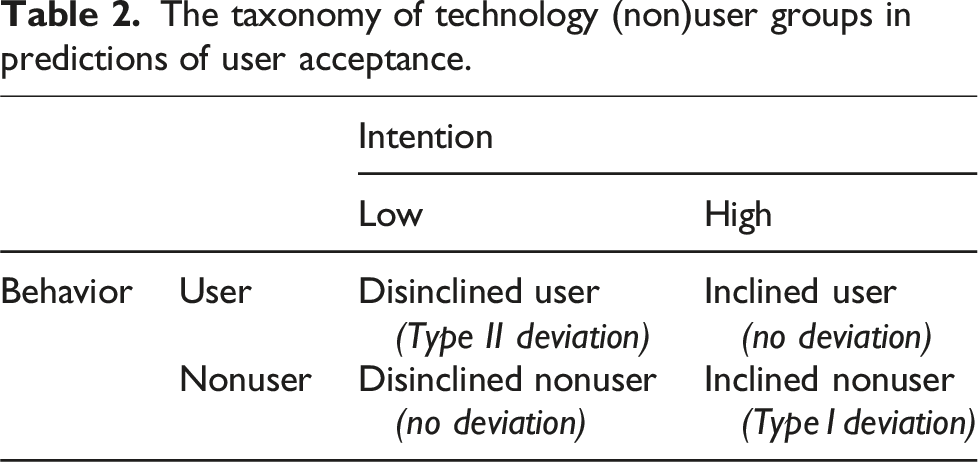
Previous research on predictions of user acceptance and the gap between intentions and behavior in technology use has treated the deviation between intentions and behavior as a binary variable (Bhattacherjee and Sanford, 2009; Davis and Venkatesh, 2004). This perspective only considers one type of deviation: deviating from expressed intentions irrespective of what they were. However, when examining shifts in predicted user populations, it is crucial to understand whether those individuals who stated strong intentions to install an app ultimately follow up and vice versa. For example, startups can miss their desired target groups if specific parts of the population do not buy into the service or product as expected. Platforms may not be able to provide enough local supply if there is a bias in predictions of acceptance and eventually fail. And above all, health services that are aimed at all sections of the population can unexpectedly miss their mark. Thus, the aggregated perspective of behavioral deviation from previous research is insufficient, as it does not allow any conclusions being drawn about the actual user population. Drawing on the literature on intention–behavior consistencies in the health literature and the concept of behavioral deviations at the individual level (Orbell and Sheeran, 1998), we contend that the one-dimensional understanding of intention–behavior deviations needs to be disentangled to delineate two types: inclined individuals who do not act on their intentions and disinclined individuals who act despite previously not intending to act.
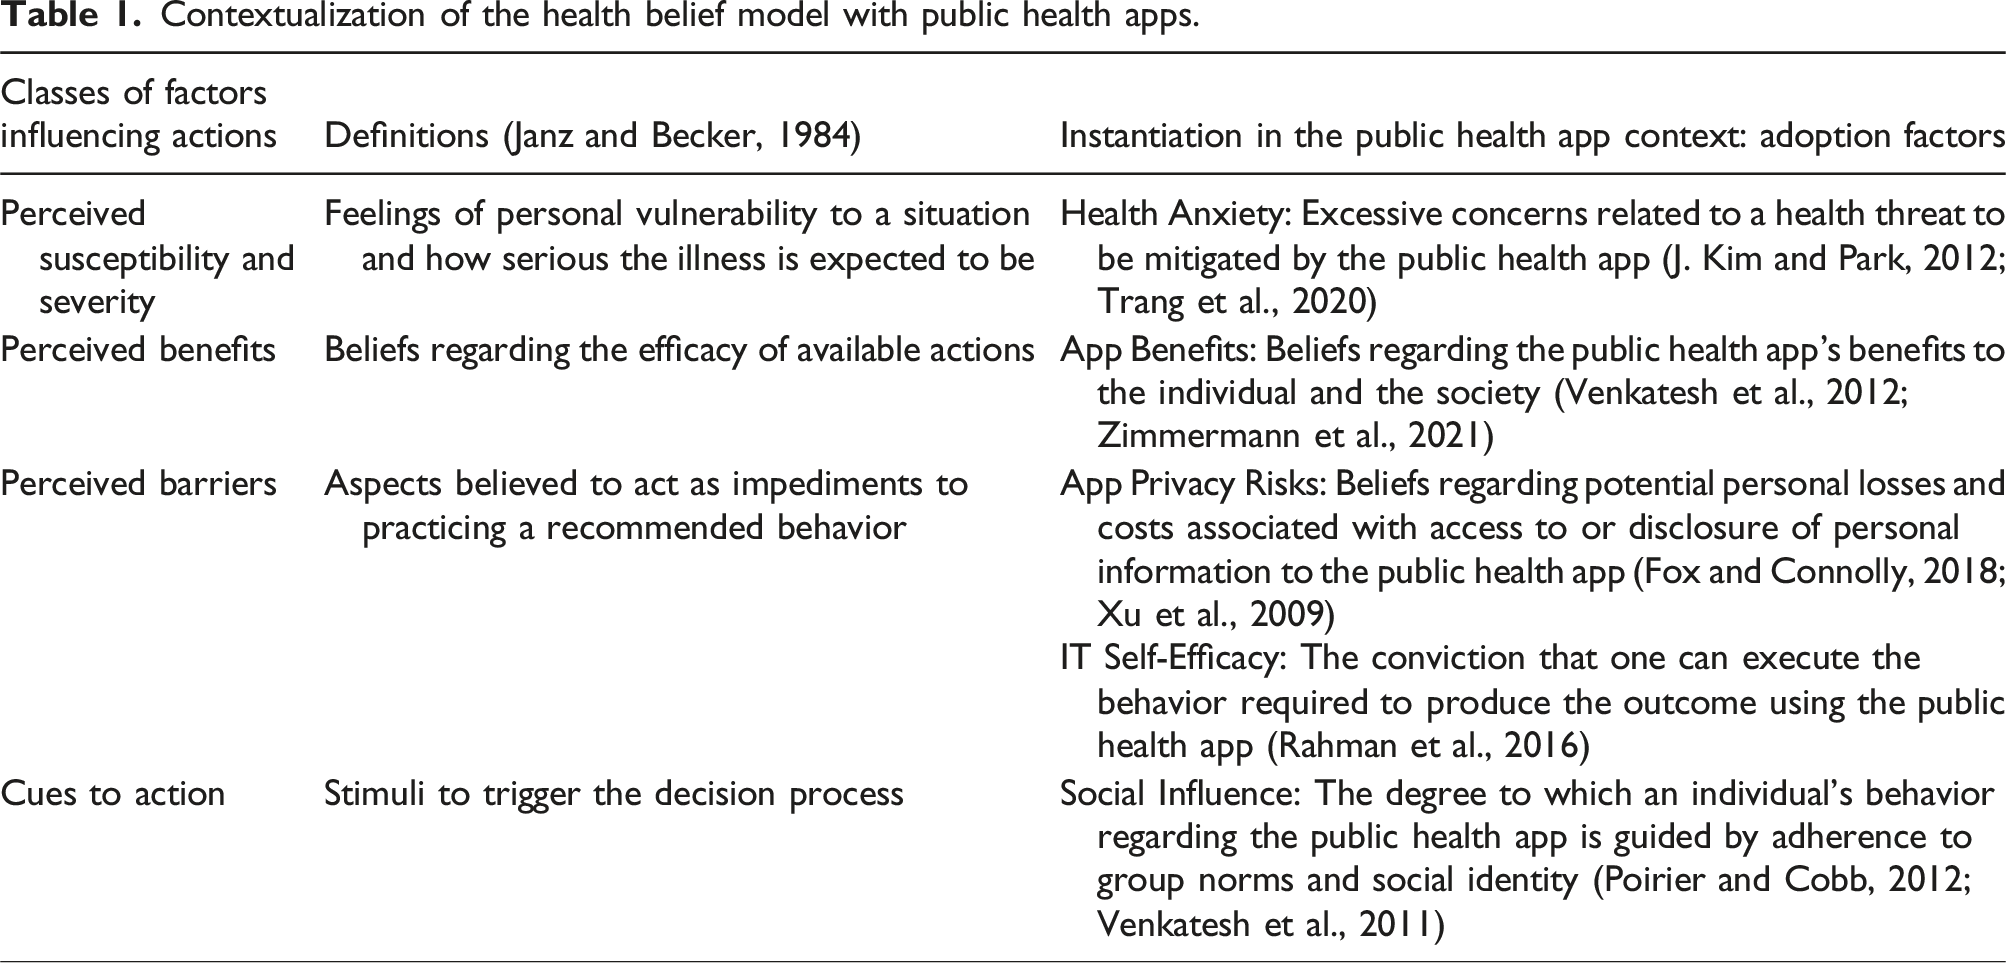
Contextualization of the health belief model with public health apps.
As we describe below, this taxonomy helps understanding the emergence of volume shifts (i.e., downward deviations when comparing the number of users in the predicted versus actual user populations) and profile shifts (i.e., deviations in the actual profile of the user population from the predicted profile) in the user population. We use this taxonomy to propose and test a contextualized understanding of these deviations.
Understanding deviations from stated intentions in the context of public health apps
Public health apps are a specific but increasingly important class of health apps in which a public agency issues the app, targets a wide range of citizens as users, and primarily aims to preserve and improve public health. Recent health crises have led to the development of several public health apps, including those that identify malaria hotspots, provide risk assessment for Ebola exposure, facilitate scientists’ access to health data (e.g., through data donation), coordinate first responders in disaster situations, or store validated health information (e.g., on vaccinations) (Budd et al., 2020; Skatova and Goulding, 2019; World Health Organization, 2015). The design and development of such apps is driven by polls on individuals’ intentions before the app is finalized or released.
Intentions are an individual’s decisions to perform specific actions in the future (Sheeran, 2002). However, people do not always act on their intentions (Bagozzi, 2007). As the construct of technology usage intentions is embedded in many IS theories and models and, more often than not, serves as a proxy measure for actual behavior, the notion of a gap has stipulated research on the intention–behavior gap in technology use.
Spurred by the goal to investigate “how large […] the intention-behavior gap in the context of IT usage” is (Bhattacherjee and Sanford, 2009) or “how the predictive power for system usage [ … ] can be improved” (S. S. Kim and Malhotra, 2005), a majority of extant literature has examined this gap between intentions and behavior from a correlational perspective—that is, the gap is large if the total number of people who do not act on their intentions is large. The examination of correlations and explained variance is essential for determining the efficacy of measured intentions as a proxy for technology usage behavior. The literature on the intention–behavior gap has consistently highlighted the presence of a gap between intentions and actual usage (Bhattacherjee and Sanford, 2009; Limayem et al., 2007; Shropshire et al., 2015). Nevertheless, relying solely on the total deviation to explain shifts in individual behaviors provides an incomplete perspective when aiming to understand the success of applications.
As public health apps rely on wide acceptance in the population (Trang et al., 2020), the total deviation in individual behaviors may provide insufficient insights on the actual user population. A weak correlation between intentions and actual usage might arise due to one of two primary reasons or a combination of both: (1) individuals who initially had no intention of using an app ultimately choose to use it, or (2) individuals who initially intended to use the app ultimately decide against it. While the correlational approach would likely yield similar outcomes in both cases, the second scenario presents a significant obstacle when aiming for specific acceptance rates—that is, a specific user volume may be achieved or even surpassed in the first scenario, even if the contrary was predicted. Similarly, with regard to an expected profile of user characteristics, the correlational approach might, for example, suggest a minimal shift between the expected and the actual user population. However, if such a deviation is systematically biased toward specific groups, it could still present a significant concern. For example, a public health app designed for contact tracing may show a low total deviation, but if the deviation is concentrated in certain demographic groups, such as older adults, the underrepresentation of specific demographic groups could undermine the app’s potential benefit to public health.
Consequently, while prior studies that utilize a correlational approach have been effective in assessing the overall extent of the issue, a more refined perspective is necessary to comprehend how the gap between intention and technology usage behavior impacts actual user volume and actual user profiles. This perspective must consider individual-level deviations. Therefore, our research framework, situated in the context of public health apps, builds upon the taxonomy of technology (non)user groups in predictions of user acceptance to disentangle the previously conflated deviations between intentions and actual technology usage.
Furthermore, cumulative research indicates significant contextual differences and factors that can help reduce gaps between intention and usage. 2 Consequently, it appears crucial to conceptualize context-specific factors that may account for health-related behaviors in a model that predicts user acceptance. In this sense, we follow prior research by contextualizing the factors that influence user acceptance of health technologies and building upon the health belief model (HBM) (Rosenstock, 1974). The HBM is an expectancy-value model that distinguishes between two fundamental considerations that influence one’s decision regarding whether to execute a health-related action: one’s perception of the threat and one’s evaluation of the behavior necessary to resolve or mitigate it. As the HBM and its constructs have been revealed to have high power in technological application fields (Moody et al., 2018) and health technology acceptance in particular (Ahadzadeh et al., 2015; J. Kim and Park, 2012; Tsai, 2014), it serves as a suitable framework for the identification of factors that affect public health app adoption in this study.
The perception of threat relates to perceived susceptibility and perceived severity, which describe one’s feelings of personal vulnerability to the threat and its seriousness that the use of the technology is intended to reduce (J. Kim and Park, 2012; Sun et al., 2013). In the public health app context, this can manifest in an individual’s health anxiety related to a specific health threat (e.g., COVID-19) (Trang et al., 2020). The evaluation of the potential of a technology to resolve the health threat includes considering perceived technological benefits, adoption barriers, as well as cues to action (i.e., stimuli that trigger the acceptance of recommended health actions; Rosenstock, 1974) related to the public health app (J. Kim and Park, 2012; Tsai, 2014). The perceived benefits pertain to one’s beliefs regarding how beneficial using the technology would be. In the public health app domain, app benefits describe the extent to which individuals expect the public health app to bear positive outcomes for themselves and society, such as being informed about high-risk contacts when, for example, using contact tracing apps or informing others if infected (Zimmermann et al., 2021).
The taxonomy of technology (non)user groups in predictions of user acceptance.
Research framework
Exploring individual-level deviations
Whether the expected user volume can be attained depends on deviations between intentions and actual behavior at the individual level. The one-dimensional understanding of behavioral deviation adopted in the existing intention–behavior gap research equals the sum of the absolute Type II deviation and the absolute Type I deviation. The sum of the number of inclined nonusers and the number of disinclined users measures total individual deviation. However, total individual deviation provides little information to assess whether stated intentions sufficiently translate to the targeted user volume. The actual user volume is determined by the sum of inclined users and disinclined users; in other words, the predicted user volume is attained only if more disinclined individuals change their plans and use the app than inclined individuals who fail to act on their intention.
However, the magnitudes of Type I and Type II deviations may differ greatly (Orbell and Sheeran, 1998). While becoming a user requires investing effort (e.g., installing and using an app) (Bagozzi, 2007), remaining a nonuser demands no action. Thus, while it likely is simple for disinclined individuals to act on their intentions (i.e., doing nothing), inclined individuals can face numerous barriers to becoming users, such as lacking a trigger for beginning the installation; problems during installation, such as a required update of the mobile operating system; or any other technical issues. Furthermore, stating a strong intention to install an app can also result from participants wanting to be viewed favorably by others (including the interviewer) and, therefore, tend to over-report intentions to engage in desired behaviors (Hulland et al., 2018). Accordingly, we present our first hypothesis:
Type I deviation is larger than Type II deviation (i.e., there is a volume shift between the predicted and the actual population).
Such a volume shift will lead to a significant downward deviation when comparing the number of users in the predicted versus actual user populations. A volume shift has crucial implications: When making decisions regarding the specifications of public health apps, decision-makers are misguided by over-optimistic user numbers that are not ultimately achieved. This can have even fatal consequences, as the user volume is a key factor in the efficacy of public health apps.
Recent research indicates that individual-level deviations in the intention–behavior relationship can also lead to deviations in the profile of the user population. For example, Rhodes et al. (2019) studied intention–behavior inconsistencies in parental efforts to enforce their children’s sleep-time restrictions. Their results suggest that unsuccessful inclined individuals are more similar to disinclined individuals in terms of the child’s age and the parent’s gender than successful inclined individuals. In fact, prior technology acceptance research has already uncovered fundamentally different mechanisms for adoption and resistance or continuance and discontinuance of use, respectively (Choudrie and Zamani, 2016; Maier et al., 2015; Turel, 2016). We suggest that the plethora of mechanisms—unobservable to public health app providers—manifests in divergent profiles of disinclined users and inclined nonusers on public health apps. Thus, we present our second research hypothesis:
Inclined nonusers (Type I deviation) have a different profile from disinclined users (Type II deviation) (i.e., there is a profile shift between the predicted and the actual population).
Such a profile shift can also have crucial consequences for public health apps: The actual user profile has different characteristics than the expected profile. This can be problematic because public authorities are typically obliged to follow a participation principle in their IS design (Trier et al. 2023) and, for example, make their information and services available and accessible to the entire population (Bélanger and Carter, 2009). Moreover, also the functional efficiency can be dependent on the user profile. Apps that identify infection hotspots (Adam et al., 2020), for example, may come to “blind spots” or biased infection rate predictions, if all milieus of the whole population are not sufficiently represented in the user population.
Explaining individual-level deviations
By decomposing the total shift between the predicted and actual user population into behavioral deviations at the individual level, we distinguished between Type I and Type II deviations. Next, we examine whether and how contextualized factors affect Type I and Type II deviations differently. These factors can be exploited to formulate design and communication strategies to promote desirable individual-level deviations and mitigate undesirable ones.
The extant literature on health–intention–behavior inconsistency provides ample evidence that contextualized decision factors—for example, from the theory of planned behavior, transactional model of change, and protection motivation theory (Rhodes et al., 2008; Rhodes and Plotnikoff, 2006)—affect behavior beyond their direct impact on behavioral intentions. Considering that the behavioral goals of disinclined and inclined individuals vary (Bagozzi, 2007), the basic rationale is that various barriers can interrupt their plans to act in accordance with their stated intention. Earlier, we identified health anxiety (Trang et al., 2020), individual and societal health app benefits (Zimmermann et al., 2021), privacy risks (Fox and Connolly, 2018), IT self-efficacy (Rahman et al., 2016), and social influence (Poirier and Cobb, 2012) as contextualized factors from the health belief model that not only have an influence on individuals who adopt public health apps but also should differentially affect the deviations of inclined (Type I deviation) and disinclined (Type II deviation) individuals from their intentions. In the following account, we present the hypotheses pertaining to the role played by each identified contextual factor.
The role of health anxiety
Health anxiety involves excessive concerns related to the health risk at hand. Therefore, inclined individuals acknowledge that the technology in question is effective in reducing one’s susceptibility to the health threat in question (J. Kim and Park, 2012; Sun et al., 2013). Thus, we argue that inclined individuals with higher levels of health anxiety have a reinforced incentive to deviate from following their stated intention. In contrast, although disinclined individuals do not have favorable perceptions of the app per se, higher levels of health anxiety might impose a strong incentive to deviate from their intention. Thus, such individuals may nevertheless install the app to minimize one’s susceptibility to the health threat in question:
Inclined individuals with higher levels of health anxiety are less likely to deviate from their stated intention (i.e., Type I deviation).
Disinclined individuals with higher levels of health anxiety are more likely to deviate from their stated intention (i.e., Type II deviation).
The role of app benefits
If inclined individuals have strong beliefs regarding the app’s benefits for the individual and society (Venkatesh et al., 2012; Zimmermann et al., 2021), they will likely act upon their previously stated intention. Higher perceived app benefits will reinforce individuals’ stated intention, which translates into actual behavior, thereby making a deviation from their stated intention less likely. In the same vein, disinclined individuals may be willing to put aside their reservations when they perceive high levels of app benefits. More precisely, when disinclined individuals perceive the app in question to be effective in alleviating the health threat, they may be more likely to install it despite their aversion to it. Thus, we propose the following hypotheses:
For higher levels of perceived app benefits, inclined individuals are less likely to deviate from their stated intention (i.e., Type I deviation).
For higher levels of perceived app benefits, disinclined individuals are more likely to deviate from their stated intention (i.e., Type II deviation).
The role of privacy risks
Perceptions of privacy risks imply an individual’s dread regarding potential personal losses and costs associated with disclosing personal information during app use (Fox and Connolly, 2018; Xu et al., 2009). Accordingly, we expect that high privacy risks can work as a barrier for inclined individuals to act in line with their stated intention to avoid any costs incurred by information disclosure during app use. In contrast, for disinclined individuals, the barriers associated with higher levels of perceived privacy risk will reinforce their profound reservations regarding the app. Therefore, their intention not to install the app will be reinforced. Thus, we propose the following hypotheses:
For higher levels of perceived privacy risks, inclined individuals are more likely to deviate from their stated intention (i.e., Type I deviation).
For higher levels of perceived privacy risks, disinclined individuals are less likely to deviate from their stated intention (i.e., Type II deviation).
The role of IT self-efficacy
With regard to IT self-efficacy, Rahman et al. (2016) and Sun et al. (2013) empirically demonstrated that in the context of health technology, it has a strong and positive influence on attitudes toward the use of health technology. Accordingly, if an inclined individual is convinced that they can effectively use the app to protect themselves from a health threat—that is, if they have higher levels of IT self-efficacy (Rahman et al., 2016)—adoption barriers are further diminished. Thus, they are even more unlikely to deviate from their plan to use the app. In contrast, it is likely that individuals who are initially disinclined to install the app—like the inclined individuals—will face fewer barriers to doing so, as they are confident in their ability to use the app effectively and protect their health. Therefore, in contrast to inclined individuals, disinclined ones are highly incentivized to deviate from their intention. Thus:
For higher levels of IT self-efficacy, inclined individuals are less likely to deviate from their stated intention (i.e., Type I deviation).
For higher levels of IT self-efficacy, disinclined individuals are more likely to deviate from their stated intention (i.e., Type II deviation).
The role of social influence
Finally, social influence is also likely to affect inclined and disinclined individuals differently with regard to their deviation decision. Meeting the group norm that it is desirable to use the app is likely an important trigger for inclined individuals to follow their intentions more strongly and install the app. However, we argue that if one’s stated intention does not conform to the norms of the peer group, it is a persuasive factor for disinclined individuals to install the app and thereby deviate from their original plans (i.e., follow the group norm). Based on the literature on social influence and word-of-mouth (Berger, 2014; McPherson et al., 2003), we argue that this disproportionality results from the fact that individuals place high trust in the opinion of strong ties and are more prone to attempting their suggestions (particularly if they contradict their own assessment of a situation). Thus, we propose the following hypotheses:
For higher levels of social influence, inclined individuals are less likely to deviate from their stated intention (i.e., Type I deviation).
For higher levels of social influence, disinclined individuals are more likely to deviate from their stated intention (i.e., Type II deviation).
Research design
The context of the study
We situated our empirical study in the context of contact tracing apps as a prime example of public health apps. We selected Germany as our empirical setting and collected data during the COVID-19 pandemic before and after the official voluntary tracing app was released. On April 28, 2020, the German government officially announced that it had commissioned the development of a national app for contact tracing (Bundesregierung, 2020). During the following weeks, public media agencies relied on behavioral intention data collection through polls of residents to shape expectations on the level of app acceptance among the German population. Uniformly, these polls suggested that approximately half the population would be willing to install the app. On June 16, the “Corona-Warn-App” was finally released, amassing 8 million downloads during its first day and reaching 13.6 million downloads 10 days after its launch (June 26). Thereafter, the app’s download growth slowed down, with 18 million downloads 3 months after its release. Given that Germany has approximately 83 million inhabitants with approximately 70 million adults (Statistisches Bundesamt, 2019), a gap between stated intentions and actual app installations was evident.
Longitudinal data collection and sample description
During this unique observation period, we collected longitudinal data via a three-wave study (see Figure 1 for an overview). The first wave began on April 7, when app specifications were still unclear, but members of the government had already announced that they would support the development of a tracing app. The second wave was issued on May 30, after the app and its specifications were officially announced. The third wave began on June 26. A timeline of events during the COVID-19 pandemic in Germany (2020) and an overview of survey waves.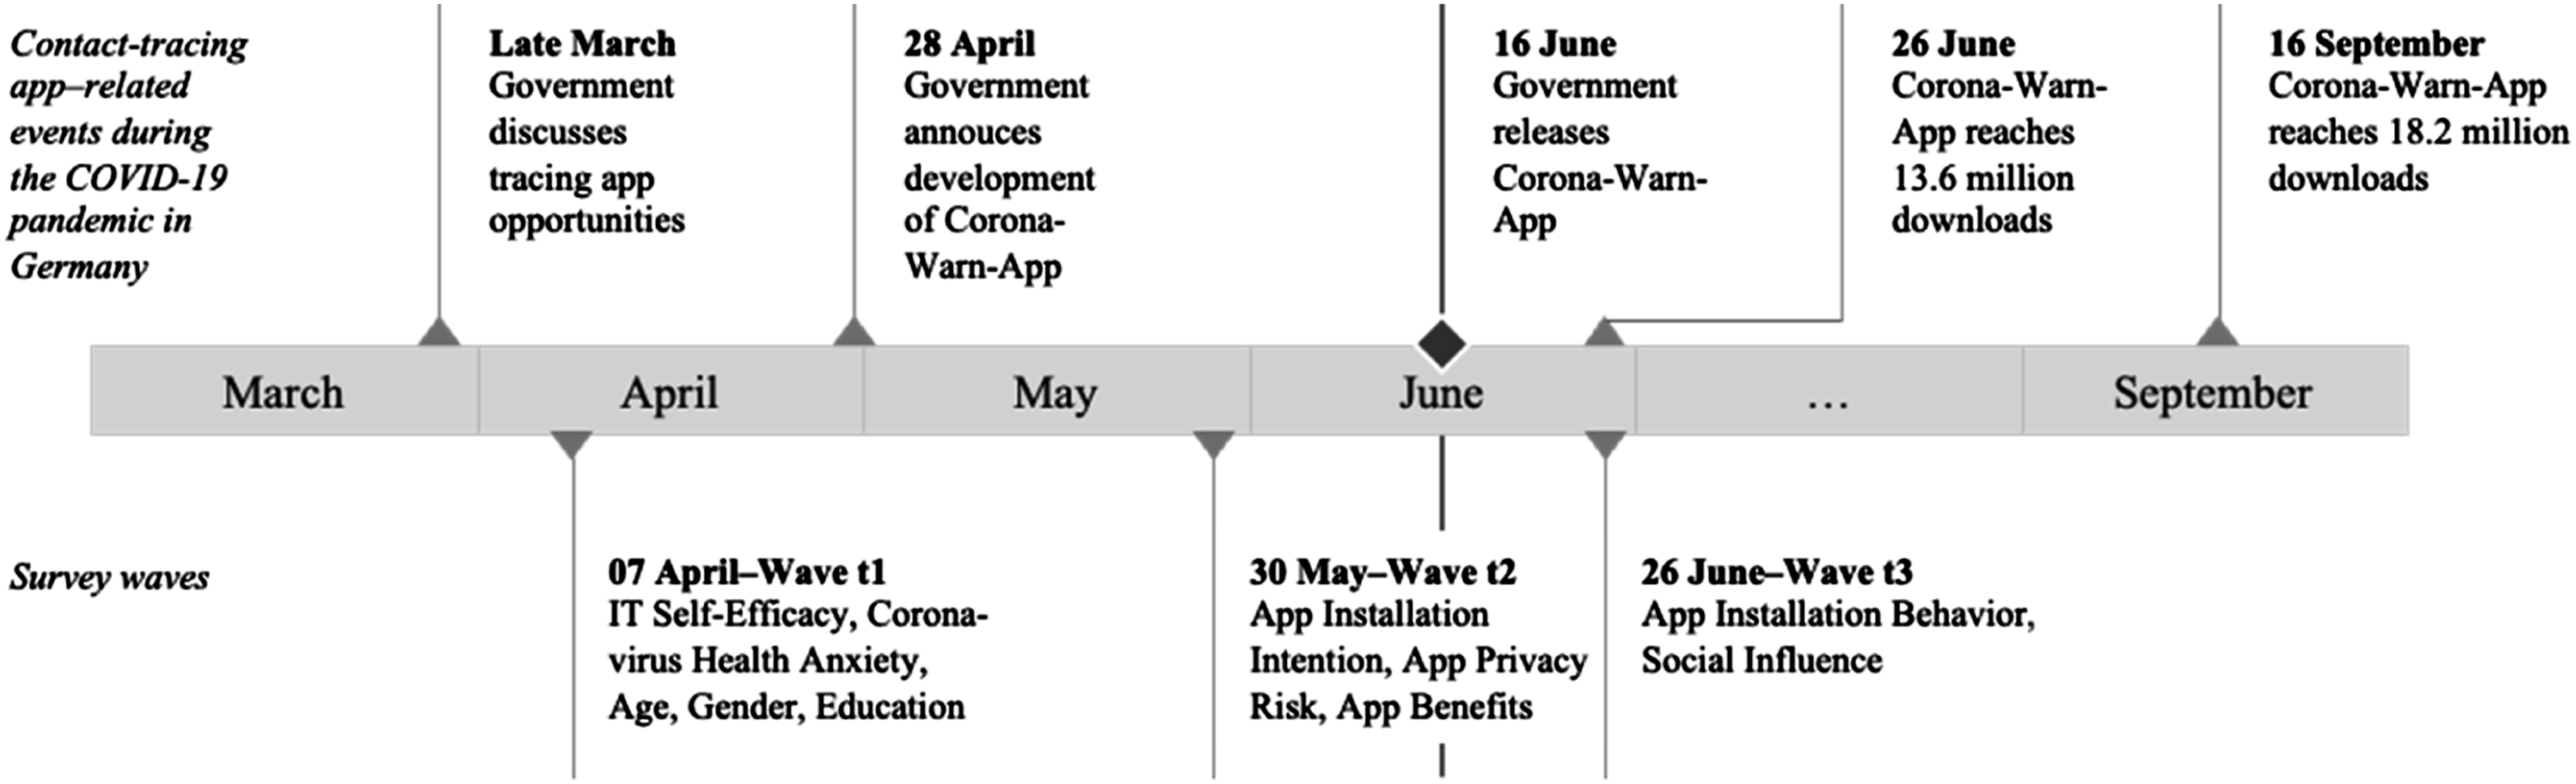
We recruited survey participants who received a nominal payment through Clickworker, a large Western European crowdsourcing platform. This enabled us to conduct our study within the time windows during which the app was announced but not yet released and after the app was released. Our recruiting procedures and screening techniques followed the standard recommendations for crowdsourcing platforms (Jia et al., 2017). To avoid potential biases in our data—such as lack of attentiveness, lack of ability, self-selection, social desirability, and non-independence of participants—we applied various procedural remedies, including attention checks, comprehension checks, moderate compensation, explanations highlighting the importance of the study, neutral wording, no exclusion through filtering, a warning that inattentive respondents would not be paid, quality control, ID comparison, and a large sample (Jia et al., 2017; Lowry et al., 2016).
We disseminated the survey in three waves among the same panel of 565 individuals. After implementing the three data collection waves, we matched the data from each wave and screened them for exclusion criteria, such as click-through patterns. The final sample comprised 1116 questionnaires from 372 individuals, thereby leading to an effective response rate of 65.8% across three data collection waves. Systematic differences in dropouts by adopters and non-adopters can lead to attrition bias; therefore, we compared the responses from respondents who participated in all three waves with those who participated in only the first two waves. A series of Student’s t-tests indicated no significant differences (p > 0.05) for the respondents’ profile (age, gender, education) and research variables (COVID-19 health anxiety, app privacy risk, app benefits, IT self-efficacy).
In our final sample, the participants’ average age was 36.5 and 42.8% of them were female. Of these respondents, 10.5% indicated that their highest level of education was middle school or equivalent, 42.7% had a high school degree or equivalent, and 46.8% had a university degree or equivalent. Although not necessarily required for our study, our sample encompassed the entire range of characteristics present in the German population. Closer inspection revealed that compared with the German population (see brackets), our sample was younger (44.4 years), had a lower share of females (50.9%), and had a higher education level (26.8% had a university degree or equivalent) (Statistisches Bundesamt, 2019).
Measures
Appendix A provides a complete list of variables, items, and sources. Scales for the HBM factors and installation intention were adapted to the context of this study and formulated as statements. Participants were asked to mark their agreement with these statements on Likert scales, ranging from 1 (do not agree) to 7 (fully agree). In addition, app installation behavior was measured using a single item with a binary scale (0 = no; 1 = yes). We conducted a pretest (n = 100) to gauge the psychometric properties of the adapted scales, thereby leading to only minor changes in the operationalization.
Further, we conducted a confirmatory factor analysis to examine our measurement model, which displayed an acceptable model fit (χ2/df = 2.313, CFI = 0.969, RMSEA = 0.059). All latent variables had a sufficient reliability level: individual item reliability > 0.7 (Hulland, 2000), Cronbach’s alpha > 0.7 (Bagozzi and Yi, 1988); convergent validity: average variance extracted > 0.5 (Bagozzi and Yi, 1988); and discriminant validity: heterotrait–monotrait ratio < 0.85 (Henseler et al., 2014). Appendix Tables A2 and B1 provide detailed measurement properties. We computed mean scores for all latent variables for the following analyses and then standardized them.
To identify (non)user groups along the inclination dimension, we conducted a k-means cluster analysis on installation intention. The analysis yielded two distinct groups of individuals: disinclined (n = 172 with unstandardized installation intention ≤ 4) and inclined (n = 200 with installation intention > 4). A binary variable (non)user group (0 = disinclined individuals; 1 = inclined individuals) was also created accordingly.
Analysis and results
Estimation of differences among (non)user groups and testing for a shift in the number of users
Taxonomy of (non)user groups: absolute and relative group sizes and test of independence.
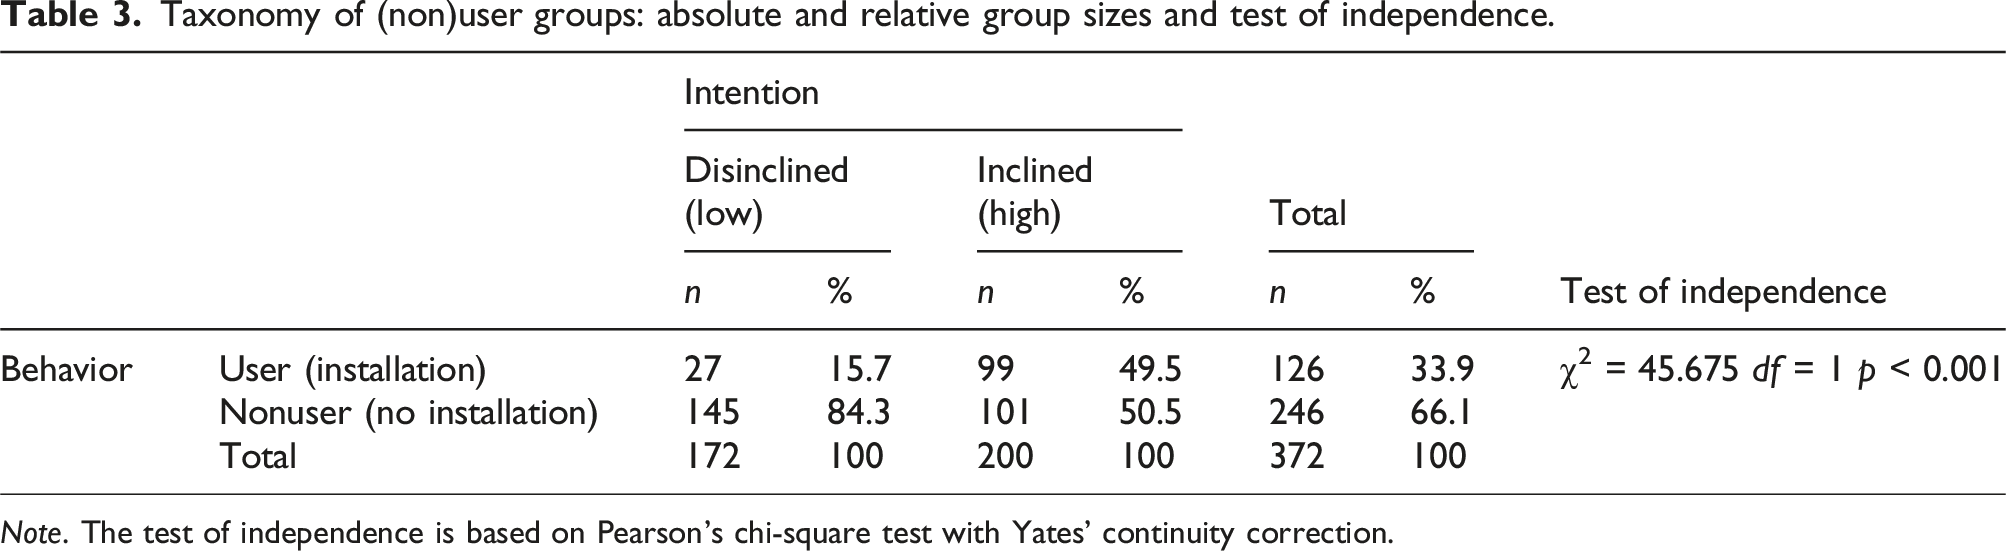
Note. The test of independence is based on Pearson’s chi-square test with Yates’ continuity correction.
Overall, we found that 53.8% of the sample participants were inclined to install the German tracing app, although only 33.9% actually did. Such a substantial reduction in the predicted user volume compared with the actual user volume calls for a perspective that extends beyond aggregate deviations.
Alarmingly, when inspecting individual-level deviations, we found that 34.4% (i.e., 128 out of 372 individuals) did not act on their stated intentions. This result suggests that deviating behavior at the individual level can lead to meaningful variations between predicted and actual user populations. Furthermore, our results indicate that inclined participants were more than three times as likely as disinclined ones to fail to act on their self-reported intentions: While 50.5% of the inclined participants did not install the app (Type I deviation), 15.7% of the disinclined participants became app users (Type II deviation). In addition, a χ2-test of independence yielded a significant difference (p < 0.001). Thus, taken together, these results support H1.
Estimation of disinclined and inclined user profiles and testing for a shift in the user profile
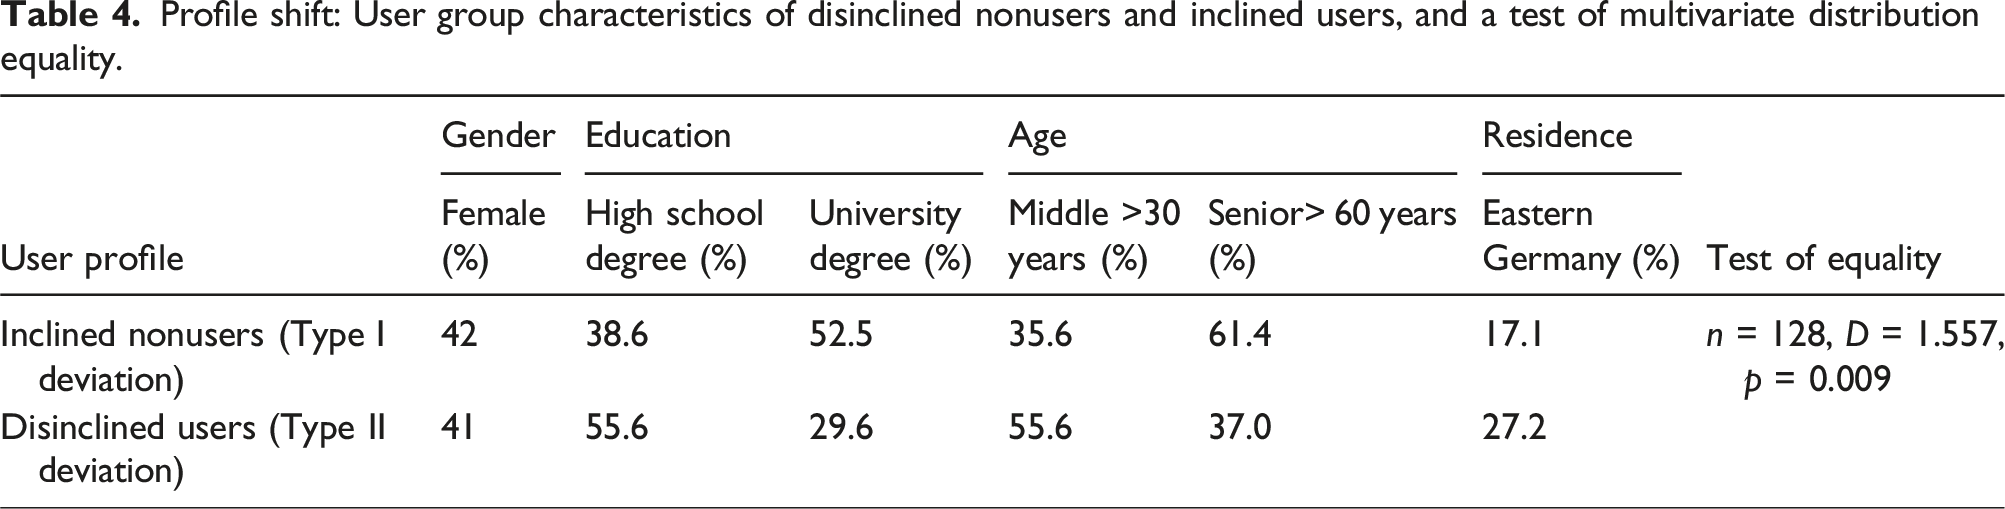
Profile shift: User group characteristics of disinclined nonusers and inclined users, and a test of multivariate distribution equality.
Testing for discriminating factors between Type I and Type II deviations
Results from logistic regressions on app installation decisions with robust standard errors.
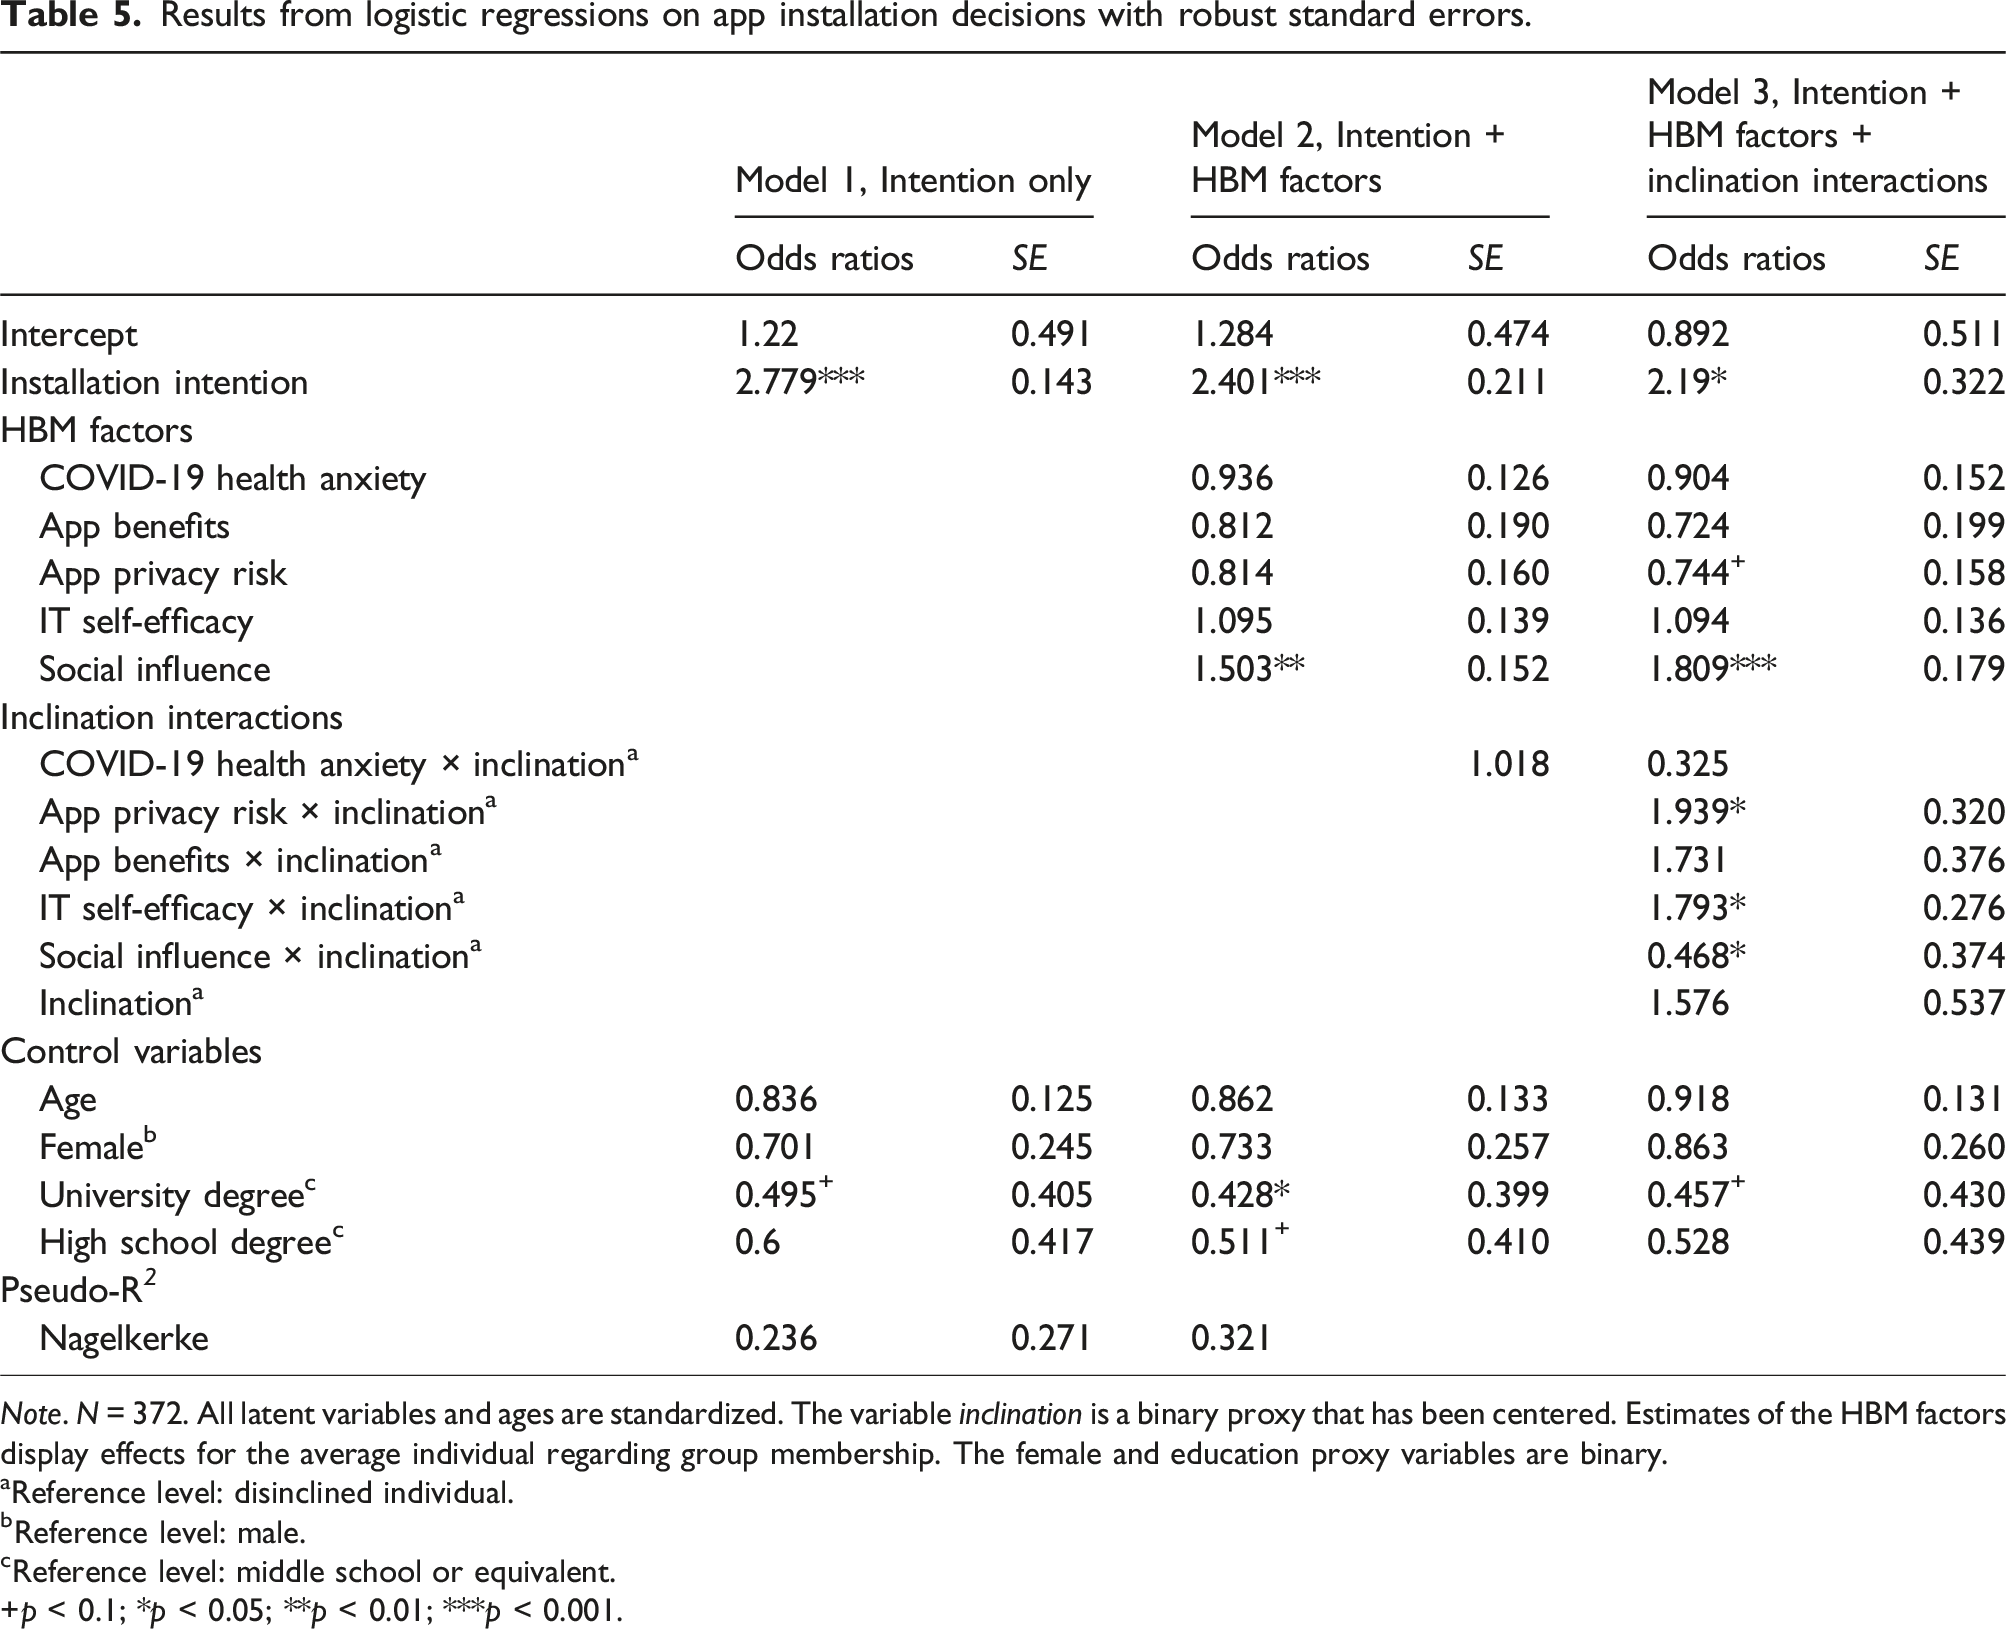
Note. N = 372. All latent variables and ages are standardized. The variable inclination is a binary proxy that has been centered. Estimates of the HBM factors display effects for the average individual regarding group membership. The female and education proxy variables are binary.
aReference level: disinclined individual.
bReference level: male.
cReference level: middle school or equivalent.
+p < 0.1; *p < 0.05; **p < 0.01; ***p < 0.001.
Total odds ratios for disinclined and inclined individuals on behavioral deviation.
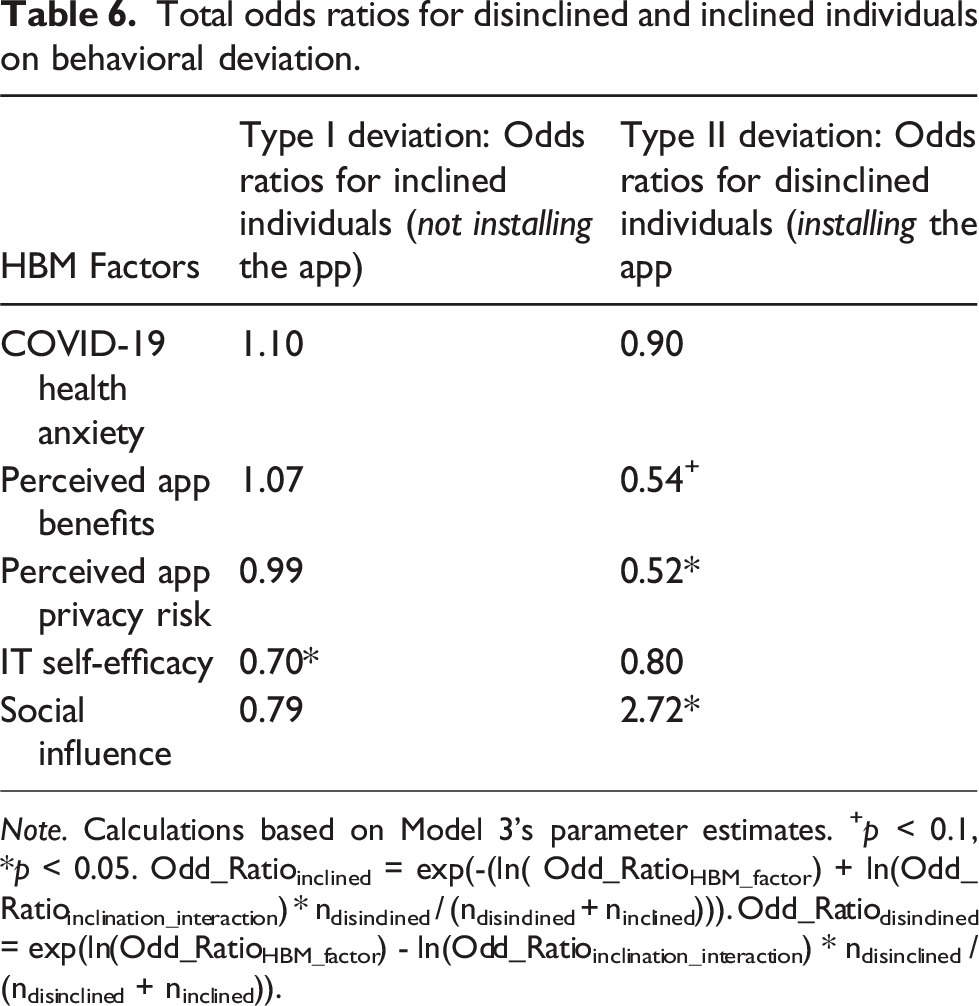
Note. Calculations based on Model 3’s parameter estimates. +p < 0.1, *p < 0.05. Odd_Ratioinclined = exp(-(ln( Odd_RatioHBM_factor) + ln(Odd_Ratioinclination_interaction) * ndisinclined / (ndisinclined + ninclined))). Odd_Ratiodisinclined = exp(ln(Odd_RatioHBM_factor) - ln(Odd_Ratioinclination_interaction) * ndisinclined / (ndisinclined + ninclined)).
Model 1 tests the capacity of installation intention alone to predict app installation while considering demographic control variables. As expected, we found that installation intention significantly predicts app installation (p < 0.001). Model 2 adds HBM factors. A significant HBM factor provides insights into sources of deviation in predicting intention–behavior relationships without considering different user groups. We can identify social influence (p < 0.001) as a significant predictor of app installation, independent of stated intentions.
To investigate whether behavioral deviations between intention and actual use indeed vary across inclinations, Model 3 considers the interactions between the HBM factors and a mean-centered dummy variable that indicates the group of inclination. 3 The results of the interactions reveal significant differences between inclined and disinclined individuals for privacy risk, IT self-efficacy, and social influence (all p < 0.05). This result provides preliminary evidence for a differential role of HBM factors for the inclined and non-inclined groups, respectively.
Based on the parameter estimation of Model 3, we then calculated the effect of the HBM factors on behavioral deviation (see Table 6). Here, the dependent variable is app installation (i.e., whether an individual did install the app) for disinclined individuals (same as in Table 5) and changes to no app installation (i.e., whether an individual did not install the app) for inclined individuals. This transformation provides separate estimates of the HBM factors on type I and type II deviations and, thus, allows us to test the hypotheses H3–H7.
In line with the results of the estimation of Model 3 in Table 5 that reveal significant differences for three HBM factors, the results in Table 6 find significant effects of privacy risks (H5), IT self-efficacy (H6), and social influence (H7) for at least one type of deviation. More specifically, the results do yield a significant OR for privacy risks in the group with disinclined individuals, thereby supporting H5b (OR = 0.52, p < 0.05); this result indicates that with increased perceived privacy risks, disinclined individuals are even less likely to install the app. With regard to IT self-efficacy, the OR is significant and smaller than that in the group of inclined individuals (OR = 0.70, p < 0.05), thereby making a Type I deviation less likely for inclined individuals in terms of higher levels of IT self-efficacy, which supports H6a. Finally, in terms of social influence, the OR in the group of disinclined users is larger than one and significant (OR = 2.72, p < 0.05), thereby indicating an increased likelihood of Type II deviations for a one-unit increase in social influence (H7b).
Notably, for the effect of app benefits (H4), the results yield an interesting counterintuitive finding regarding the Type II deviation (H4b), as the OR for app benefits is significant but below one (OR = 0.54, p < 0.1). Thus, the more app benefits disinclined individuals perceive, the less likely they are to deviate from their intention not to install the app, which contradicts our arguments made for H4b. We conclude that the case for disinclined users and perceived app benefits is not straightforward, which requires ad hoc reasoning for this counterintuitive finding. According to prior literature, with strong perceptions of app benefits, disinclined individuals may perceive cognitive dissonance during the decision process as a positive disconfirmation of their initial expectations resulting from their low inclination to install the app but high perceived app benefits (Venkatesh and Goyal, 2010). Venkatesh and Goyal (2010) suggest that behavioral consequences are mitigated in such cases of positive disconfirmation when making app installation decisions because the user will become more fixated on the negative aspects of the app (i.e., disinclination) to resolve the cognitive dissonance. This will likely result in a reduced likelihood of behavioral deviation from disinclined individuals’ intentions in the face of increased app benefits. Finally, we find no significant direct effects for health anxiety (H3) on either Type I or Type II deviation.
Finally, we performed further validity and robustness checks. First, we checked whether multicollinearity biased our logistic regression estimates by estimating variance inflation factors (VIFs) for each independent variable. All VIFs lie below the recommended threshold of 3 (see Table B1), thereby suggesting that multicollinearity is not an issue in our estimations (Hair et al., 1995). Second, as logistic regressions can be sensitive for small groups and a high number of correlates (Peduzzi et al., 1996), we computed a set of single logistic regressions that estimated Models 2 and 3 based on the core research variables. The results are stable (in terms of effect signs and significance) across all separate estimations, thereby indicating that overfitting does not present an issue. Overall, these results provide evidence of the existence of different user groups and their importance when it comes to explaining different deviation types.
Discussion
Summary of findings
For policymakers, pre-release polls on potential users and their characteristics are a key source of information in the design phase of a public health app; however, often, such predictions are not accurate. The goal of this study was to understand deviations from polls, which can be instrumental for the success of public health apps. We argued that behavioral deviations at the individual level would lead to a volume shift (i.e., downward deviations when comparing the number of users in the predicted versus actual user populations) and a profile shift (i.e., deviations in the actual profile of the user base from the predicted profile). The former can lead to an overestimation of the user population’s size, while the latter may result in app misspecification due to differences between the user population’s predicted and actual characteristics. In this section, we discuss key findings that emerged from analyzing the longitudinal dataset on contact tracing apps during the COVID-19 pandemic in Germany.
First, our data demonstrated that the degree of individual-level deviation from polls can be substantial. By applying our taxonomy of different (non)user groups developed, we could separately identify Type I and Type II deviations and estimate the total amount of individual-level deviation: Approximately one-third of the individuals in the deployed sample did not act on their intentions. Such a substantial degree of individual-level deviation indicates that shifts between predicted and actual user populations can be meaningful. This underscores the need to further examine the differential implications of different types of individual-level deviations for public health success.
Our results confirm that polls tend to be overly optimistic, and we identify a user volume shift as a reason for this deviation from polls. Indeed, our data on tracing apps—in which the size of the user population plunged from an expected 53.8% to an actual 33.9%—illustrated the magnitude of this shift. When allocating the observed shift to two types of individual-level deviations, we obtained a more nuanced picture. We found that more than half of those inclined to install the app ultimately did not act on their specified intentions. This magnitude demonstrates the actual importance of addressing Type II deviations, thereby making it a key component of any campaign. Without the proposed differentiation between deviation types, this would be concealed or canceled out.
Our results also confirm that individual-level deviations can lead to a shift in the user profile when predicting the constitution of a user population. Compared with disinclined users, the data from our sample indicate that inclined nonusers generally have a higher education level, an age structure that is dominated by seniors, and a high geographical concentration in West Germany. Thus, the actual user population will differ from the expected user population. Therefore, policymakers targeting the projected user population may be inclined to reduce both Type I and Type II deviations. Ironically, reducing Type II deviations also decreases the number of users, which is counterproductive to attaining a high user volume.
Moreover, the examination of different decision factors contextualized from the health belief model provides insights into potential levers (vs inhibitors) for individual-level deviations. For inclined individuals, the results suggest that a high level of IT self-efficacy makes it less likely for them to deviate from their intentions and not install the app (Type I deviation). Thus, in line with prior literature on the role of IT self-efficacy in the context of health apps (Rahman et al., 2016), adoption barriers are further reduced for inclined individuals who believe they can effectively use the app to protect themselves from health threats. In turn, this result implies that low levels of IT self-efficacy may explain why certain inclined individuals do not ultimately install and use the app simply because they feel that they are unable to do so. With regard to disinclined individuals, high levels of perceived app benefits—a counterintuitive result in line with initial findings by Venkatesh and Goyal (2010)—and app privacy risks (expanding on the findings of Karwatzki et al. (2022) by linking behavioral intentions and actual behavior) further affirm that they will not install the app. This reveals a key difference between disinclined and inclined individuals: While a few inclined nonusers may perceive themselves to be unable to install and use the app, disinclined nonusers might be simply unwilling to install it for various reasons. Moreover, social influence plays a critical role for disinclined individuals, as it represents an external cue to action that renders them more likely to install the app despite having little previous intention of doing so. Our findings further suggest that health anxiety does not play a role in driving deviation behavior. Given that prior research has identified health anxiety as a factor that influences installation intentions regarding public health apps (Trang et al., 2020), it does not appear to factor in when individuals stray away from their intentions.
Finally, it must be noted that the effects of app benefits, privacy risks, and IT self-efficacy would not have been identified (see insignificant estimates in Table 5, Model 2) if we had not considered different (non)user groups. We interpret this empirical observation as further evidence that emphasizes the importance of differentiating between individual-level deviations in future studies.
Theoretical implications
We began with the puzzle of why public health apps do not realize their actual potential, although polls suggest that the target user group would enable them to do so. Our theoretical and empirical findings carry major implications for research on health apps, user predictions, and the technology intention–behavior gap literature.
First, we add to existing research on poll-based user prediction techniques. Prior studies considered only one type of deviation for estimating prediction bias (Davis, 1993; Davis and Venkatesh, 2004). Our (non)user taxonomy provides a novel perspective for understanding such biases in predictions on technology adoption by attributing them to two different individual behavioral deviations (i.e., Type I and Type II deviations) that can be rooted in different contextual explanations. Applying this delineated perspective, we challenge the common wisdom that medium correlations between intentions and behavior are viewed as problematic, which would, for example, not be the case if individual-level deviations primarily stemmed from disinclined individuals (Type II error). In this case, predictions regarding system use can still be acceptable. Conversely, having knowledge regarding the magnitude of Type I and Type II deviations in user predictions enables decision-makers to adjust their expectations regarding the size of the user population and constitution and to take appropriate action (e.g., by adjusting the technological design). As such, our framework offers a fine-grained and widely applicable perspective for investigating technology adoption hurdles by distinguishing the two types of deviations. We observed a pattern of large and unbalanced deviations, and it is likely that this is not specific to the tracing app context. Disproportionate shares of inclined nonusers are likely to be a phenomenon in a broader technological context in which users’ intention formation relies on a joint evaluation of high costs and more benefits, as is the case with privacy-invasive technologies (e.g., financial apps), technologies with unclear benefit structures (e.g., apps on data donation), and technologies that require significant emotional investments (e.g., health apps for smoking cessation or cancer detection). We hope to inspire future research that investigates when and how contextual factors lead to overall large and unbalanced deviations and how these can be prevented.
Second, we expanded prior knowledge on IS research on technology acceptance, particularly the technology intention–behavior gap. Significant research has examined why individuals fail to act on their plan to use an IS (Bhattacherjee and Sanford, 2009; Limayem et al., 2007; Maier et al., 2012; Williams et al., 2017). Our findings indicate that the intention–behavior relationship for nonuse is not just another side of the same coin. More specifically, we identified factors that differentially affect intention–behavior consistency for IS use and nonuse. By calling attention to the distinct nature of the intention–behavior gap in inaction, our study also provides a new perspective for other IS domains in which both sides of IS behavioral intentions are the focus of interest. This includes, but is not limited to, information disclosure behavior (e.g., why individuals who intend not to disclose their information eventually do) in the privacy literature (Keith et al., 2013), as well as policy compliance behavior (e.g., why individuals comply with a security policy even though they did not initially intend to do so) in the information security literature (Jenkins et al., 2021). Moreover, our results indicate a potential issue in the current operationalization of the gap using a correlational perspective when examining the relationship between intention and IS use. Factors that either account for only one type of deviation or increase one deviation but reduce the other might not be identified because the correlation perspective provides only an aggregated measure of individual-level deviation. We demonstrated this issue for variables at the center of the IT artifact (i.e., privacy risk) and its user interaction (i.e., IT self-efficacy). By highlighting this operationalization issue for the IS domain, we hope to inspire future researchers to pay particular attention to their statistical modeling of behavioral inconsistencies in order to provide better estimates and avoid high levels of false negatives.
Third, by identifying the differential influences of typical HBM factors on actual use/nonuse behavior, we provide specific implications for the literature on the acceptance of health technologies (Binzer et al., 2024; Chen et al., 2019; Sun et al., 2013), which typically have an ambivalent cost-benefit structure. Depending on the inclination to adopt, our results suggest that app benefits, app privacy risks, IT self-efficacy, and social influence can be undervalued factors when examining intention scores alone. These oversights become problematic because studies predicting health technology acceptance with the HBM model overwhelmingly employ intention-based measures (Fox and Connolly, 2018; Sun et al., 2013). However, this study aimed to explain deviations in the specific context of tracing apps, rather than provide a tool that corrects systematic deviations of evaluations in the intention formation process and actual behavior. Nevertheless, we hope to sensitize future studies to the potential for such biases and inspire future researchers to examine and estimate them on a broader scale.
Figure 2 presents a general perspective on examining and addressing deviations from polls during public health app releases. When transferring the results to contexts other than public health apps, the factors determining app success and the contextual factors may differ, but our approach—which explains observed macro-level differences in adoption by breaking them down into micro-level, context-driven deviating behaviors of individuals—should be widely applicable in cases where predictions of user acceptance are important. A disentangled perspective for exploring and addressing deviations from polls during a public health app release.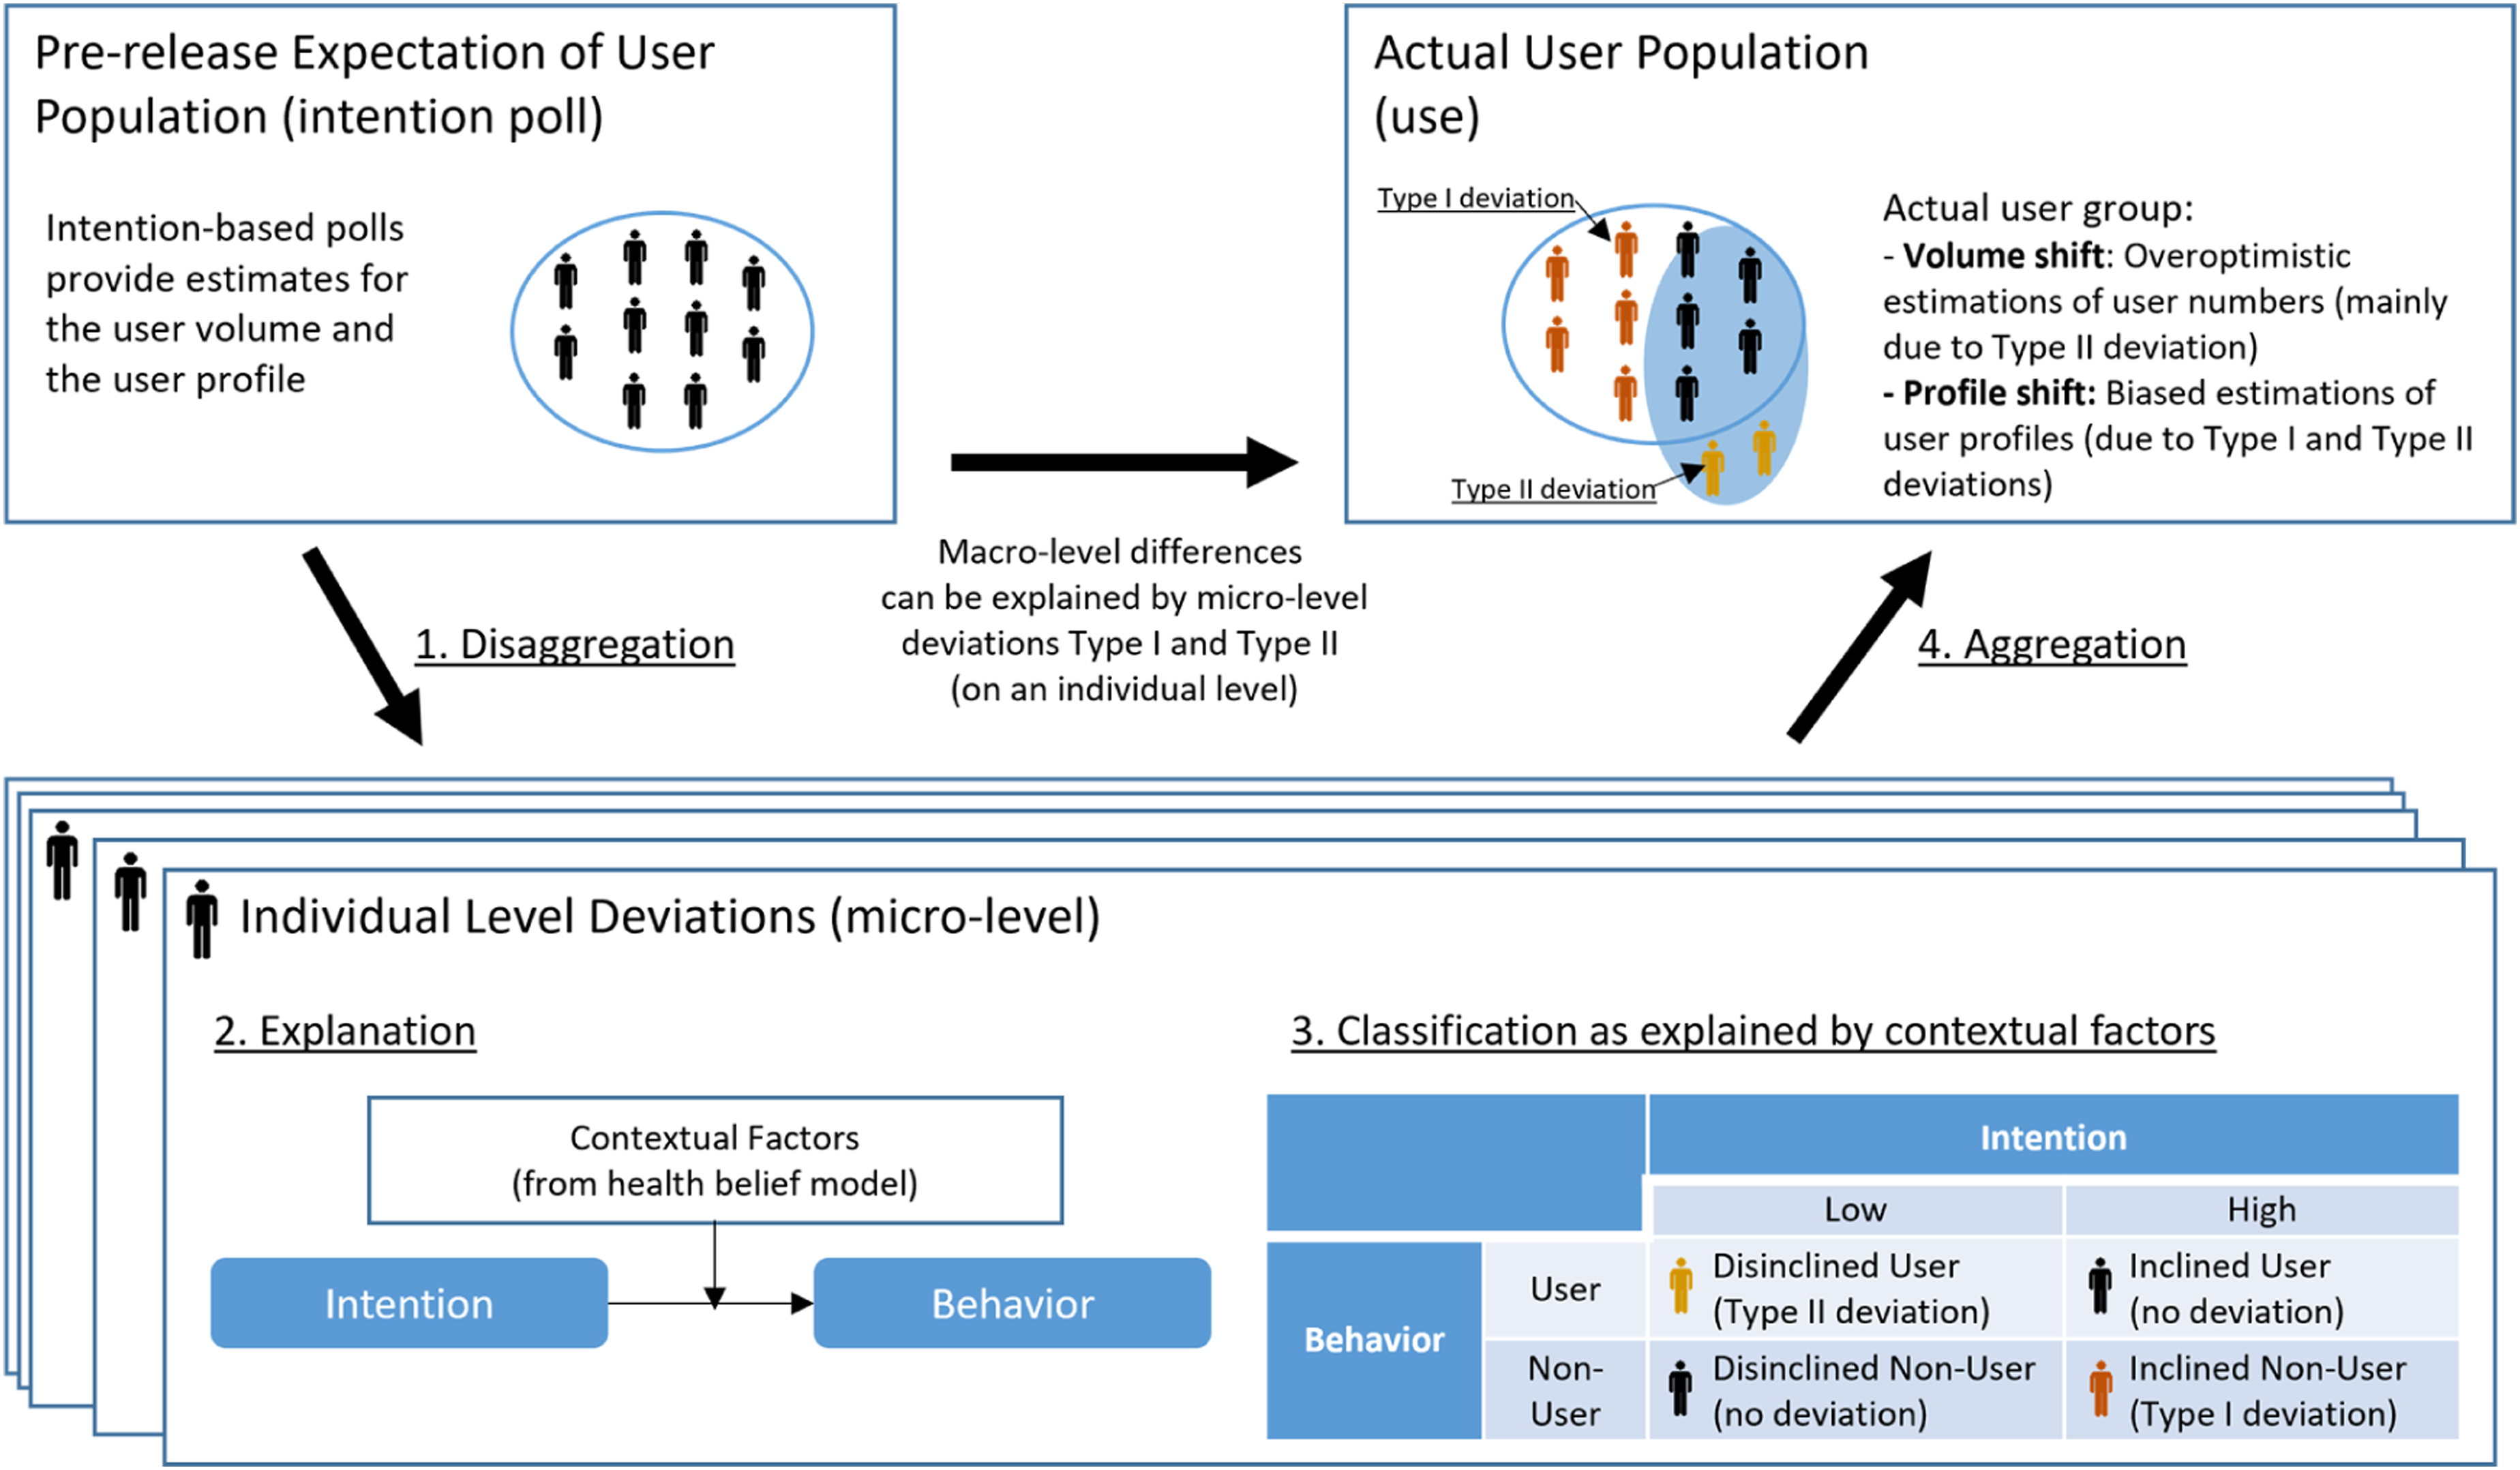
Practical implications
Our results yield actionable implications for policymakers’ use of predictions regarding the user populations of public health apps—that is, the expected number of users and their characteristics. Policymakers typically need to reach a predefined number of actual users that represent a relevant share of the user population required for public health apps to provide the desired societal benefit. Based on our results, policymakers must not base their expectations on behavioral intentions drawn from raw poll data alone. Instead, our results demonstrate that different deviations between stated intentions and actual behavior must be accounted for by estimating Type I (inclined nonusers) and II (disinclined users) separately. Furthermore, we found that if Type I deviations are stronger than Type II deviations. This will lead to a volume shift in the user population, thereby resulting in a smaller number of individuals who install the app than the predicted number of users. Thus, we suggest that neglecting the two types of deviations when predicting a specific user volume can lead to significant delays and even failure of the public health app launch, even if policymakers account for the overall deviation between stated intentions and actual app use.
Another typical factor critical for the success of public health apps is that the profile of the actual user group must meet specific user characteristics, for example, a minimum number of users in different social milieus (Moreno López et al., 2021). A profile shift in which the actual user profiles differ from predicted profiles can be a critical issue that might be overlooked when general app managers deploy public health apps. This could prevent public health apps from functioning effectively as user characteristics determine individuals’ health risks. For example, our results indicate that the group of inclined nonusers of contact-tracing apps in Germany has a higher level of education, a higher proportion of elderly individuals, and a greater share of individuals located in eastern Germany. Such a distribution indicates that, for example, individuals such as healthcare workers—who systematically have more exposure to individuals infected with COVID-19—might not be sufficiently informed about high-risk contacts.
Overall, our results suggest that shifts in the number of users and profiles can lead to the failure to successfully introduce public health apps. Consequently, relying on self-reported intentions in user polls while ignoring these shifts represents a risky strategy for policymakers. For example, consider the case of Germany, where after 6 months, the adoption rate was just 26%—far below the predicted 52%. We examined contextualized factors to explain Type I and Type II deviations as a pragmatic remedy to this dilemma. This enables policymakers to promote the app to optimally address the needs of targeted user populations. For example, our results demonstrate that in the context of the German COVID-19 contact tracing app, policymakers could implement measures that help those with low IT self-efficacy levels overcome these hurdles (e.g., demonstrators, help desk, user-centric design) to convince the large proportion of inclined nonusers to install the app. Furthermore, the installation decisions of disinclined individuals are boosted by social influence and held back by perceived privacy risks. Thus, policymakers can implement design and communication strategies, such as app-referral programs, to educate potential users regarding personal data protection measures.
Finally, our investigation of contextualized HBM factors allows for implications to avoid undesirable and lever desirable deviation behavior for the communication tactics of policymakers during the launch of public health apps. More precisely, targeting individuals with high IT self-efficacy is recommended to avoid Type I deviation. However, to foster Type II deviation, the app’s benefits should not be overemphasized, privacy risks should be mitigated, and social influence should be supported (e.g., via referral programs) in the communication regarding apps where polls indicate particularly large numbers of disinclined individuals. In other words, it is important to note that our results indicate that inclined nonusers need to be enabled to install and use the app by enhancing their IT self-efficacy, while disinclined nonusers have to be convinced to do so. Countering practitioners’ intuition, highlighting app benefits for these individuals may backfire. Instead, policies in this direction should focus on changing disinclined nonusers’ perceptions of privacy risks and, simultaneously, on encouraging interpersonal social influence.
Limitations and future research
The findings of this study must be interpreted in light of the following limitations, which indicate opportunities for further research. First, our empirical findings rely on a unique longitudinal data set on contact tracing apps collected during the COVID-19 pandemic in Germany, both before and after the introduction of the tracing app. Therefore, our empirical insights are most relevant for comparable societies and public health app specifications. This must be considered when translating our insights into other cultural and technological contexts (Srite and Karahanna, 2006).
Second, drawing on established HBM factors, we found drivers specific for Type I and Type II deviations. However, we acknowledge that unexplained variance may still exist in our model. Other factors related to the individual—for example, personality traits (Devaraj et al., 2008), dispositional resistance (Maier et al., 2012), the regulatory environment (e.g., use mandatories [Wu and Lederer, 2009]), supporting media campaigns and trust in government (Russell et al., 2018; Zimmermann et al., 2021), health technology (e.g., prior experiences with comparable technologies [Venkatesh et al., 2003]), and app features beyond the primary health goal (Naous et al., 2022)—may be equally relevant in explaining deviations. We view this study as a first step in demonstrating that contextual factors affect Type I and Type II deviations differently. In doing so, we hope to inspire future studies that utilize both new and existing theoretical perspectives to examine differential effects on behavioral deviations when predicting user populations. We also recognize that the process resulting in inconsistencies between intentions and behavior is a complex phenomenon that is likely to require an examination of intertwined effects. We view this as a great opportunity for further research.
Third, the public health app examined in this research specifically targeted a highly communicable disease (i.e., COVID-19). In contexts involving non-communicable diseases, such as diabetes, where the disease is less salient in social contexts, it is possible that HBM factors such as public health benefits and social influence may assume a different role. In the same vein, this research also considered health benefits. However, it is reasonable to argue that public health apps could also entail other benefits, such as avoiding lockdowns in the context of communicable diseases. Exploring these aspects further in future research would be a valuable and promising direction for recontextualizing our findings.
Fourth, despite our efforts to account for various control variables, the empirical study may still be influenced by extraneous factors that shape user behavior, making it challenging to achieve perfect predictions of app usage despite understanding the types and drivers of deviations. While our findings may enhance predictive accuracy, they cannot fully account for the inherent complexity and unpredictability of human behavior.
Finally, our taxonomy of (dis)inclined users is grounded in their expressed intentions to install a public health app before its release and their subsequent behavior after the release. It is reasonable to assume that these intentions are influenced by a user’s knowledge or expectations regarding the app’s characteristics and benefits. If the actual characteristics or benefits differ from the user’s perceptions at the time the intention was expressed, it may impact their decision to act on that intention. In our study, we did not directly observe these factors; therefore, we encourage future research to explore how the confirmation or disconfirmation of perceived app characteristics and benefits can influence intention–behavior discrepancies.
To sum up, we hope that our findings can serve as a starting point to be better prepared for tackling public health issues in which policymakers must rely on polls to make decisions regarding technology investments to address these challenging situations.
Footnotes
Declaration of conflicting interests
The author(s) declared no potential conflicts of interest with respect to the research, authorship, and/or publication of this article.
Funding
The author(s) disclosed receipt of the following financial support for the research, authorship, and/or publication of this article: This work was supported by the Alfaisal University Covid-19 Initiative (C20118).
Notes
Measurement instruments
Table A1
Item formulations, factor loadings, and construct reliability. Note. All items were translated to German. FL = factor loading from confirmatory factor analysis.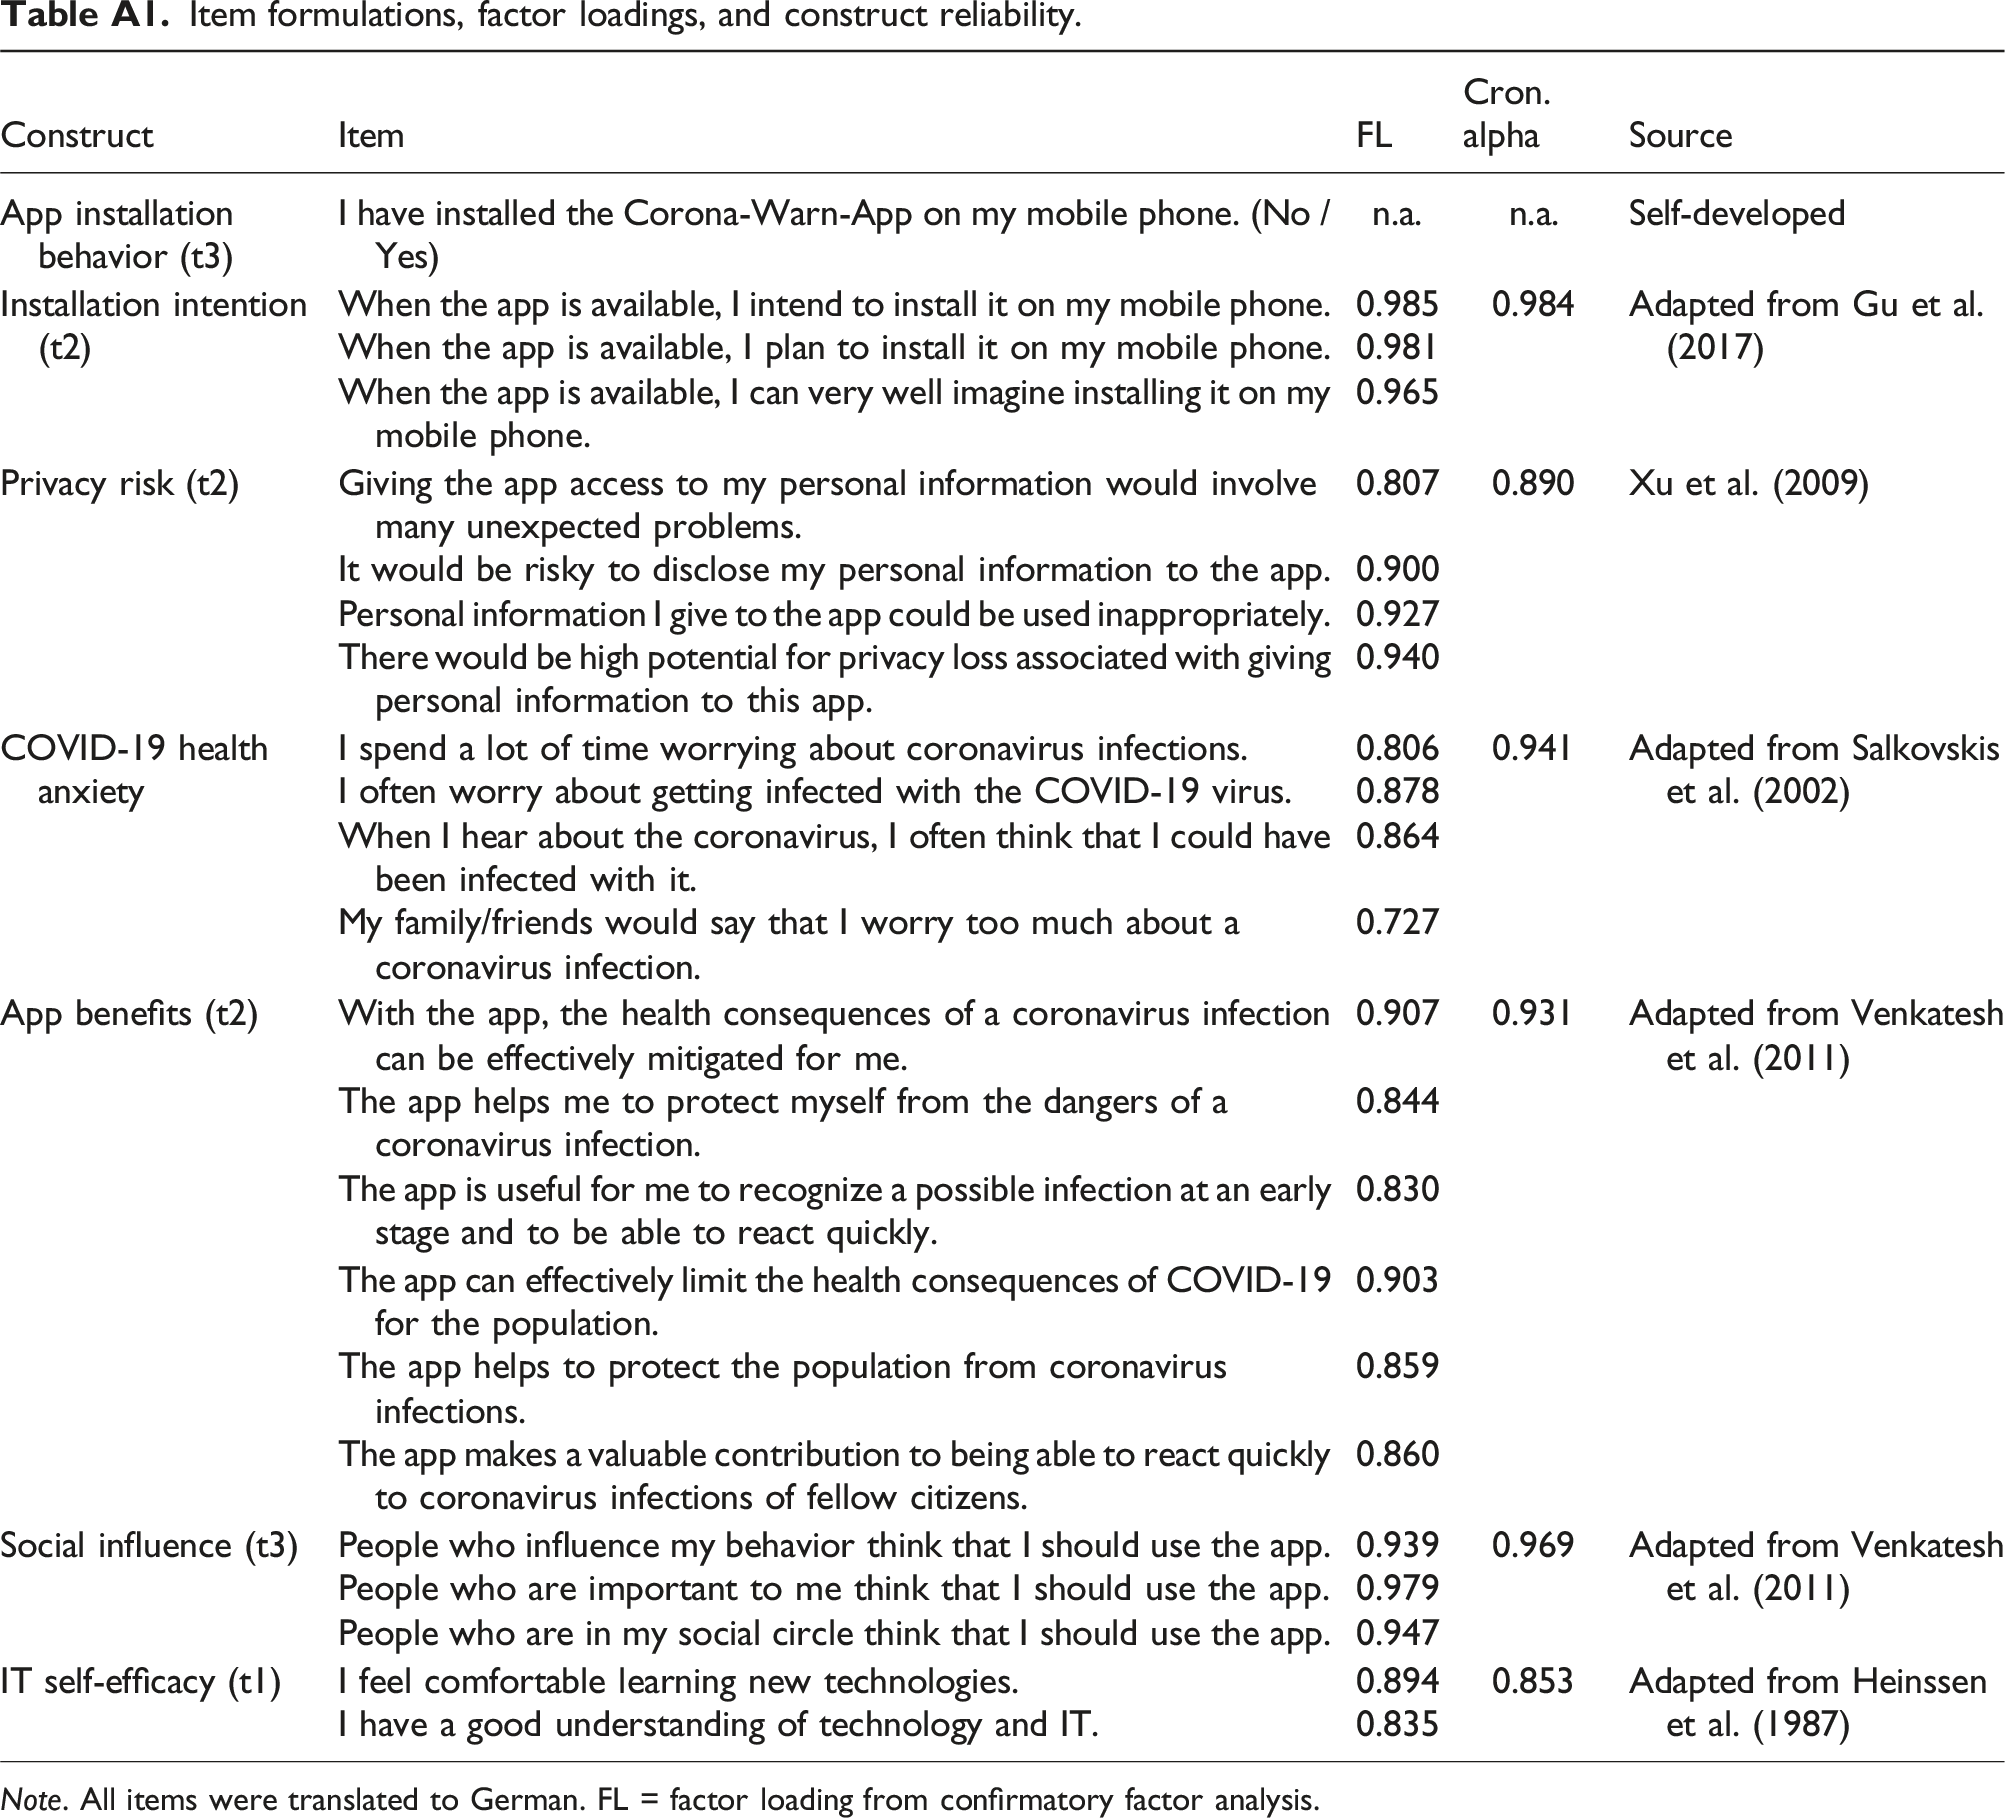
Construct
Item
FL
Cron. alpha
Source
App installation behavior (t3)
I have installed the Corona-Warn-App on my mobile phone. (No / Yes)
n.a.
n.a.
Self-developed
Installation intention (t2)
When the app is available, I intend to install it on my mobile phone.
0.985
0.984
Adapted from Gu et al. (2017)
When the app is available, I plan to install it on my mobile phone.
0.981
When the app is available, I can very well imagine installing it on my mobile phone.
0.965
Privacy risk (t2)
Giving the app access to my personal information would involve many unexpected problems.
0.807
0.890
Xu et al. (2009)
It would be risky to disclose my personal information to the app.
0.900
Personal information I give to the app could be used inappropriately.
0.927
There would be high potential for privacy loss associated with giving personal information to this app.
0.940
COVID-19 health anxiety
I spend a lot of time worrying about coronavirus infections.
0.806
0.941
Adapted from Salkovskis et al. (2002)
I often worry about getting infected with the COVID-19 virus.
0.878
When I hear about the coronavirus, I often think that I could have been infected with it.
0.864
My family/friends would say that I worry too much about a coronavirus infection.
0.727
App benefits (t2)
With the app, the health consequences of a coronavirus infection can be effectively mitigated for me.
0.907
0.931
Adapted from Venkatesh et al. (2011)
The app helps me to protect myself from the dangers of a coronavirus infection.
0.844
The app is useful for me to recognize a possible infection at an early stage and to be able to react quickly.
0.830
The app can effectively limit the health consequences of COVID-19 for the population.
0.903
The app helps to protect the population from coronavirus infections.
0.859
The app makes a valuable contribution to being able to react quickly to coronavirus infections of fellow citizens.
0.860
Social influence (t3)
People who influence my behavior think that I should use the app.
0.939
0.969
Adapted from Venkatesh et al. (2011)
People who are important to me think that I should use the app.
0.979
People who are in my social circle think that I should use the app.
0.947
IT self-efficacy (t1)
I feel comfortable learning new technologies.
0.894
0.853
Adapted from Heinssen et al. (1987)
I have a good understanding of technology and IT.
0.835
Summary statistics
Table B1
Descriptives, VIF, AVE, and correlations. Note. VIF: variance inflation factor. AVE: average variance extracted. Numbers in the diagonal display square root of AVE. aReference level: male. bReference level: middle school or equivalent.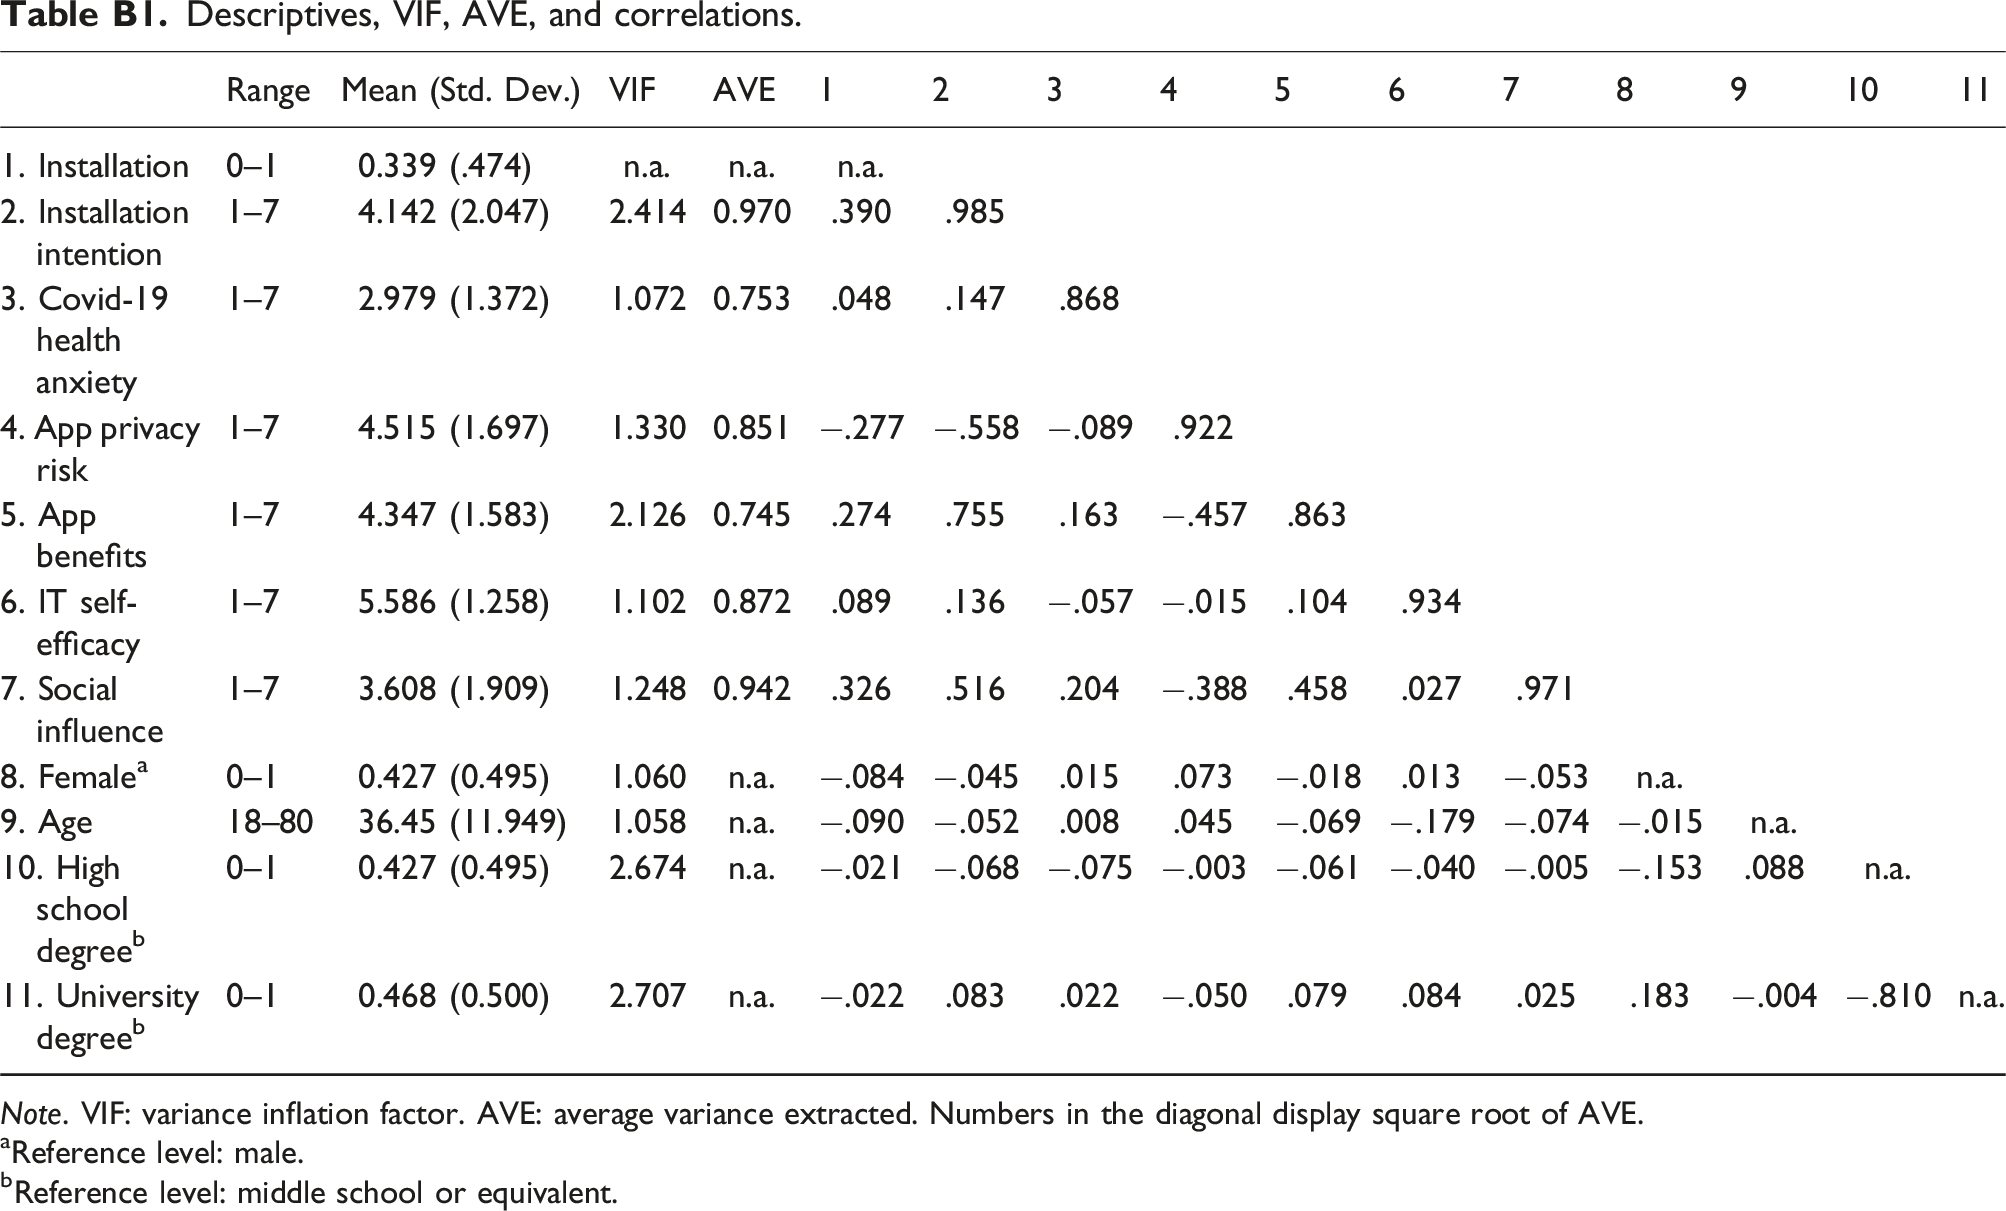
Range
Mean (Std. Dev.)
VIF
AVE
1
2
3
4
5
6
7
8
9
10
11
1. Installation
0–1
0.339 (.474)
n.a.
n.a.
n.a.
2. Installation intention
1–7
4.142 (2.047)
2.414
0.970
.390
.985
3. Covid-19 health anxiety
1–7
2.979 (1.372)
1.072
0.753
.048
.147
.868
4. App privacy risk
1–7
4.515 (1.697)
1.330
0.851
−.277
−.558
−.089
.922
5. App benefits
1–7
4.347 (1.583)
2.126
0.745
.274
.755
.163
−.457
.863
6. IT self-efficacy
1–7
5.586 (1.258)
1.102
0.872
.089
.136
−.057
−.015
.104
.934
7. Social influence
1–7
3.608 (1.909)
1.248
0.942
.326
.516
.204
−.388
.458
.027
.971
8. Female
a
0–1
0.427 (0.495)
1.060
n.a.
−.084
−.045
.015
.073
−.018
.013
−.053
n.a.
9. Age
18–80
36.45 (11.949)
1.058
n.a.
−.090
−.052
.008
.045
−.069
−.179
−.074
−.015
n.a.
10. High school degree
b
0–1
0.427 (0.495)
2.674
n.a.
−.021
−.068
−.075
−.003
−.061
−.040
−.005
−.153
.088
n.a.
11. University degree
b
0–1
0.468 (0.500)
2.707
n.a.
−.022
.083
.022
−.050
.079
.084
.025
.183
−.004
−.810
n.a.