
Abstract
This paper presents a survey of the published high-cycle fatigue (hcf) data for the nickel–iron superalloy alloy 718 fabricated by additive manufacture. Approximately 680 fatigue data points were collected from the published literature and the reported data are presented in the form of stress versus cycles to failure curves for load ratios of R = −1, 0 and 0.1. Following this, curves showing estimated survival probabilities of 0.5, 0.95 and 0.99 are constructed using a statistical analysis based on the Weibull probability density function. Finally, a comparison between the fatigue performance of additively manufactured and wrought alloy 718 under fully reversed loading conditions (R = −1) is provided.
Introduction
Additive manufacturing (AM) is a process where a component is built by repeatedly adding layers until a desired geometry is achieved. The processes are all computer-controlled and require a digital solid model of the component. Nickel alloys are generally produced via powder bed fusion (PBF) using an electron beam melting (EBM–PBF) or laser (L-PBF), the latter sometimes referred to as selective laser melting (SLM) or direct metal laser sintering (DMLS). The PBF process involves spreading metallic powder over a ‘bed’ or ‘baseplate’ and then using an energy source to focus energy on a selected surface, melting and fusing the powder particles to their neighbours. The powder is then re-spread, then melted and fused until the desired geometry is achieved. 1 AM has many advantages over more conventionally manufactured components with one being unrestricted component geometry, which allows more intricate components to be created. Additionally, less waste is produced because the material is only added where necessary. AM can create lightweight (i.e. lattice/truss) structures more effectively than traditional methods, which is beneficial for components requiring minimal weight. However, the AM process can be relatively slow and often requires post-processing due to the poor surface finish. Despite the geometry being unrestricted, the size of the components is restricted by the size of the AM platform and the component cost can vary significantly; this depends on the process and materials used to manufacture the component.
The fatigue performance of both wrought and additively manufactured nickel superalloys has been extensively studied. A search of the scientific literature revealed that a significant number of investigations into the fatigue performance of additively manufactured nickel alloys focused on the workhorse nickel–iron superalloy alloy 718 (also known as Inconel®718 or IN718), so this engineering material was chosen as the focus of this survey. Areas of investigation for additively manufactured alloy 718 include varying the surface conditions,2–4 heat-treatments 5 and testing temperatures, 6 modifying the build orientation7–9 and AM methods, and building-in microstructural defects to assess how these factors influence the material fatigue properties. 10
Yang et al. 2 investigated how crack initiation influenced fatigue in alloy 718 produced by SLM. All samples were kept as-built and tests were performed at a load ratio of R = −1 and a test frequency of 20 kHz. Surface crack initiation resulted in a notably shorter fatigue life compared to interior crack initiation and neither S–N curve presented a fatigue limit. Comparing the results to conventionally processed IN718, the authors noted that additively manufactured IN718 had a lower fatigue strength due to the difficulty of eliminating voids, even after hot-isostatic pressing. Similar observations were expected by Yadollahi and Shamsaei 3 when investigating the influence of surface finish on the fatigue properties of IN718 fabricated via L-PBF. They anticipated the machined samples would exhibit greater fatigue resistance compared to as-built samples due to their smoother surface decreasing the likelihood of surface crack failure. Samples were produced with as-built or machined surfaces and were hot-isostatic pressed at 102 MPa for 3 h at a temperature of 1163°C then solution-treated and then aged. Fatigue tests were performed at R = −1. The results show an indistinguishable difference between as-built and machined samples, however, the machined specimens displayed marginally longer fatigue life. The authors concluded that the similar fatigue properties likely resulted from subsurface voids formed during manufacturing that rose to the surface when machining the specimens. Kevinsanny et al. 4 also found that differing surface conditions had little-to-no impact on the material's fatigue life due to coarse grains which promoted higher defect size tolerance. These conclusions were made while studying the hydrogen susceptibility of IN718 fabricated via SLM. Specimens were hot-isostatic pressed, heat-treated, and then tested in as-built or mechanically polished conditions. Some samples were exposed to hydrogen gas (hydrogen-charging) at 11 MPa/270°C for 200 h. Tests were performed at R = −1 and a frequency of 10 Hz. Hydrogen exposure had little influence on the fatigue properties because fatigue cracks initiated in the δ-phase where hydrogen had little impact. All samples were also found to have similar fatigue strength which the authors noted was considerably lower than wrought IN718.
The influence of heat treatments on fatigue has also been investigated. Solberg et al. 5 studied fatigue in as-built and heat-treated SLM-fabricated IN718. Heat treatment involved 1095°C for 1 h, double-aging at 720°C for 8 h then 620°C for 8 h. Tests were performed at a load ratio of R = 0, 10 Hz. Heat-treated samples had superior fatigue life and strength compared to as-built specimens. The authors concluded the heat treatment made the material less prone to defects and formed an oxide film on its surface, reducing the likelihood of surface cracks causing fatigue failure, which as-built specimens are susceptible to.
The effect of testing temperature on the fatigue performance of alloy 718 is also a crucial area of investigation due to the engineering application of these alloys. Yu et al. 6 investigated the influence of testing temperature on fatigue in laser-directed energy deposition (LDED)-produced IN718. All samples were heat-treated according to AMS-5383 and AMS-5662. Tests were conducted at 20°C and 650°C and R = −1 and a frequency of 140 Hz. The results depict a clear decrease in fatigue life and limit as testing temperature increases which was attributed to the temperature sensitivity of high-cycle fatigue (HCF); failures at 650°C mainly resulted from large crystallographic facets whereas failures at room temperature occurred from the intersection of dislocation slip bands with the specimen surface. Comparing additively manufactured specimens to wrought specimens showed that at both temperatures the additively manufactured condition led to a poorer fatigue life than the wrought specimens. At 20°C, the difference is small, however, there is a significant difference at 650°C, especially in fatigue limits. The wrought samples' fatigue strength reduced by ∼10% at higher temperatures whereas the additively manufactured samples decreased by ∼25%.
Finally, the impact of microstructure orientation on fatigue has been extensively studied. Witkin et al., 7 Konečná et al. 8 and Sabelkin et al. 9 studied the impact of build orientation on fatigue in IN718 fabricated via L-PBF. Witkin et al. 7 found little difference between the S–N curves of horizontal, vertical and angled samples tested at a load ratio of R = 0.1, although the vertical specimens presented poorer fatigue properties compared to wrought IN718. On the other hand, Konečná et al. 8 reported that both horizontal specimens produced similar S–N curves, whereas vertical specimens showed a poorer fatigue life and strength. Konečná et al. 8 attributed this to surface conditions created from the build direction as the vertical specimens exhibited a significantly rougher surface compared to the horizontal specimens. Sabelkin et al. 9 additionally found applying heat treatments significantly improved fatigue life in all build directions despite remaining inferior to wrought samples; the heat-treated 0° and 45° specimens yielded similar S–N curves to wrought specimens, which were significantly superior to the 90° specimens. The authors concluded, however, that further research was required to determine why this was the case.
The aim of this study is to provide a brief survey of the fatigue performance of additively manufactured alloy 718 and present the fatigue data reported in the scientific literature in the form of stress versus cycles to failure curves for load ratios of R = −1, 0 and 0.1. Following this, curves showing estimated survival probabilities of 0.5, 0.95 and 0.99 are constructed using a statistical analysis based on the Weibull probability density function. These probabilities of survival curves are not intended for engineering design purposes, but rather to give researchers working in the field of AM a baseline level of performance of additively manufactured alloy 718. Finally, the general fatigue performance between additively manufactured alloy 718 and the wrought condition, that is, hot or cold-worked, annealed and aged is compared.
Survey methodology
Research articles containing HCF data for additively manufactured alloy 718 were located by conducting weekly searches on ScienceDirect, ResearchGate, SpringerLink and Google Scholar. Keywords used included ‘fatigue’, ‘high cycle fatigue’, ‘additive manufactured’, ‘nickel alloys’ or ‘IN718’. This method attained ∼20 articles containing stress versus cycles to failure data, allowing a strong comparison between wrought and additively manufactured alloy 718. Where the fatigue data were not presented in tabular form, the stress versus cycles to failure data were extracted from each publication using the online application ‘WebPlotDigitizer’. The data were compiled into a database for further statistical analysis. In total, ∼680 data points for additively manufactured alloy 718 were collected from the published literature. All ‘runout’ specimens were excluded from the analysis, however, as their inclusion could influence the data considerably and result in producing an inaccurate representation of the population.
A statistical analysis of the fatigue data extracted from the scientific literature was performed using the Weibull method. This approach was selected as it is regarded as a reasonable model to represent time-to-failure in materials and suitably determining the parameters creates an accurate representation of the lifetime characteristics of a component.
11
The statistical approach adopted in this study is similar to the one described by Vlcek et al.
12
for analysing the fatigue performance of notched aluminium alloys. For the case of modelling the fatigue life of an engineering material, the two-parameter Weibull cumulative probability distribution is given by:


Results and discussion
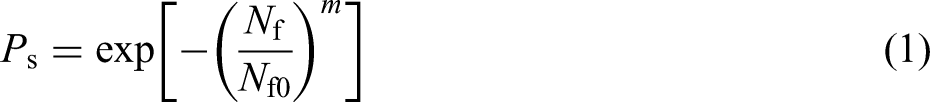
A summary of the fatigue data for alloy 718 extracted from the literature2–10,14–23 is provided in Table 1. For clarity, only the data ranges for the stress amplitudes and cycles to failure have been included rather than every single data point. Other important information, such as the surface condition, heat treatment and load ratios have also been included. The fatigue data extracted from the scientific literature for various load ratios, R, are presented in the form of stress amplitude versus cycles to failure (S–N) graphs in Figure 1. As expected, considerable scatter in the fatigue data exists due to the range of processing and surface conditions included in this survey.
Fatigue data for additively manufactured alloy 718 extracted from the technical literature presented in the form of stress versus cycles to failure (S–N) scatter plots. (a) Load ratio, R = −1, (b) load ratio, R = 0 and (c) load ratio, R = 0.1. Please refer to Table 1 for the corresponding references for studies 1 to 19.
Summary of the fatigue data for additively manufactured alloy 718 extracted from the literature.2–10,14–23 Where available, information pertaining to the surface condition, post-build heat treatment and additive manufacturing method is also included. The minimum and maximum values for stress amplitudes (σa) and cycles to failure (Nf) reported in the various studies are provided, rather than all the published fatigue data.
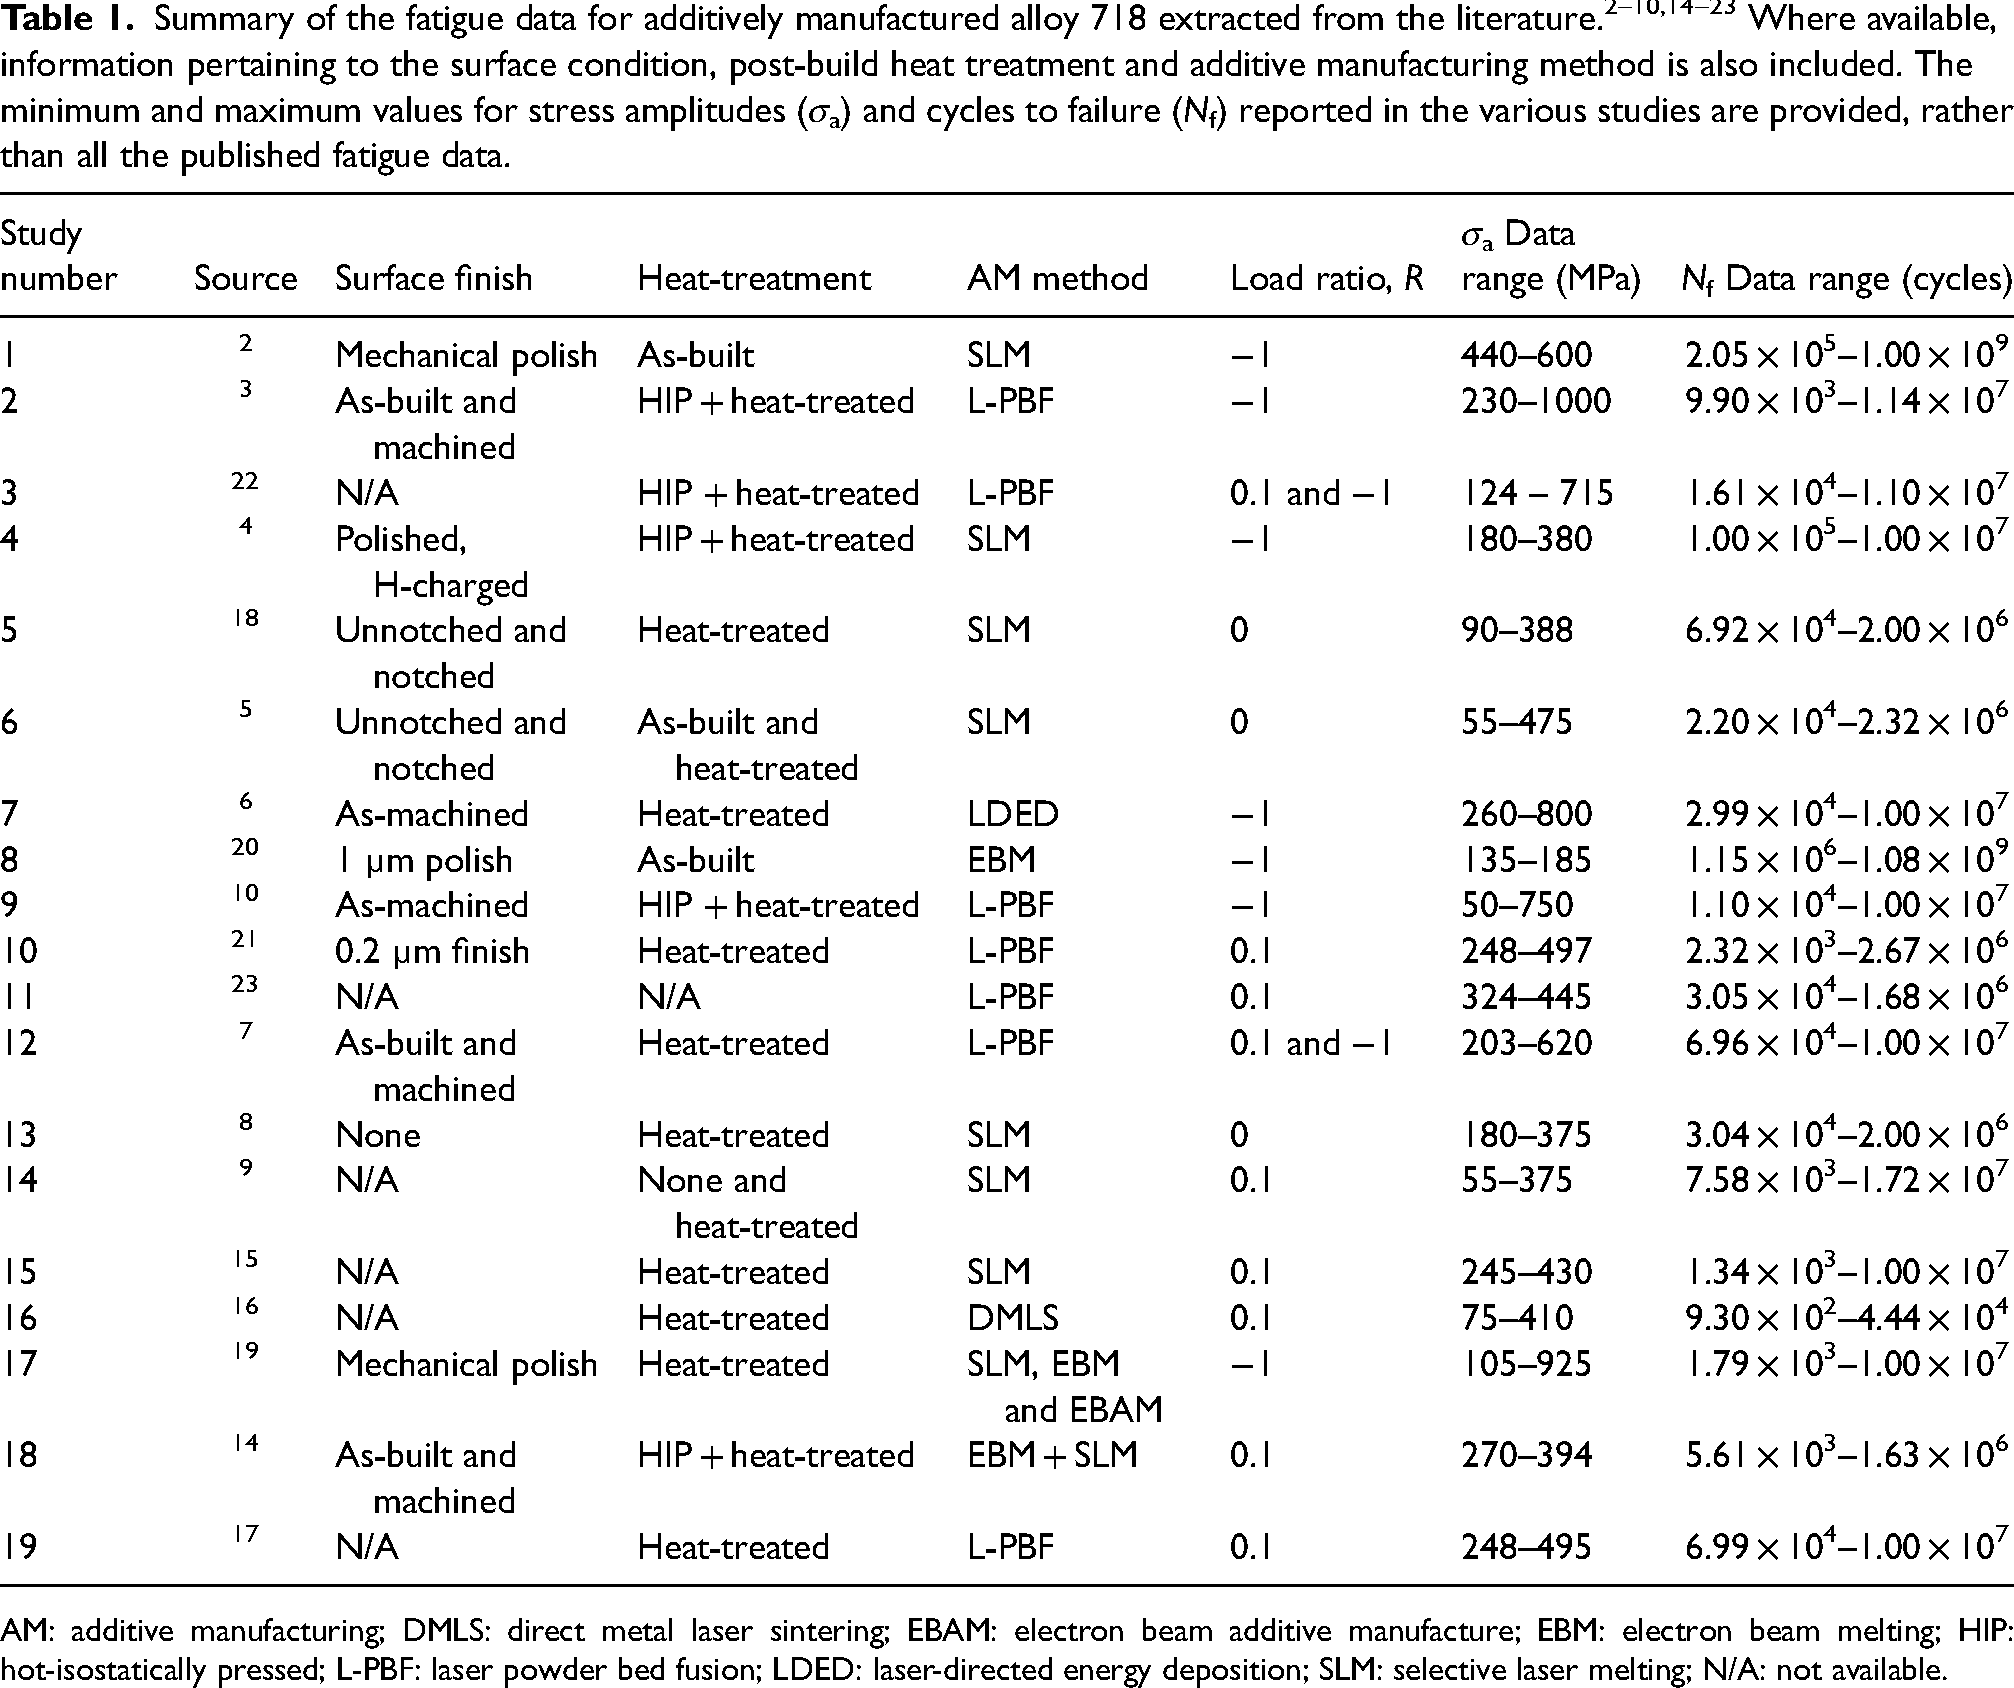
AM: additive manufacturing; DMLS: direct metal laser sintering; EBAM: electron beam additive manufacture; EBM: electron beam melting; HIP: hot-isostatically pressed; L-PBF: laser powder bed fusion; LDED: laser-directed energy deposition; SLM: selective laser melting; N/A: not available.
In the case of fully reversed loading, for example, the fatigue data reported in Study 8 20 were collected from EBM alloy 718 tested at 600°C in the as-built condition (i.e. no post-build heat treatment was applied prior to testing). Although the fatigue specimens were polished to a 1 µm surface finish prior to testing, Schmiedel et al. 20 reported a coarse grain size of between 200 and 700 µm and a strong <001> texture parallel to the build direction. In addition, a significant number of undesirable internal features such as shrinkage porosity were also found, and it was reported that fatigue cracks initiated at the intersection between well-oriented slip planes and internal defects, which may account for the relatively poor fatigue performance reported in this study. Although the fatigue tests in Study 8 were performed at 600°C, the fatigue strength at 107 cycles (∼150 MPa) was significantly lower than that of hot-rolled and heat-treated alloy 718 (∼550 MPa) tested at the same temperature, which was used as the reference material condition. Improved fatigue properties in the very high-cycle regime were reported by Yang et al. 2 for SLM alloy 718 (Study 1). Here, room temperature fatigue testing was also performed on material in the as-built condition and no post-build heat treatments were performed. Again, fatigue specimens were subjected to a mechanical polish prior to testing, but the authors reported a relative density close to that measured in alloy 718 following hot-isostatic pressing.
Further evidence that internal discontinuities may contribute to the large degree of scatter in the fatigue data can be drawn from Kaletsch et al. 10 in Study 9, where ∼100 fatigue tests were performed on alloy 718 specimens fabricated using L-PBF. Initial levels of internal porosity were controlled by varying the hatch spacing and all specimens were hot-isostatically pressed (HIP) and aged prior to fatigue testing. Following HIP and aging both under pressure and without pressure, specimens with an initial porosity level of 3.5% exhibited a fatigue strength close to wrought alloy 718 (∼530 MPa). Higher levels of initial porosity (9.9%), however, led to a reduction in fatigue strength to ∼165 MPa in samples that were HIP and aged at atmospheric pressure only, which is comparable to the fatigue strength for EBM alloy 718 reported in Study 8. 20
Statistical treatment of the fatigue data for additively manufactured alloy 718
For this preliminary analysis, all the fatigue data for additively manufactured alloy 718 was included in single S–N curves for load ratios of R = −1, 0 and 0.1. The fatigue data were not separated according to the machine platform used to deposit the specimens, any post-build heat treatment or specific surface finish as the intention here is to investigate the general performance of additively manufactured alloy 718 at varying load ratios. The Weibull statistical approach described in the methods section ideally requires several replicate tests at a constant stress amplitude (σa). As this was rarely the case, the fatigue data extracted from the literature were organised into a number of stress amplitude data bins. For example, the fatigue lives for stress amplitudes between 240 and 260 MPa were grouped into a single data bin of σa = 250 ± 10 MPa. Each data set was sorted by ascending stress amplitude to assist with the selection of these data bins.
A Weibull analysis was conducted on the fatigue data extracted from the literature using equations (1) to (3) detailed in the methods section. The following example calculations are for the fatigue data for additively manufactured alloy 718 tested at a load ratio of R = 0.1. From inspection of the raw data, the following four stress bins contained the greatest number of data points: σa = 115 ± 10, 250 ± 10, 326 ± 10 and 420 ± 10 MPa with each containing n = 10, 15, 26 and 19 data points, respectively. A stress amplitude bin of X ± 10 MPa was chosen as there were very few identical stress amplitude values that contained multiple cycles to failure data points. After extracting the cycles to failure data from the literature for the four stress amplitude bins, the values were sorted into ascending order and ranked 1 to n. Equation (2) was used to determine the survival probability (Ps) for each cycle to failure (Nf) data point. Following this, Equation (3) was used to calculate the parameters required for the Weibull plot and these values for the four stress amplitude bins are summarised in Table 2.
A summary of the values used to plot Weibull curves for the fatigue lives of additively manufactured alloy 718 tested at a load ratio of R = 0.1. The calculated Weibull modulus (m) and characteristic fatigue life (Nf0), along with the number of data points in each stress amplitude bin (N) are also listed at the bottom of the table.
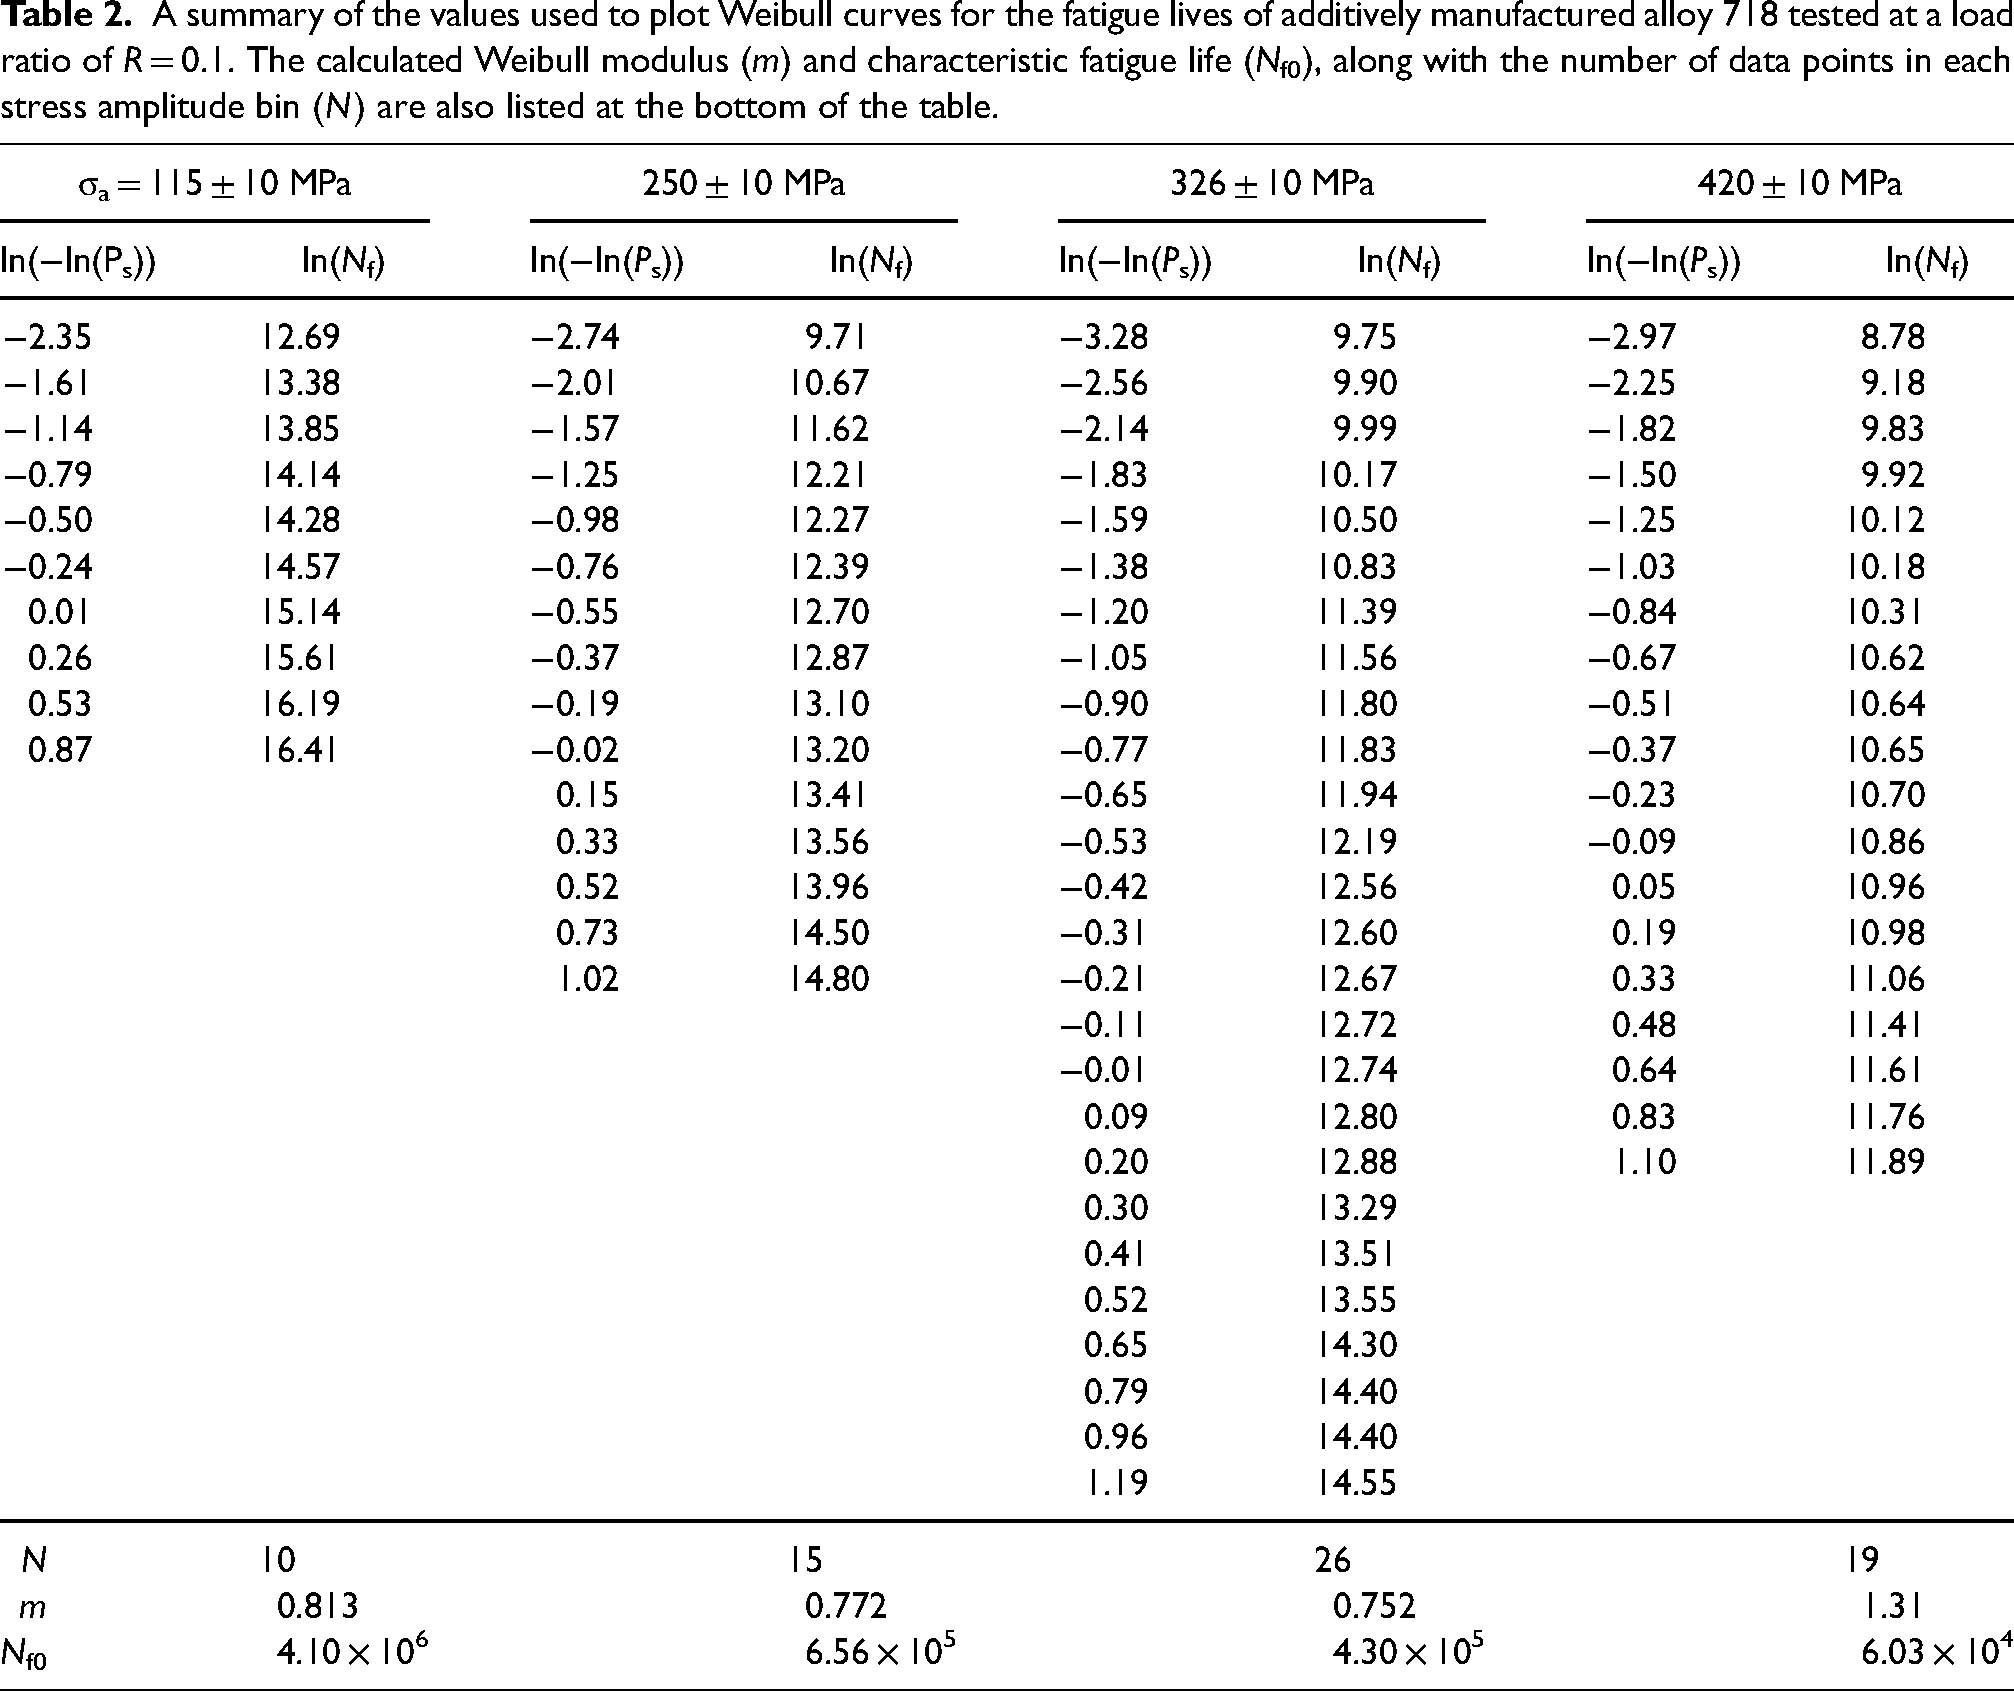
Figure 2 is a Weibull plot of the fatigue lives for the 115 ± 10 MPa stress amplitude bin constructed using the values listed in Table 2. From visual inspection of Figure 2, it is evident that the Weibull equation provides a reasonably good fit to the experimental fatigue data extracted from the literature. A regression analysis yielded a Weibull modulus of m = 0.813 and a characteristic fatigue life of Nf0 = 4.10 × 10⁶ cycles for the stress amplitude bin of σa = 115 ± 10 MPa. Values of m and Nf0 determined through linear regression for the other three stress amplitude bins investigated are given in Table 2.
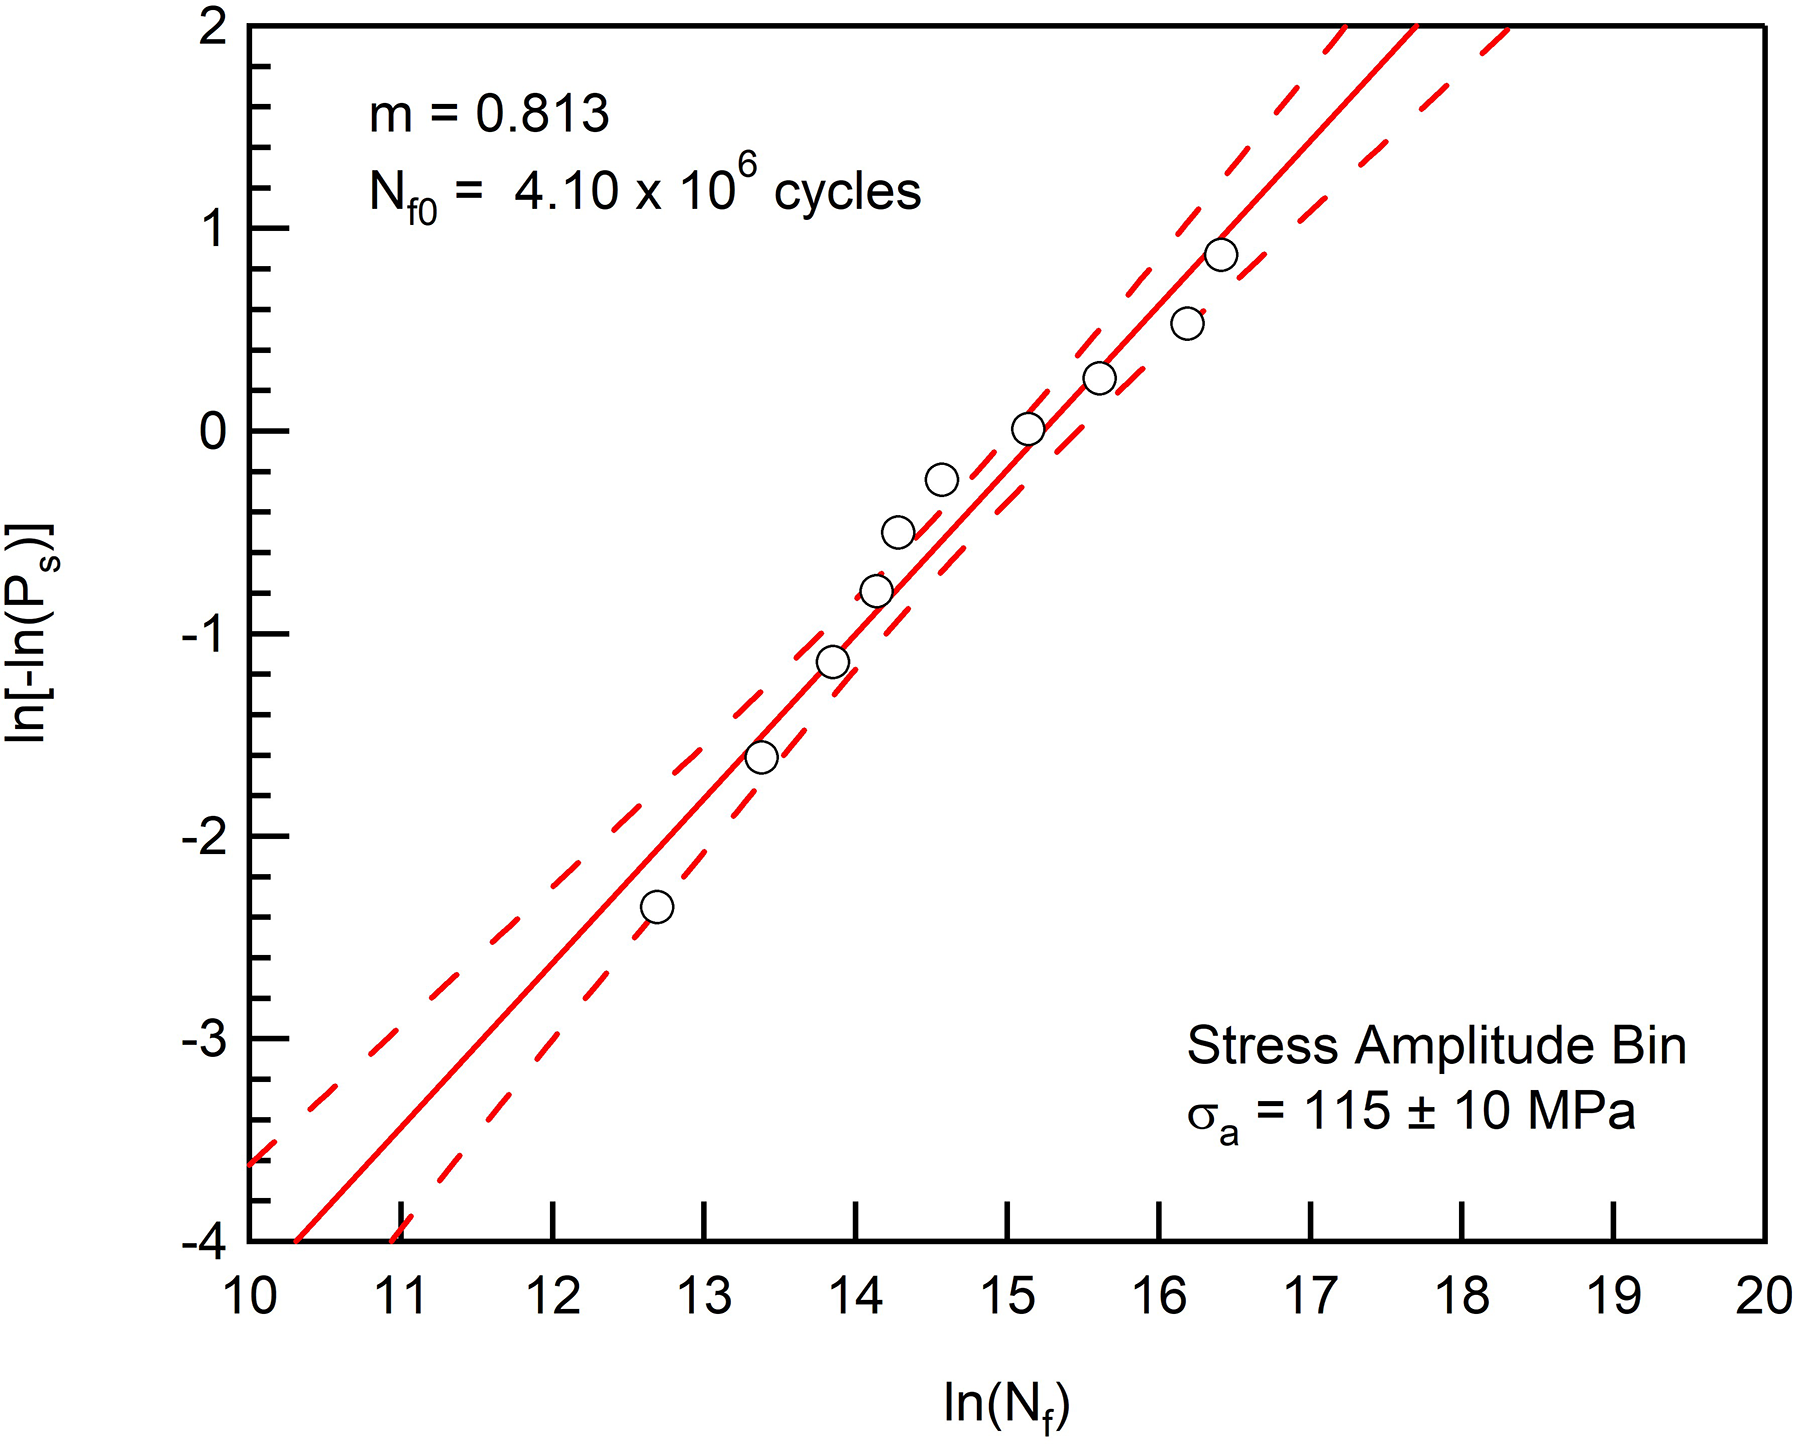
An example Weibull plot representing the stress amplitude bin of σa = 115 ± 10 MPa for additively manufactured alloy 718 fatigue data collected at a load ratio of R = 0.1. Values for the Weibull modulus, m, and characteristic fatigue life, Nf0, are also given.
After determining the Weibull parameters (m and Nf0) for each of the four stress amplitude bins, equation (2) was used to calculate the expected life (Nf) for the following survival probabilities at the four stress-amplitude bins investigated at R = 0.1: Ps = 50%, 95% and 99%. To estimate the Basquin equation constants (b and σf’) for additively manufactured alloy 718, the expected lives for the four stress amplitude bins were plotted on logarithmic scales of stress amplitude (σa) versus the number of stress reversals that would be expected to cause failure (2Nf), as illustrated in Figure 3. The fatigue strength exponent (b) and fatigue strength coefficient (σf’) are calculated from the gradient of the regression line and the intercept with the ordinate scale, respectively. This process was repeated for load ratios of R = 0 and −1, and S-N curves corresponding to probabilities of survival of 50%, 95% and 99% at the three load ratios could be constructed.
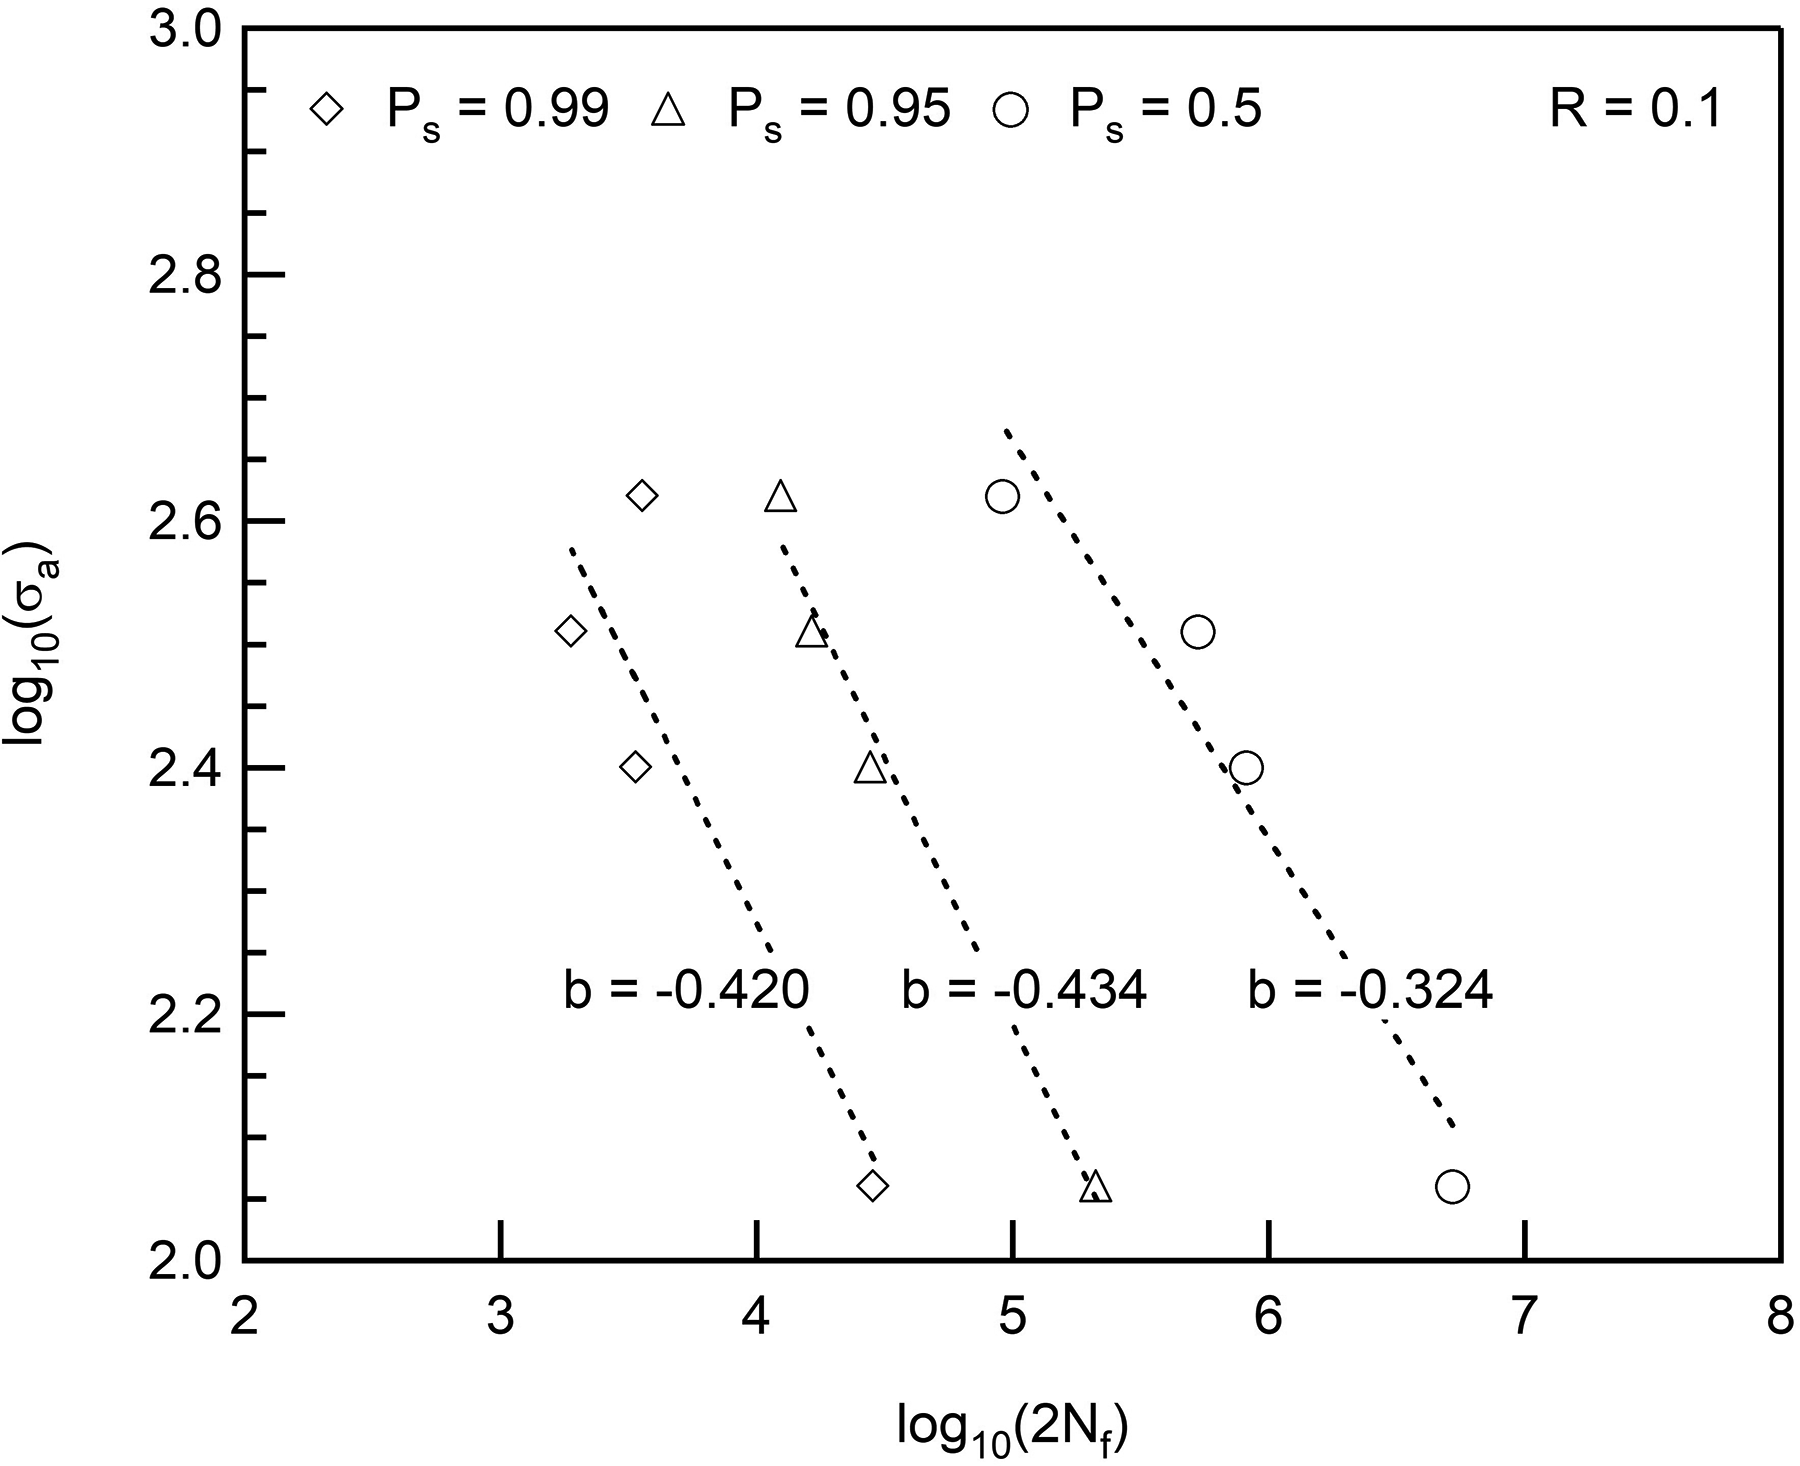
Logarithmic plot of stress amplitude (σa) versus reversals to failure (2Nf) for the additively manufactured alloy 718 fatigue data tested at a load ratio of R = 0.1. The calculated fatigue strength exponent (b) for survival probabilities of Ps = 0.99, 0.95 and 0.5 are also included in the figure.
Figure 4 shows the same fatigue data for additively manufactured alloy 718 that is presented in Figure 1 with stress versus cycles to failure curves corresponding to calculated survival probabilities of 99%, 95% and 50% superimposed on top. The superimposed probability of survival curves does not extend beyond a stress amplitude of 600 MPa for load ratios of R = 0 and 0.1, or below 100 MPa for all cases due to the lack of data at these stress amplitude regimes.
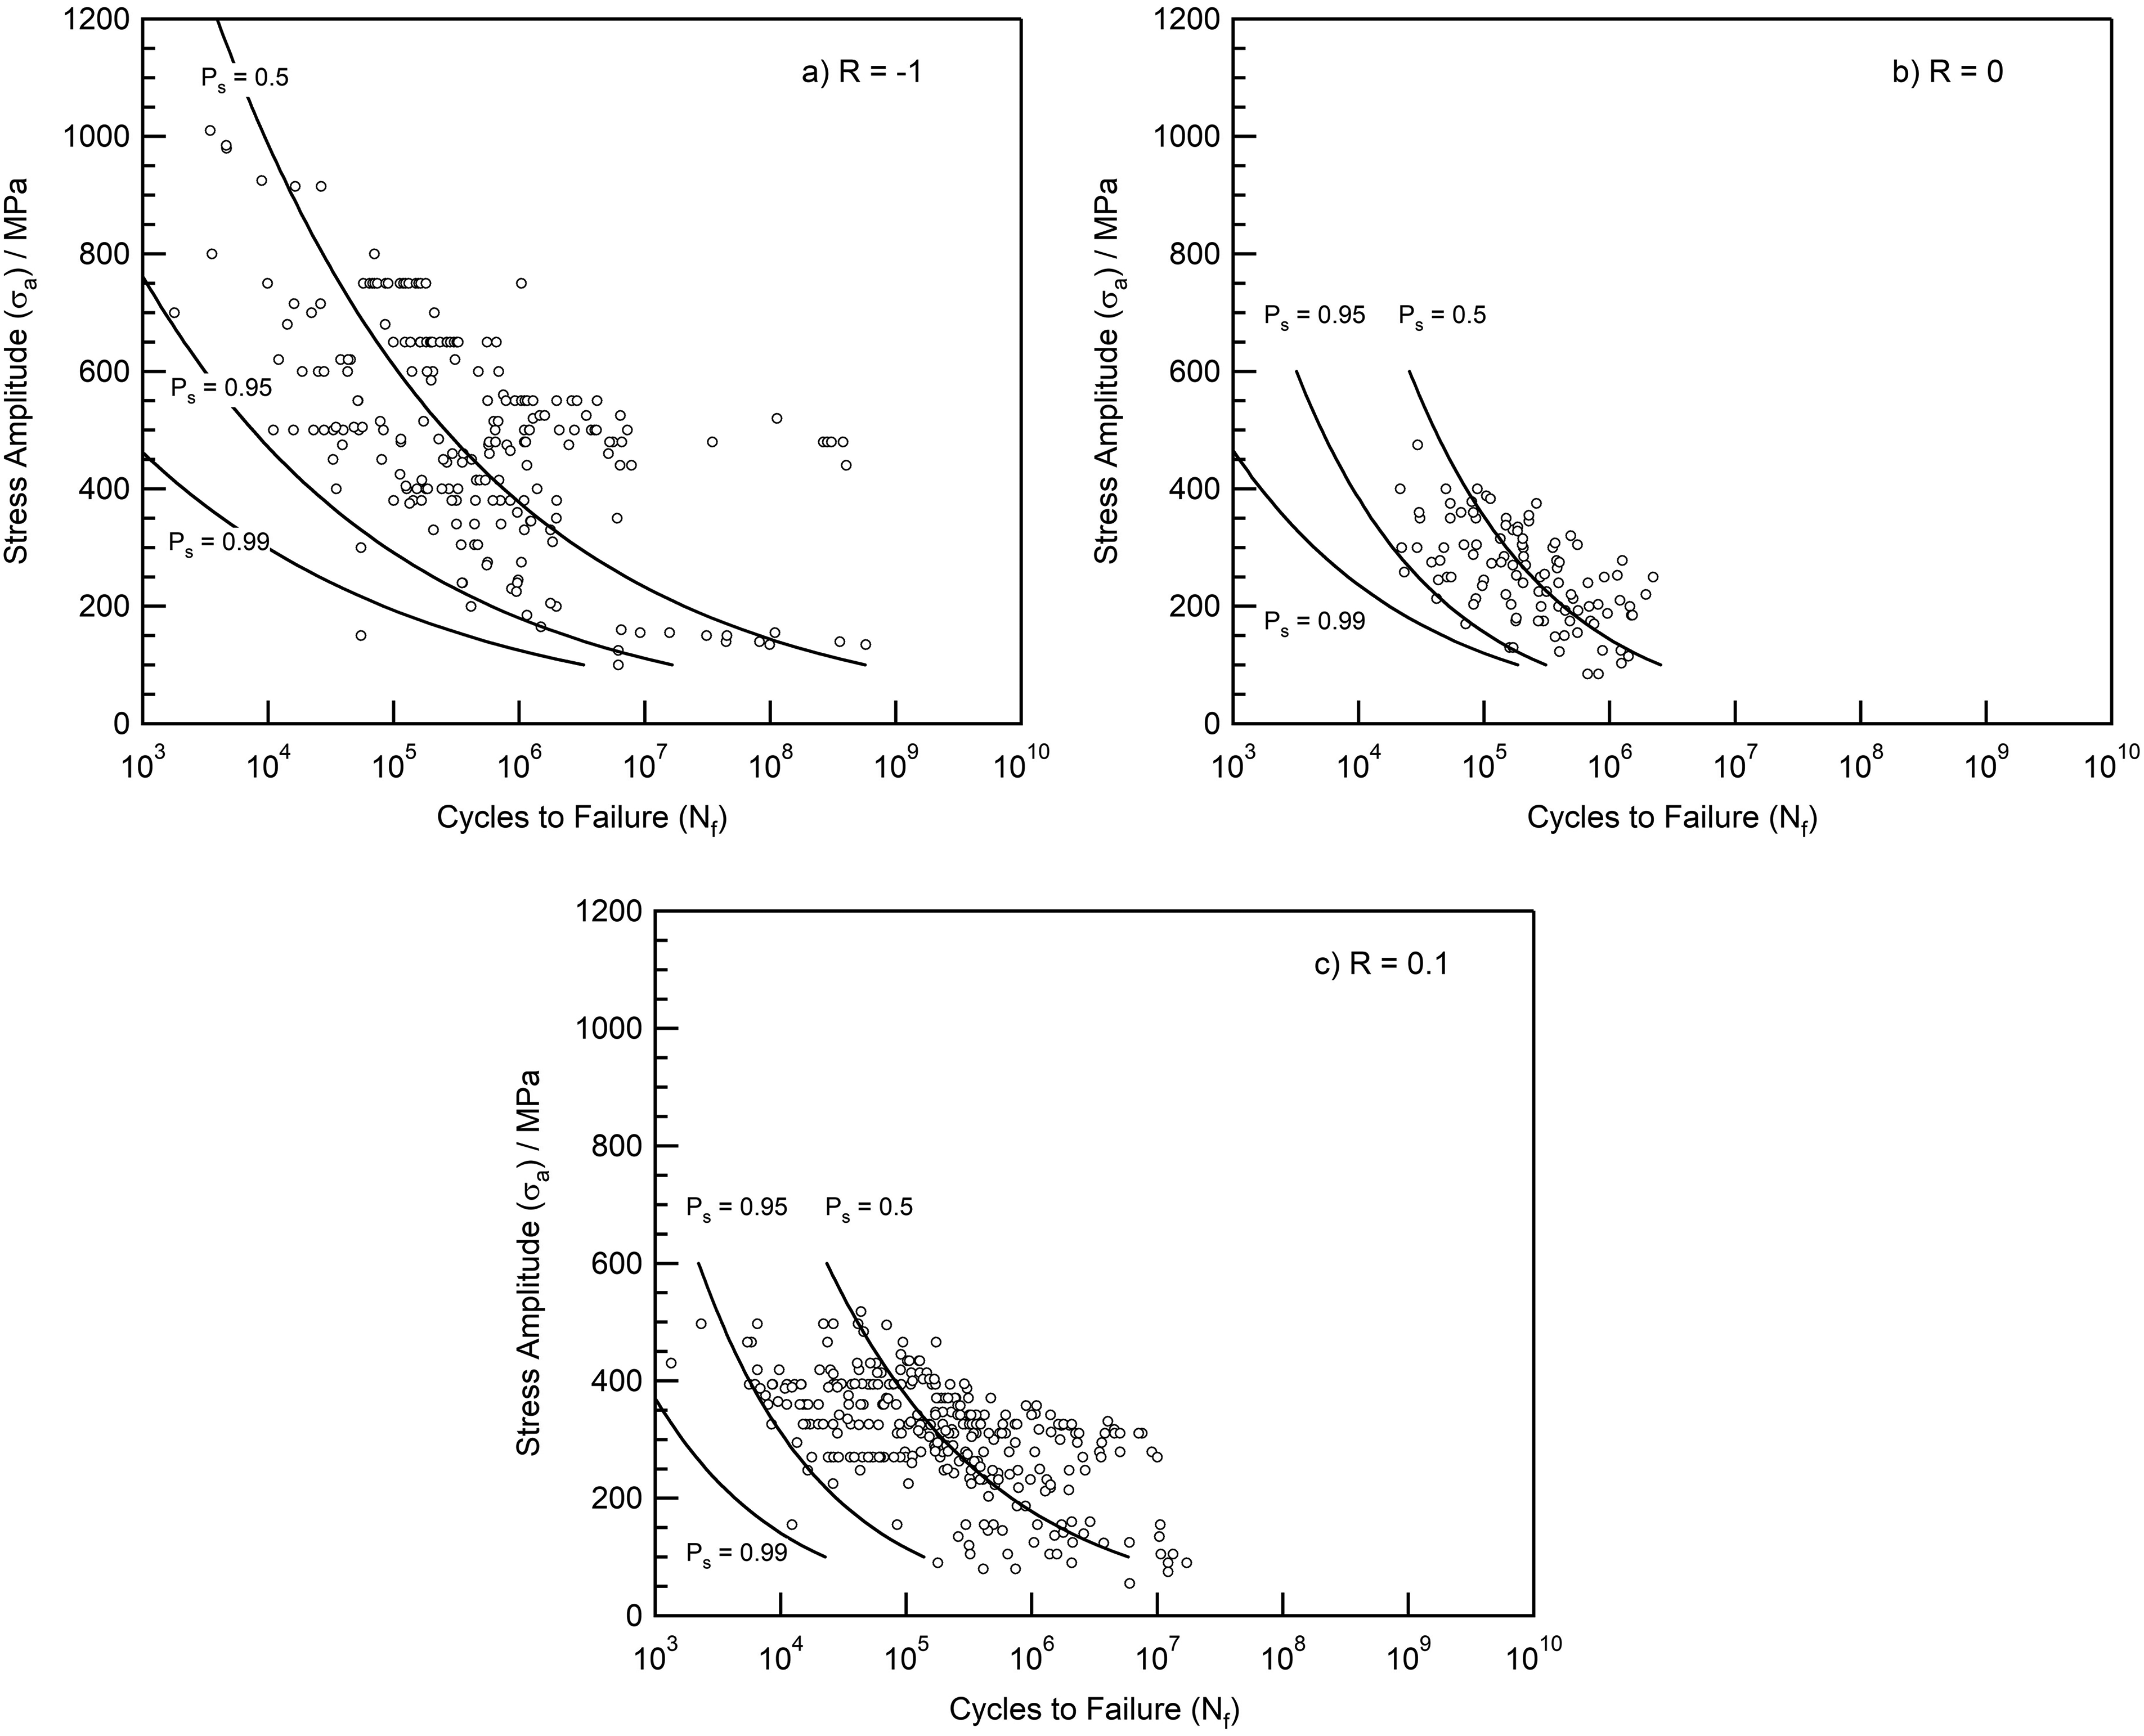
Fatigue data for additively manufactured alloy 718 extracted from the technical literature presented in the form of stress versus cycles to failure (S–N) scatter plots. S–N curves corresponding to the calculated survival probabilities of Ps = 99%, 95% and 50% are superimposed onto the fatigue data. (a) Load ratio, R = −1, (b) load ratio, R = 0 and (c) load ratio, R = 0.1.
The effect of load ratio, R, on the fatigue performance of additively manufactured alloy 718 is summarised in Figure 5. Stress versus cycles to failure curves, represented by the calculated 50% probability of survival curves, for load ratios of R = −1, 0 and 0.1 are given in Figure 5a. It is evident that a superimposed, positive mean stress leads to an overall reduction in the fatigue performance of additively manufactured alloy 718, as would typically be expected for engineering alloys under cyclic loading conditions,13,24 although the difference in fatigue life between load ratios of R = 0 and 0.1 is negligible. The effect of mean stress on fatigue performance is also summarised in the form of a constant-life diagram in Figure 5b. Here, the conservative Soderberg relationship 25 has been used to fit constant-life lines corresponding to endurance limits of 105 and 106 cycles to the mean-stress data for additively manufactured alloy 718. For this analysis, the yield strength was taken to be that of the wrought condition from Ref., 26 as the yield strength for additively manufactured alloy 718 in the heat-treated condition ranges from ∼930 to ∼1200 MPa, 19 but is reported to be a low as ∼630 MPa for as-built material. 2 The Soderberg equation is considered a conservative approach to model the mean-stress behaviour of engineering alloys, 25 but it appears to provide a reasonable fit to the various combinations of stress amplitude and mean stress for additively manufactured alloy 718; particularly for a constant fatigue life of 105 cycles to failure. There does appear to be a slight depression in the constant-life line for 106 cycles, but it would be unwise to draw any significant conclusions at this stage due to the limited number of stress amplitude and mean stress combinations reviewed in this study, and the range of reported values for yield strength.
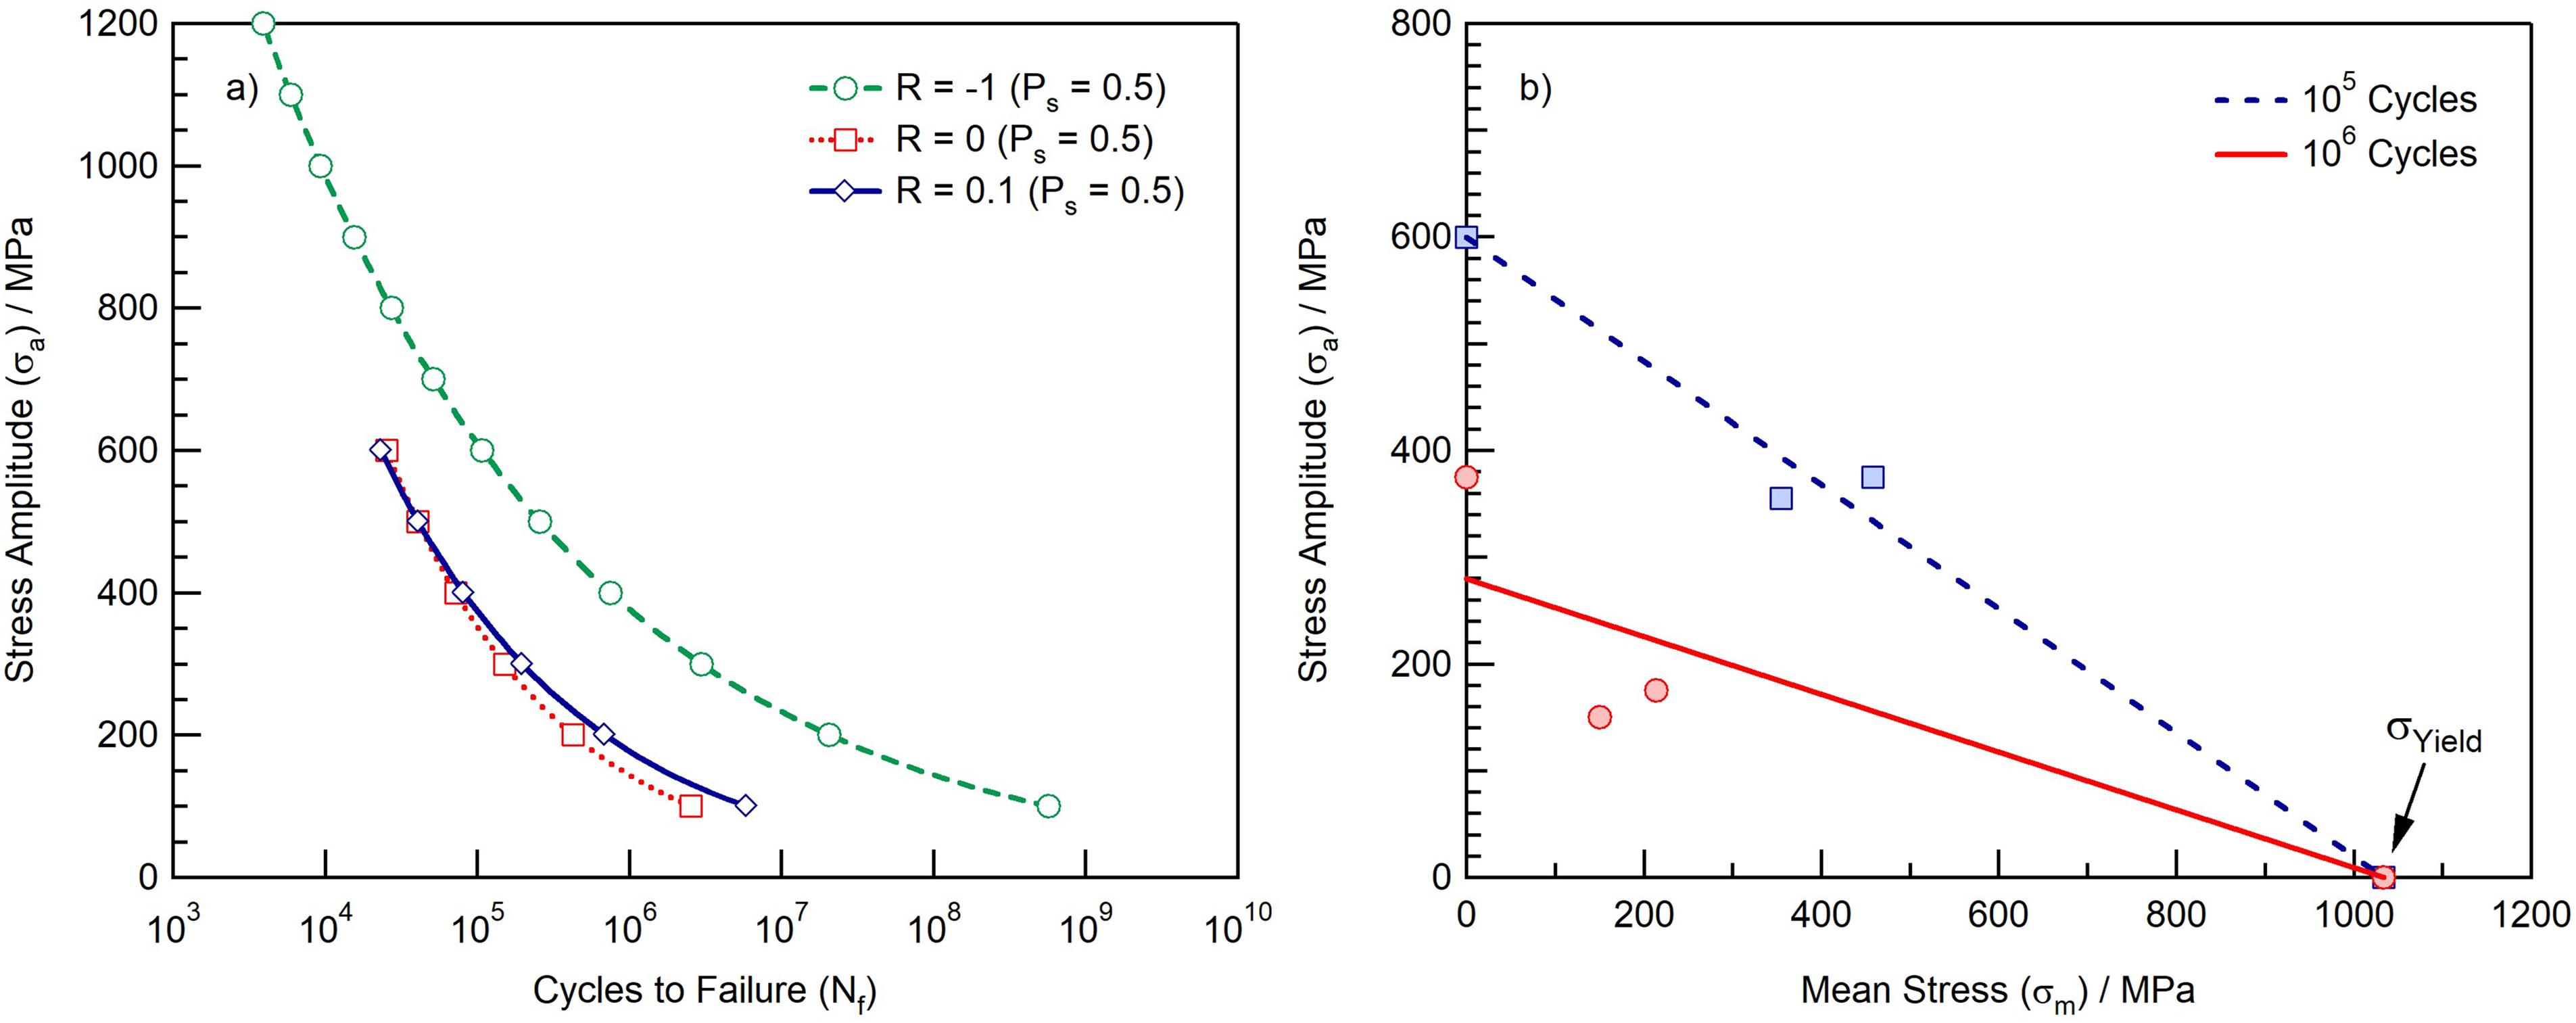
The effect of load ratio, R, on the fatigue performance of additively manufactured alloy 718. Stress versus cycles to failure curves, represented by the calculated 50% probability of survival curves, for load ratios of R = −1, 0 and 0.1 are presented in (a) and a constant-life diagram for 105 and 106 cycles to failure, assuming the Soderberg equation is valid, is given in (b).
Comparisons between the wrought and additively manufactured condition
A comparison between the fatigue performance of additively manufactured and wrought alloy 718 under fully reversed loading conditions (R = −1) is shown in Figure 6. For this comparison, data for the wrought condition were collected from the literature26–28 and compared with the S–N curves representing a survival probability of Ps = 0.5 and 0.95 for additively manufactured alloy 718. Care should be taken, however, when comparing fatigue performance of the additively manufactured and wrought conditions, as it is unclear whether the stress versus cycles to failure data in the literature26–28 correspond to a particular survival probability. Nevertheless, Figure 5 suggests that additively manufactured alloy 718 generally demonstrates similar fatigue properties to the wrought condition at stress amplitudes greater than ∼600 MPa (assuming a survival probability of 50%), but fatigue performance weakens at lower stress amplitudes. These findings reinforce the studies available in the literature, which mostly concluded that additively manufactured alloy 718 displays a poorer fatigue life compared to the wrought condition, however, under certain conditions the performance of additively manufactured alloy 718 is comparable to the wrought condition (see, e.g. the fatigue data from studies 1 2 and 9 10 in Figure 1a). Figure 6 supports the work performed by Sheridan et al. 21 who also reported that wrought and additively manufactured alloy 718 exhibited similar fatigue lives at higher stress amplitudes. With decreasing amplitudes, however, the fatigue lives became increasingly separated in favour of the wrought condition. Sheridan et al. 21 attributed this to the bulk material used in AM, which initially behaved in a similar manner to wrought, but was more prone to defects initiated earlier in the material's life resulting in earlier failures. Research undertaken by Nishikawa et al., 19 Balachandramurthi et al. 14 and Wan et al. 15 reinforce these findings as they identified that different AM methods can introduce surface defects, which greatly impair the HCF life. For example, EBM creates a rougher surface finish compared to SLM and many specimens included in this sample set were manufactured via EBM. This is supported by Konečná et al. 8 and Yadollahi et al., 22 who found surface finish has a significant influence on fatigue life, as a smooth finish reduces the number of surface stress concentrators, which would clearly lead to an increase in the HCF life. Komarasamy et al. 17 also suggested this could be due to an extensive grain boundary δ-phase present, although no other study refers to this.
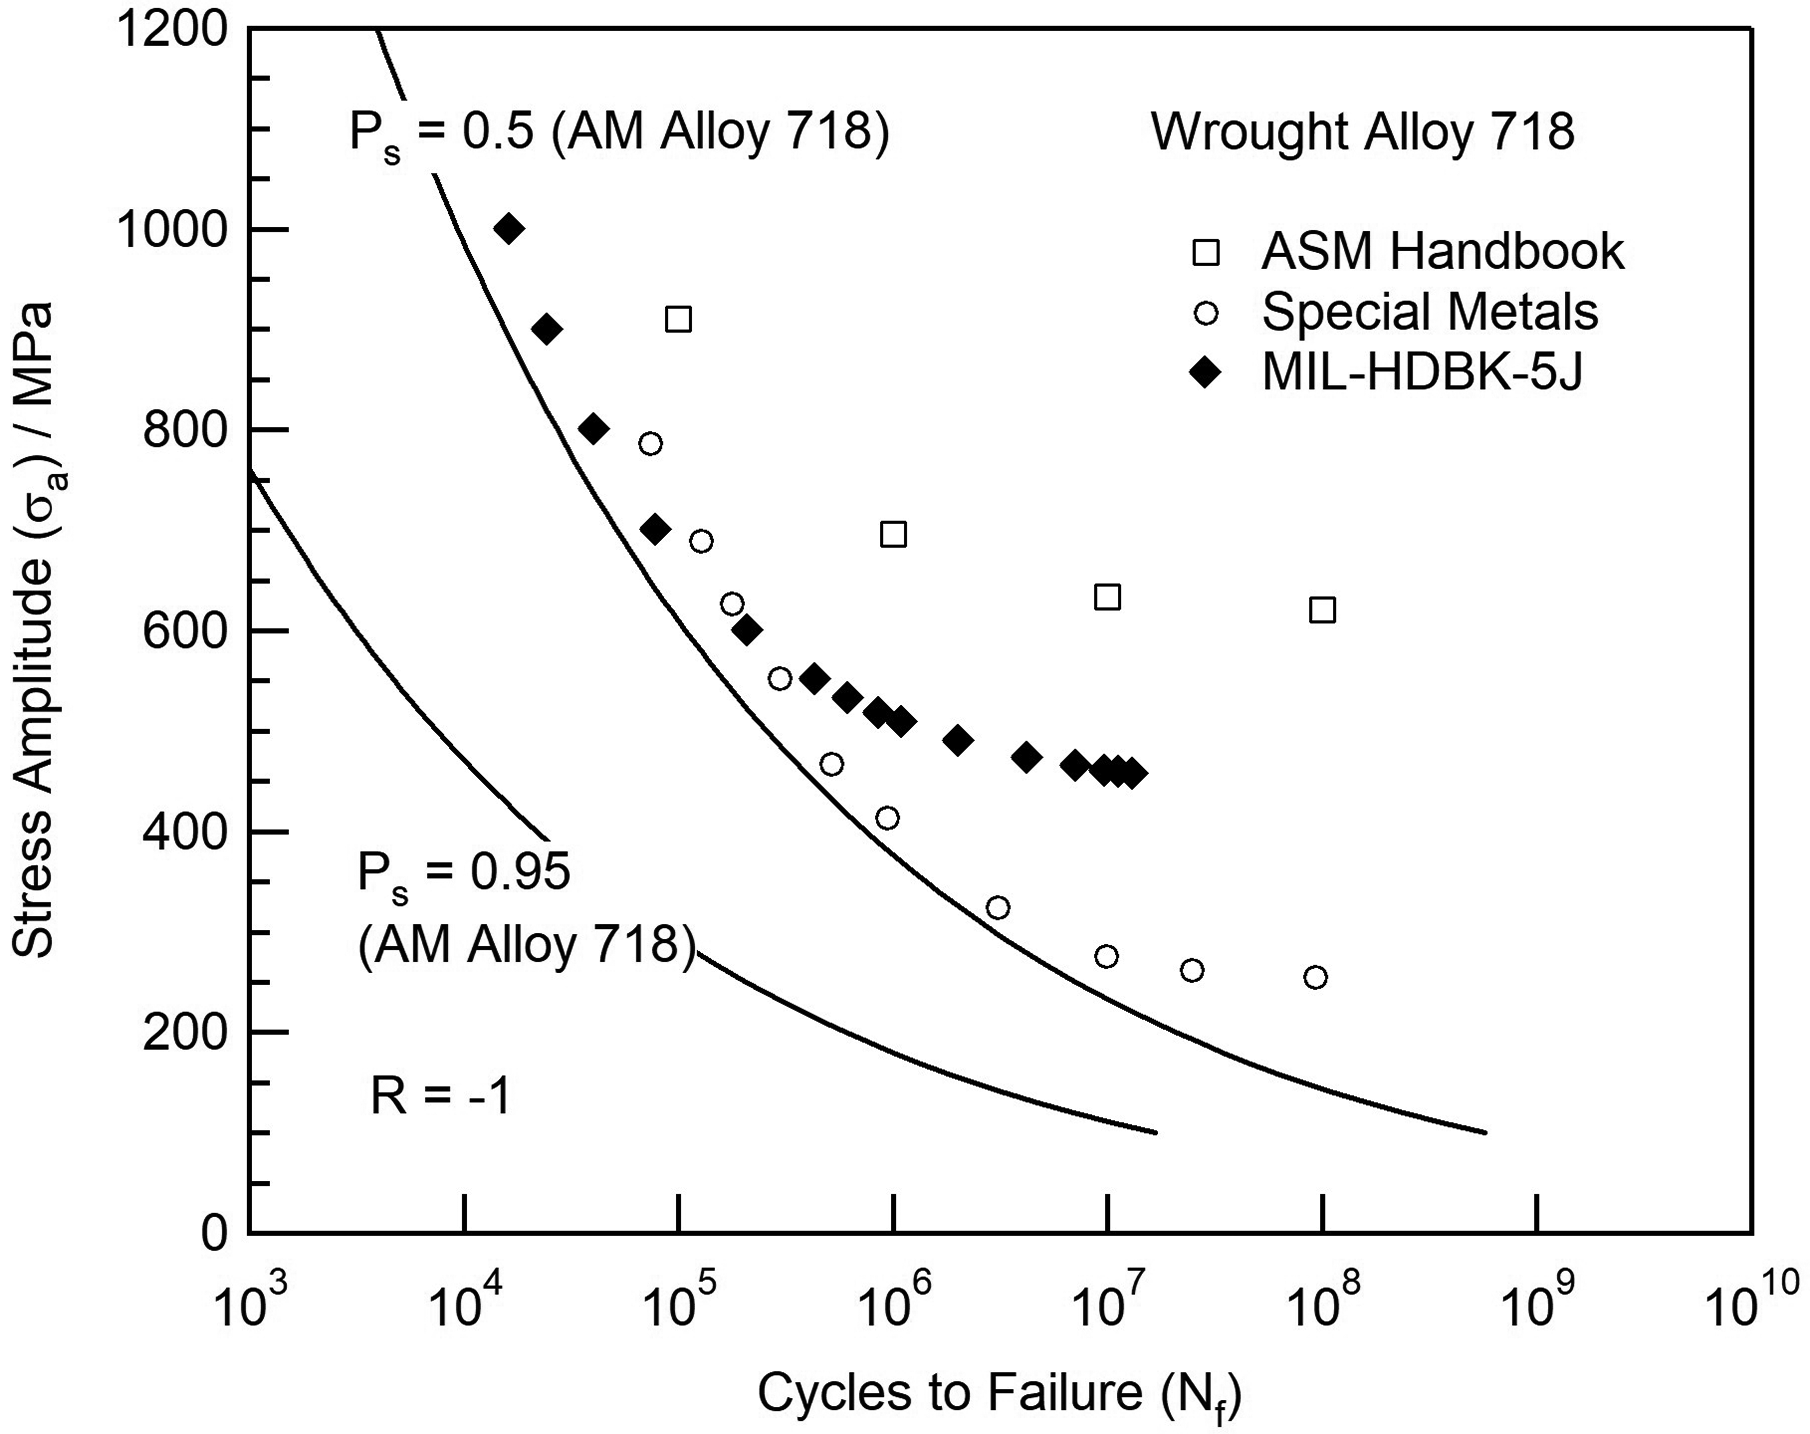
A comparison of the fatigue performance between wrought and additively manufactured alloy 718. Fatigue data for the wrought condition is from the ASM speciality handbook, 27 a datasheet provided by Special Metals Corporation 26 and the US Department of Defense handbook MIL-HDBK-5J. 28 The fatigue performance of additively manufactured alloy 718 is represented by the calculated 50% and 95% probability of survival curves, which are also shown in Figure 4.
Conclusions
A survey of the HCF performance of additively manufactured alloy 718 reported in the technical literature has been performed. Data were collected for load ratios of R = −1, 0 and 0.1, for a variety of processing conditions, surface finishes, and post-build heat treatments, and presented in the form of stress versus cycles to failure graphs. Considerable scatter in the fatigue data exists due to the range of processing and surface conditions reported in this survey and for this reason, a Weibull analysis was conducted on the fatigue data extracted from the literature to produce stress versus cycles to failure curves representing survival probabilities of 50%, 95% and 99%. These probabilities of survival curves are not intended for engineering design purposes, but rather to give researchers working in the field of AM a baseline level of performance of additively manufactured alloy 718. Mean-stress effects have also been investigated and the effect of positive mean stress (R = 0 and 0.1) on the fatigue endurance limit additively manufactured alloy 718 has been presented in the form of a constant-life diagram for endurance limits of 105 and 106 cycles. Finally, a comparison between the fatigue performance of additively manufactured and wrought alloy 718 under fully reversed loading conditions (R = −1) is provided. Additively manufactured alloy 718 generally demonstrates similar fatigue properties to the wrought condition at stress amplitudes greater than ∼600 MPa, but fatigue performance weakens at lower stress amplitudes, which is likely due to the propensity for defect formation during the AM process.
Footnotes
Acknowledgements
We would like to thank Professor Martin Jackson for useful discussions during the preparation of this manuscript.
Declaration of conflicting interests
The authors declared no potential conflicts of interest with respect to the research, authorship, and/or publication of this article.
Funding
The authors received no financial support for the research, authorship, and/or publication of this article.