
Abstract
In Nigeria, the Unified Tertiary Matriculation Examination (UTME), a large-scale university admission examination, was fully computerised in 2015. However, knowledge gap and digital divide are prevalent in developing countries, which may impact students’ performance in computer-based tests (CBT). To this end, this study investigates ICT-related individual differences (computer familiarity/experience, CBT anxiety and CBT attitude) among secondary school students taking UTME and its effects on their performance on the test in Osun state, Nigeria, considering their locations (rural/urban) and school types (public/private). The study adopted a quantitative survey for data collection from final-year secondary school students who registered and took 2021 UTME. The study's findings revealed significant variations in the access and use of computers among students taking UTME. It was found that all students from private schools had prior computer experience, whereas 11% of students from public schools had not used a computer before. Within the group of students without prior computer experience, 63% were from rural public schools. Furthermore, computer familiarity positively correlates with students’ performance in UTME. For instance, students who have taken CBT at least six times before UTME have significantly better performance than those who have not taken CBT at all. However, CBT attitude and anxiety before and after the examination were moderate and had no significant relationship with test performance. We conclude that affordable and easily accessible ICT facilities and CBT practice centres should be provided to students, especially those in disadvantaged areas, to ensure the fairness of UTME to all candidates.
Introduction
In Nigeria, a significant discrepancy exists between the mode of learning in schools and the computer-based assessment method adopted for high-stakes examinations. The Unified Tertiary Matriculation Examination (UTME) has been established as a standardised prerequisite examination for tertiary admission seekers in Nigeria since 1978 but fully adopted the computer-based test (CBT) for its exclusive conduct in 2015 (Abdulkadir et al., 2019). However, many high schools have yet to implement computer-assisted learning fully, and the accessibility of computers to most students, particularly in rural Nigeria, is limited (Osuafor and Osisioma, 2000; Ukpebor and Emojorho, 2012; Olanrewaju et al., 2021). Consequently, many potential UTME examinees may have limited computer experience or no exposure to computers before the UTME examination.
While extensive literature discusses the validity and justification of (CBT), some concerns remain regarding the potential disadvantages specific groups face due to a lack of computer familiarity or proficiency (Mcdonald, 2002; Chan et al., 2018). While the computer familiarity gap tends to diminish in populations where technology is integrated into daily life and educational systems (OECD, 2015), it may be far-reaching to establish CBT equivalence to paper-based testing (PPT) in settings where technology adoption is still in its infancy and computer use is rare in teaching and learning environments. Establishing the equivalency of CBT with PPT becomes particularly critical for high-stakes examination (George et al., 1992; Kvĕton et al., 2007). This ensures that no test mode bias should provide an automatic advantage to any individual over another. Consequently, further research is needed, particularly in developing and technology-deprived nations.
In Nigeria, where there is clear digital access disparity, more research is needed to explore the influence of the digital gap on students’ experiences and performance in large-scale high-stakes exams like the UTME. As a result, the aim of this research is to investigate differences in computer familiarity, CBT attitude, and CBT anxiety among UTME candidates from private and public secondary schools in rural and urban Nigeria. Furthermore, we want to investigate the association between computer familiarity, CBT attitude, CBT anxiety, and students’ computerised test results. The findings of this research will add to the current literature in the area of Information Systems by providing additional insights on the technology-related individual differences of students taking the UTME in Nigeria and the influence of these variations on their experiences and performance.
Understanding the obstacles and possibilities connected with computer-based testing in Nigeria and the consequences for students’ performance and experiences may help improve education policy and decision-making. Furthermore, the findings of this study may be used to influence the creation of targeted interventions to bridge the digital gap and provide fairness and equity in educational opportunities for all students. By expanding the knowledge in this area, the effectiveness and reliability of computer-based assessments can be enhanced, support educational reforms, and promote digital integration within Nigeria's educational system. Research Questions
Are UTME examinees’ computer familiarity/experience differences based on their school type (public versus private) and location (urban versus rural)? What is the relationship between aspects of computer familiarity/experience of UTME examinee and their test score? Are differences among UTME examinees’ anxiety to CBT before and after UTME based on their school type (public versus private) and location (urban versus rural)? Does the UTME examinees’ anxiety about CBT before and after UTME predict their score in UTME? Are differences among UTME examinees’ attitudes to CBT before and after UTME based on their school type (public versus private) and location (urban versus rural)? Does the UTME examinees’ attitude to CBT before and after UTME predict their score in UTME?
Background and related work
Nigeria tertiary education admission requirement
Standardised examination requirements for tertiary education admission vary from country to country. Some countries use a centralised system, where admission is majorly dependent on a single exam. The results are used for admission processing in the university of choice. However, countries like Nigeria have multi-faceted examinations for deducing the tertiary education potential of applicants. To be qualified for admission into various Nigerian institutions, tertiary admission seekers usually take two standardised examinations to gain admission, a centralised exam- UTME and at least one of the Senior Secondary Certificate Examination (SSCE), General Certificate Examination (GCE) or their equivalent. In addition, most government-owned institutions require students to take an additional post-UTME exam to further assess candidates’ competencies. However, UTME is a centralised examination only conducted by Joint Admissions and Matriculation Board (JAMB) once a year, and there is no direct equivalent. Approximately 2 million Nigerian tertiary institution admission seekers take UTME yearly (Umeh, 2022).
UTME structure
Before 2013, the Joint Admissions and Matriculation Board (JAMB) conducted the Unified Tertiary Matriculation Examination (UTME) using paper-and-pencil testing (PPT) exclusively (Okoye and Duru, 2020). However 2013, CBT was introduced as an optional test mode alongside PPT (Okoye and Duru, 2020). During this partial adoption phase in 2013 and 2014, candidates could choose to write their exams using PPT, CBT or a combination of both, where questions were displayed on the computer screen while answers were provided on paper (Okoye and Duru, 2020). In 2015, JAMB completely transitioned to computer-based testing due to the high prevalence of examination malpractices and the need to promote computer-administered assessments in Nigeria (Abubakar and Adebayo, 2014; Abdulkadir et al., 2019). CBT-supporting technologies enable users’ identity verification through biometrics, and with a large question bank, test takers may not have identical test questions simultaneously.
UTME is a tertiary admission requirement conducted exclusively using a computer in Nigeria (JAMB, 2021). The exam consists of multiple-choice questions, with 60 questions for the use of English and 40 questions each for the remaining three subjects of choice, making a total of 180 questions and a cumulative maximum score of 400 (JAMB, 2023a). Due to the limited number of IT facilities and the large number of candidates, the UTME is usually spread over several days. To accommodate this number of candidates, JAMB accredits centres nationwide with the required ICT facilities to coordinate and conduct UTME (JAMB, 2021). Candidates are assigned to exam centres based on their location and given dates and time slots for their respective examinations (JAMB, 2023b). JAMB also provides a mock exam, which allows interested students to practice the UTME in a simulated environment a few weeks before the actual examination commencement (JAMB, 2021). This test can only be taken in one of JAMB's accredited centres.
Theoretical model adoption
Van Dijk's digital divide theory- the resources and appropriation theory, highlights how personal and positional inequalities lead to unequal access to digital technologies, resulting in varying degrees of social participation (van Dijk, 2005; 2012). The theory recognises the influence of technology characteristics on access inequality and acknowledges that contextual factors shape the societal effects of digital technology. Also, the theory ascertains that personal traits can all impact these disparities. Hence, geographical, demographic and socio-economic factors (e.g., age, gender, income, belief/culture, education, employment, caste and language competency) determine the level of technology assessment and competency (Okunola et al., 2017; Scheerder et al. 2017; Wamuyu, 2017). This theory provides a broader framework for this study, emphasising digital inequalities caused by variations in access and utilisation. The Knowledge Gap Theory complements these ideas, suggesting that ICTs can widen knowledge gaps between socio-economic groups (Tichenor et al., 1970). The Knowledge Gap Theory suggests that individuals with greater access to information and technology will be better equipped to acquire and apply knowledge effectively.
The digital divide in Africa, particularly in rural areas, is more pronounced; there are low internet access and inadequate information technology infrastructures (Thompson and Walsham, 2010; Mpofu and Chikati, 2013; Okunola et al., 2017; Azubuike et al., 2021; Olanrewaju et al., 2021). This divide exacerbates developing countries’ socio-economic, political, and educational differences (Okunola et al., 2017). Research conducted in Nigeria reveals disparities in ICT access and infrastructure between urban and rural areas, as well as socio-economic inequalities and unstable electricity hindering technological development and access (Okunola et al., 2017). Furthermore, in Nigeria, private schools generally have better infrastructures than public schools and are usually accessible to those from privileged backgrounds (Olasehinde and Olatoye, 2014). Studies show significant ICT availability and knowledge discrepancies between urban and rural secondary school students in Nigeria (Osuafor and Osisioma, 2000). Additionally, there is a notable gap in ICT accessibility between the private and public sectors, with private schools having more resources (Ukpebor and Emojorho, 2012; Mpofu and Chikati, 2013). These disparities in digital technology access and use may contribute to unequal educational opportunities and hinder the overall development of disadvantaged students who lack essential ICT tools and skills.
Computer familiarity and proficiency
Previous research has extensively examined the influence of computer experience on test performance, particularly in the context of computerised exams (Mazzeo et al., 1991; Bugbee, 1996; Clariana and Wallace, 2002; Mcdonald, 2002; Chan et al., 2018). These studies have shed light on the significance of computer familiarity as a potential factor impacting the comparability of test modes, specifically computer-based testing (CBT) and paper-and-pencil testing (PPT). Furthermore, it has been observed that participants tend to possess similar levels of computer exposure when computer familiarity is not considered a moderating factor in CBT performance. For instance, Akdemir and Oguz (2008) presumed that students who completed departmental computer courses possess adequate computer proficiency for navigating CBT.
Moreover, studies by Goldberg and Pedulla (2002), Zou and Chen (2016); Shirzad and Shirzad (2017) have demonstrated that students with greater prior computer expertise tend to perform better in CBT. For example, Goldberg and Pedulla (2002) conducted a comprehensive investigation into the relationship between computer familiarity and examinee performance in different test modes, namely PPT, editorial-controlled CBT, and uncontrolled CBT, within the Graduate Record Examinations (GRE) context. The study revealed that participants who undertook the PPT format outperformed those in the uncontrolled CBT format across all subjects. However, in the analytical subtest, the controlled CBT group demonstrated superior performance compared to the uncontrolled CBT group. Computer familiarity positively correlated with performance in the analytical and quantitative subtests. Students with a higher level of computer familiarity showcased faster response times when answering questions, unlike their counterparts with less developed computer skills.
In their study, Zou and Chen (2016) investigated the impact of test mode on examinees’ cognitive writing process and writing scores in the English Language exam. They explored how different levels of computer experience influenced performance. The findings revealed that students achieved significantly higher scores on the traditional PPT compared to the CBT. Additionally, there was a positive relationship between familiarity with CBT and increased average scores. Examinees with limited computer backgrounds demonstrated the largest score disparities when comparing CBT to PPT. Interestingly, the study discovered that familiarity with computers did not significantly influence the cognitive processes involved in writing. Regardless of the test mode, examinees were able to develop their ideas effectively. The researchers hypothesised that individuals less comfortable with computers might face challenges in organising their thoughts on a computer, which could explain the lower scores observed in CBT for these individuals. Moreover, Shirzad and Shirzad (2017) suggested that students with limited computer proficiency may allocate more cognitive resources when taking computer-based writing tests. This could potentially lead to decreased performance among digitally disadvantaged students in computer-based examinations.
However, it is crucial to note that the literature contains conflicting data about the relationship between test-takers computer experience or familiarity and computer-based testing (CBT) performance. Clariana and Wallace (2002); Al-amri (2007); Hosseini et al. (2014) found no significant relationship between computer experience/familiarity and CBT performance. These inconsistencies imply that the effect of computer familiarity or skills on test performance may differ between contexts and populations. However, given the current contradictions in the literature, findings from other contexts may be restricted in their applicability to Nigeria. In the case of Nigeria, a country with a considerable technological access gap, computer familiarity and skill may have a significant impact on computer-based test results. As a result, more study is needed to investigate the association between computer familiarity and CBT performance, particularly in developing countries like Nigeria, where CBT is used for high-stakes university entrance tests. Considering this background, we formulated research questions R1 and R2.
Computer-based test anxiety
Individual differences in computer anxiety may significantly impact test performance (Anderson, 1996; Mcdonald, 2002). Computer anxiety refers to an irrational fear that hinders a person's ability to interact with a computer, even in the absence of any real threat (Howard, 1987). This fear often leads to avoidance behaviour, heightened state anxiety, and slower task completion when using a computer (Mahar et al., 1997). Computer anxiety can manifest in various ways, such as reluctance to discuss or consider computer technology, physiological symptoms like sweating, headaches, high blood pressure, nausea, and feelings of anger or violence that may indicate underlying dissatisfaction (Chou, 2003).
The level of familiarity with computers has been identified as a critical determinant of computer anxiety. Numerous studies have revealed a negative correlation between computer anxiety and factors such as owning a personal computer, early exposure to computers, perceived advanced computer skills, and frequent computer usage (Korobili et al., 2010; Powell, 2013). Also, research by Cazan et al. (2016), dos Santos and Santana (2018) indicates that individuals with low computer self-efficacy are more likely to experience anxiety. It is worth noting that some studies have found a weak or no relationship between computer familiarity and computer anxiety (Bozionelos, 2001; Wilfong, 2006). Therefore, qualitative exposure to computers may be more crucial in determining computer anxiety than mere familiarity (Gos, 1996).
Computer anxiety affects the examinee's acceptance of CBTs (Stricker et al., 2004). Therefore, anxious examinees might avoid taking CBTs altogether if other alternatives exist. In addition to computer familiarity and efficacy, unforeseen events that occur during computer-based tests can contribute to heightened anxiety levels among examinees (Brosnan, 1998). For example, in places like Nigeria, where power outages are regular, unexpected events like power failures during CBTs may become inevitable. This lack of control over external factors might exacerbate anxiety levels, as examinees may be concerned about losing their progress or failing to complete the test within the allocated time owing to power outages. Recognising the unique challenges that regions with low digital integration and supporting facilities confront is critical, as they can substantially impact the dependability and effectiveness of computer-based testing.
Also, Computer anxiety may significantly impact test performance in computerised tests, as evidenced by several studies (Brosnan, 1998; Shermis and Lombard, 1998; Lu et al., 2016; Shaheen et al., 2022). For example, Lu et al. (2016) investigated the relationship between test anxiety and performance in computerised adaptive exams. Their findings revealed a negative correlation between test anxiety and test performance. Similarly, Brosnan (1998) demonstrated a direct influence of computer anxiety on the number of correct responses obtained in a computer-based test, with less anxious individuals achieving a higher number of correct responses. Additionally, in the study conducted by Shaheen et al. (2022), students with high anxiety exhibited lower test scores, although the difference was statistically insignificant.
However, some studies present contrasting findings (Wise et al., 1989; Kolagari et al., 2018). For instance, Kolagari et al. (2018) investigated the relationship between test anxiety and students’ performance in computer-based tests (CBT) and paper-based tests (PBT). Their results indicated that students experienced comparable anxiety levels regardless of the test mode (CBT or PBT). Furthermore, there were no statistically significant differences in performance between the two examination formats.
The existing literature on computer anxiety suggests that demographic differences and prior computer experience may influence anxiety levels during computer-based tests and, consequently, performance outcomes. Based on these insights, research questions R3 and R4 have been generated.
Computer-based test attitude
Attitudes towards computers encompass individuals’ feelings and beliefs about these technological devices (Laguna and Babcock, 2000). These attitudes play a crucial role in the development of computer skills (Kay, 1993). They are influenced by past experiences and the level of confidence or anxiety associated with using computers (Mcdonald, 2002). Numerous studies show a positive correlation between computer attitudes and computer usage, emphasising the close relationship between these factors (Teo, 2008; Korobili et al., 2010). Furthermore, certain demographic variables, such as geographical location, parental support, and English language proficiency, can impact individuals’ attitudes towards computers (Alothman et al., 2017).
Likewise, examinees of CBT may develop positive attitudes towards a specific examination mode based on its perceived advantages. For example, Ebimgbo et al. (2021) found a positive correlation between computer proficiency and the perceived effectiveness of computer-based tests (CBTs) for large classrooms among Nigerian university undergraduates. Conversely, others may hold negative attitudes towards CBTs due to their perceived disadvantages. For instance, Wibowo et al. (2016) investigated the opinions of academic staff and students regarding CBTs in an Australian university. Some students reported feeling unprepared for electronic tests due to their familiarity with paper-based exams, which made them perceive e-exams as cumbersome. Furthermore, they believed that CBTs could be detrimental as they induced anxiety and potentially led to reduced marks.
The experience of computer-based testing (CBT) can positively influence test takers’ attitudes towards this mode of examination. Pawasauskas et al. (2014) conducted a study to evaluate the transition from traditional test mode to CBT in a university setting, focusing on the perceptions of both students and lecturers regarding this transition. The researchers deployed pre-test and post-test questionnaires to investigate the initial and subsequent perceptions of staff and students regarding the adoption of CBT in the university. The findings of the study revealed that students initially displayed reluctance towards CBT. However, the results indicated a significant improvement in students’ attitudes towards CBT after they had the experience of taking tests in this format. This positive attitude shift suggests firsthand CBT experience can alleviate initial reservations and foster a more favourable perception of computer-based testing.
The attitudes of students towards computer-based testing (CBT) can have a significant impact on their performance. For example, Stricker et al. (2004) found a positive association between attitudes towards computer-based TOEFL and testing performance in three countries. However, Boo and Vispoel (2012), Ebrahimi et al. (2019); Yu and Iwashita (2021) reported no significant difference in test scores between paper-based tests (PBT) and CBT. Furthermore, they found no significant relationship between attitude towards CBT and CBT performance. Interestingly, some students may prefer a specific exam mode but perform better in the other. For example, Hosseini et al. (2014) compared students’ performance and attitudes in English comprehension CBT and PBT. Although students had a more positive attitude towards CBT, they performed better in PBT. Based on the background discussed, more studies are needed to explore the interplay between attitudes, individual differences, and performance in CBT; research questions R5 and R6 are formulated.
Methodology
Participants and data collection procedure
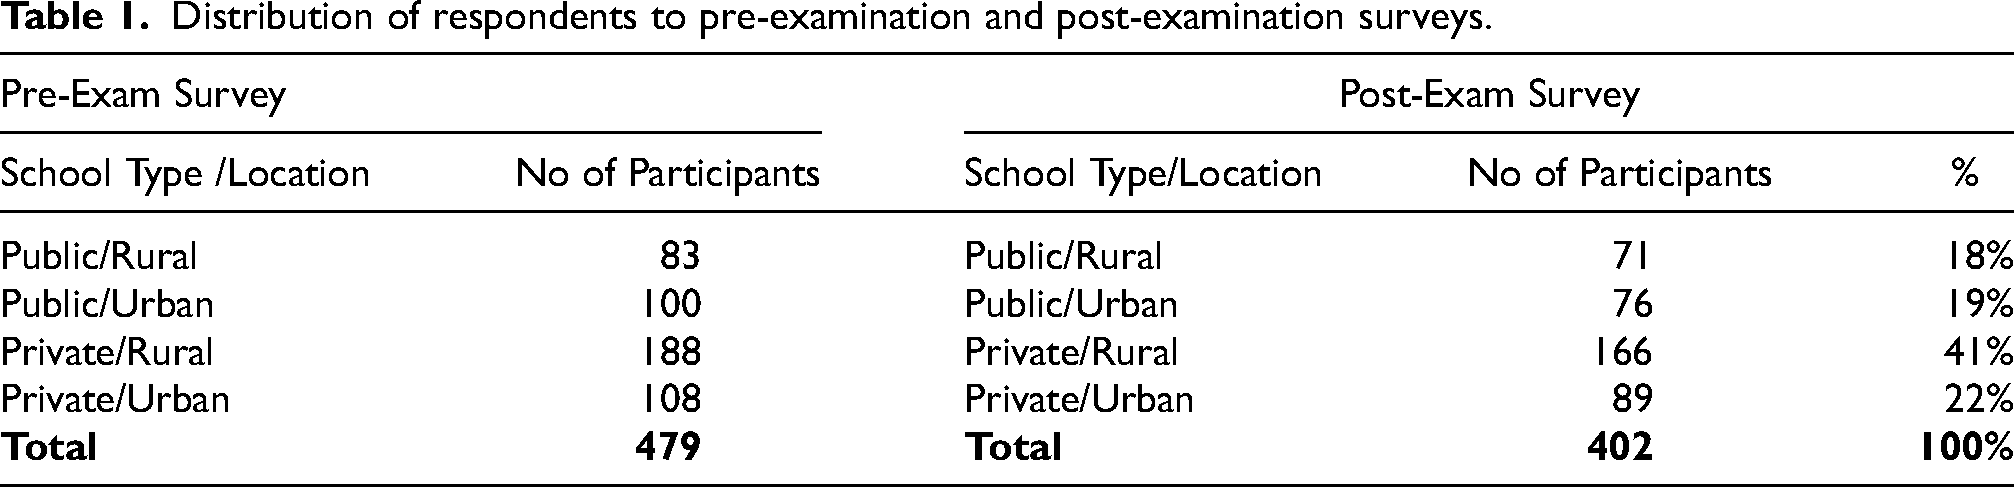
Students who registered and took UTME in 2021 were recruited for this study. Students in their final year of secondary school who plan to pursue tertiary education after secondary school are usually required to pass the UTME. Participants were recruited from 20 secondary schools in Osun state, Nigeria. 5 private schools in the state capital and 5 private schools outside the state capital, 5 public schools in the state capital and 5 public schools outside the state capital. Two phases of data collection were conducted before and after 2021 UTME. In the first phase (May 24-June 4 2021), the survey gathered information regarding respondents’ perceptions of their computer familiarity/experience, CBT anxiety, and CBT attitude. In the second phase of the study (July 21–July 2 2021), the survey captured data on the participants’ CBT anxiety and CBT attitude after the completion of UTME. Both the pre-exam and post-exam questionnaires were distributed to the same group of students. The two questionnaires were compared for each respondent to identify any post-UTME changes in participants’ anxiety and attitude. Questionnaires were distributed to consenting respondents at their respective institutions. Only participants who completed the pre- and post-examination questionnaires were retained for analysis. The distribution of students who participated is shown in Table 1 below.
Distribution of respondents to pre-examination and post-examination surveys.
Instrument
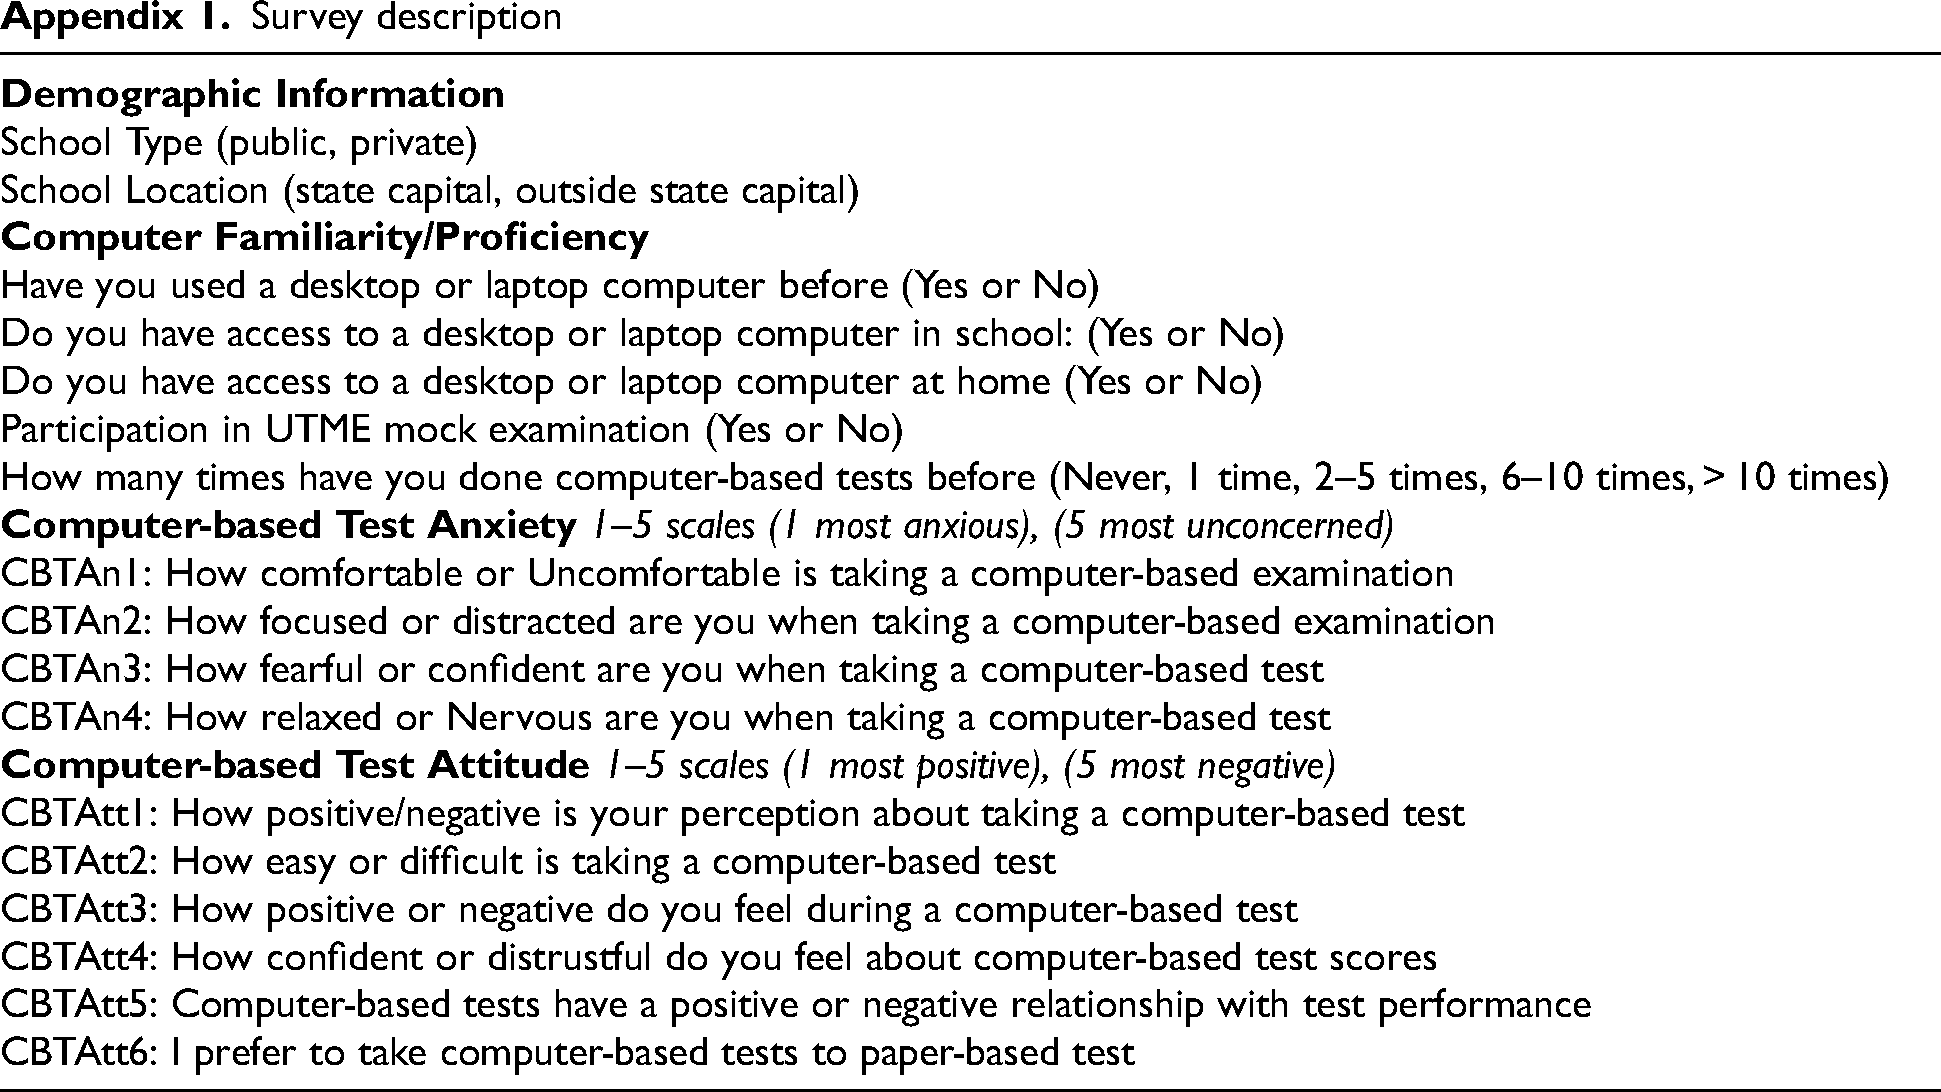
The survey was English based and composed of four main sections: demographical data, computer familiarity/ experience, CBT Anxiety, and CBT Attitudes. This study collected scales from the studies of (Stricker et al., 2004; Adenuga and Mbarika, 2019) and adapted them to this study's context. To ensure the quality and relevance of the questionnaires, we sought the expertise of 2 information science experts. They carefully reviewed and made necessary modifications to the questionnaires. Subsequently, a pilot study involving ten final-year secondary students was conducted. Based on their feedback, minor adjustments were made to improve the wording and phrasing of the questions. For the complete survey, please refer to Appendix A.
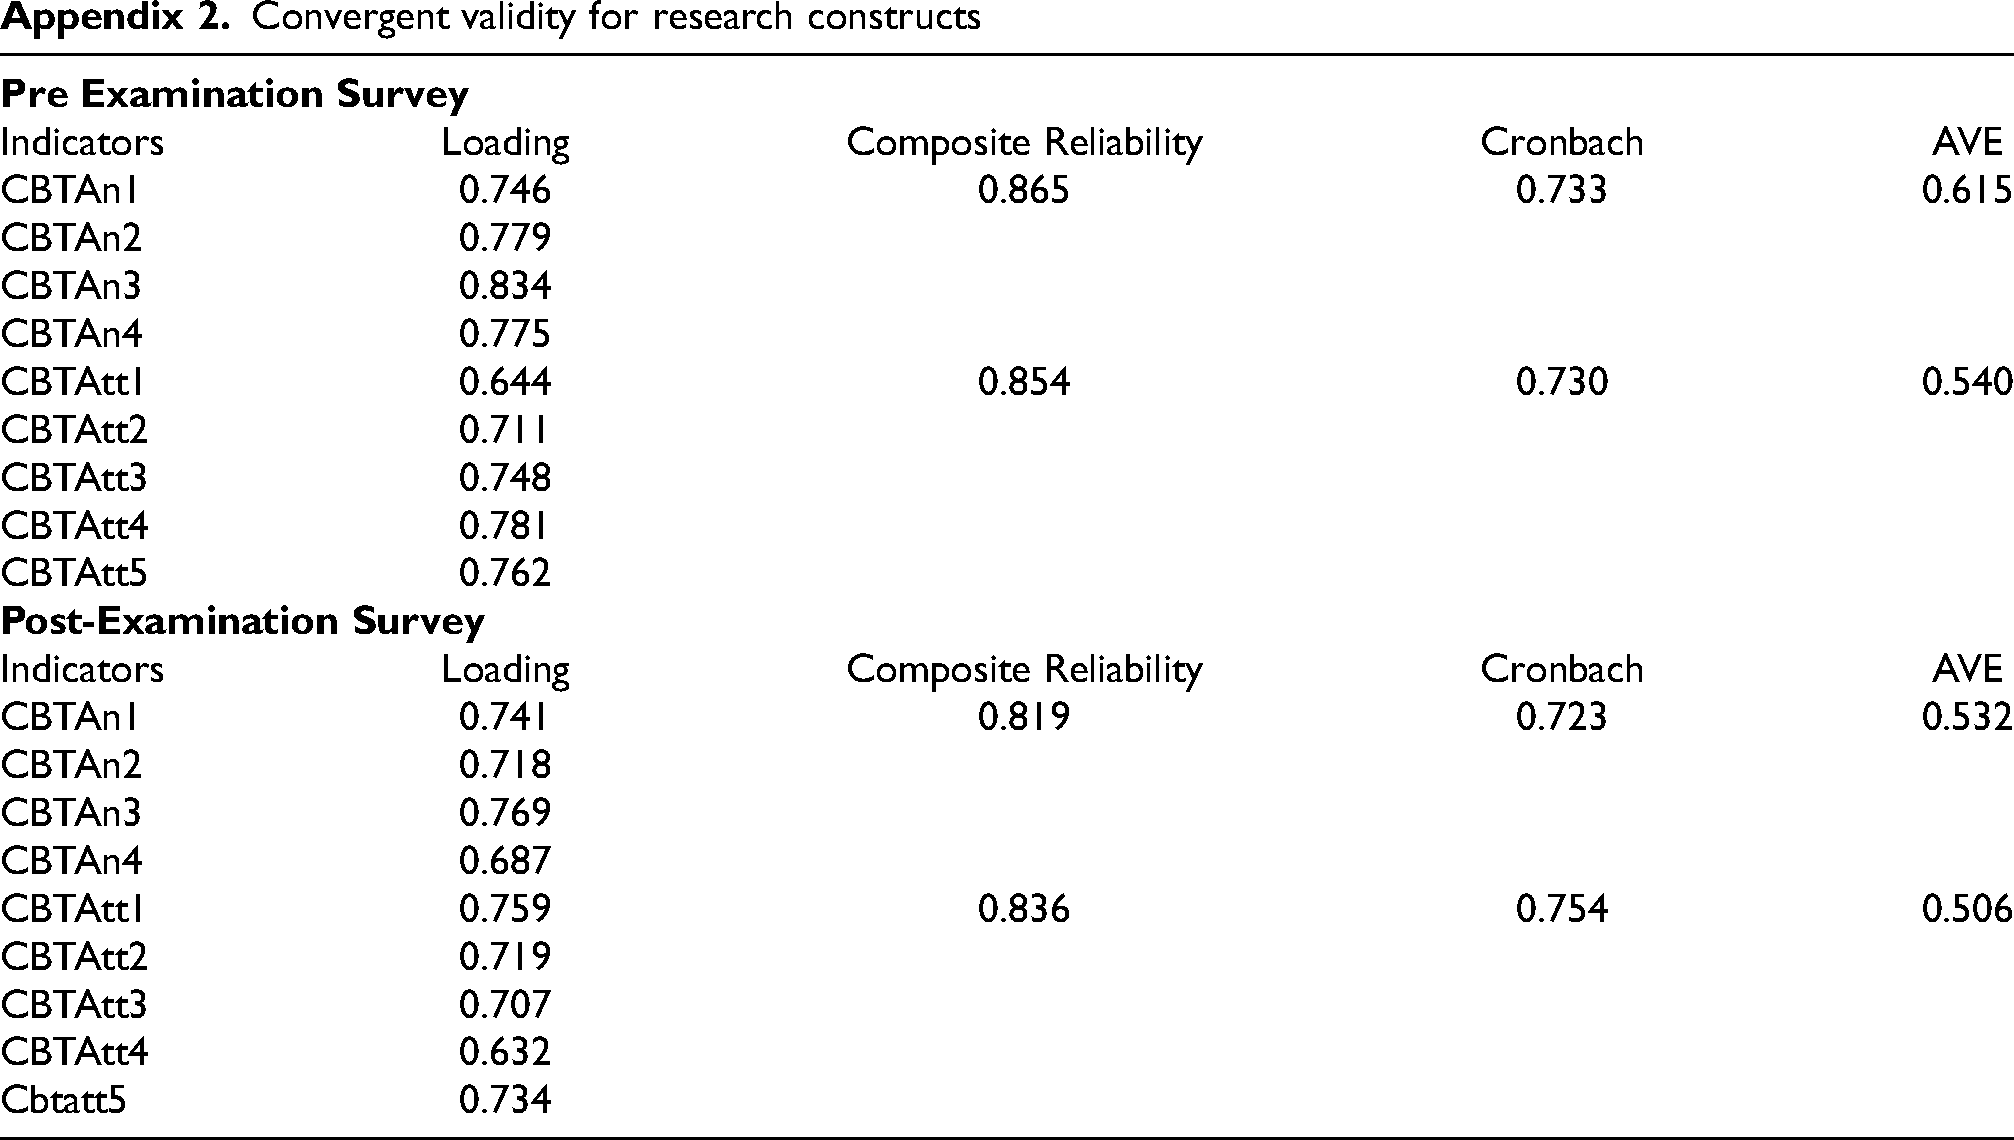
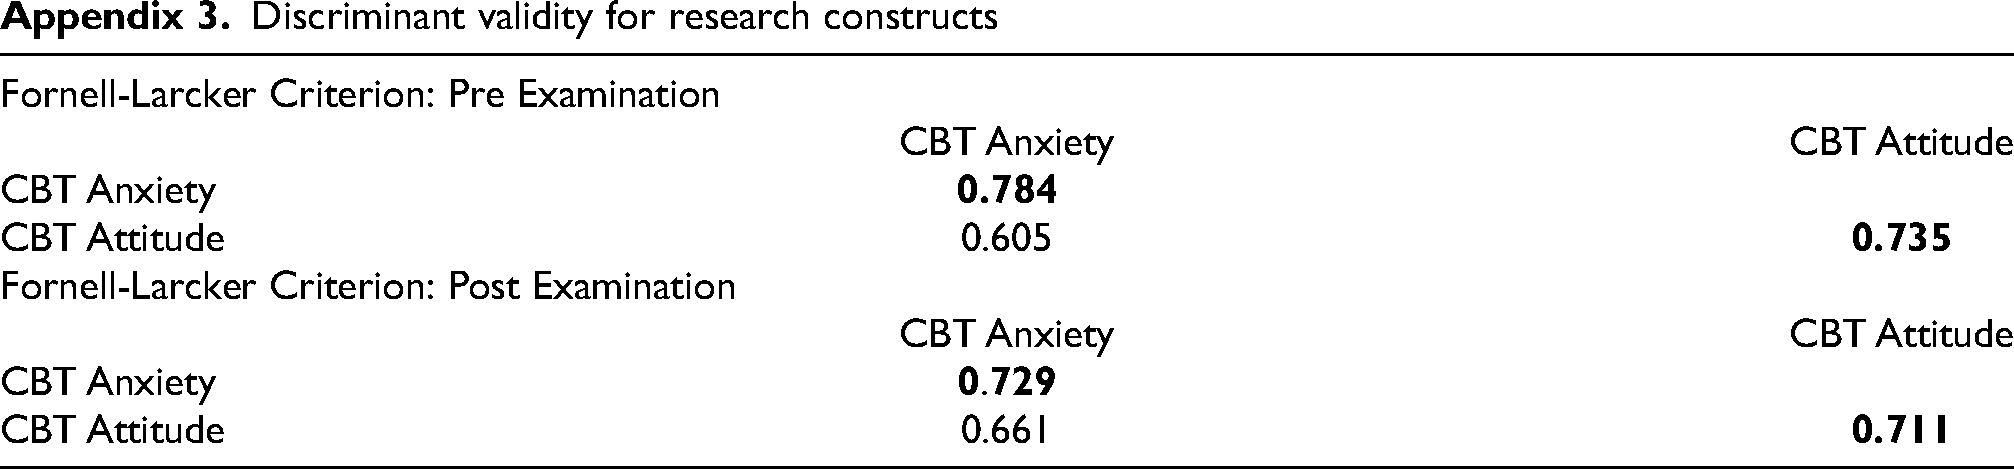
We evaluated the questionnaire items and constructs to determine their reliability and validity using methods (Hasan and Bao, 2020). See Appendix 2 and 3 for the results. The results in Appendix 2 demonstrated that the indicator loadings range aligns with the suggested threshold of 0.60 (Awang, 2012; Chang et al., 2022). Moreover, the composite reliability and Cronbach's alpha surpass the recommended threshold of 0.7 (Hair et al., 2012). Additionally, the average variance extracted for all constructs exceeded the 0.5 thresholds (Barclay et al., 1995), indicating satisfactory convergent validity. To assess discriminant validity, we employed the Fornell-Larcker criterion. Appendix 3 shows that the square roots of the average variance extracted were higher than the correlations with the other construct (Fornell and Larcker, 2016). These findings collectively provide robust evidence of the reliability and validity of the measures employed for both the questionnaire items and constructs.
The research was granted ethical approval by the Department of Computer and Information Sciences, University of Strathclyde, with a reference ID: 1389.
Analysis
Descriptive statistics and Spearman's rank-order correlation coefficient were used to analyse students’ computer familiarity/experience. Non-parametric tests, the Kruskal-Wallis test and Mann-Whitney U test, were employed to compare the distributions of CBT anxiety and attitude among different groups of students. The rationale behind this selection was based on the ordinal nature of the data. These tests have the ability to analyse ordinal data without relying on specific numerical interpretations or assumptions about equal intervals between categories (McKnight and Najab, 2010; Alcaraz et al., 2022). Multiple regression analysis was used to examine the relationship between CBT anxiety, CBT attitude, and UTME score.
Results
UTME examinee computer familiarity/experience variations (R1)
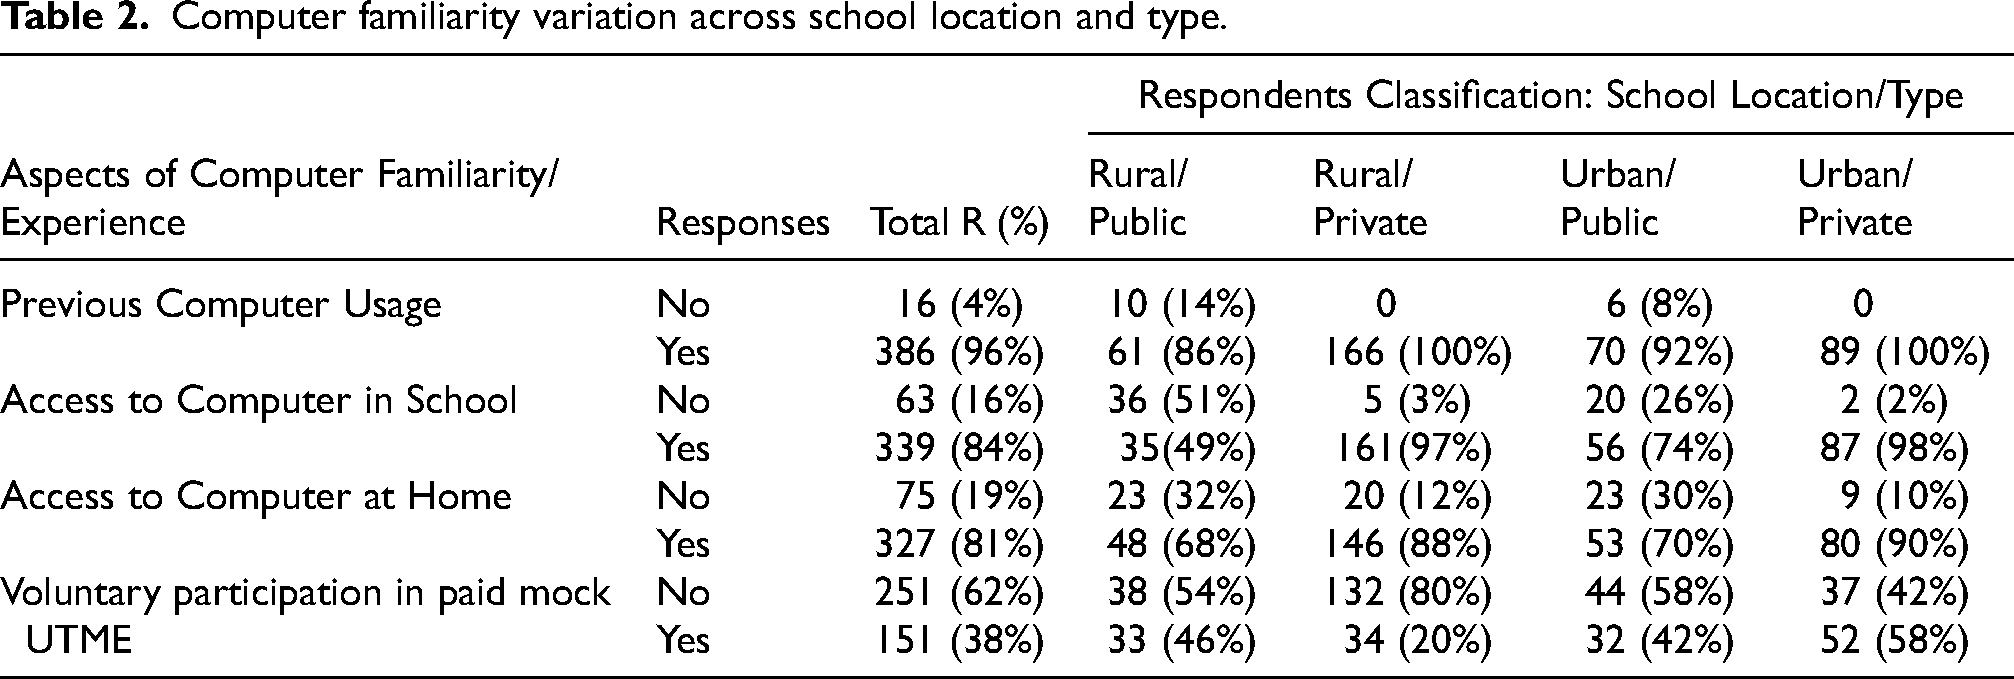
Tables 2 and 3 summarise the variation in computer familiarity and usage among students in the four respondents’ categories based on location and school types: rural-public, rural-private, urban-public and urban-private. Respondents were asked to respond positively or negatively to whether they had previously used a computer before UTME, had access to a computer at school and home, if they participated in the paid voluntary UTME mock examination organised by JAMB and the number of times they have previously done CBT before UTME.
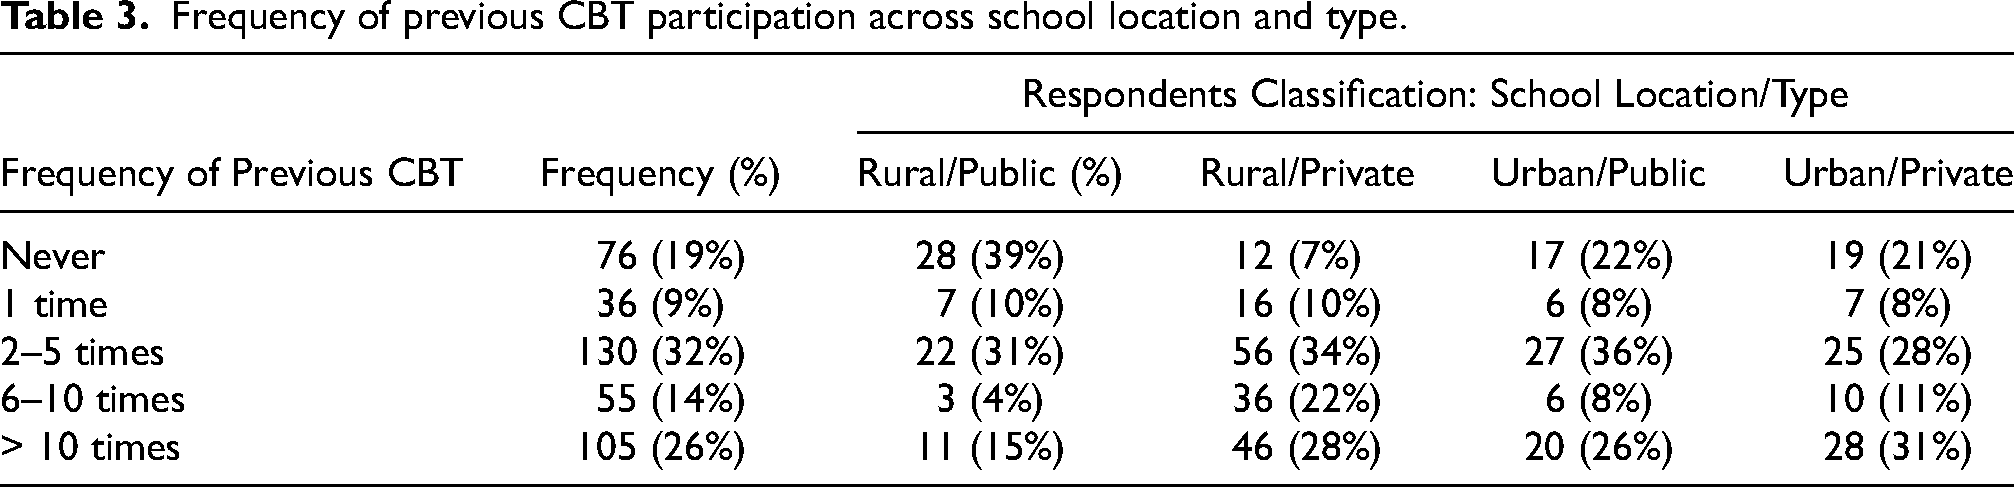
Previous Computer Use: 96% of the respondents used a computer before the UTME. All the respondents that have not used a computer before UTME are from public schools in rural and urban locations. Approximately 14% and 8% of the respondent from rural-public and urban-public schools, respectively, have not used a computer before UTME. The difference in previous computer use is pronounced only in comparing public versus private secondary schools rather than students in rural and urban locations. Access to Computers in School: 16% of respondents do not have access to a computer in school. Students from public schools have the highest percentage of students with no access to a computer at school; 51% and 26% of students from rural-public and urban-public schools do not have access to a computer at school. On the contrary, 84% and 98% of respondents from rural-private and urban-private schools have access to a computer in schools. Access to Computer at Home: 19% of respondents do not have access to a computer at home. Students from public schools have the highest percentage of students with no access to a computer at home; 32% and 30% of students from rural-public and urban-public schools do not have access to a computer at home. On the contrary, 88% and 90% of respondents from rural-private and urban-private schools have access to a computer at home. Voluntary Participation in Paid MOCK UTME: only 38% of respondents participated in the voluntary mock examination organised by JAMB, the UTME officiating organisation. Respondents from urban-public schools have the highest percentage of enrolment in voluntary mock UTME at 58%. The respondents with the least percentage of enrolment in the voluntary mock exam are respondents from rural-private schools at 20%. Respondents from rural-public and urban-public schools have 46% and 42% enrolment in the mock exam, respectively. Previous CBT Experience:39% of respondents in rural-public schools have never done a computer-based test before UTME, and only 19% of the students have done CBT 6 or more times before UTME. However, 34%, 50% and 42% of students from urban-public, rural private and urban-private schools, respectively, have done CBT at least six times before UTME. 22%, 7% and 21% of students from urban-public, rural private and urban-private schools, respectively, have never done CBT before UTME. Students from rural-public schools have the highest percentage of examinees that have not previously had a CBT exam before UTME.
Computer familiarity variation across school location and type.
Frequency of previous CBT participation across school location and type.
Aspects of computer familiarity relationship with UTME performance (R2)
Mann-Whitney U test was used to find the relationship between 4 aspects of computer familiarity/experience (previous computer use, access to computer at home, access to computer in school, voluntary participation in UTME) and respondents’ UTME score. Mann-Whitney U test if there is a significant difference in the score of students with each aspect of computer familiarity/experience and those who do not have familiarity/experience. Table 4 summarises the results of the comparison. At a significance level of .05, the results show that students who have previously used a computer and have access to a computer in school and/or at home have a statistically significant higher score than does that do not. However, there is no significant statistical difference in the UTME scores of students who took part in the official mock exam and those that did not.
Application of mann-whitney u test to compare aspects of computer familiarity/experience relationship with test score.
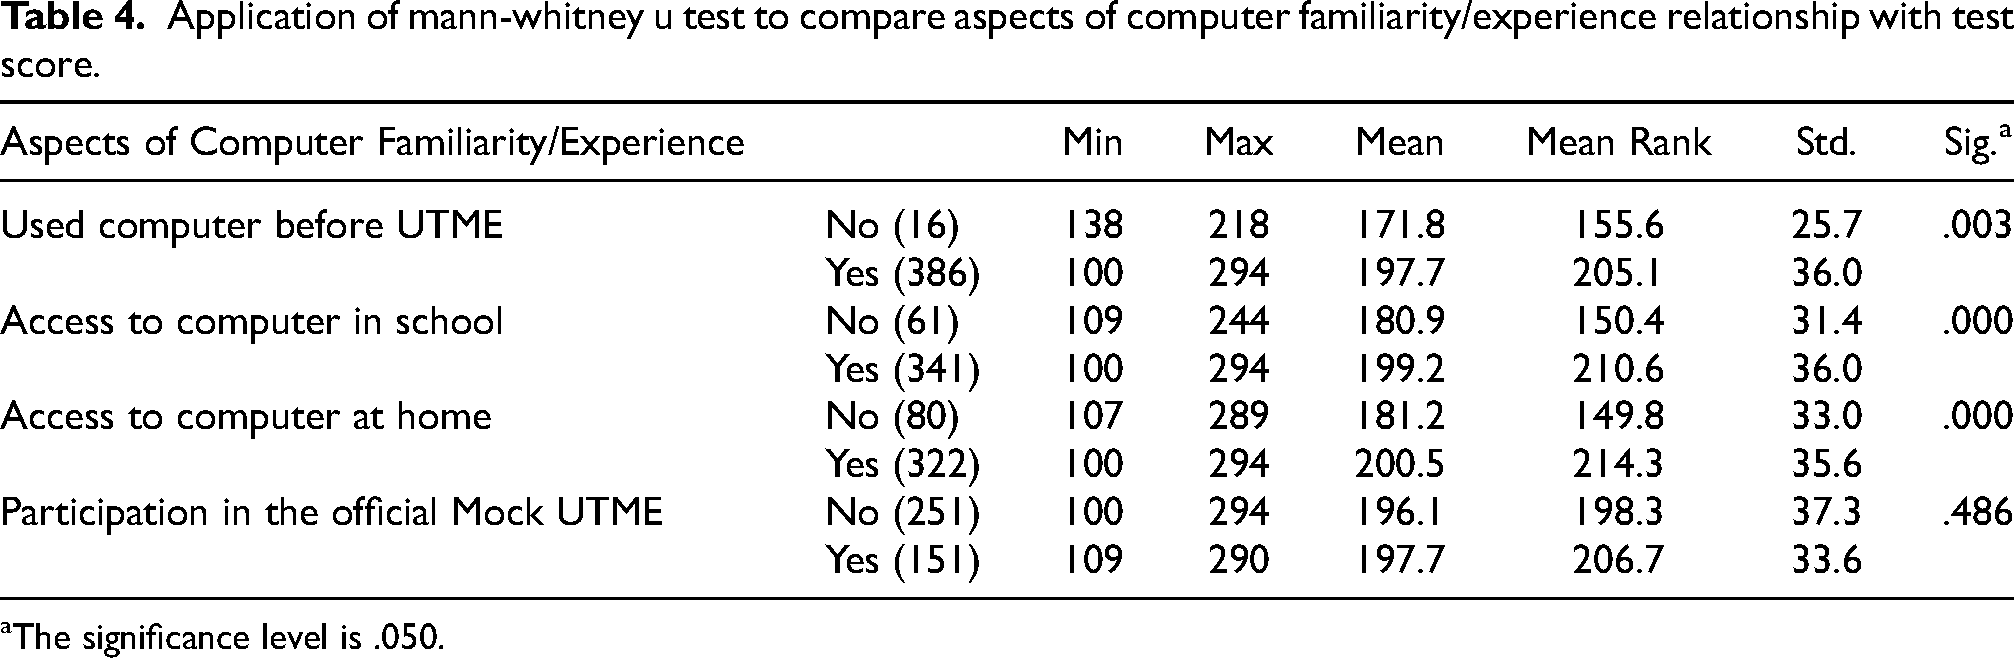
The significance level is .050.
Furthermore, Spearman's rank-order correlation coefficient was used to test if there is a significant relationship between the number of times a student has taken computer-based tests and UTME scores. At a significant level of a = 0.05, the result shows a significant relationship between the number of times a candidate has taken CBT and their CBT score at p = 0.000. Furthermore, the estimated correlation coefficient (R(s)) is .184. This R(s) shows a weak positive association between the two variables. Hence, this suggests that the more times someone has done a computer-administered test, the higher their UTME score.
UTME examinee computer-based test anxiety variations (R3)
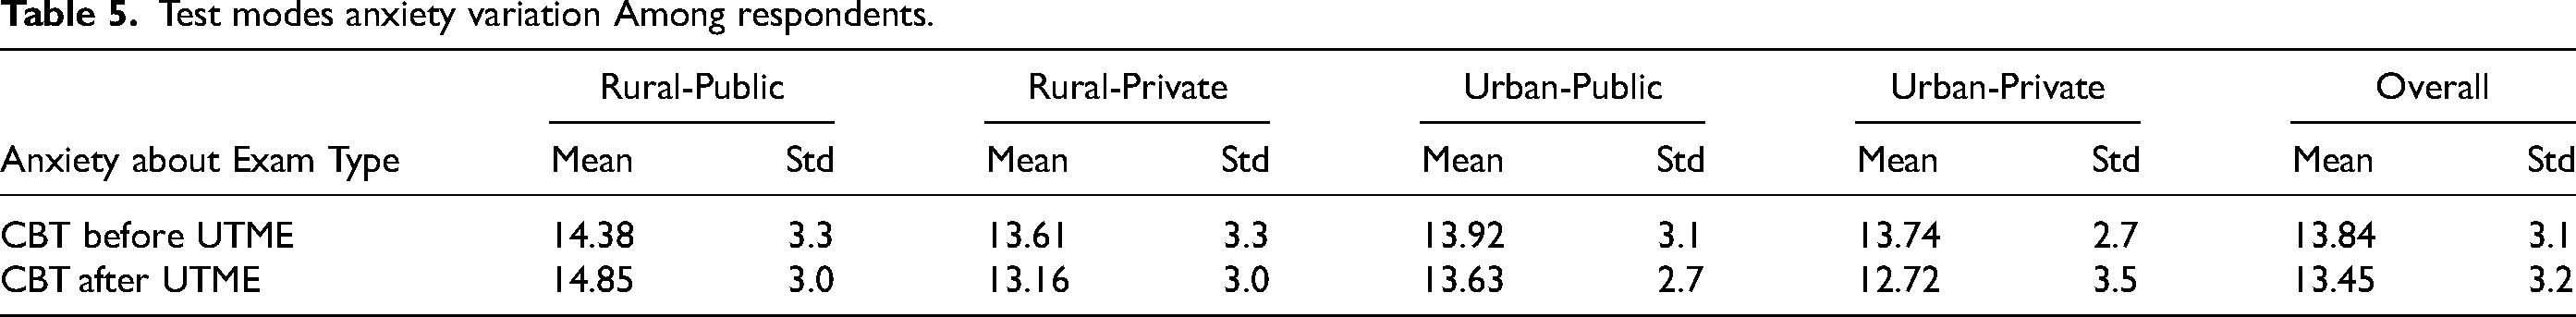
The CBT anxiety items were collected using a five-level scale ranging from 1 (most anxious) to 5 (most unconcerned). Therefore, to get a student's overall anxiety, the score of the student's response to each of the questionnaire items was added together. Therefore, the most anxious about CBT is ranked 4, and the least anxious about a test is ranked 20. Furthermore, the minimum score of 4 is classified as “very anxious”, 5-8 is “anxious”, 9–12 is “neutral”, 13–16 is “unconcerned”, and 17–20 is “very unconcerned”. Table 5 Summarises the CBT anxiety across respondent categories. Table 5 shows the mean and standard deviation of the student's anxiety about CBT before and after the examination. Students’ anxiety collectively and based on categorisation falls under the unconcerned anxiety scale.
Test modes anxiety variation Among respondents.
Kruskal Wallis Test was conducted to determine if there is a statistically significant difference in the CBT anxiety of the four categories of students before and after UTME at a significance level α = 0.05. The Kruskal-Wallis test yielded a chi-square value of 4.30, p = 0.231 and a chi-square value of 18.112, p = 0.000 for before and after UTME, respectively. The result only shows a significant difference in the CBT anxiety of the four categories of students after UTME. Therefore, we compare the students’ anxiety towards CBT after UTME among the respondent categories using Mann-Whitney U Test; Table 6 summarises the results. The results show a significant difference in the anxiety of Rural-Public school students to Rural-Private schools and Urban-Private Schools students.
Mann-Whitney u test comparing anxiety of students to computer-based test after UTME.
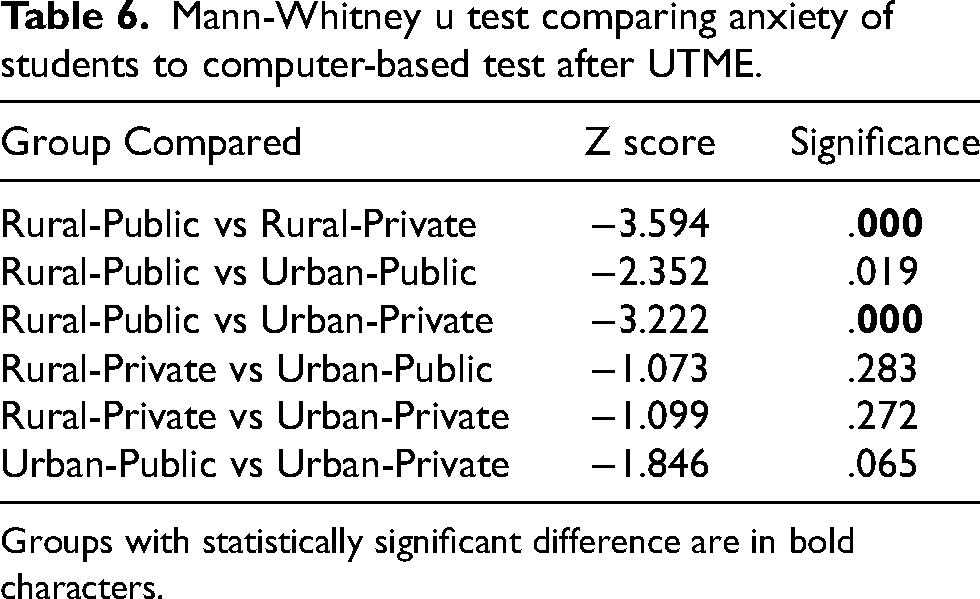
Groups with statistically significant difference are in bold characters.
Computer-based test anxiety relationship with UTME performance (R4)
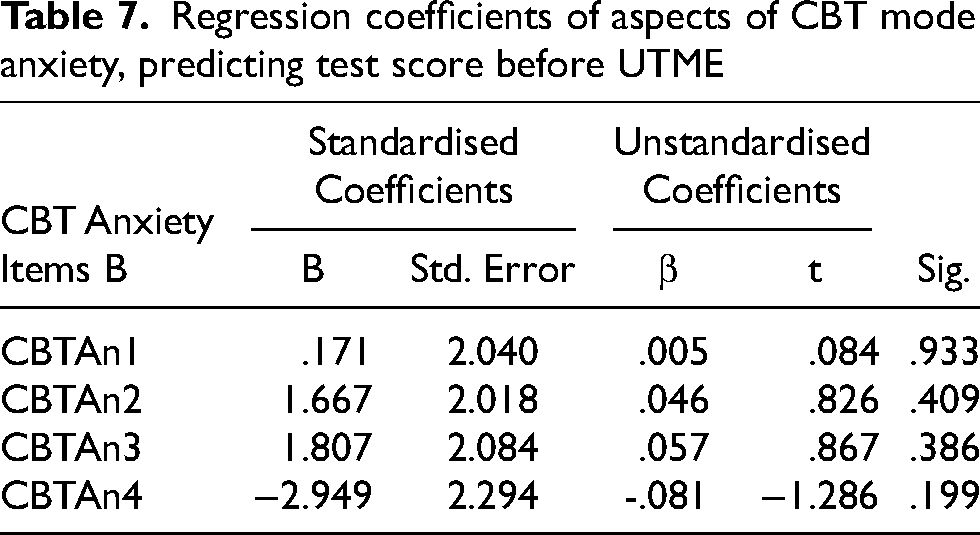
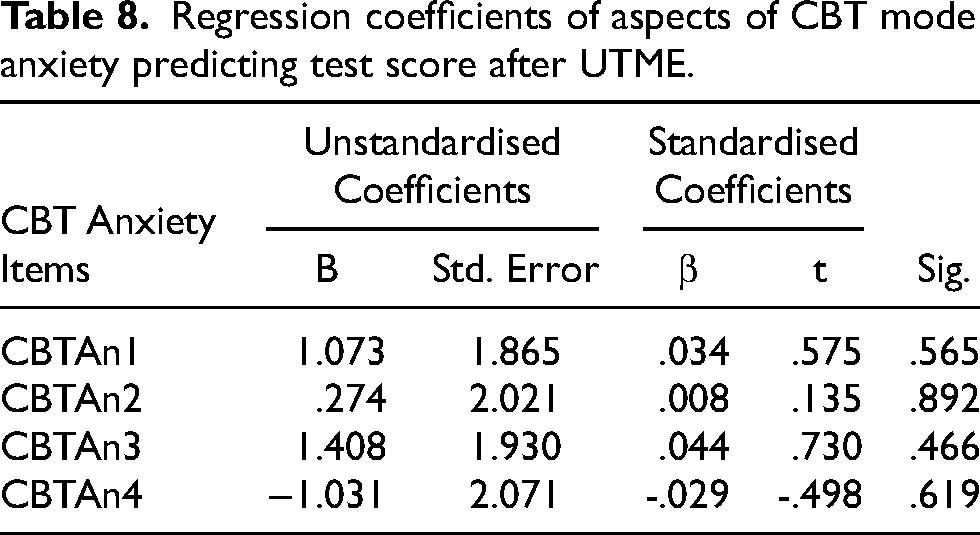
Multiple regression analyses were conducted to examine the predictive relationship between students’CBT anxiety before and after the UTME and their UTME scores. The four items of the CBT anxiety construct were used as independent variables. The results indicated that CBT anxiety before (F (4, 397) = .673, p = .611) and after (F (4, 397) = .384, p = .820) UTME does not significantly predict UTME scores. Also, none of the four independent variables before and after significantly UTME predicted UTME scores (see Tables 7 and 8, respectively).
Regression coefficients of aspects of CBT mode anxiety, predicting test score before UTME
Regression coefficients of aspects of CBT mode anxiety predicting test score after UTME.
UTME examinee computer-based test attitude variations (R5)
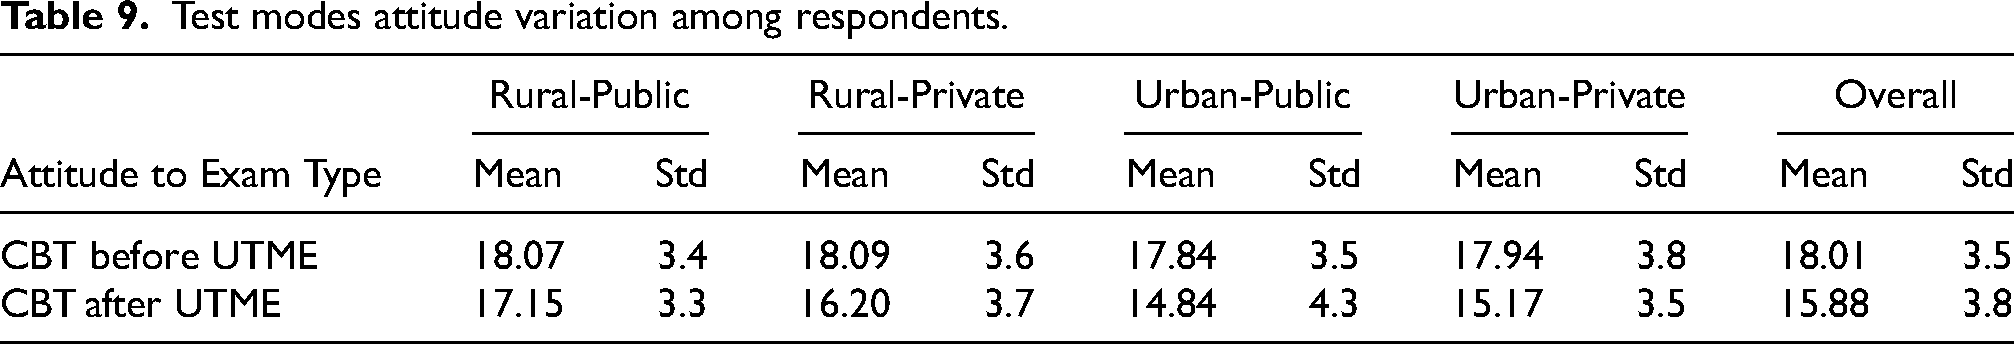
CBT attitude items were collected using a five-level scale ranging from 1 (most negative attitude) to 5 (most positive attitude). The overall attitude towards a specific test mode was calculated by summing the scores of the student's responses to each item, with a score range of 5 to 25. Attitude categories were defined as follows: a score of 5 represented a “very negative attitude,” 6–10 indicated a “negative attitude,” 11–15 denoted a “neutral attitude,” 16–20 reflected a “positive attitude,” and 21–25 signified a “very positive attitude”. Table 9 shows the mean and standard deviation of the students’ attitudes to CBT before and after UTME. Students’ attitude collectively and based on categorisation falls under the positive attitude scale
Test modes attitude variation among respondents.
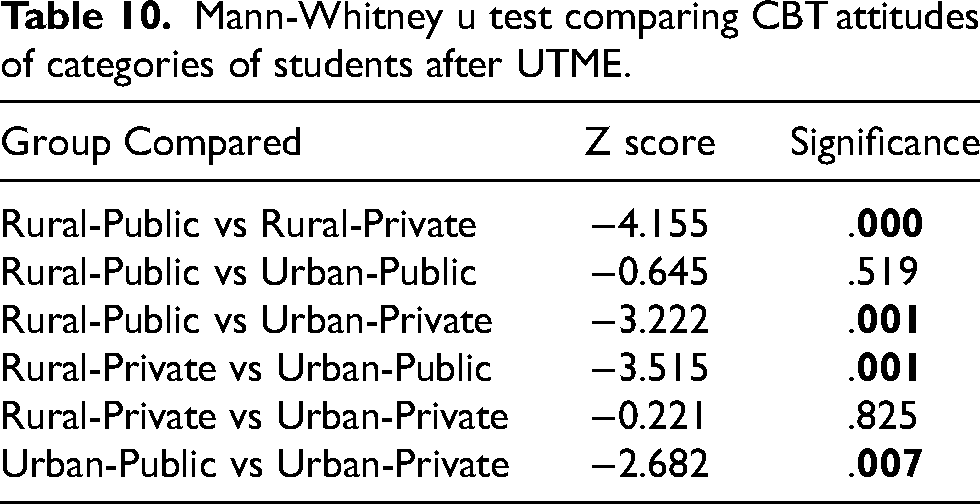
Kruskal Wallis Test was conducted to determine if there is a statistically significant difference in the CBT attitude of the four categories of students before and after UTME at a significance level α = 0.05. The Kruskal-Wallis test yielded a chi-square value of 2.632, p = 0.452 and a chi-square value of 24.905, p = 0.000 for before and after UTME, respectively. Subsequently, a Mann-Whitney U test was used to compare students’ CBT attitudes after UTME across school categories, results are summarised in Table 10. The results demonstrated significant differences in the CBT attitudes of respondents from rural-public schools compared to other students in other schools categories after the UTME. Notably, students from rural-public schools exhibited the most positive attitude towards CBT after the UTME
Mann-Whitney u test comparing CBT attitudes of categories of students after UTME.
Computer-based test attitude relationship with UTME performance (R6)
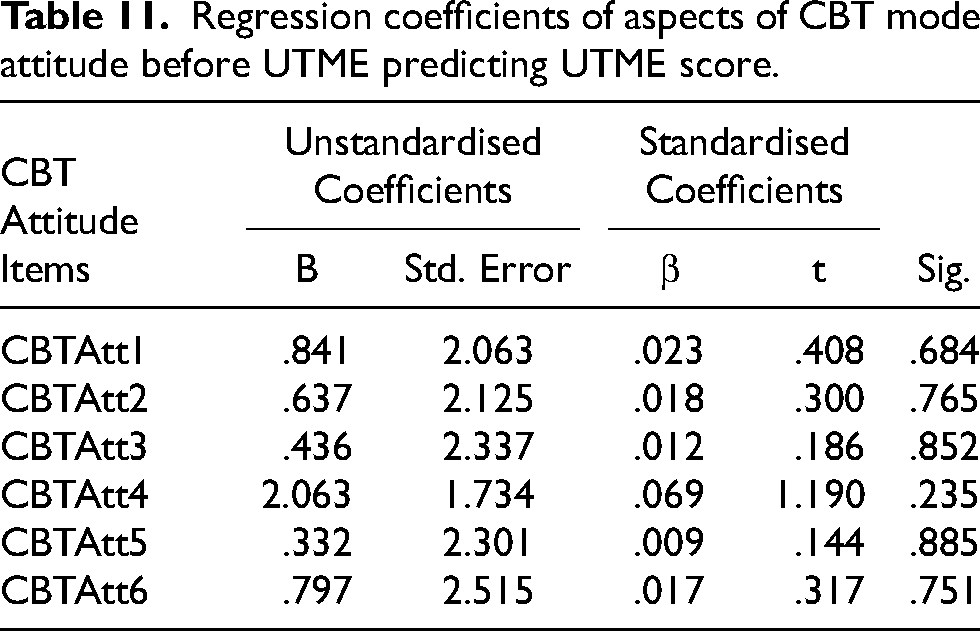
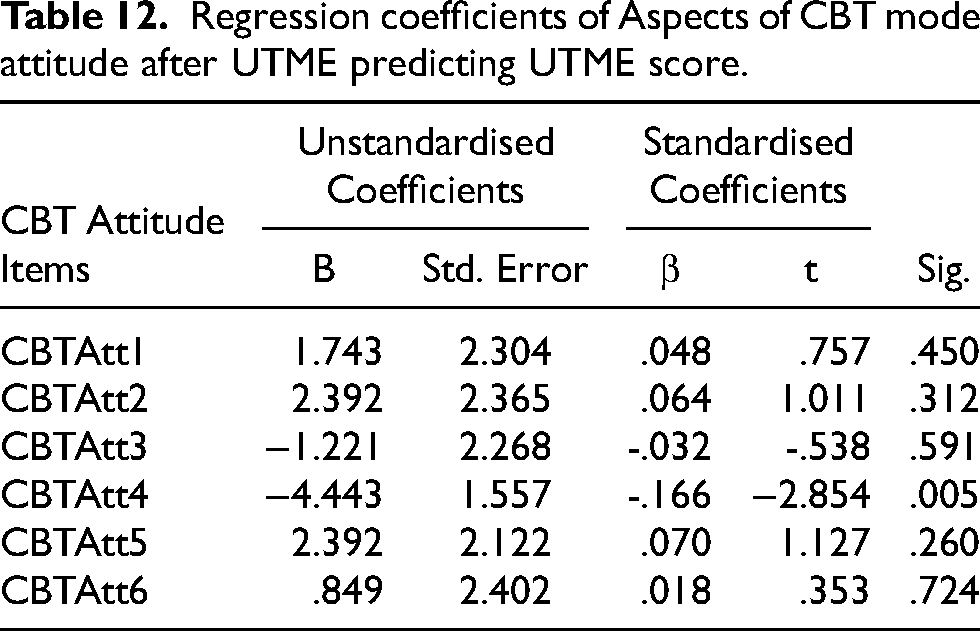
Multiple regression analyses were conducted to examine the predictive relationship between students’ CBT attitudes before and after the UTME and UTME scores. The six test mode attitude scale items were used as independent variables. The results indicated that the independent variables did not significantly predict UTME scores before (F (4, 397)= .673, p = .611) and after (F (4, 397)= .384, p = .820). Also, none of the six independent variables before and after UTME significantly predict students’ UTME scores (see Tables 11 and 12, respectively).
Regression coefficients of aspects of CBT mode attitude before UTME predicting UTME score.
Regression coefficients of Aspects of CBT mode attitude after UTME predicting UTME score.
Discussion
These results suggest disparities in computer use, access, and prior experience among respondents based on school type (public vs private) and location (rural vs urban). Public schools, especially rural areas, showed lower computer use, limited computer access in both school and home settings, and less exposure to CBTs. On the other hand, private schools, particularly those in urban areas, exhibited higher computer use, better access to computers, and greater CBT experience. Notably, the disparity in computer access and experience is more pronounced between students in public and private schools rather than between rural and urban locations. The findings align with the knowledge gap and digital divide theories, which suggest that students from privileged backgrounds have better access to digital technology and knowledge. Previous research also found that students from privileged backgrounds have better access to and use digital technologies (Osuafor and Osisioma, 2000; Ukpebor and Emojorho, 2012; Mpofu and Chikati, 2013; Olanrewaju et al., 2021). Also, a substantial percentage of students (over 60%) did not participate in the mock examination. By not taking the mock exam, students miss out on an opportunity to become familiar with the examination's format, interface, functionality and environment.
Also, consistent with previous studies, our findings demonstrate a positive association between computer familiarity and UTME performance (Goldberg and Pedulla, 2002; Zou and Chen, 2016; Shirzad and Shirzad, 2017). Students who have used a computer before UTME, have access to computers at school or home and have previous CBT experience perform significantly better in the UTME. Notably, the performance gap is particularly evident between students who have never experienced CBT and those who have taken it at least six times. This finding contradicts claims made by some studies that computer familiarity has no significant impact on test performance (Al-amri, 2007; Hosseini et al., 2014; Chan et al., 2018). These findings are in line with the knowledge gap (Tichenor et al., 1970) and digital divide theories (van Dijk, 2005), which suggest that students from privileged backgrounds have better access to digital technology and information; therefore, they are better equipped to apply the knowledge effectively when required. Therefore, the consequences of the digital divide and the knowledge gap may further aggravate social and economic differences.
Interestingly, the study reveals that examinees collectively and categorically fall under the lower unconcerned anxiety and positive attitude scales. Surprisingly, after UTME, examinees from public-rural schools demonstrated better attitudes and lower anxiety levels compared to students in the other categories. We hypothesised that their UTME expectations compared with their experience might be better than student in other categories (Stricker et al., 2004; Pawasauskas et al., 2014). Regression analysis shows that CBT attitude and anxiety do not predict test scores. These results are consistent with previous studies that found no significant relationship between attitude and anxiety and test scores (Brosnan and Lee, 1998; Awad, 2016; Brunfaut et al., 2018; Ebrahimi et al., 2019). These results suggest that factors like computer familiarity may play a more significant role in influencing students’ performance in computer-based examinations. Therefore, addressing attitude and anxiety alone may not be sufficient for improving student performance in computerised tests. Therefore, further research is needed to identify additional factors contributing to student performance in this context and develop comprehensive strategies to enhance students’ outcomes in high-stakes computerised examinations.
Limitations and conclusion
This study provides valuable insights into the experiences and opinions of students taking high-stakes computer-based university admission exams in Nigeria. However, several areas for improvement and further investigation should be considered to guide decision-makers and address the country's digital divide among school students. It is recommended to replicate this study in different states across Nigeria to allow for the generalisation of results. Also, students’ other demographic information, such as gender and parents’ occupation, should be investigated. This would allow for a more comprehensive understanding of the students taking the exam and provide insights into regional variations. Furthermore, it is important to expand the scope of research beyond students taking the Unified Tertiary Matriculation Examination (UTME) to investigate students’ access to and use of computers in Nigerian secondary schools. This would provide a broader perspective on the digital divide and potential disparities, particularly among students in Nigeria. While our study suggests that CBT anxiety and attitude have no significant relationship with test scores, we recommend further research into other factors that might contribute to students’ performance in CBT. In addition, exploring the experiences and opinions of schoolteachers and UTME administrators can provide valuable insights into the challenges and opportunities associated with computer-based testing. This information can guide strategies for reducing the digital divide and improving the conduct of UTME.
Based on the study's findings, several recommendations can be made to address the digital divide among school students in Nigeria. Efforts should be made to expand computer access and availability in schools, particularly in rural areas and public schools. This could involve equipping schools with computer labs and providing training and support for teachers. Furthermore, making computer-based mock exams more accessible and affordable can help familiarise students with computer-based testing. Increasing the frequency of mock exams and waiving associated costs may help promote student participation, especially among those from underprivileged backgrounds. Policymakers and education authorities should consider implementing targeted interventions to bridge the digital divide. This may include facilitating partnerships with organisations to donate computer resources to underserved schools and locations. To facilitate evidence-based decision-making, future studies should evaluate the effectiveness of these interventions in reducing the digital divide among school students in Nigeria. Additionally, exploring the long-term impact of computer access and familiarity on academic performance and educational outcomes would provide valuable insights for policymakers and educators. Replicating the study, investigating computer access and use in secondary schools, engaging with instructors and administrators, and implementing targeted interventions can help create a more equitable educational system and reduce disparities caused by the digital divide.
Footnotes
About the authors
Survey description
|
|
| School Type (public, private) |
| School Location (state capital, outside state capital) |
|
|
| Have you used a desktop or laptop computer before (Yes or No) |
| Do you have access to a desktop or laptop computer in school: (Yes or No) |
| Do you have access to a desktop or laptop computer at home (Yes or No) |
| Participation in UTME mock examination (Yes or No) |
| How many times have you done computer-based tests before (Never, 1 time, 2–5 times, 6–10 times, > 10 times) |
|
|
| CBTAn1: How comfortable or Uncomfortable is taking a computer-based examination |
| CBTAn2: How focused or distracted are you when taking a computer-based examination |
| CBTAn3: How fearful or confident are you when taking a computer-based test |
| CBTAn4: How relaxed or Nervous are you when taking a computer-based test |
|
|
| CBTAtt1: How positive/negative is your perception about taking a computer-based test |
| CBTAtt2: How easy or difficult is taking a computer-based test |
| CBTAtt3: How positive or negative do you feel during a computer-based test |
| CBTAtt4: How confident or distrustful do you feel about computer-based test scores |
| CBTAtt5: Computer-based tests have a positive or negative relationship with test performance |
| CBTAtt6: I prefer to take computer-based tests to paper-based test |
Convergent validity for research constructs
|
|
||||
| Indicators | Loading | Composite Reliability | Cronbach | AVE |
| CBTAn1 | 0.746 | 0.865 | 0.733 | 0.615 |
| CBTAn2 | 0.779 | |||
| CBTAn3 | 0.834 | |||
| CBTAn4 | 0.775 | |||
| CBTAtt1 | 0.644 | 0.854 | 0.730 | 0.540 |
| CBTAtt2 | 0.711 | |||
| CBTAtt3 | 0.748 | |||
| CBTAtt4 | 0.781 | |||
| CBTAtt5 | 0.762 | |||
|
|
||||
| Indicators | Loading | Composite Reliability | Cronbach | AVE |
| CBTAn1 | 0.741 | 0.819 | 0.723 | 0.532 |
| CBTAn2 | 0.718 | |||
| CBTAn3 | 0.769 | |||
| CBTAn4 | 0.687 | |||
| CBTAtt1 | 0.759 | 0.836 | 0.754 | 0.506 |
| CBTAtt2 | 0.719 | |||
| CBTAtt3 | 0.707 | |||
| CBTAtt4 | 0.632 | |||
| Cbtatt5 | 0.734 | |||
Discriminant validity for research constructs
| Fornell-Larcker Criterion: Pre Examination | ||
| CBT Anxiety | CBT Attitude | |
| CBT Anxiety |
|
|
| CBT Attitude | 0.605 |
|
| Fornell-Larcker Criterion: Post Examination | ||
| CBT Anxiety | CBT Attitude | |
| CBT Anxiety | ||
| CBT Attitude | 0.661 |
|