
Abstract
Information about the land use of built-up areas is required for the comprehensive planning and management of cities. However, due to the high cost of the land use surveys, land use data is out-dated or not available for many cities. Therefore, we propose the reuse of up-to-date and low-cost place data from social media applications for land use mapping purposes. As main case study, we used Foursquare place data for estimating nonresidential building block use in the city of Amsterdam. Based on the Foursquare place categories, we estimated the use of 9827 building blocks, and we compared the classification results with a reference building block use dataset. Our evaluation metric is the kappa coefficient, which determines if the classification results are significantly better than a random guess result. Using the optimal set of parameter values, we achieved the highest kappa coefficient values for the land use categories “hotels, restaurants and cafes” (0.76) and “retail” (0.65). The lowest kappa coefficients were found for the land use categories “industries” and “storage and unclear”. We have also applied the methodology in another case study area, the city of Varese in Italy, where we had similar accuracy results. We therefore conclude that Foursquare place data can be trusted only for the estimation of particular land use categories.
Introduction
Management and planning of urban areas requires up-to-date land use (LU) data. LU patterns affect the demand for transport (Litman and Steele, 2014) and energy (Pérez-Lombard et al., 2008), the land prices (Cheshire and Sheppard, 1995), the crime rates and types (Stucky and Ottensmann, 2009), the factors that affect public health (Frank et al., 2006), and the urban activity patterns (Jacobs-Crisioni et al., 2014). LU data is required by various professionals and organizations, such as planning agencies, city councils, departments of transportation, utility companies, real estate companies, developers, tax authorities, law enforcement agencies, and health insurance companies (Jensen and Cowen, 1999). The availability of LU data can contribute toward a more holistic understanding of the built environment and ultimately facilitate evidence-based decision making.
Still, for many urban areas, the required LU data is not available. Evidently, extensive in situ LU surveys require a significant volume of human and financial resources. Less costly and widely utilized methods for LU and land cover (LC) identification include the use of satellite and aerial images. Such data sources can be utilized to identify the physical characteristics of an area, namely the LC, but they cannot be used for estimating the uses of built up areas. At European level, three projects collect LU and LC data, which are the European Urban Atlas project (European Union, 2011), the Land Use/Cover Area frame Survey (LUCAS) (Eurostat, 2013), and the COoRdination of INformation on the Environment (CORINE) project (EPA, 2014). Nevertheless, none of the above European projects provides LU data that can be reused in order to identify the LU of built up areas at a detailed level.
Considering the high cost and the absence of detailed LU data in urban areas, in this study, we propose the re-use of openly available place data contributed by citizens to social media applications for the production of low cost LU datasets. In the literature, geographic data contributed intentionally by citizens to Internet applications are often described as volunteered geographic information (VGI) (Goodchild, 2007) or crowd-sourced geographic information. In this study, we refer to this type of data as citizen-contributed data. Examples of popular social media applications that collect citizen-contributed data are the Facebook social networking application and the Foursquare social recommendation application. The users of these applications are contributing information about places, such as, the name of a place, its location, and its category (restaurant, museum, etc.).
The rationale of this study is to investigate whether citizen-contributed place data can be used for estimating LU in built-up areas, as a low cost alternative to the traditional in situ LU surveys. To this end, we used Foursquare place data of unknown quality for estimating the LU of built-up areas in the city of Amsterdam. Places that are contained fully or partially within building blocks, determine the type of the socio-economic activities that are hosted within these building blocks, namely their building block use (BBU). Thus, based on the type of the places contained in an urban building block, we assigned LU categories to that building block. The LU allocation was performed at the spatial scale of urban building block level and not at the building level. The reason for this is that many buildings in Amsterdam are narrow and, as a consequence, many Foursquare places are erroneously described by Foursquare users to be located in the nearby buildings. We evaluated the accuracy of the estimated BBU dataset, by comparing it with a reference BBU dataset that has been generated using the nonresidential use dataset of the city of Amsterdam. The nonresidential use dataset of the city of Amsterdam includes surfaces of built-up areas with nonresidential use, which were recorded by LU surveyors. Finally, we repeated the methodology in another case study area, the city of Varese in Italy, where we had similar accuracy results.
Previous studies explored methods for identifying building use and LU using geographic data generated intentionally or unintentionally by citizens. Huang et al. (2013) and Fan et al. (2014) identified building use by considering the geometry of building footprint data, which has been contributed by citizens to the OpenStreetMap project. Jokar Arsanjani et al. (2013) identified LU and LC patterns using OpenStreetMap feature data. Fritz et al. (2012) developed a crowdsourcing tool called Geo-Wiki, where citizens are directly contributing LC data. Frias-Martinez et al. (2012) identified large-scale LU clusters of four categories based on geo-located tweets. Noulas et al. (2013) used the type and the popularity of Foursquare places for identifying the type of the dominant activity that was taking place in wide geographical areas of Madrid and Barcelona. Finally, several studies have used mobile phone activity data for identifying LU clusters (Pei et al., 2014; Soto and Frias-Martinez, 2011; Toole et al., 2012).
To the best of our knowledge, there is no study that has used place data for the LU estimation at building or building block level.
The remainder of the article is structured as follows. Amsterdam study area and data section describes the study area and the data. Methodology section describes the methodology followed for estimating BBU using Foursquare place data as well as for assessing the accuracy of these estimations. Results section presents the results of the accuracy assessment. In Reproducibility of the proposed methodology section, we present the result of the application of the proposed methodology, in another study area, the city of Varese in Italy and we propose a method for selecting appropriate parameter values. In Discussion section, we discuss the methodology and its limitations, and finally, our conclusions and our future work directions are outlined in Conclusions section.
Amsterdam study area and data
The availability of official LU data is essential for our study, since this data will be used as reference for the evaluation of the BBU dataset that has been estimated using citizen-contributed place data. In contrast to the official LU data, citizen-contributed place data are available for all the major European cities. The city of Amsterdam, in the Netherlands, offers detailed LU data, and is thus considered as a suitable source for the generation of a reference BBU dataset. Therefore, Amsterdam was selected as the main study area, and in particular, the area bounded by the A10 motorway (Figure 1). The A10 motorway creates a physical boundary that encloses a 72.12 km2 area, which is well representing the diversity of the urban environment.
Study area: the area bounded by the A10 motorway.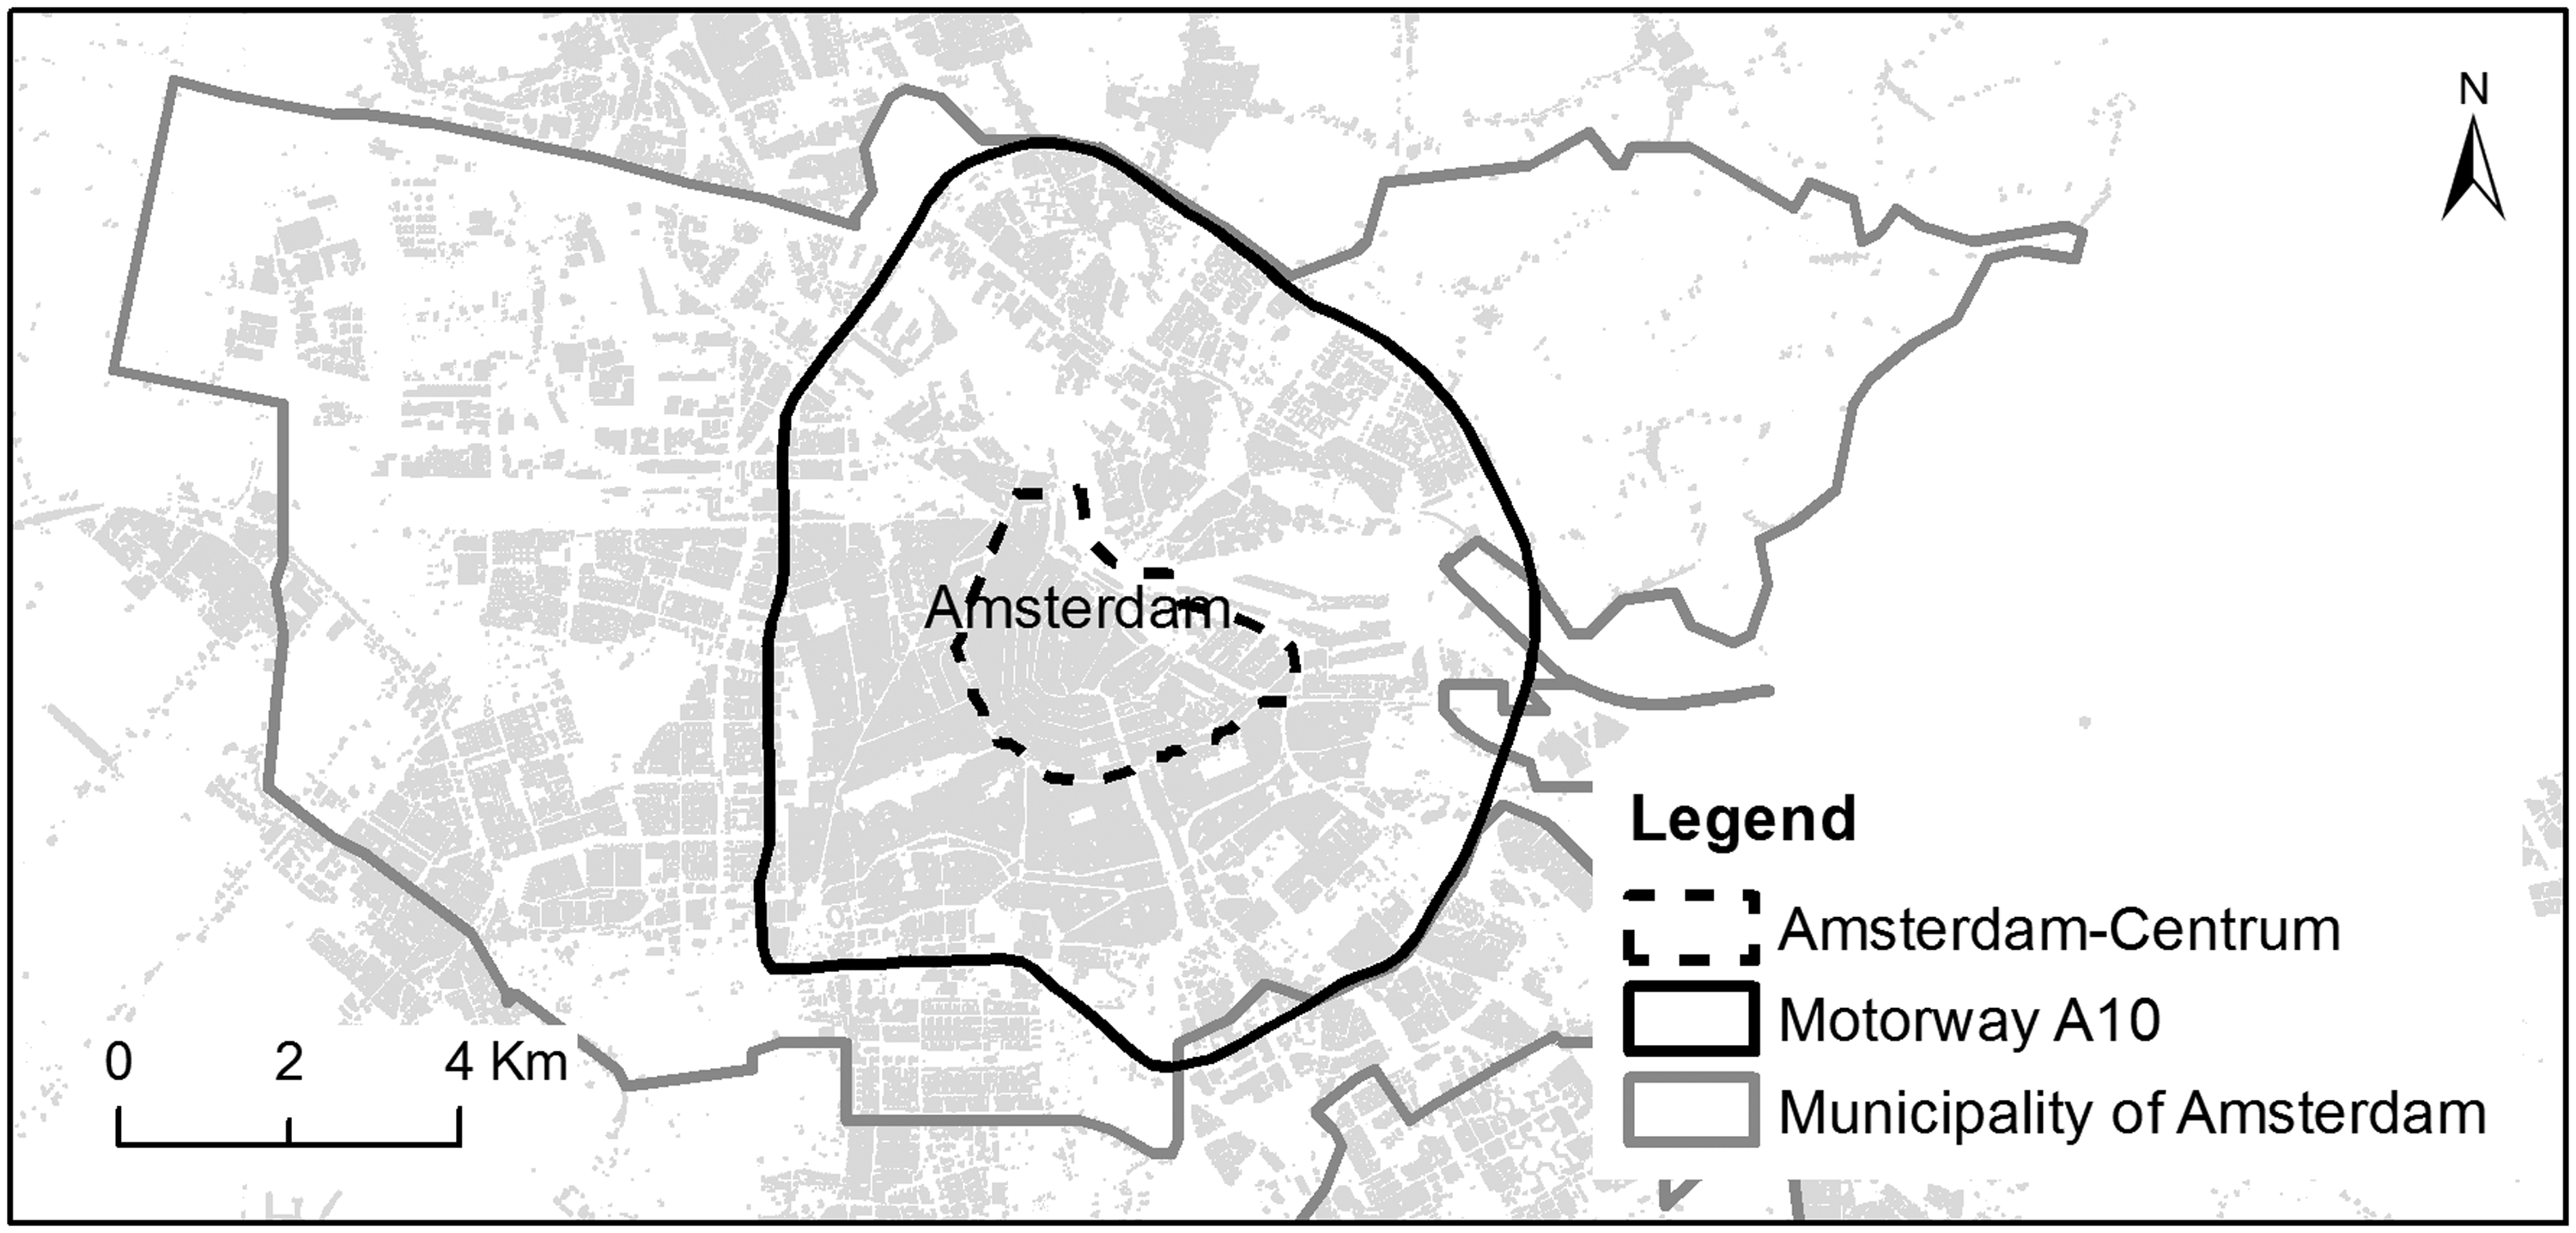
Official datasets
In this study, we have used two official datasets as reference for the evaluation of the accuracy of the estimated BBU dataset. These datasets are the official buildings dataset and the nonresidential use dataset of Amsterdam. The buildings dataset is the Basisregistraties Adressen en Gebouwen, it was retrieved in February 2015 from the geo-data portal of the VU University Amsterdam (VU geoplaza, 2015), and it had been last updated in August 2013. The nonresidential use (niet-woonfuncties Functiekaart) dataset was retrieved in February 2015 from the geo-data portal of the city of Amsterdam (City of Amsterdam, 2015). The nonresidential use dataset includes surfaces of built-up areas with nonresidential use. These surfaces have gradually been surveyed during the period March 2010–November 2014.
The original building dataset includes 143,804 building units within the area bounded by the A10 motorway. From the building dataset, we merged the attached buildings to derive the building block dataset. In this study, a building block is defined as a unit of attached buildings that are separated by others by a street or other open space. Moreover, we removed building blocks with less than 100 m2 footprint area, since, according to the building dataset, they mostly represent garages and sheds of residential premises. The cleaned building block dataset formally represented by the set

The nonresidential use dataset of Amsterdam includes 23,313 surfaces within the area bounded by the A10 motorway and is represented by the set

Every surface of the nonresidential use dataset
The official Amsterdam nonresidential LU classification is represented by the

Every a1 = Bedrijven/Industries, a3 = Detailhandel/Retail, a4 = Horeca/ Horeca, Hotels, restaurants and cafes, a5 = Maatschappelijk/Societal, a6 = Vrije tijd/Leisure, a7 = Parkeren and Openbaar vervoer/Parking and public transport, a8 = Opslag and onduidelijk/Storage and unclear.
In order to evaluate the accuracy of the estimated BBU dataset, whose production is described in the next section, we used a reference BBU dataset. Buildings typically host facilities of diverse functions, for example, retail shops on the ground floor and offices on the upper floors. An urban building block Building blocks with LU “retail” (on the left side of the figure) and LU “offices” (on the right side of the figure). A building block can have multiple LU categories as long as it contains at least one surface of those LU categories.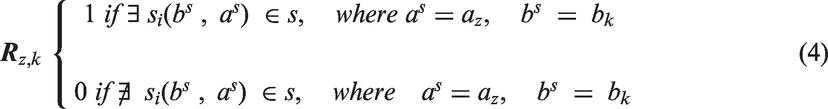
Citizen-contributed data, Foursquare place dataset
Recent social and technological developments, such as the increased educational attainment and the diffusion of smartphone devices, enable citizens to collect and share geo-referenced data on the Internet. These citizen-contributed data are collected in the context of various types of human activities such as socially oriented activities, educational activities and scientific ones, for example, citizen science activities. In the literature, several terms are often being used interchangeably to describe this wide category of data. The most commonly used terms are volunteered geographic information (Goodchild, 2007), crowd-sourced geographic information or user-generated geographical content.
Our aim in this study is to reuse data that has been collected by citizens in the context of socially oriented activities for LU mapping purposes. Place data is a data type that can be reused for that purpose, since the type of a place, for example, restaurant, determines the LU of the surface that this place covers. Places, from the humanistic perspective, are defined as the “enclosed and humanized space” (Tuan, 2001). In line with the above definition, places can be described as spaces enriched with human experiences and meaning (Couclelis, 1992). In this study, we define places as surfaces where socio-economic activities occur (e.g., bars, offices, and neighbourhoods). The types of the socio-economic activities that occur in places that are hosted in building blocks are used for BBU identification.
Two social media applications that collect citizen-contributed place data were taken into consideration for the selection of the place data source. For the study area, there were available 24,486 Facebook places and 37,482 Foursquare places which were harvested using the Facebook Graph Application Programming Interface (API) (Facebook developers, 2014) and the Foursquare venues API (Foursquare, 2015b) respectively. Due to the higher volume of Foursquare place data, the Foursquare application was selected to be used in this study. The combined use of both data sources was not implemented, since it would have introduced methodological and semantic problems. This is due to two reasons:
Facebook uses a different place type classification from Foursquare. Consequently, the combination of the two sources would introduce semantic problems. Facebook users determine the place locations using the Global Navigation Satellite System (GNSS) receivers of their smartphones, while the Foursquare users determine the place locations on top of web maps. Both these approaches may introduce biases, but the combination of both types of biases would affect the consistency of the methodology.
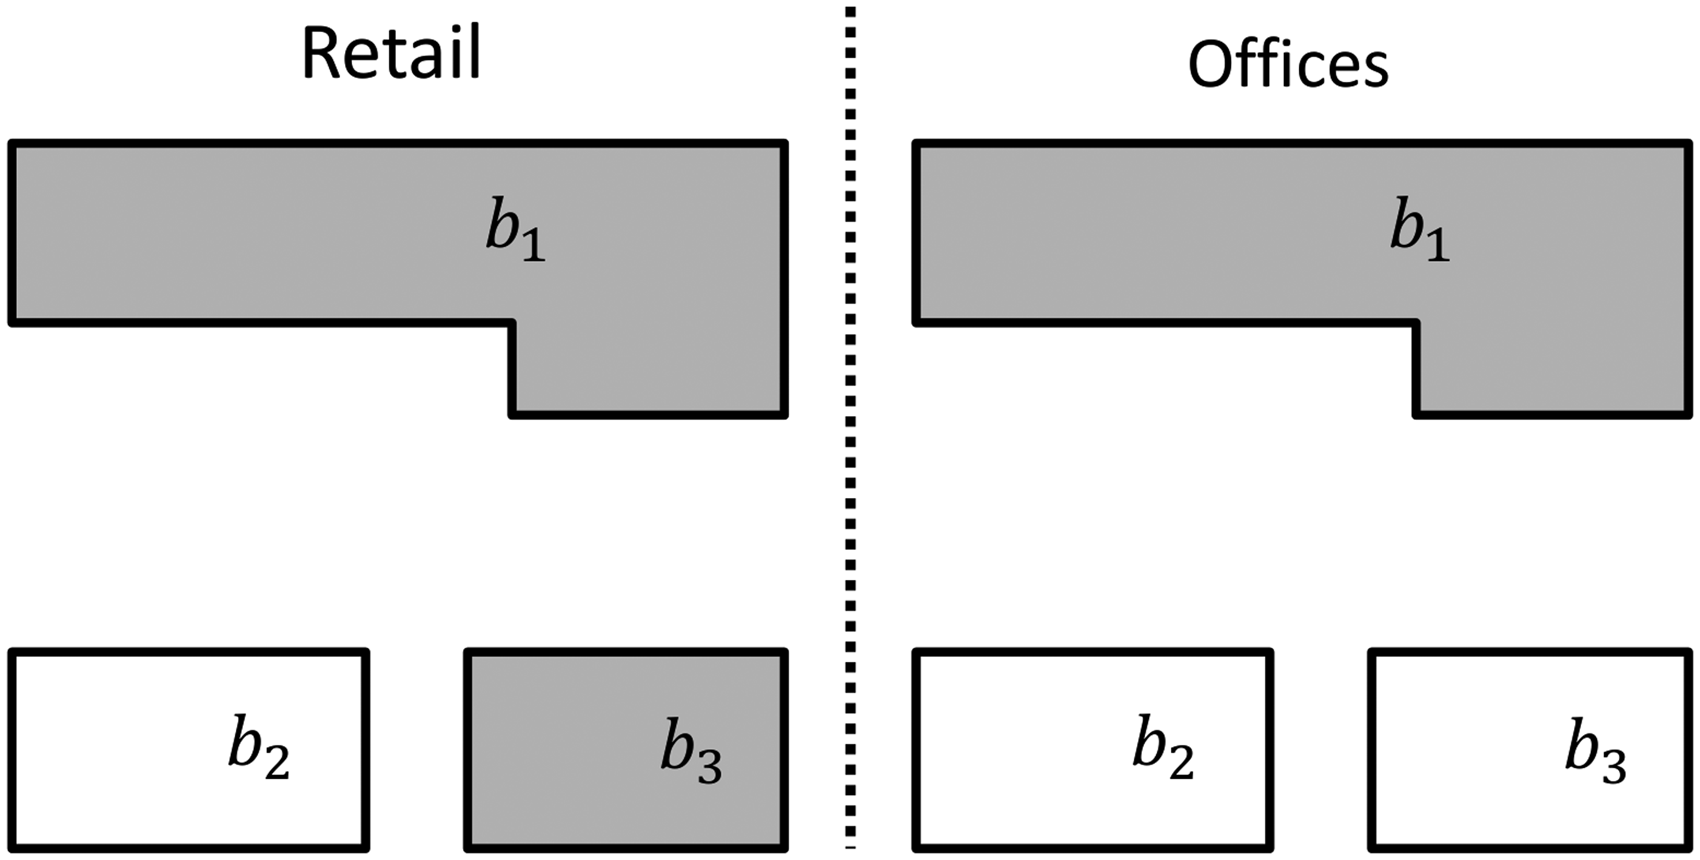
Foursquare is a social media application that allows users to discover and evaluate places. Until late July 2014, the users of Foursquare were able to declare their presence in a place, an activity widely known as “check-in”. After July 2014, this check-in feature has been moved to the Swarm application (Foursquare, 2014). Information about a place such as its geographic location, its name and its type is contributed to the Foursquare application by its users. Foursquare users are also correcting the descriptions of existing places if they are inaccurate. The geographic location of the Foursquare places is approximately determined by users who are adding a point on top of a web map. Since the places are not abstract points of the Euclidian geometry (Frank, 1996), the determination of the place point location is based on the Foursquare users’ subjective judgment. The spatial distributions of the Foursquare places and the Foursquare checked in users, in the city of Amsterdam, are shown in Figure 3. The majority of both places and checked in users are located in the city centre of Amsterdam.
The study area is divided in pixels of 300 m by 300 m size, and each pixel is colored based: a) on the total number of places that are located in it (left side); and b) the total number of Foursquare users that have checked in places that are located in it (right side).
Methodology
In this section, we present the methodology followed for estimating BBU using Foursquare place data and for assessing the accuracy of these estimations. The methodology consists of three steps. As shown in Figure 4, the first step is the Foursquare place data preparation, which is explained in Foursquare place data preparation section. In the second step, we calculate the estimated BBU dataset taking into consideration combinations of the parameters The methodology followed for estimating BBU and assessing the accuracy of these estimations.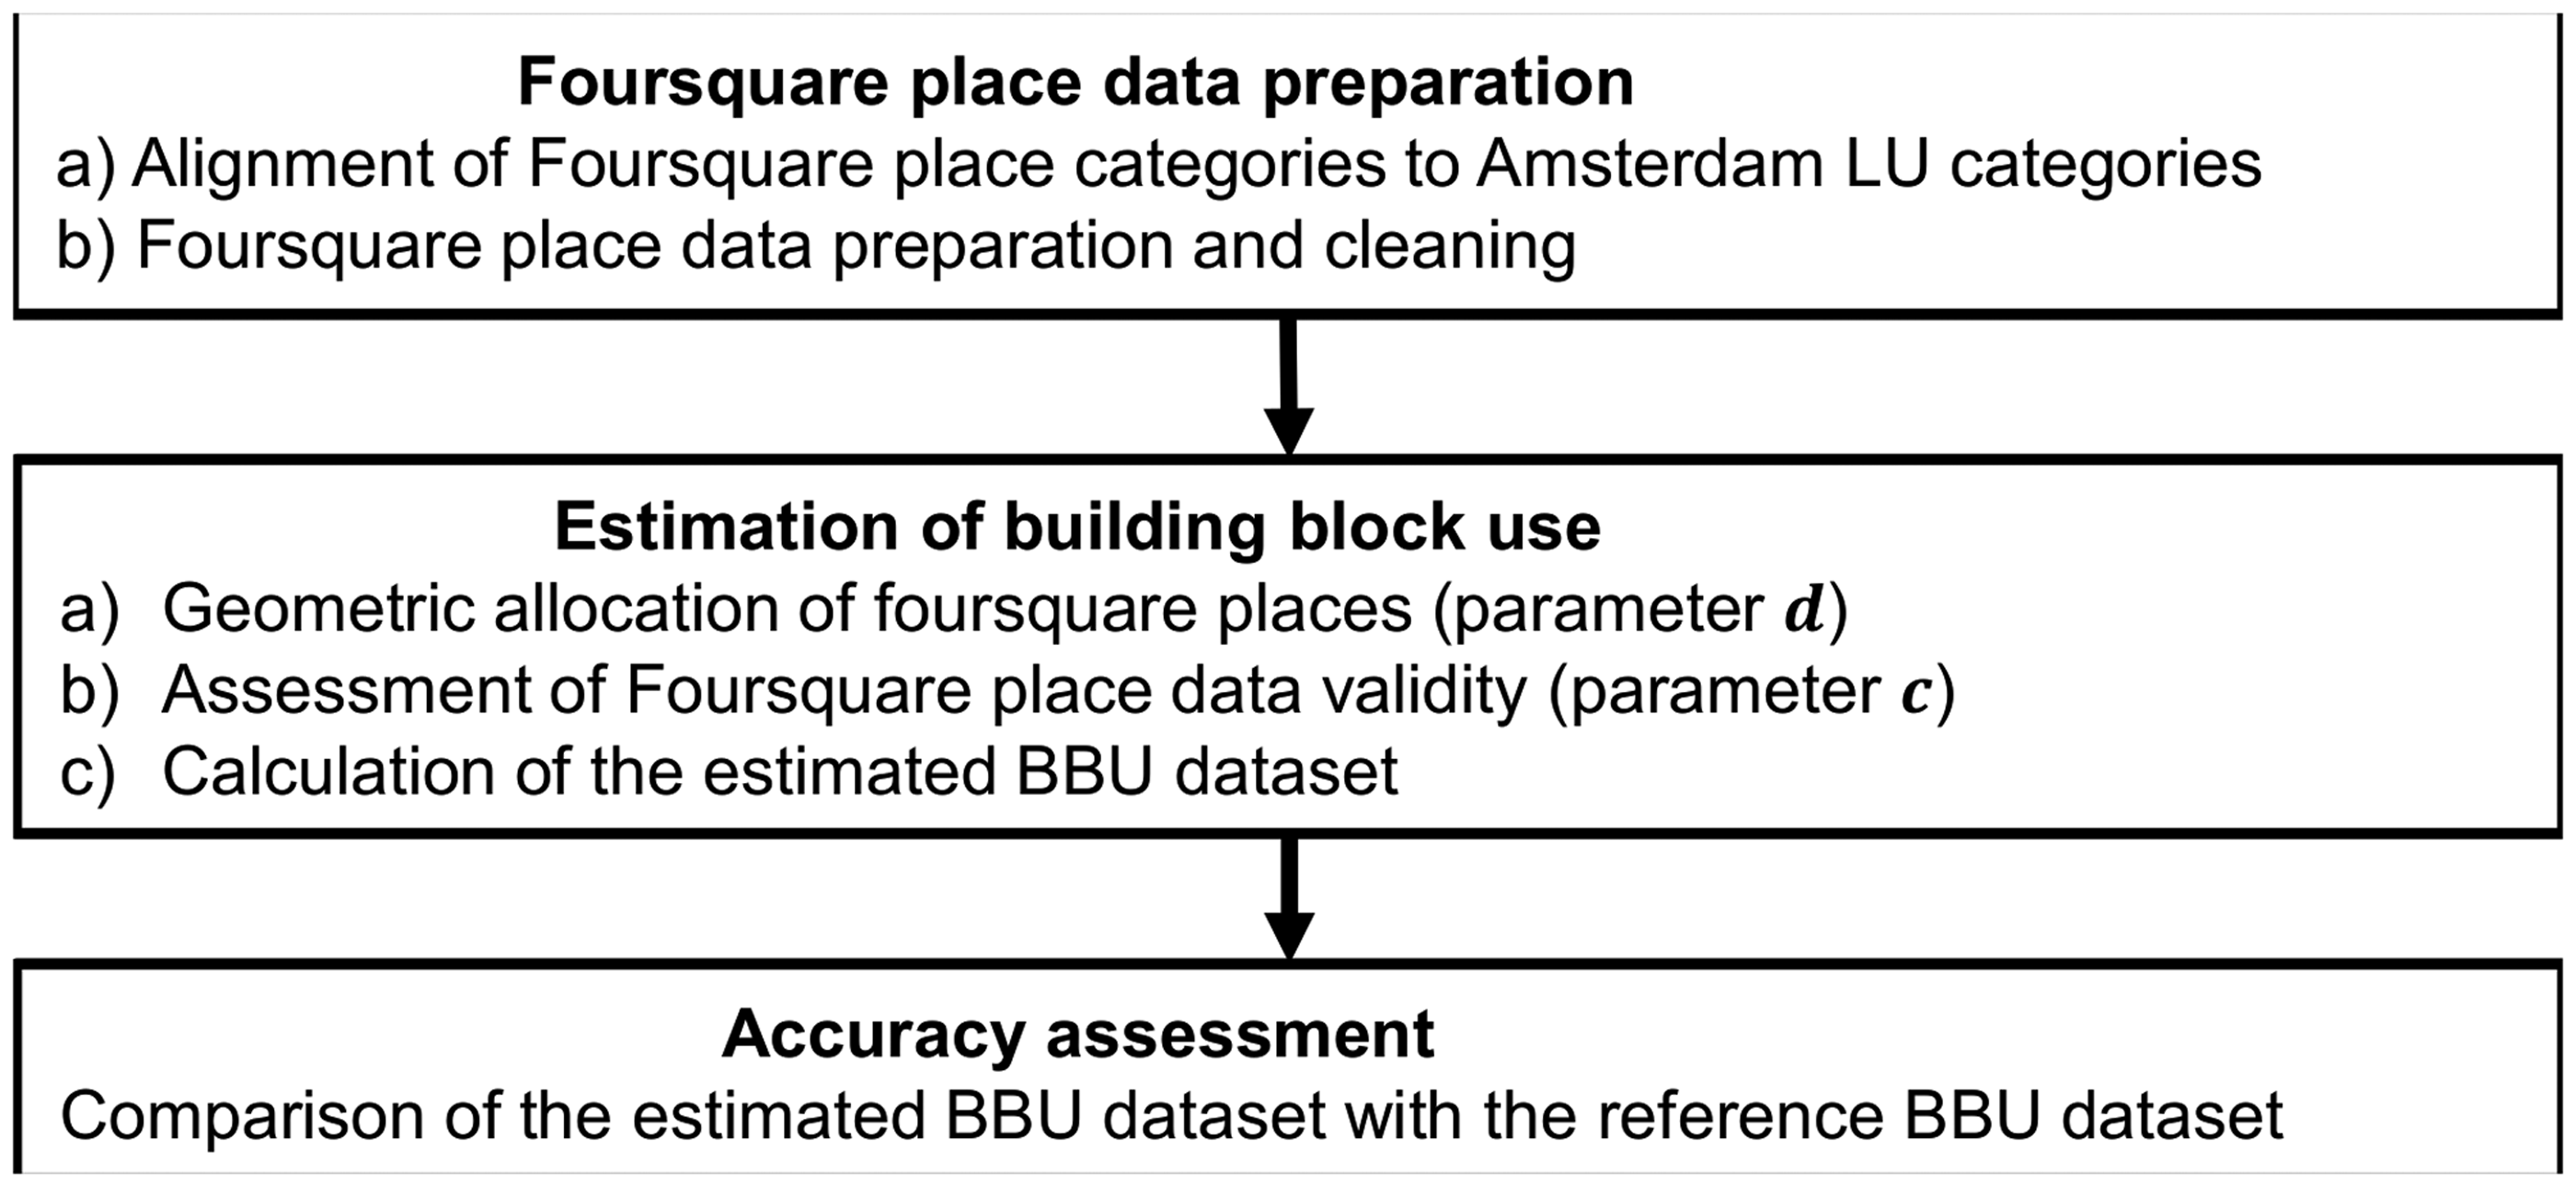
Foursquare place data preparation
First, in the Foursquare data preparation phase, we aligned the Foursquare place classification to the Amsterdam nonresidential LU classification. For this alignment, only the Foursquare categories that describe nonresidential functions that exist within buildings were used. The Foursquare application uses a predefined classification for the description of the category of a place (Foursquare, 2015a). As of January 2015, there were 712 Foursquare place categories. From these categories, 633 were manually aligned to their corresponding eight Amsterdam LU categories, taking also into consideration their detailed subcategories. The remaining Foursquare categories were not taken into consideration since they were referring to irrelevant categories such as outdoor activities and residential uses. The manual alignment of the Foursquare and Amsterdam classifications was based on personal interpretation and it was made difficult due to semantic and spatial granularity differences between the Foursquare place classification and the Amsterdam LU classification. For example, the Foursquare place category “College Cafeteria” was aligned to the Amsterdam LU category “Societal,” which describes Colleges and Universities among others, and not to the “hotels, restaurants and cafes” LU category, which describes cafes.
Number and percentage of Amsterdam LU subcategories for each of the eight main Amsterdam LU categories, and number and percentage of Foursquare place categories that have been aligned to them.
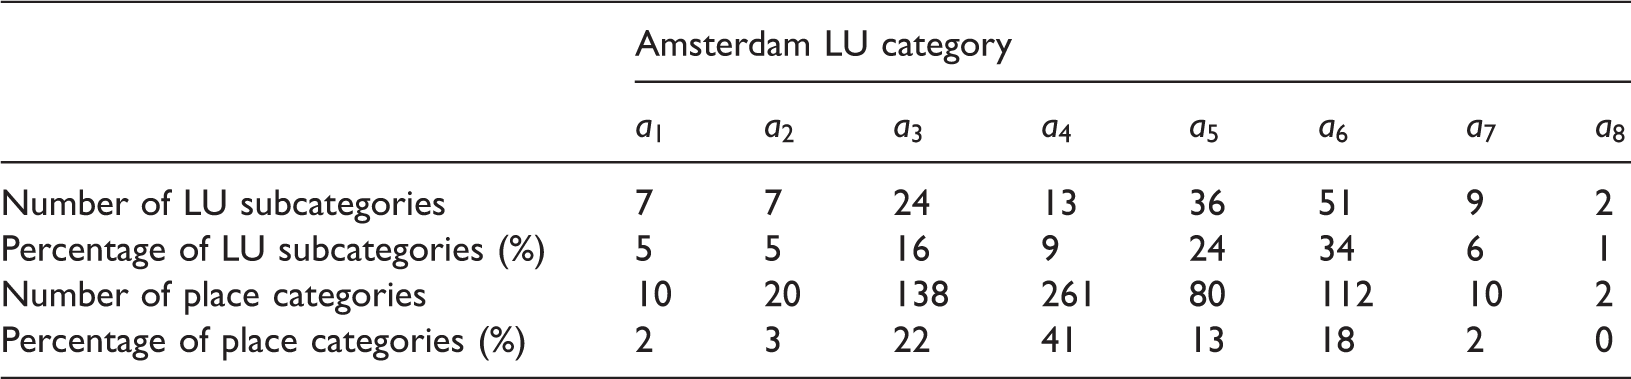
After aligning the Foursquare place classification to the Amsterdam one, we cleaned the Foursquare place dataset. As of February 2015, there were 37,482 Foursquare places within the area bounded by the motorway A10. From them, 30,036 were referring to one of the 633 Foursquare place categories, which were aligned to the Amsterdam LU and were used for the estimation of the BBU. The numbers of Foursquare places that belong to each Amsterdam LU category are presented in Figure 5. Clearly, places that refer to recreational and commercial LU categories are well represented in the Foursquare place dataset. On the contrary, places that belong to the “storage” or “industries” LU categories are underrepresented. This is due to the voluntary nature of crowdsourcing data collection. Foursquare users add descriptions of places that they are willing either to evaluate or to state their presence in them.
Number of Foursquare places and number of surfaces of the nonresidential use dataset for each Amsterdam LU category.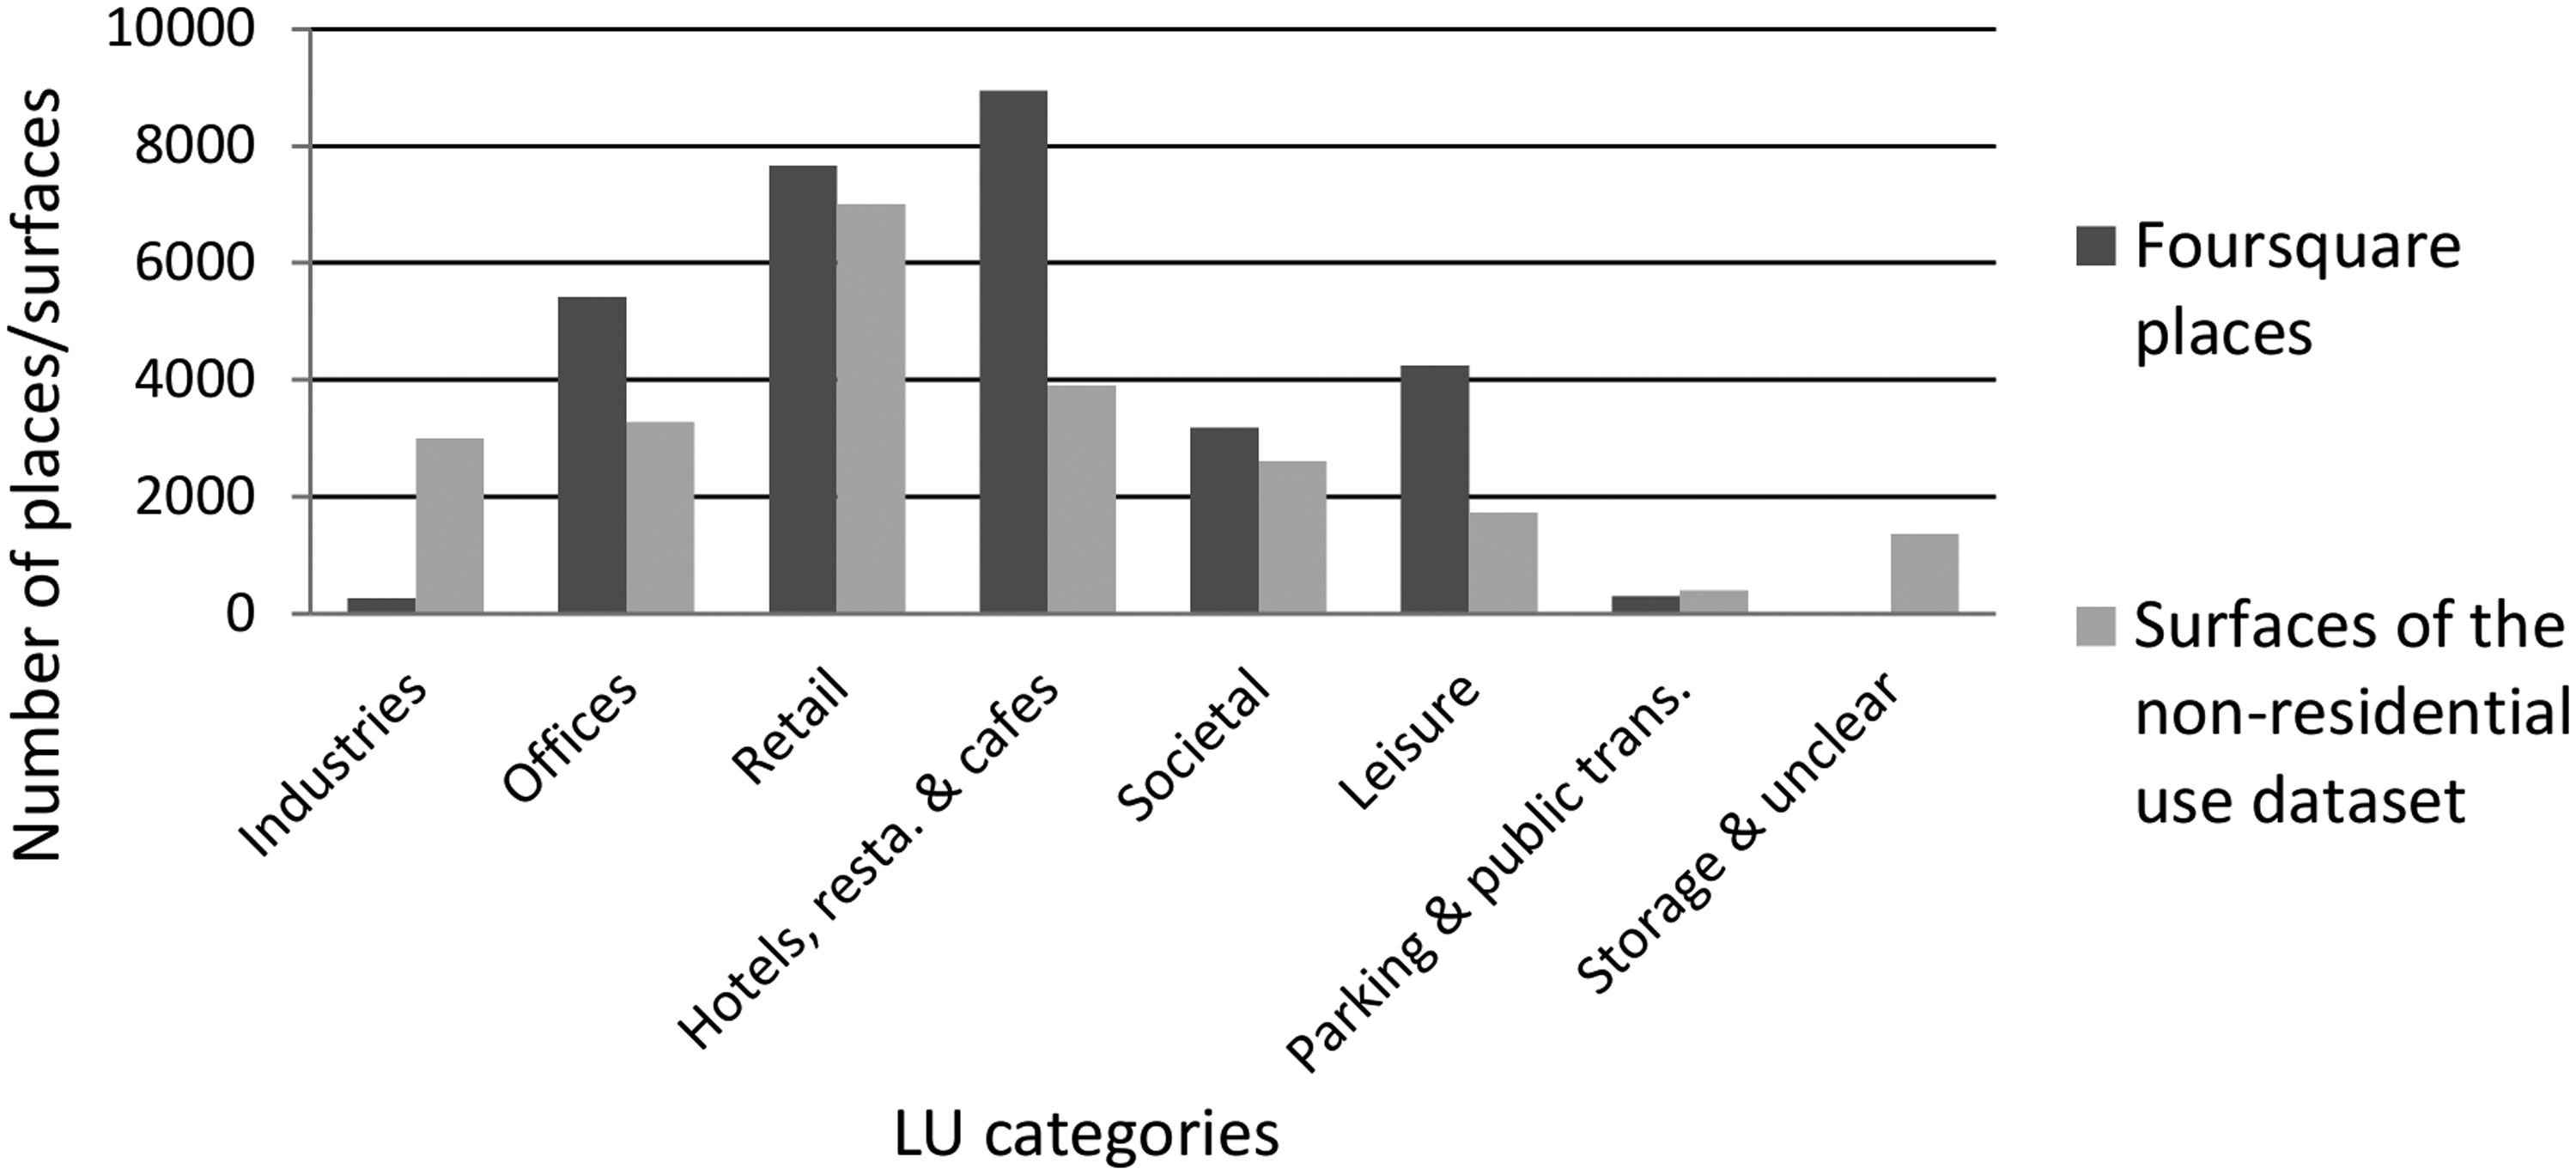
The cleaned place dataset, which is represented by the set 
Every place The attribute f represents the Foursquare category of a place pj.
BBU estimation
The estimation of BBU was performed at the spatial scale of urban building block level and not at the building level. The reason for this is that in Amsterdam, and particularly in its historic centre, many buildings are narrow, due to the fact that in the past they were taxed based on their frontage (Farmer, 1993). The determination of the position of the places that are within buildings with small frontage requires high precision. Since the location of Foursquare place data is not very precise (Figure 6), many places are falsely described to be located in the nearby attached building. Due to that reason, an earlier attempt to allocate LU to buildings failed in terms of the accuracy of the estimations. In this study, this limitation is overcome by increasing the spatial scale of analysis from the building level to building block level.
Foursquare places located at the intersection of Rozengracht and Eerste Bloemdwarsstraat streets in Amsterdam. The Foursquare places are classified according to the Amsterdam LU categories.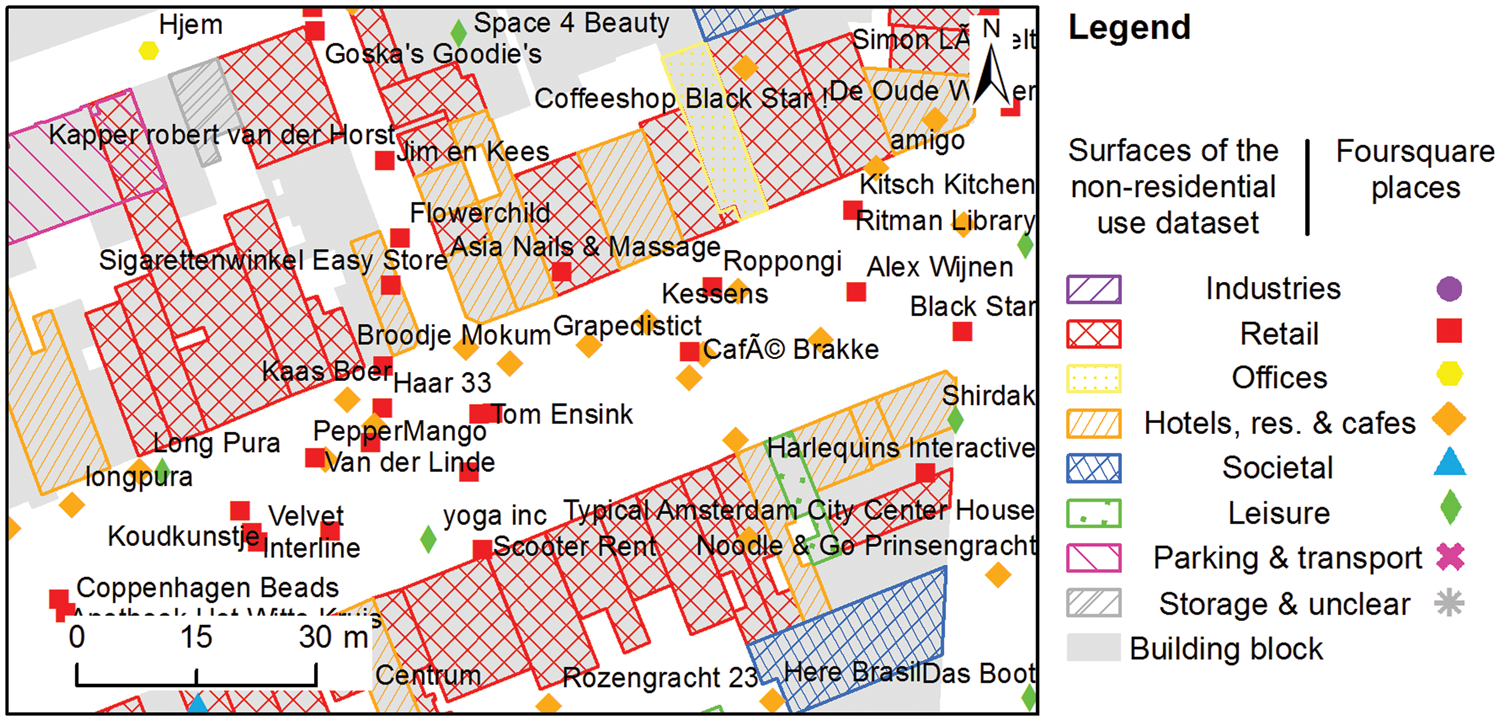
In order to estimate the BBU for the study area, two parameters were taken into account for LU allocation in the building blocks: the parametersd and
In order to assess how the positional accuracy of Foursquare places varies based on the application of different d parameter values, we geocoded the place addresses, and we assessed whether their address locations fall within the same building blocks as their geographic locations. From the 30,036 Foursquare places used in this study, 9,845 had complete address information, and their addresses were geocoded using the OpenStreetMap’s Nominatim service (OpenStreetMap, 2015). The results of the accuracy assessment, in Figure 7, show that as the d parameter value is increasing, the total positional accuracy of places that lie within distance d from their closest building block decreases, while the number of total places taken into account increases. Clearly, the selection of the d parameter value is a trade-off between place data quantity and place data positional accuracy.
Percentage of places for which both the address and their geographic location refer to the same building block versus number of Foursquare places, using the d parameter values in the range (0 − 50 m). For example, for the parameter value d = 6 m there are 21,000 places from which, based on the 9,845 place sample, 70% are positionally accurate.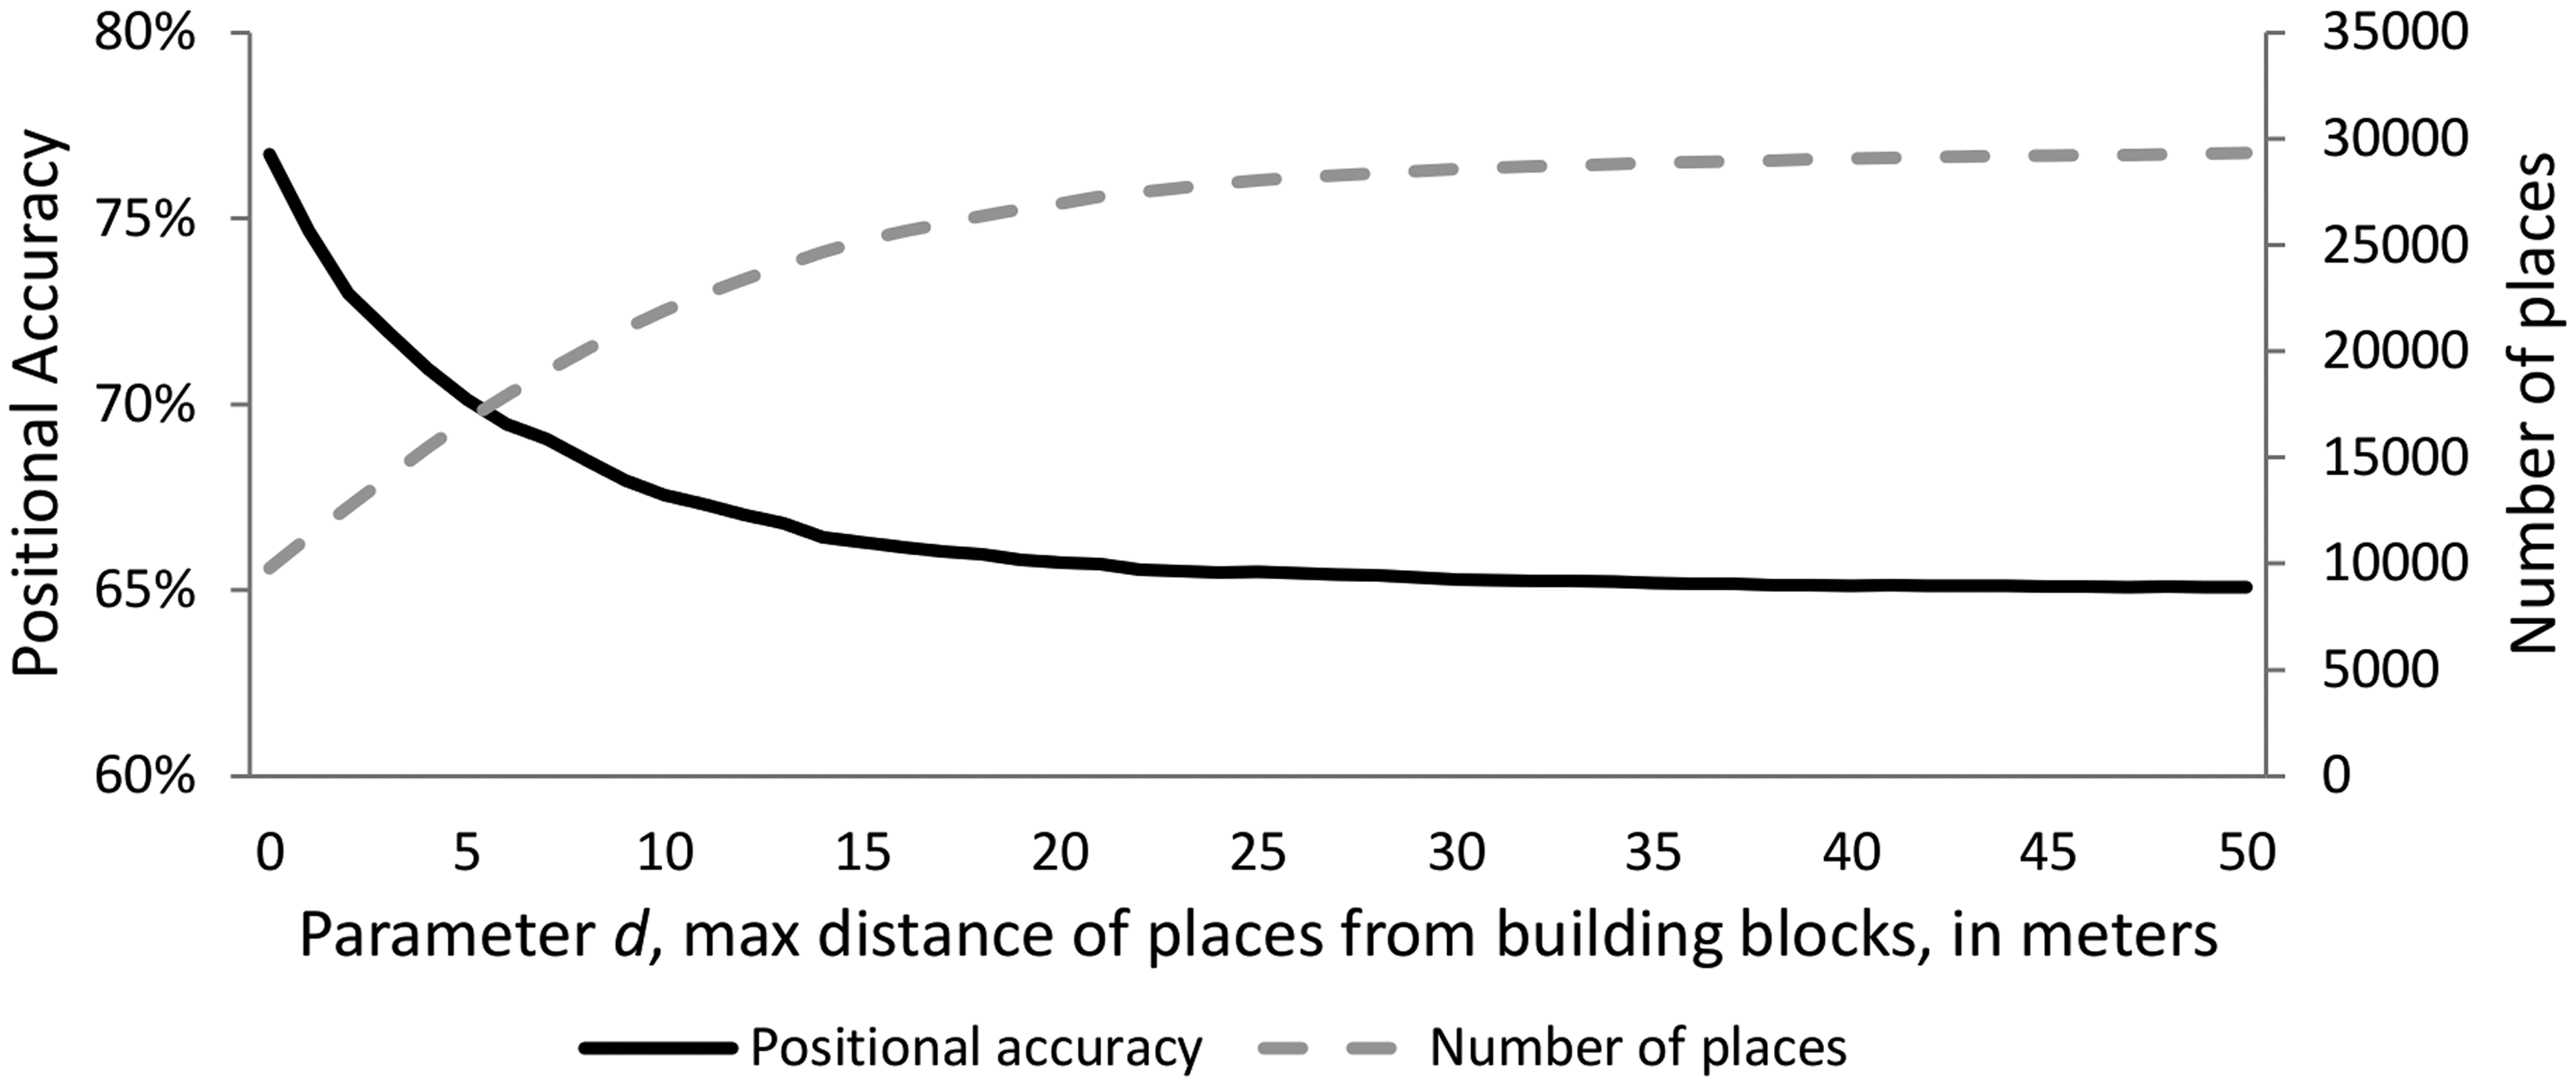
To further assess the accuracy of Foursquare places we made use of the Linus’ law (Raymond, 2001). Linus’ law states that, the higher the number of users or contributors of a product, the higher the probability that an error will be identified or fixed by someone is. Haklay et al. (2010) demonstrate that Linus’s law is valid for OpenStreetMap data, since there is a positive correlation between the number of contributors and the data quality. Linus’ law applied on the Foursquare place dataset, would state that the higher the number of Foursquare users that have declared a visit in a place is, the higher is the probability that this place is accurately described. To test this assumption, we took into consideration parameter Percentage of places for which both their address and geographic location refer to the same building block versus number of places, using c parameter values in the range (0 − 50).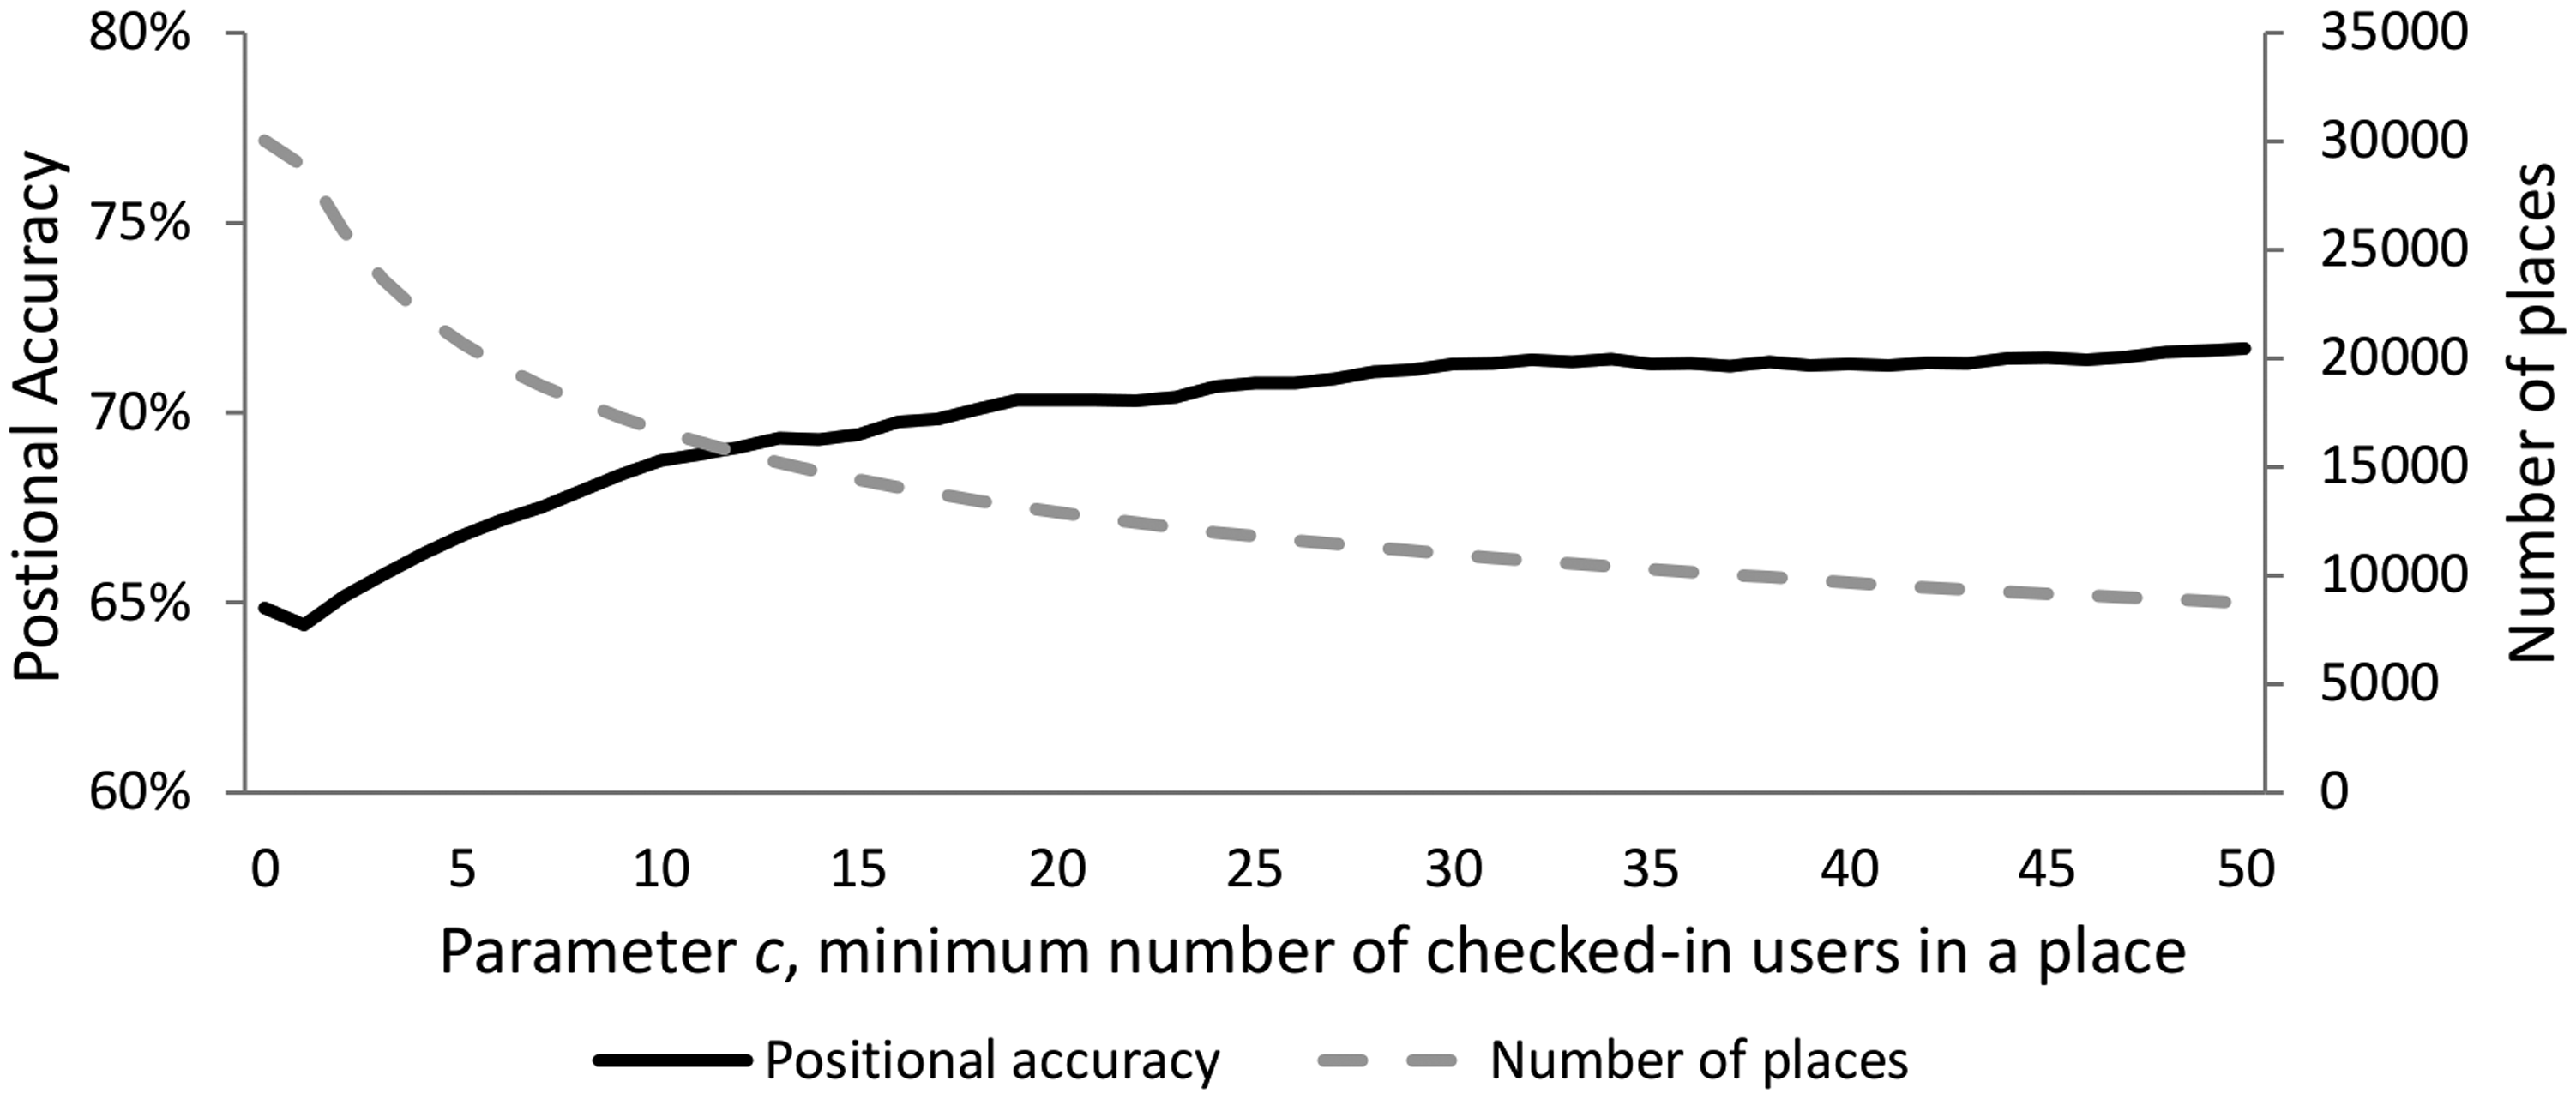
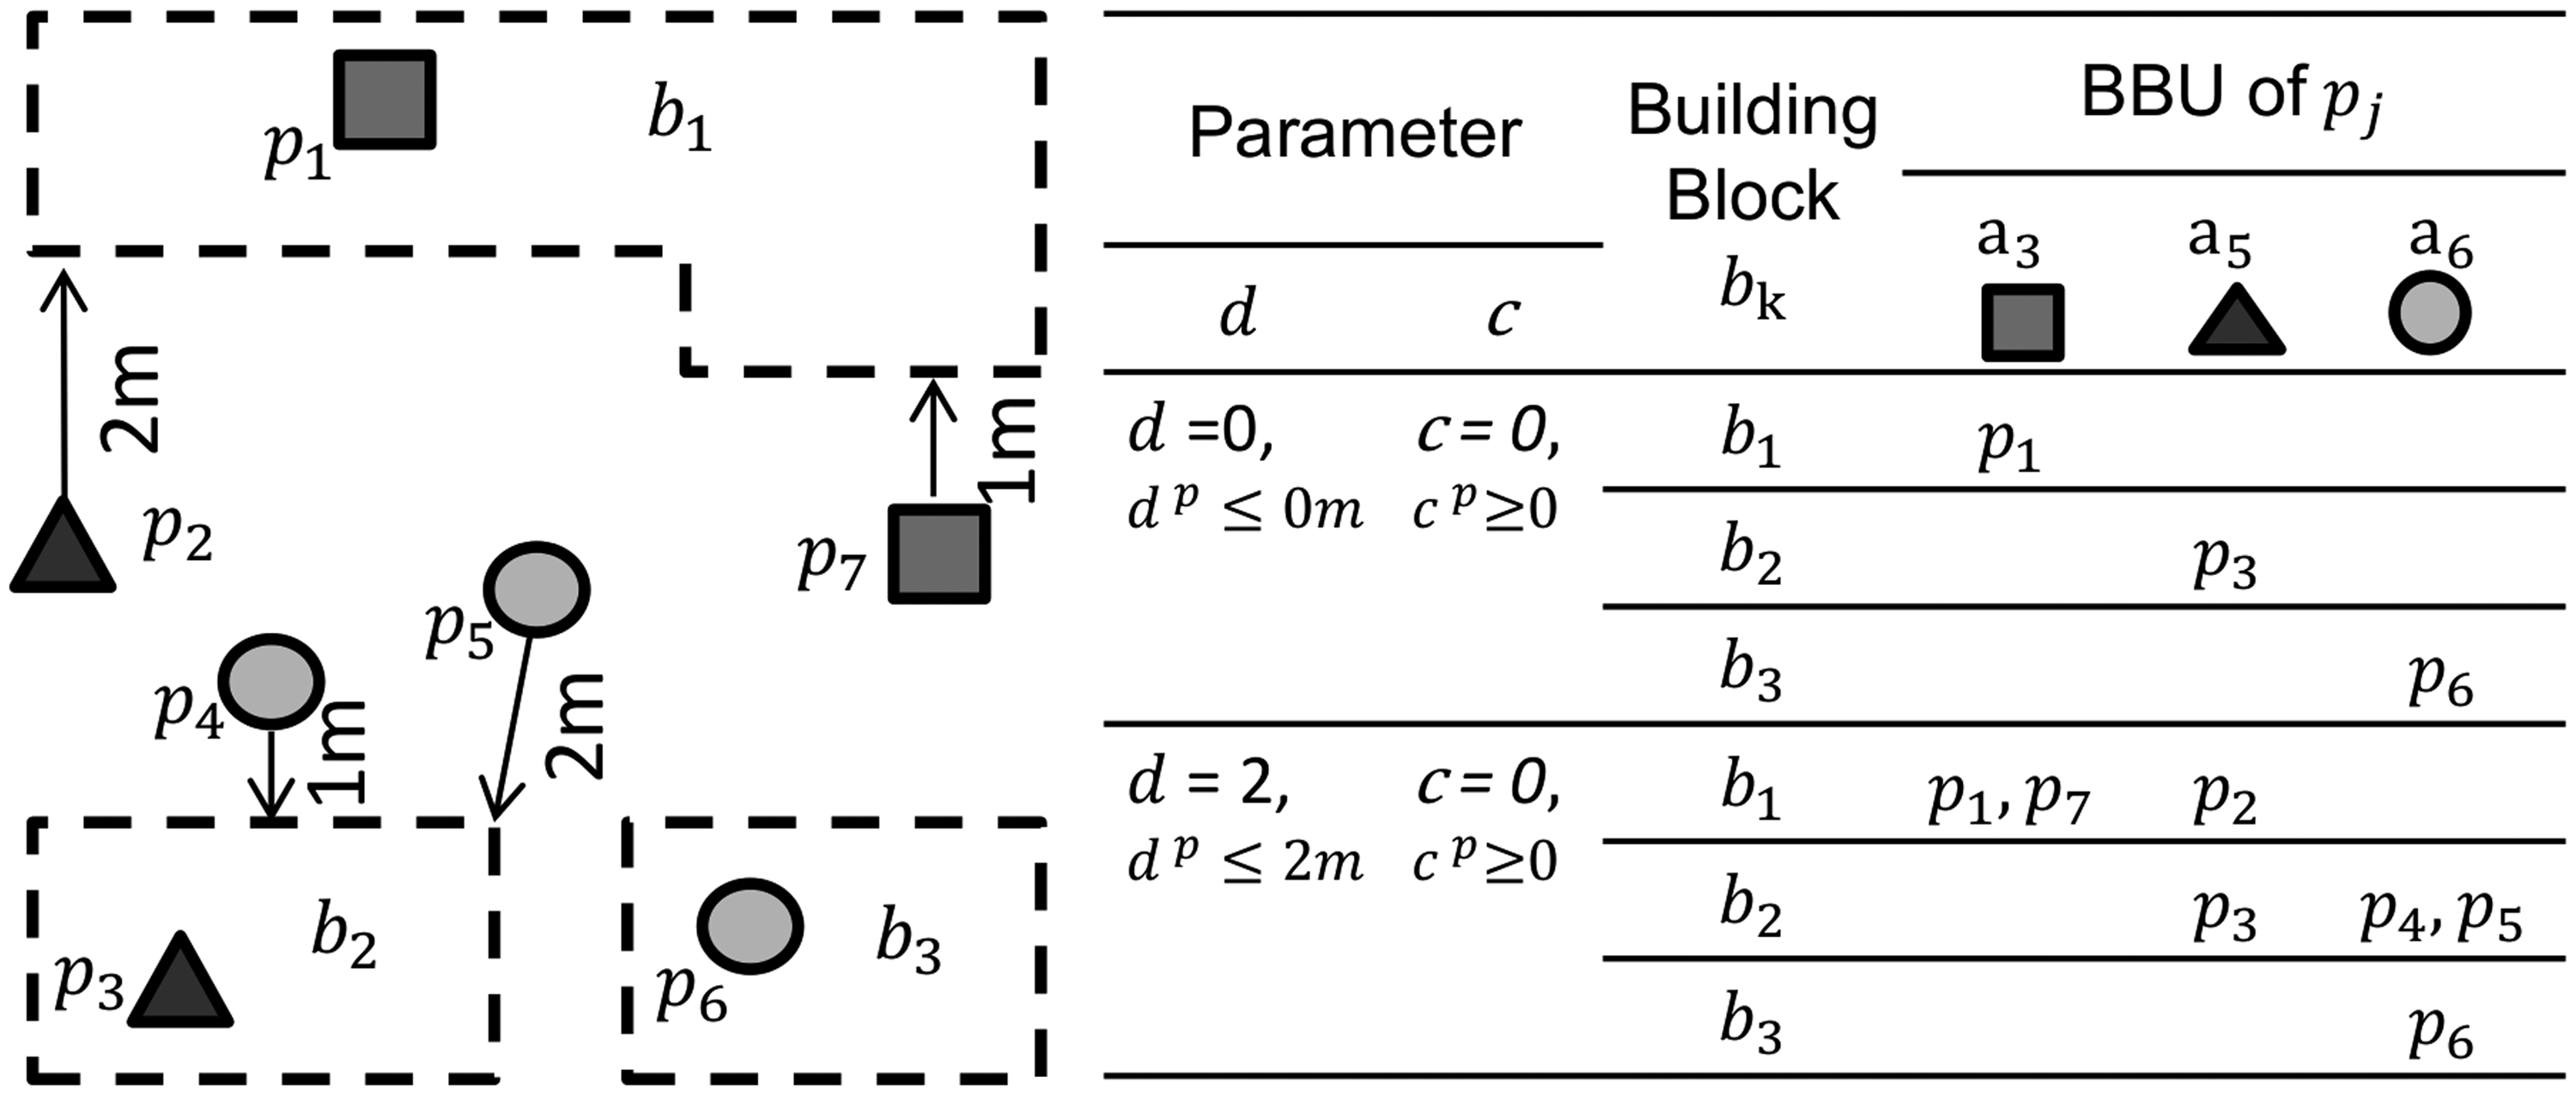
Finally, taking into consideration the above two described parameters, we computed the estimated the BBU dataset BBU estimation using Foursquare place data and taking into consideration the parameters c and d. In the building block b2, using parameter values 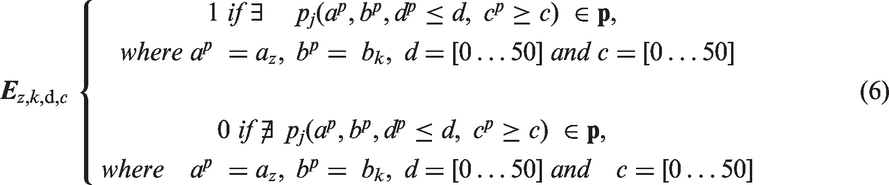
BBU accuracy assessment
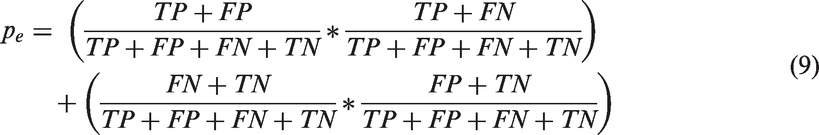
The accuracy assessment was performed in order to evaluate the correctness of LU category assignment on the building blocks. We compared the BBU estimated datasets, which were calculated using equation (6), with the reference BBU dataset which was calculated using equation (4). This comparison was performed 2,601 times in order to take into consideration any possible combination of the d and c parameter values. Cohen’s kappa coefficient (Cohen, 1960), which is described in equation (7), was selected to be used for the determination of the optimal BBU classification for each LU category. The reason is that this statistical measure normalizes for the expected chance of agreement (Carletta, 1996), and it determines whether the classification results are significantly better than a random result (Congalton, 1991). When there is total agreement between the estimated and the reference BBU dataset, the kappa coefficient value is one. On the contrary, when there is no agreement other than that which would be expected by chance, the kappa coefficient value is zero. Negative kappa coefficient values can also occur and they indicate agreement less than that achieved by chance (Viera and Garrett, 2005).


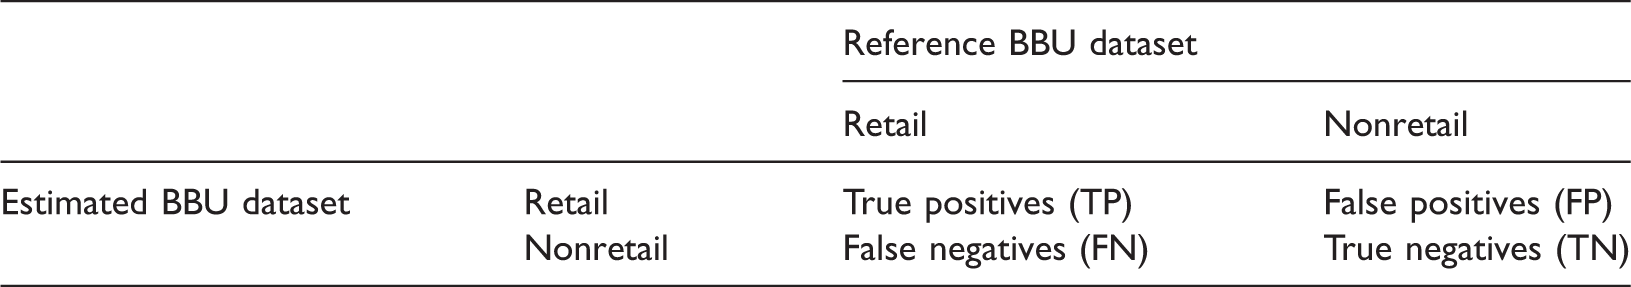
Confusion matrix for the “retail” LU category. TP represents the number of building blocks that have “retail” LU in both the estimated and the reference BBU datasets.
In addition to Cohen’s kappa coefficient, we estimated the precision, the sensitivity and the specificity for each LU category, which are described in equations (10), (11), and (12). The precision refers to the probability that a building block classified, for example, to have the “retail” LU in the estimated BBU dataset, actually has that LU category in the reference BBU dataset, as shown in Figure 10. The sensitivity refers to the probability that a building block that has the “retail” LU in the reference BBU dataset is correctly identified as having the “retail” LU in the estimated BBU dataset. Finally, the specificity refers to the probability that a building block is correctly estimated not to have the “retail” LU. The accuracy assessment results are presented in the next section.


Results
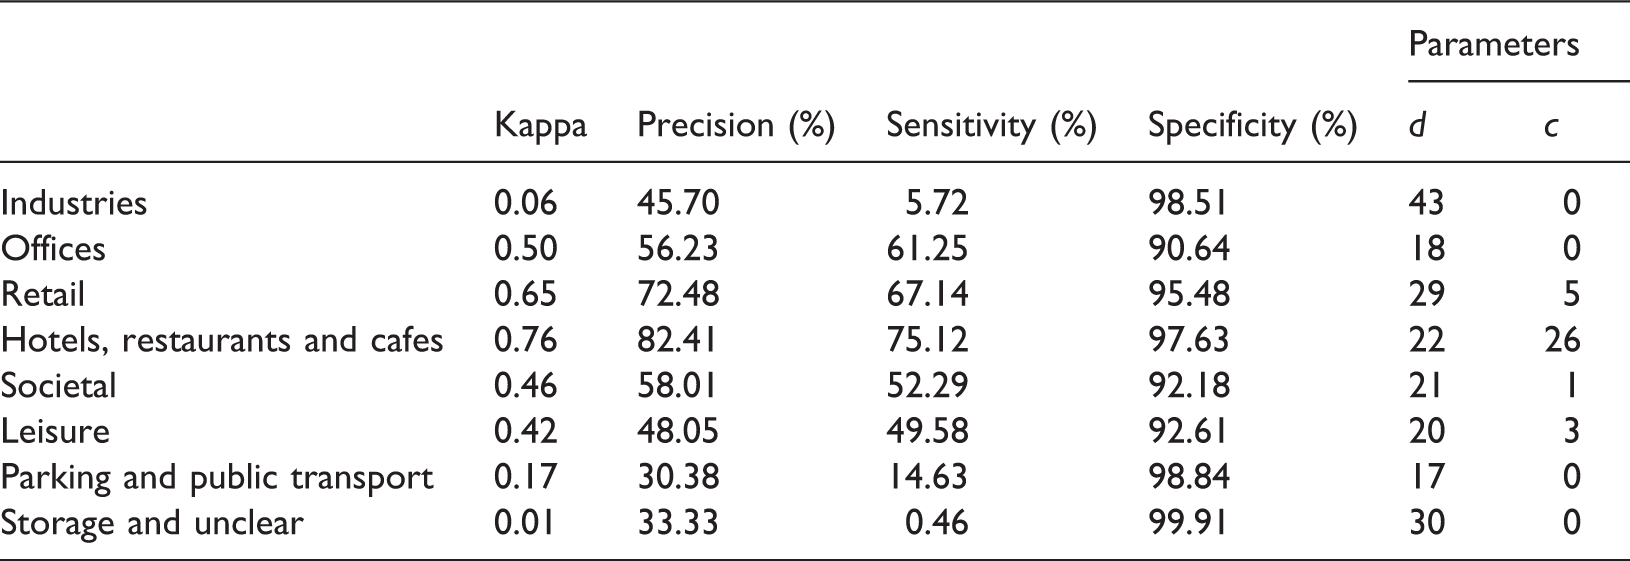
We present the best accuracy results for each LU category of the estimated BBU dataset in Table 3. The best accuracy results refer to the optimal BBU classifications for each LU category that were produced using the set of the parameter values d and c, for which the highest kappa coefficient was achieved when compared to the reference BBU dataset. These optimal sets of parameter values c and d for each LU category are presented in the last two columns of Table 3. As shown in Table 3, the highest Cohen’s kappa coefficient value, 0.76, was estimated for the “hotels, restaurants and cafes” LU category. About 75% of the building blocks with “hotels, restaurants and cafes” use were correctly identified using Foursquare place data. The lowest kappa coefficient was achieved for the LU categories “industries,” “Parking and public transport,” and “storage and unclear,” and is for all of them below 0.2. For the other categories, the kappa coefficient ranges from 0.42 to 0.65. The specificity for all the LU categories is high, above 90%, and shows that building blocks without nonresidential LU were correctly estimated as not having such use.
Building blocks estimated to have retail use (in black) versus building blocks that have retail use in the reference dataset (in black) in the “Bos en Lommer” neighborhood, Amsterdam. Best accuracy results for each LU category of the Amsterdam case study. In the last two columns we present the d and c parameter values for which the highest Cohen’s kappa coefficient values were achieved.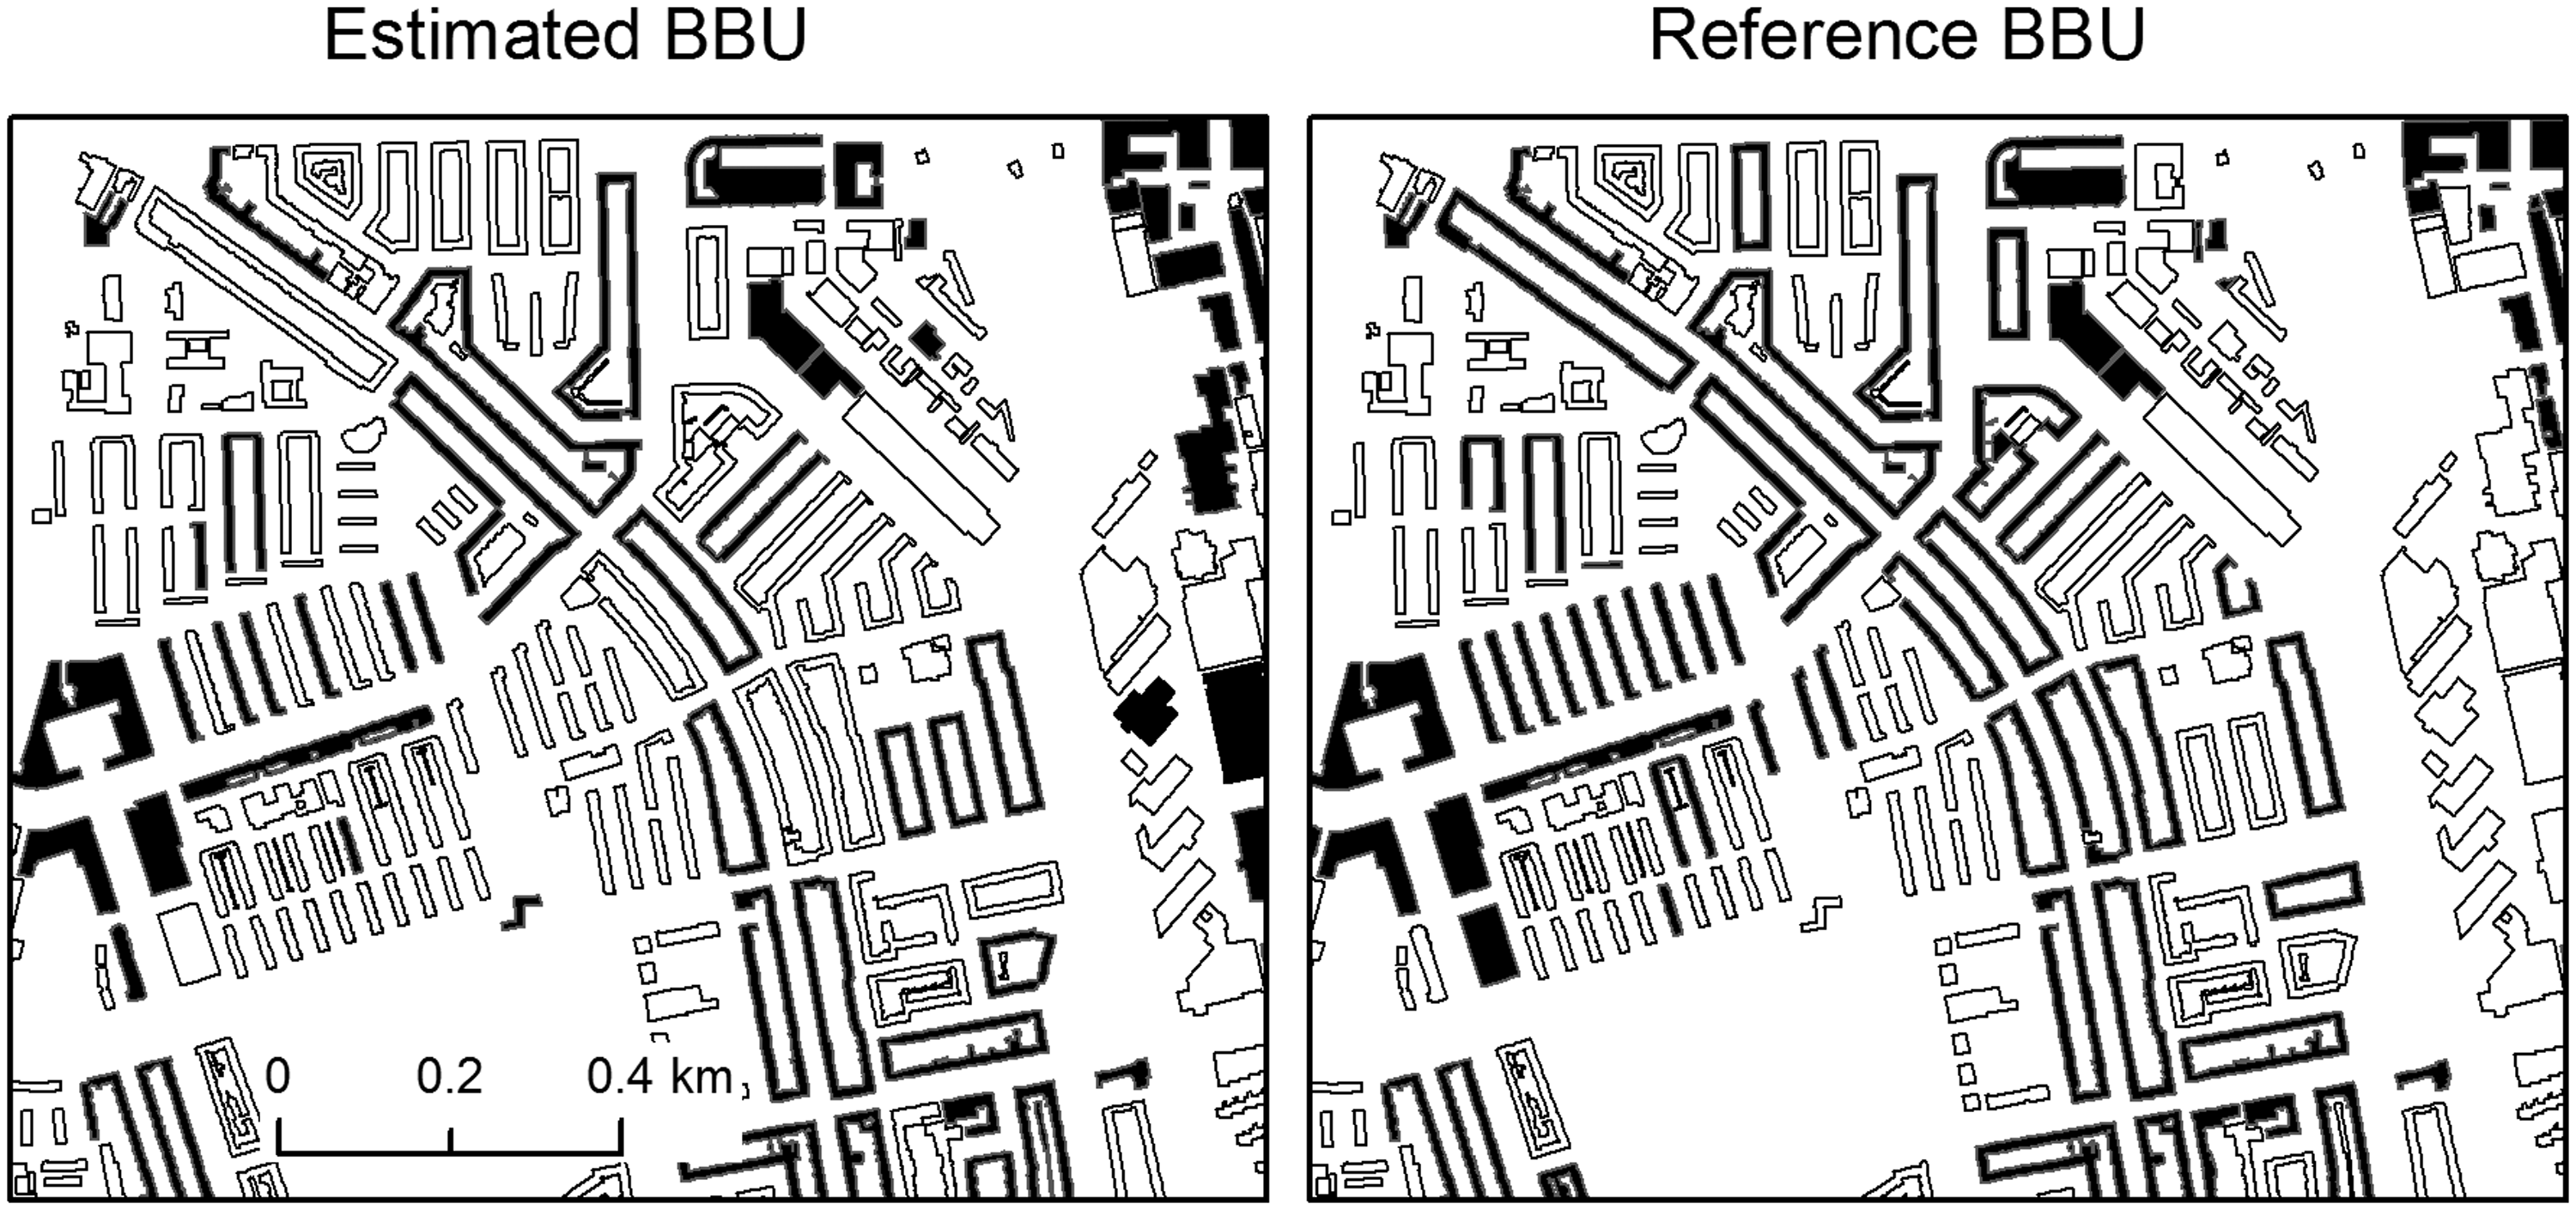
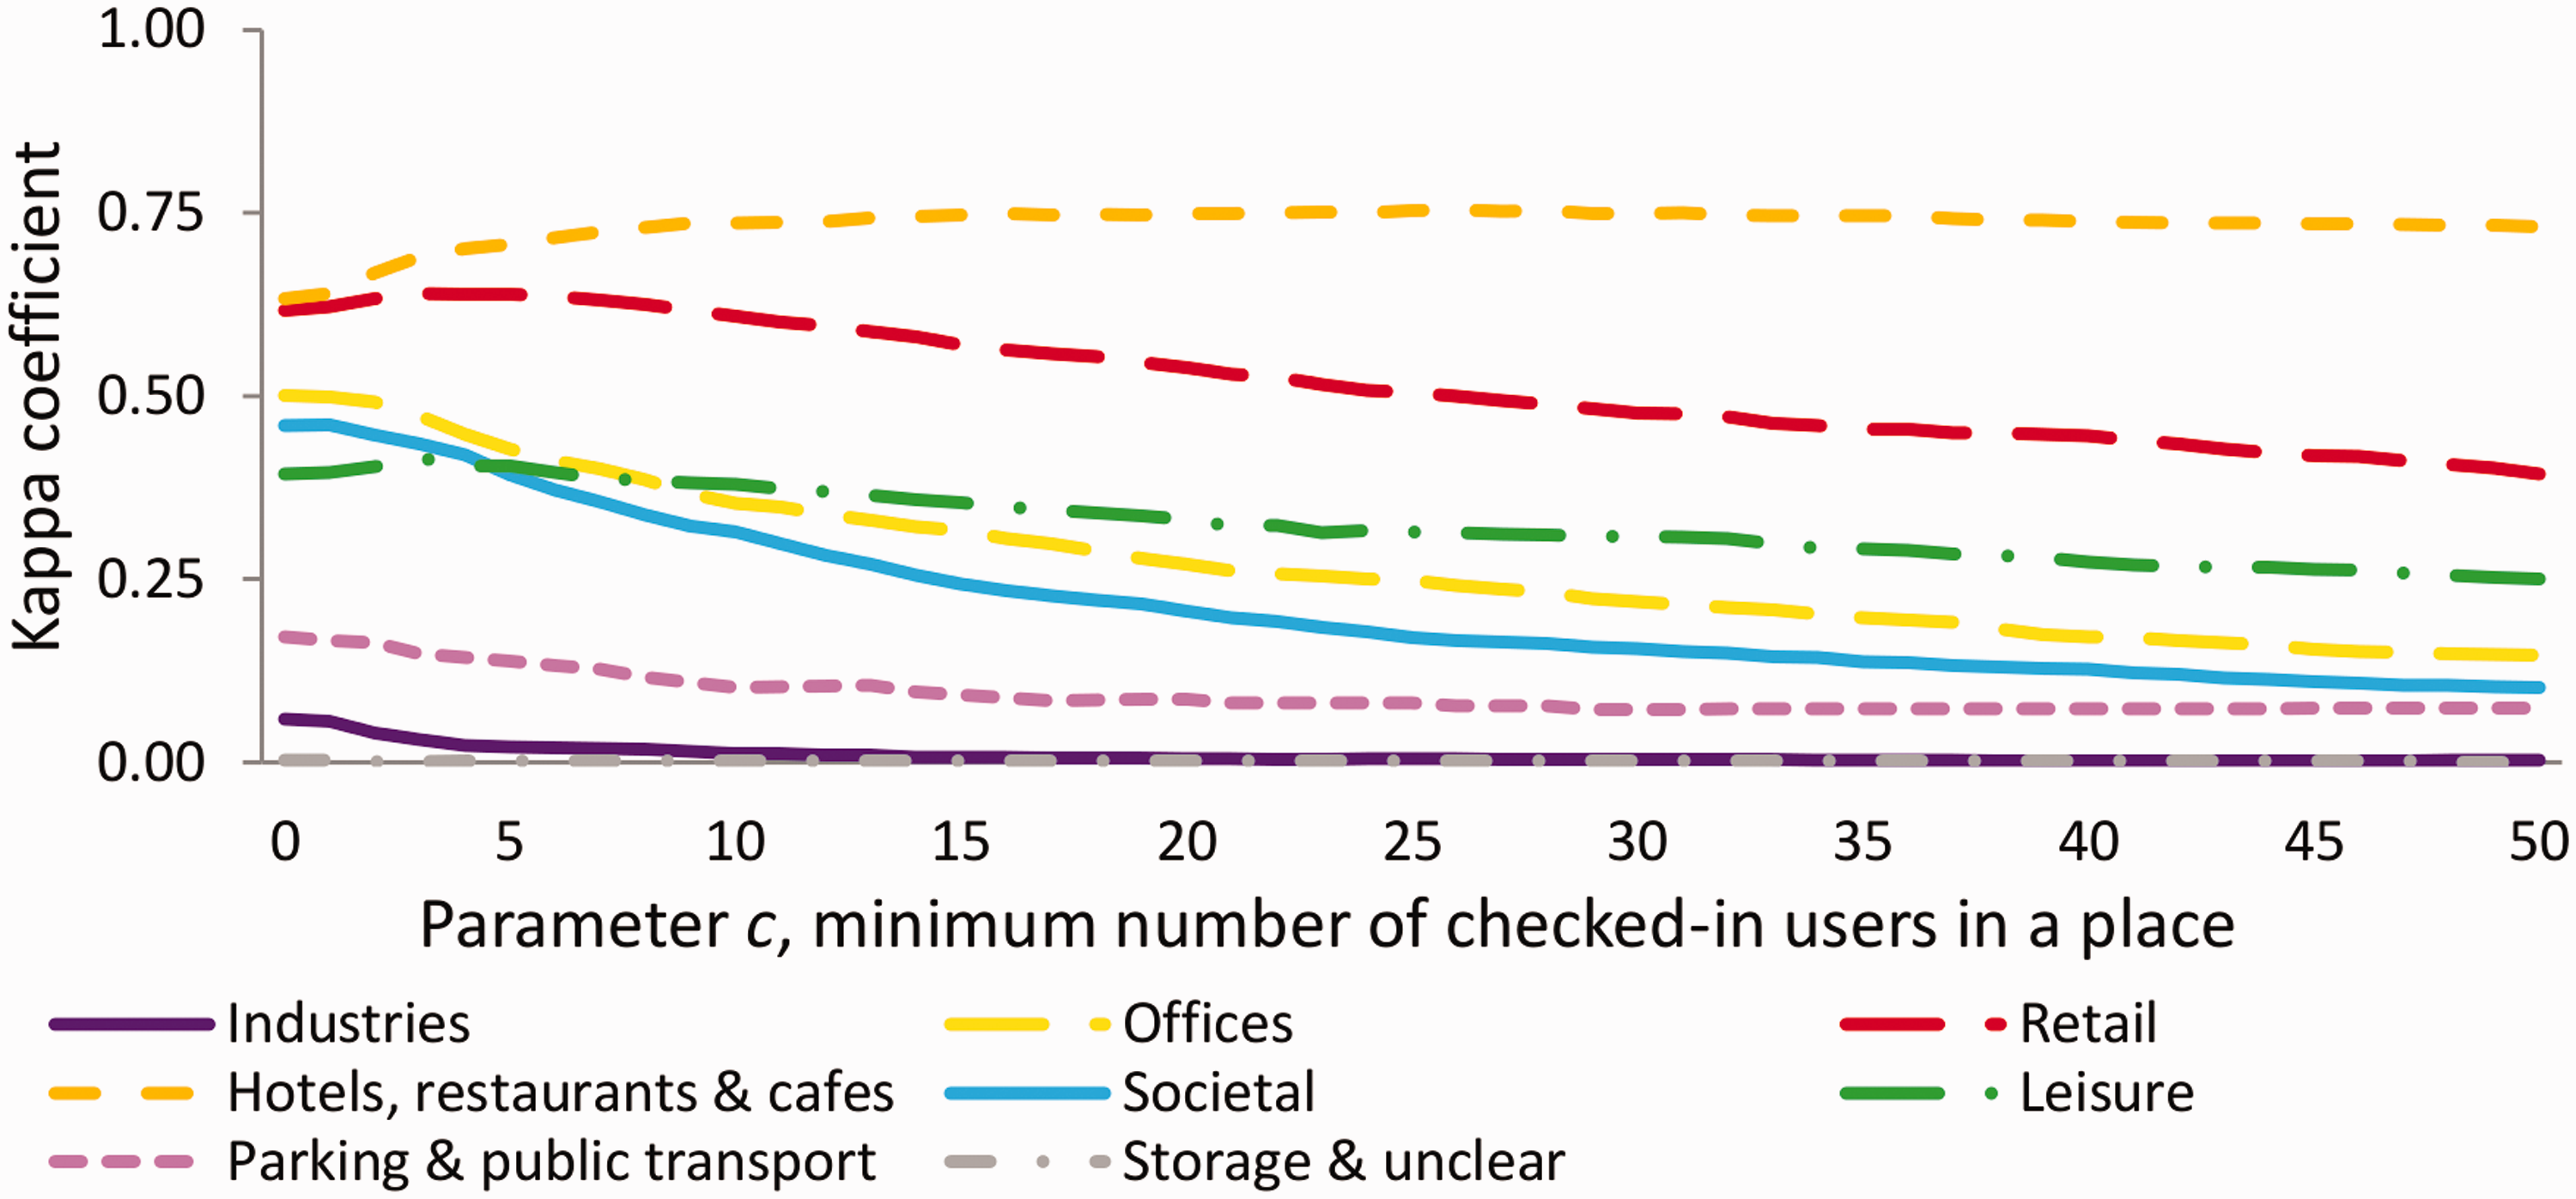
The parameter values, d and c affect the accuracy of the estimated BBU dataset. As shown in Figure 11, the kappa coefficient for each LU category is increasing as the maximum distance between places and their closest building blocks increases up to the optimal d parameter values, which range from 17 to 43 depending on the LU category. This is because some LU categories, like for example “industries,” are mostly located in sparsely built-up areas, while others such as “offices” in densely built-up areas. Regarding parameter c, as shown in Figure 12, for some categories with high precision, the kappa coefficient is increasing as the number of minimum checked in users increases up to the optimal c value. This optimal value ranges from 0 to 26, since it depends on the characteristics of the places of each individual LU category. For example, for the category “hotels, restaurants and cafes,”, which is the category with the highest number of places, the optimal c parameter value is 26.
Cohen’s kappa coefficient of the estimated BBU dataset calculated using the parameter values d = (0–50 m) and c = 0. Cohen’s kappa value of the estimated BBU dataset calculated using the parameter values c = (0–50) and d = 20 m.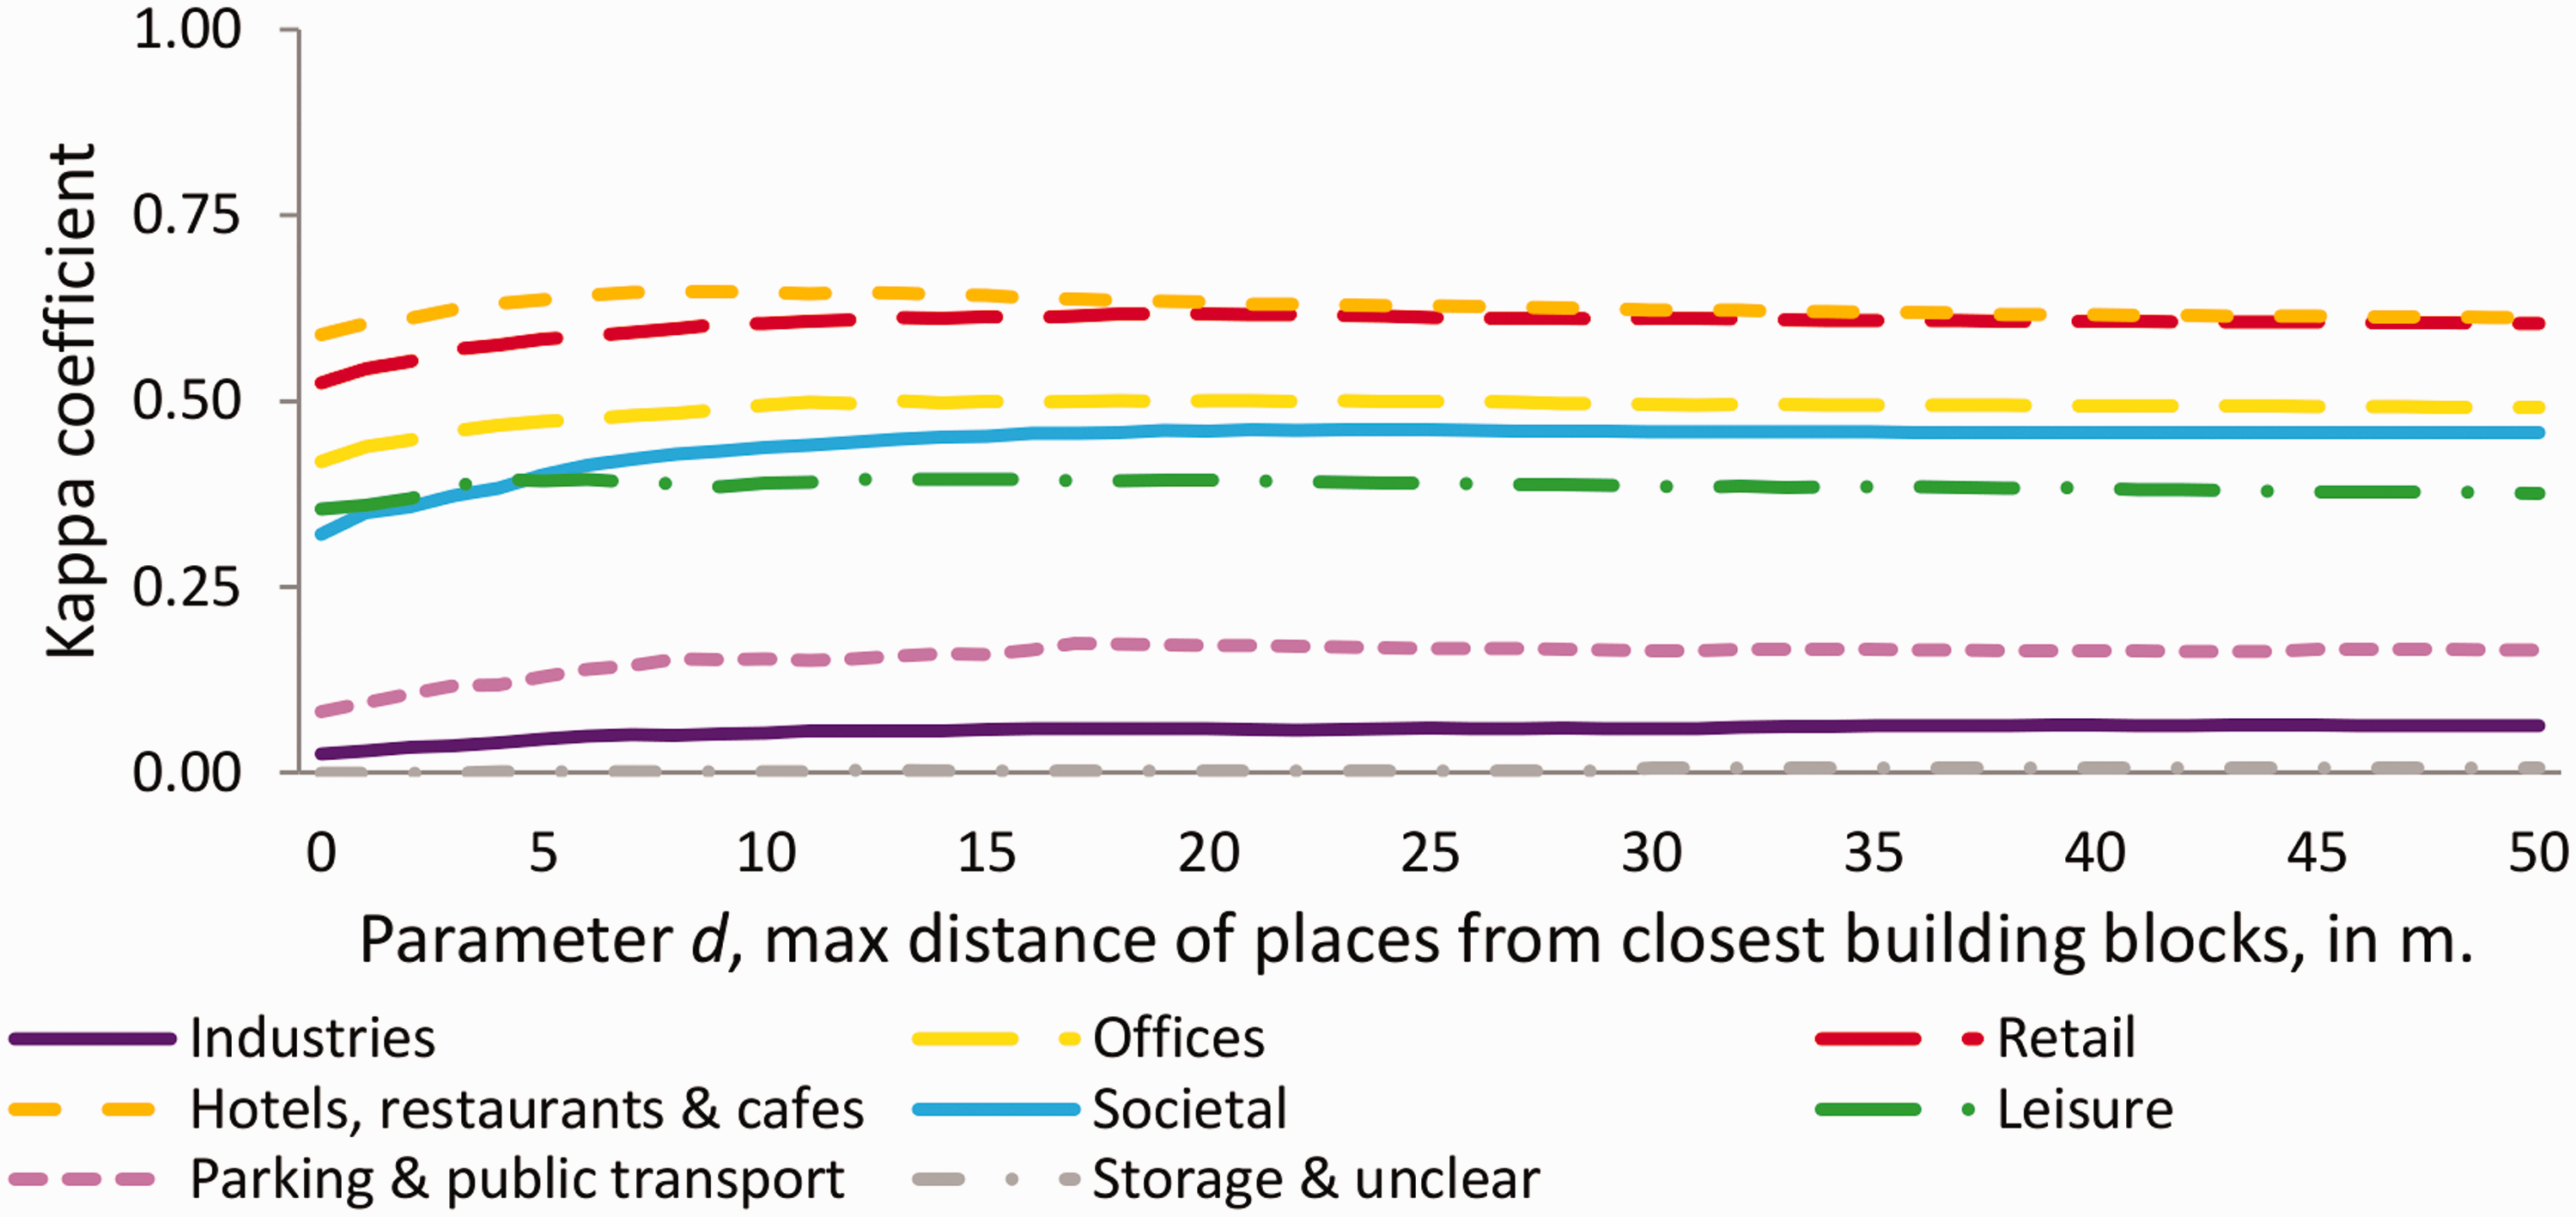
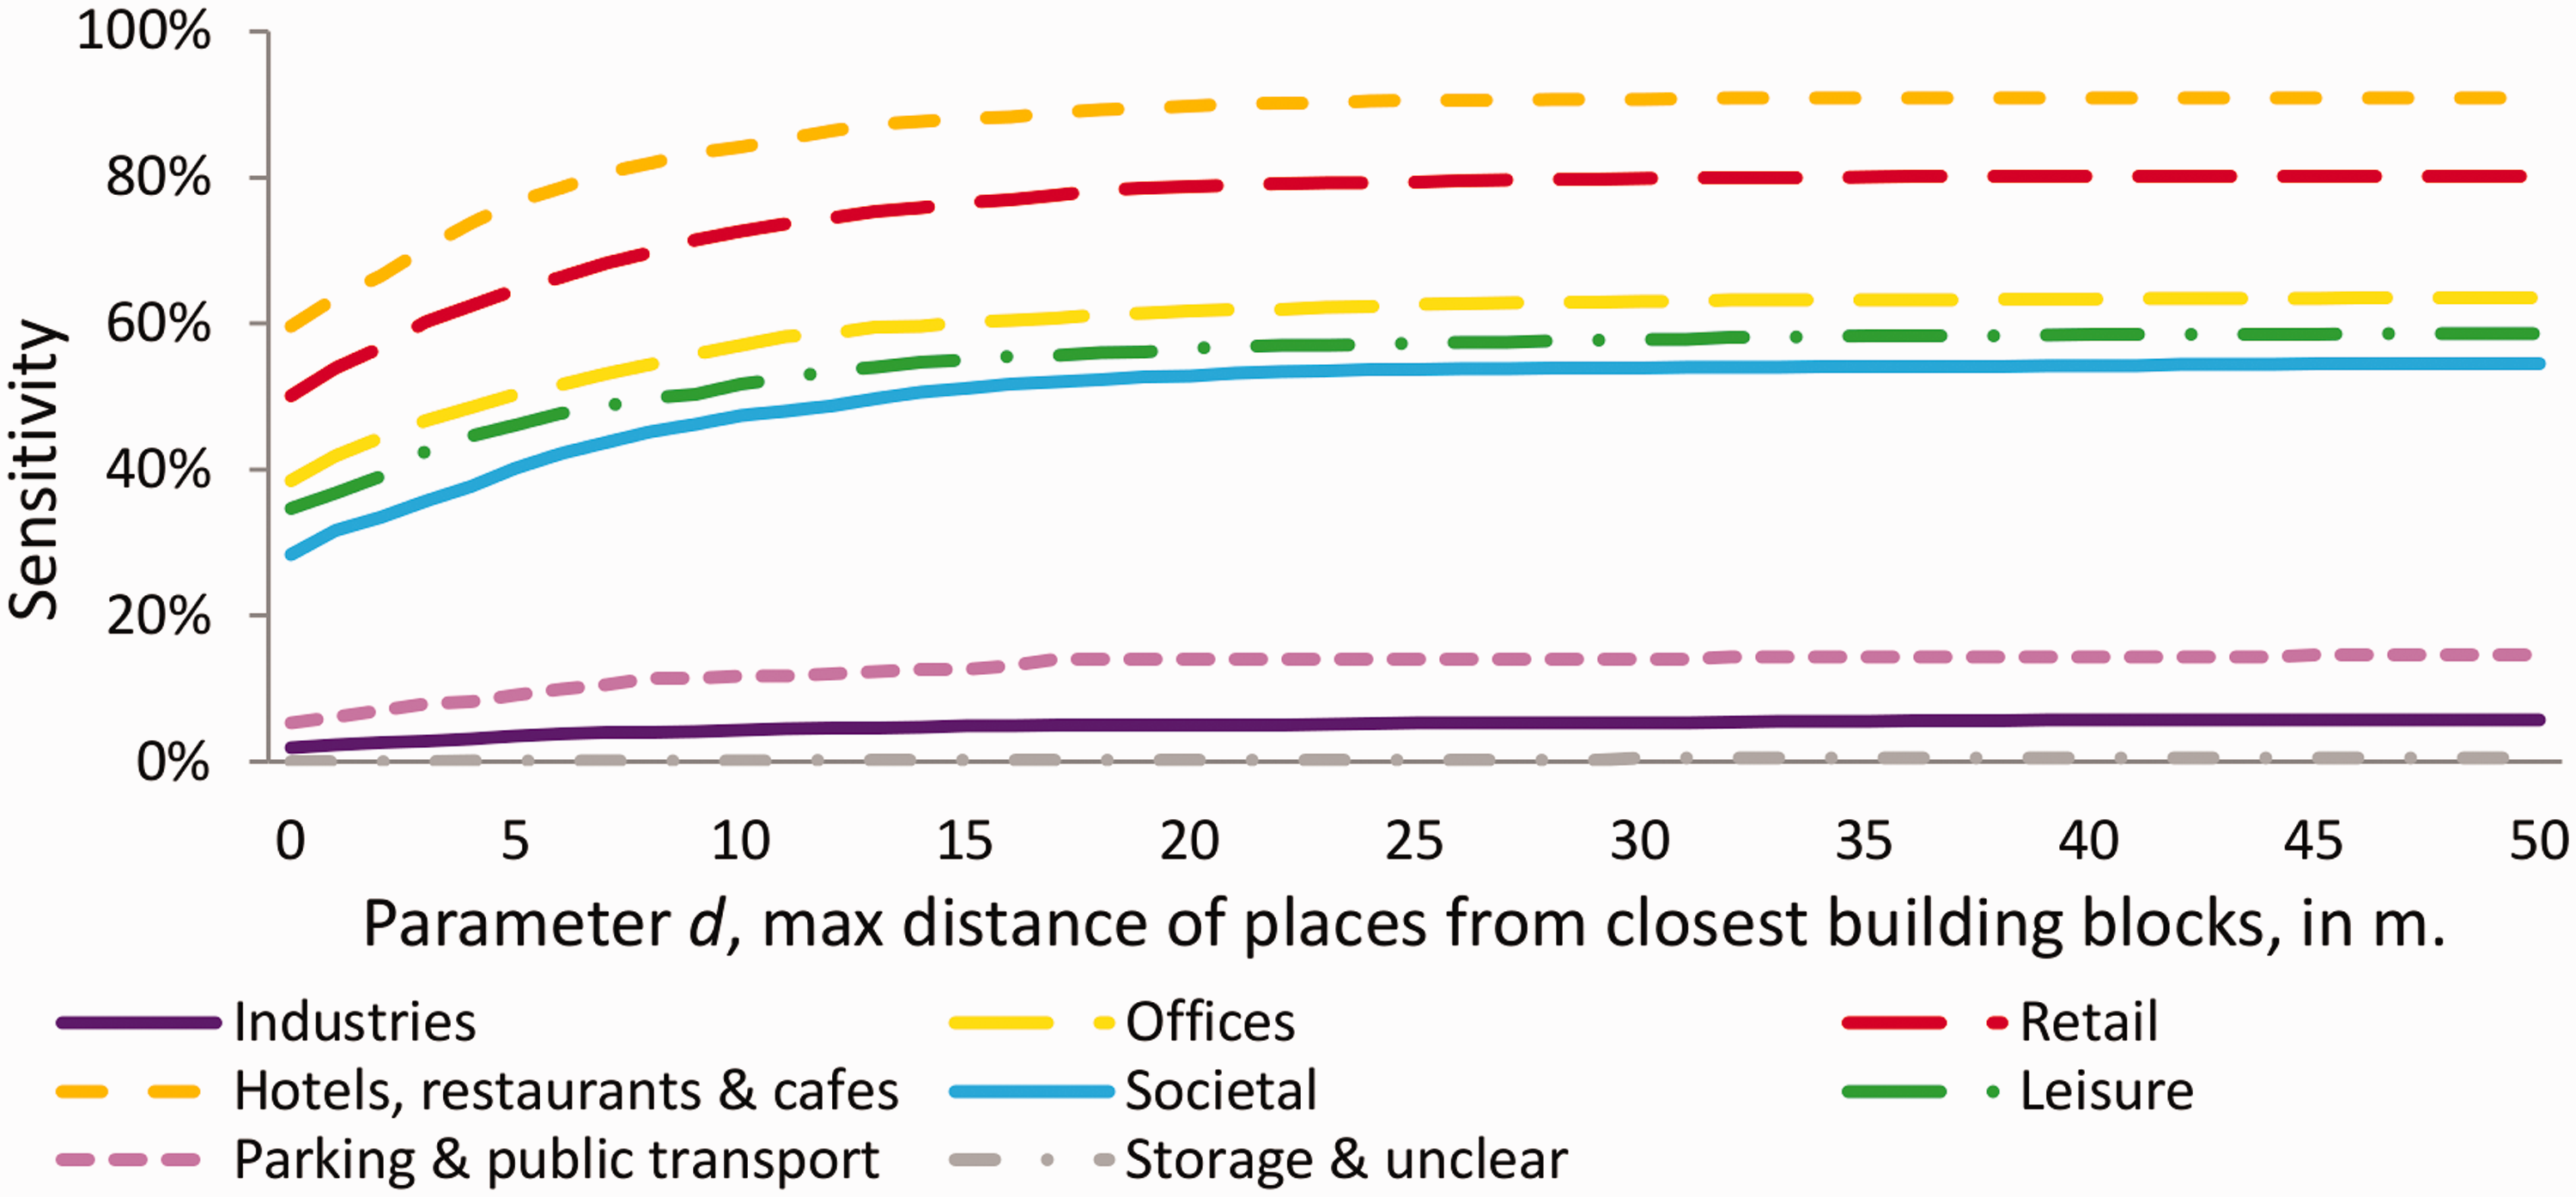
As shown in Figures 13 and 14, the precision and the sensitivity of the eight LU categories vary according to the value of parameter d. The sensitivity, for each of the eight LU categories, is increasing as the d distance is increasing up to the optimal d value. This is because more Foursquare places are assigned to building blocks, and thus more building blocks are estimated as having nonresidential LU. Consequently, the probability that a building block with one or more nonresidential LU in the reference dataset is being correctly identified in the estimated dataset is increasing. Inversely, when the d distance value is increasing, the precision of the detection of the 8 nonresidential LU are slightly decreasing. This is because, as shown in Figure 7, when we take into consideration places that are far from building blocks, the probability that these places are positionally accurate is decreasing.
Precision per LU category of the estimated BBU dataset calculated using the parameter values d = (0–50 m) and c = 0. Sensitivity per LU category of the estimated BBU dataset calculated using the parameter values d = (0–50 m) and c = 0.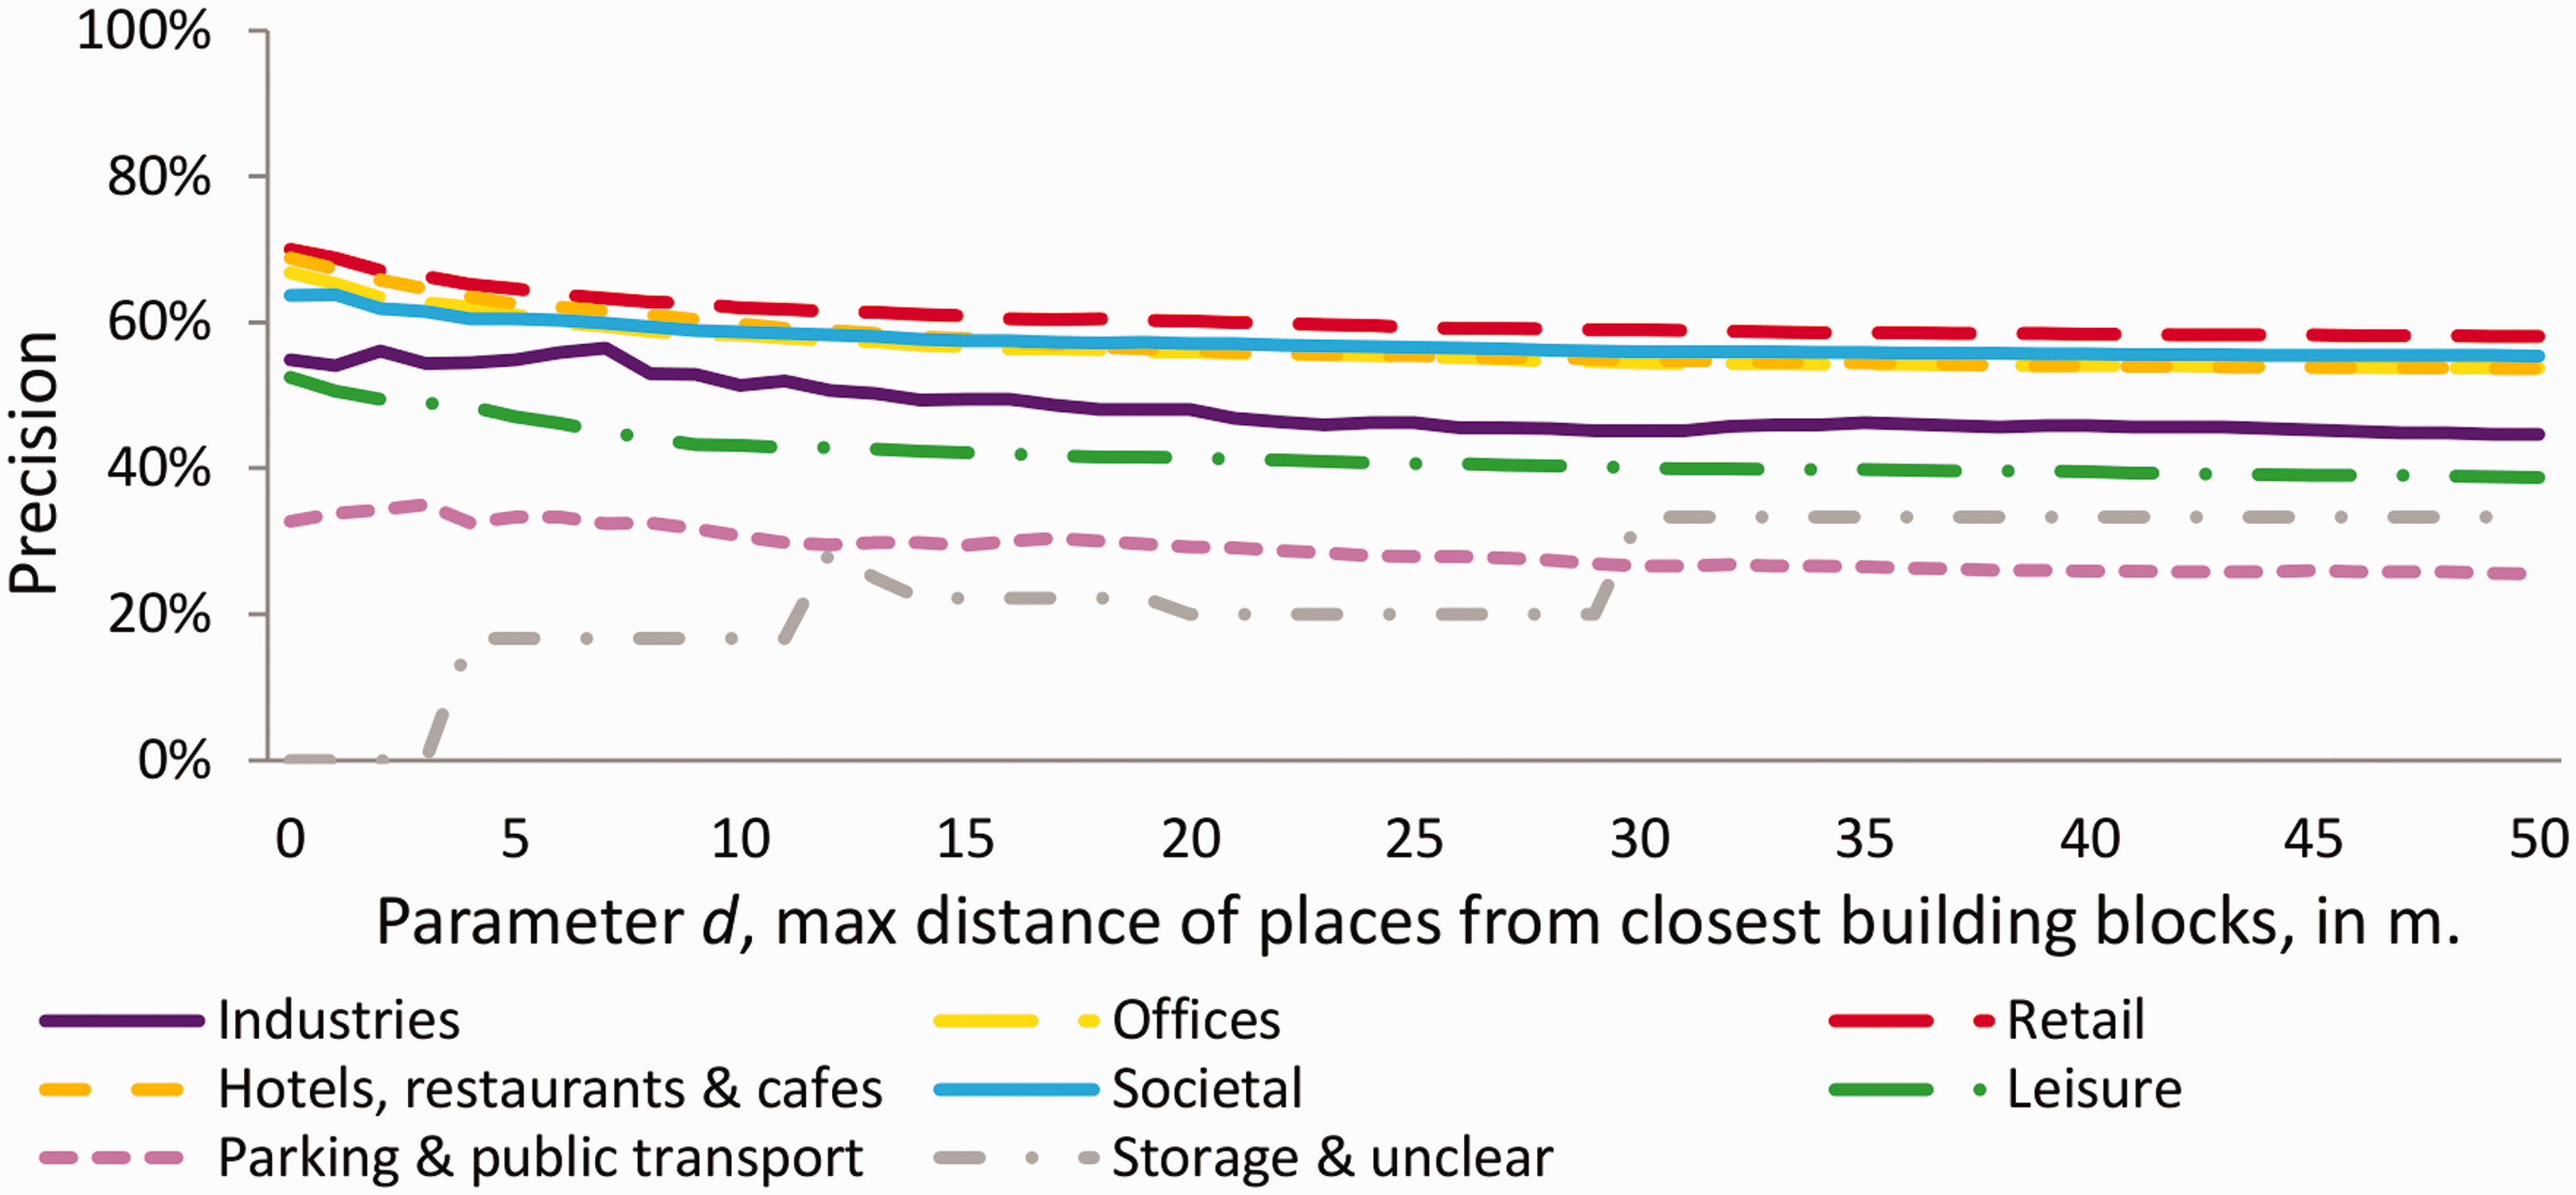
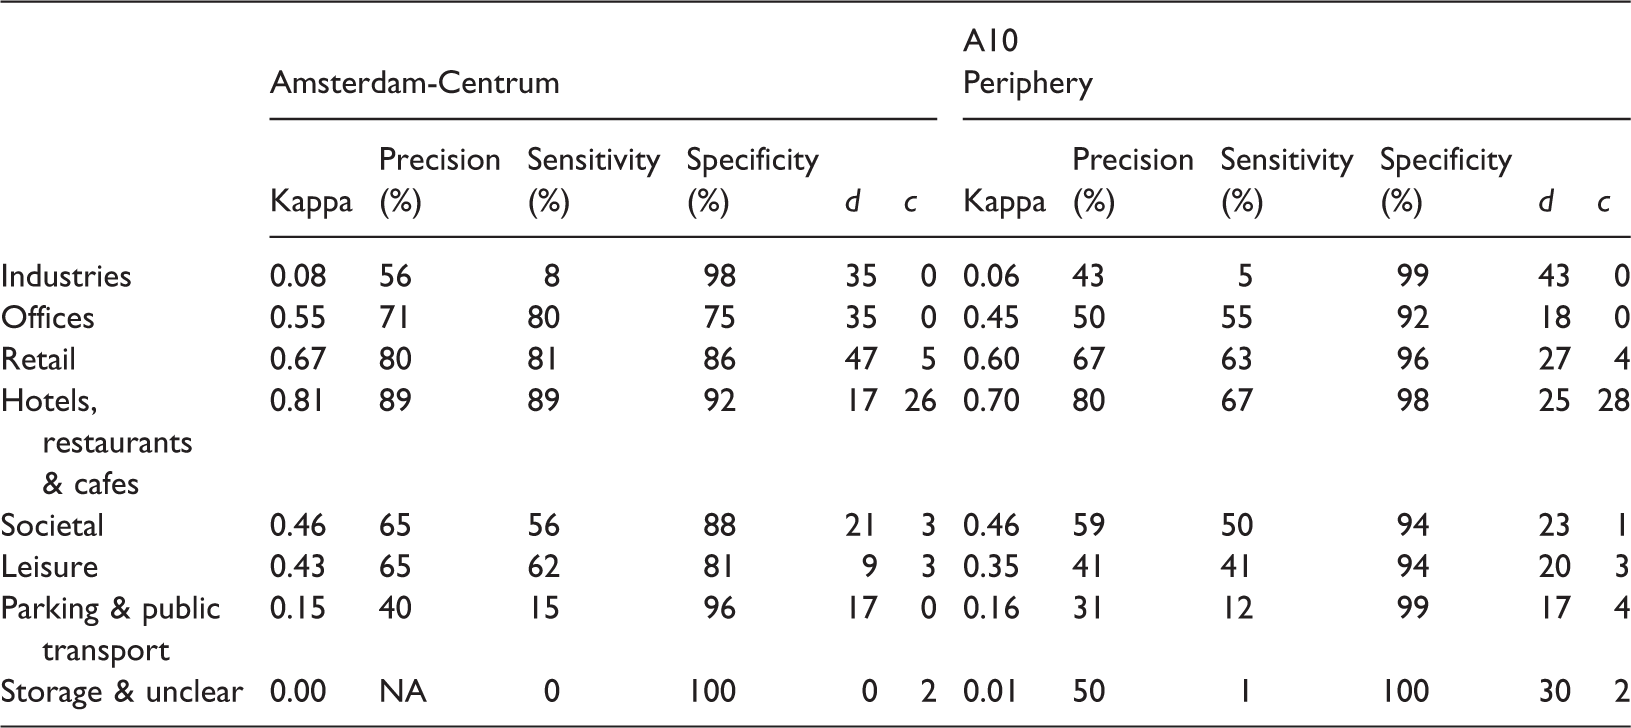
Spatial variation of the accuracy results
Best accuracy results for the two subareas of the Amsterdam case study.
Density of “retail” and “hotels, restaurants and cafes” LU
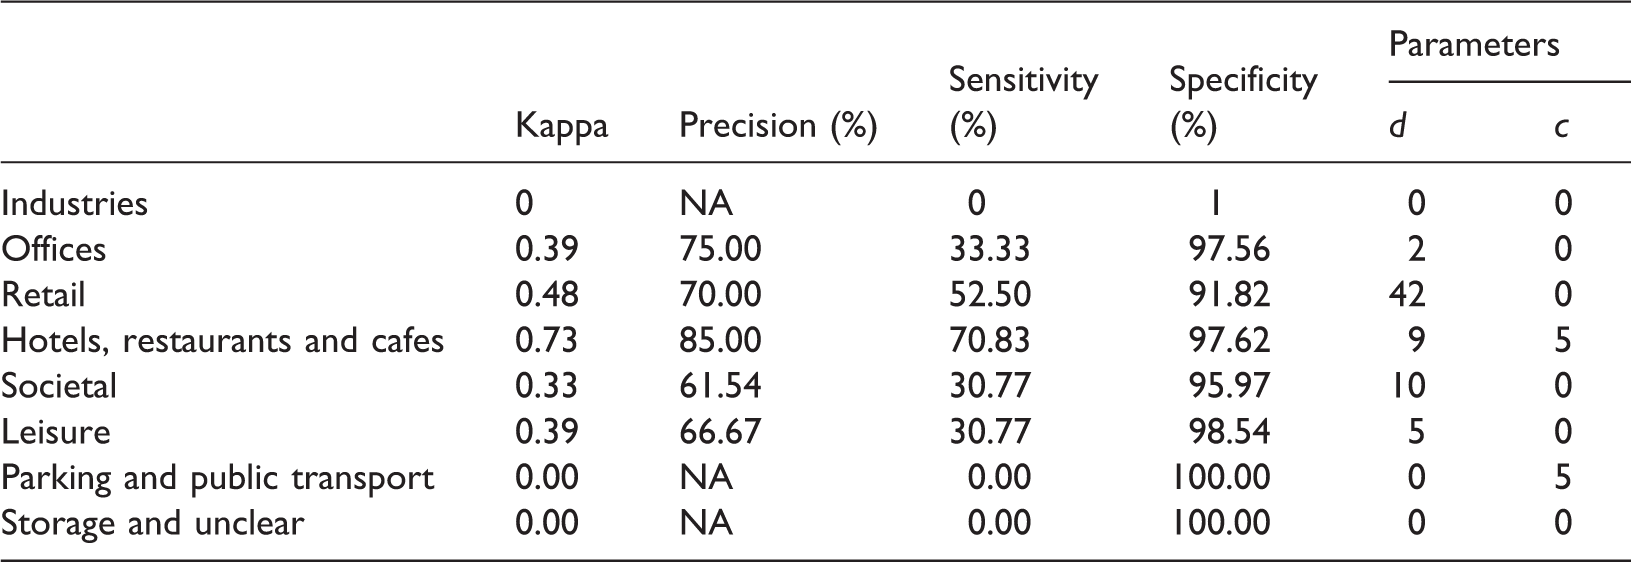
In this section, we analyze the density of places that belong to the two LU categories, for which we had robust estimations, the “retail” and the “hotels, restaurants and cafes.” As shown in Figure 15, a linear regression analysis was performed in order to assess whether the number of Foursquare places Linear regression plots between the number of places of the best estimated BBU dataset and the number of surfaces in the reference BBU dataset of each building block for the LU categories “hotels, restaurants and cafes” and “retail.” The number of building blocks for each combination of estimated places and reference surfaces is presented in logarithmic scale. Accuracy assessment results of the Varese case study.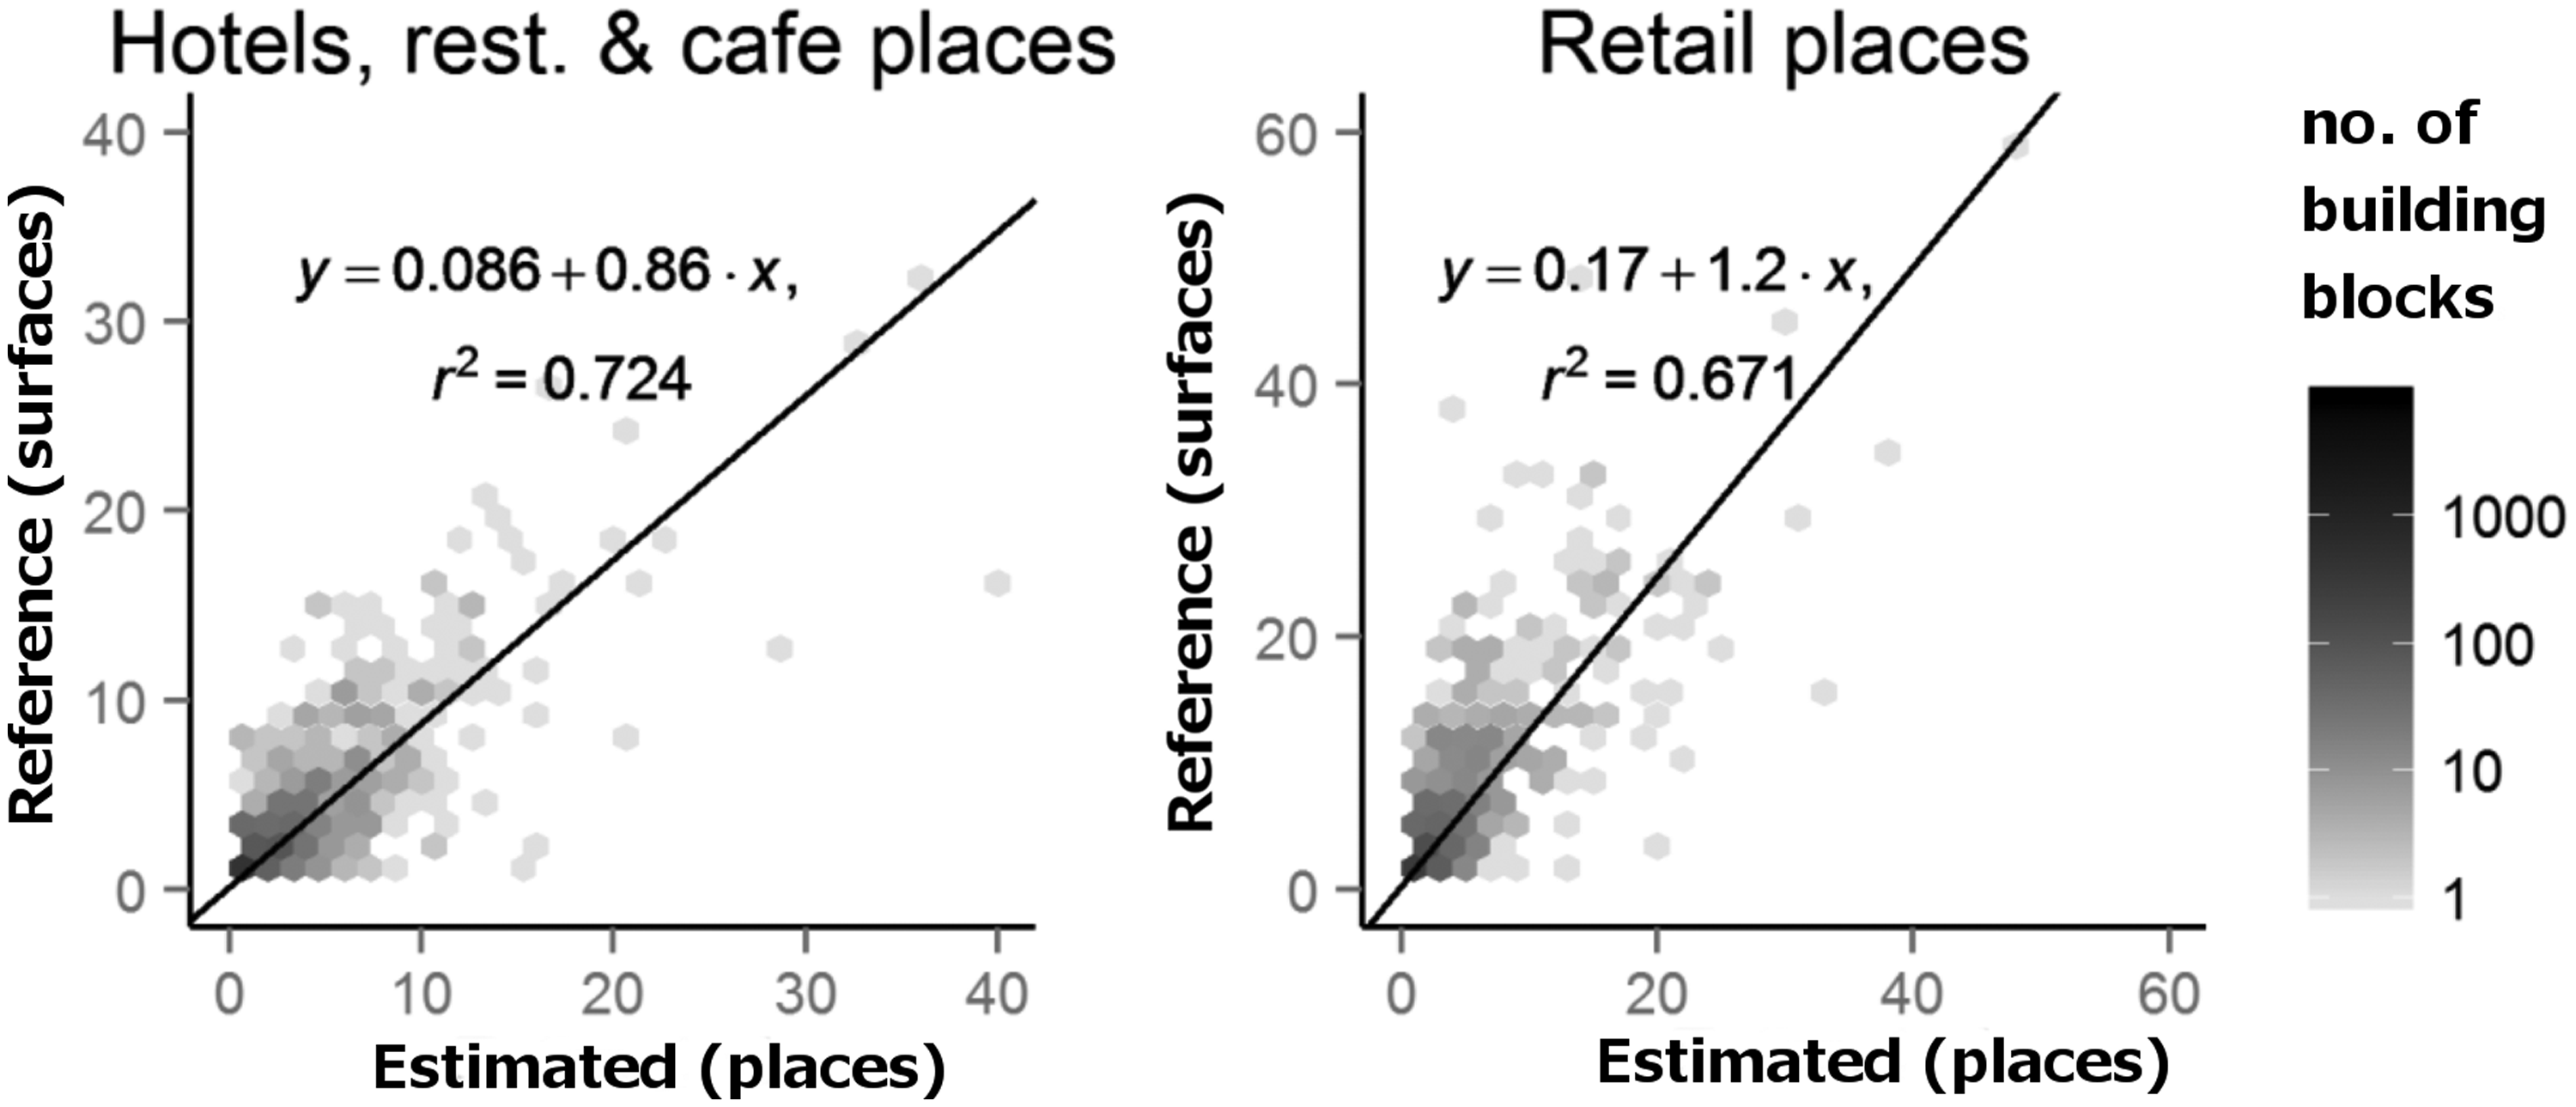
Reproducibility of the proposed methodology
In this section, we assess whether and how the proposed methodology can be applied to other urban environments. For that purpose, we repeated the proposed methodology in the city of Varese, in Italy (see Assessment of the methodology in the city of Varese, Italy section), and we describe a method for selecting appropriate d and c parameter values in the Selection of appropriate parameter values section.
Assessment of the methodology in the city of Varese, Italy
To test the reproducibility of the proposed methodology, we repeated the study in the city of Varese, in Italy. Compared to the city of Amsterdam, the city of Varese has a different urban morphology and almost 10 times less population. The estimated BBU datasets of Varese were produced using the same methodology as the ones used for the Amsterdam case study. The accuracy assessment of the BBU estimations was performed on 150 randomly selected building blocks of the study area, which are shown in Figure 16. The reference LU data for these 150 building blocks was collected through a ground survey. For the collection of the ground survey data, we recorded both the uses that were visible at the exterior of the buildings and the uses described in the mailboxes and doorbells of the buildings. Both the ground survey and the Foursquare place data collection took place in the same time period, July 2015.
Varese case study area. The 150 randomly selected building blocks that were used for the accuracy assessment are highlighted in dark grey within the designated study area.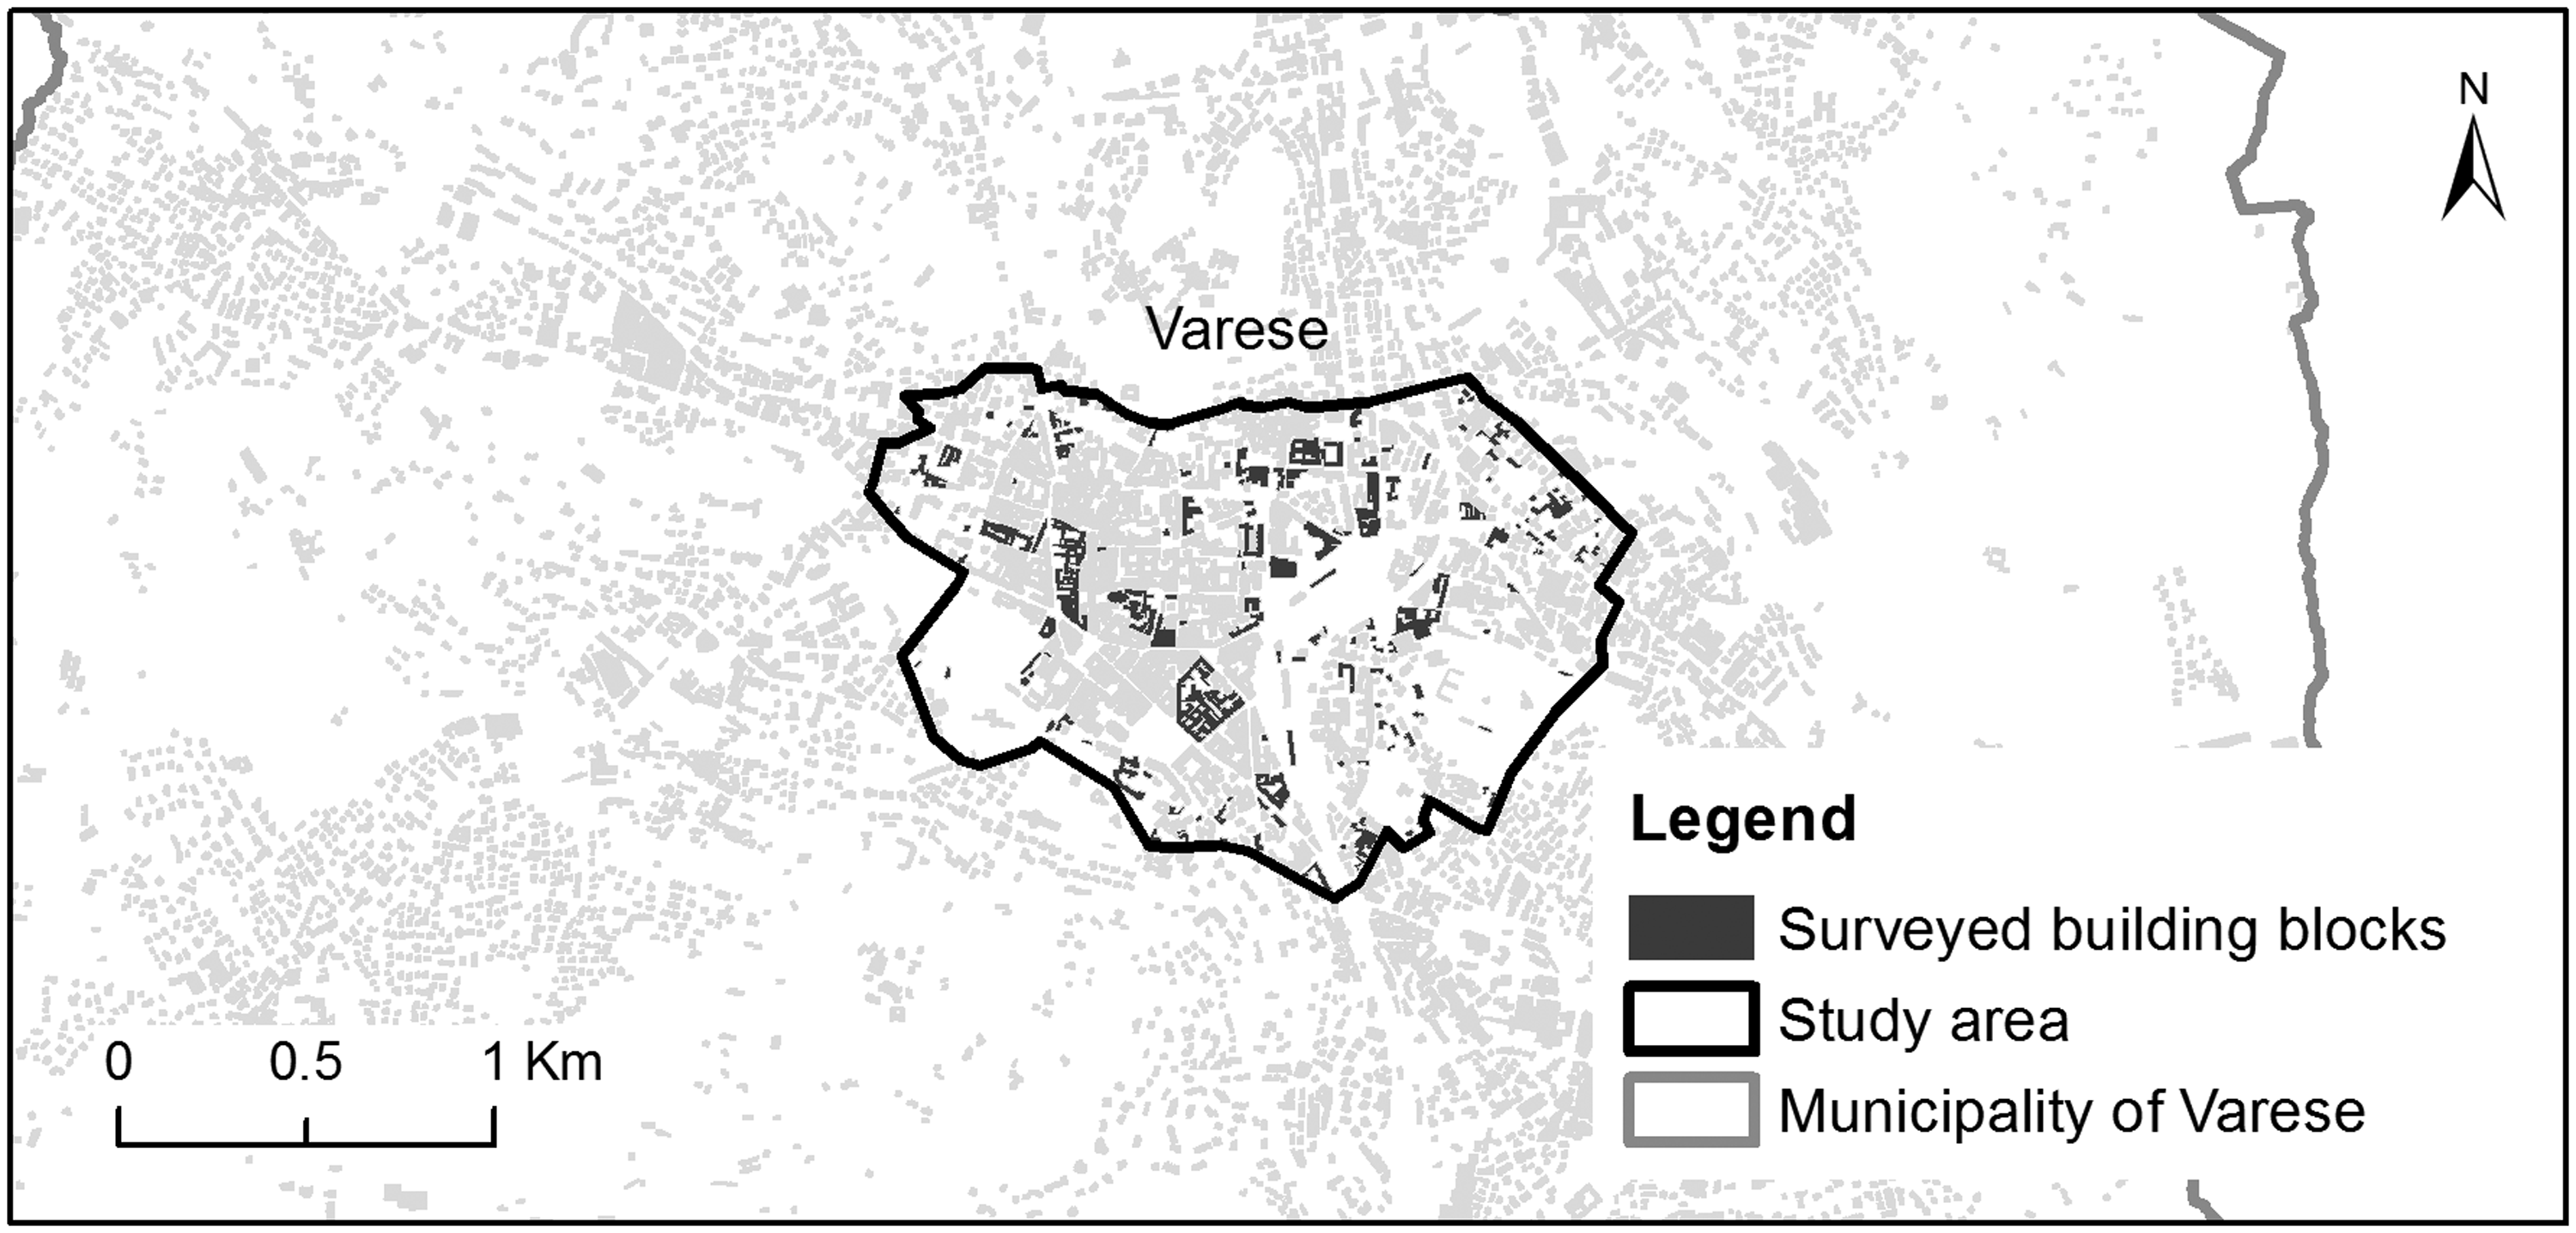
The results of the accuracy assessment are presented in Table 5. Compared to the Amsterdam case study, the kappa coefficient values for the “hotels, restaurants and cafes” LU category is 0.76 in Amsterdam and 0.73 in Varese. For the “retail” LU category, the kappa coefficient values are 0.65 in Amsterdam and only 0.48 in Varese. The Kappa coefficient values are lower in the Varese case study for the aforementioned LU categories, due to their lower sensitivity. The low sensitivity demonstrates that there is an absence of Foursquare place data in Varese. This absence of place data has as result low c parameter values, since the lower the c value is, the more Foursquare place data are included in the analysis. The parameter d varies significantly across the LU categories.
Selection of appropriate parameter values
As revealed from the accuracy assessment results, the selection of the appropriate parameter values d and c is crucial for optimal accuracy results. The selection of these values depends on the purpose of the application and is a trade-off between data quality and data quantity. In this study, the kappa coefficient was used for the determination of the optimal parameter values. The optimal sets of parameter values for each LU are not consistent across the Amsterdam and Varese case studies, since they are affected by the local characteristics of the case study area (e.g., urban morphology) and the characteristics of the Foursquare dataset in that area (e.g., number of Foursquare users). For d parameter values of 20 m or more, the number of Foursquare places, the kappa coefficient value, the precision, and the sensitivity of the estimation in the Amsterdam case study, remain almost stable (Figures 7, 11, 13 and 14). As a result, the precise d parameter value as long as it is higher than 20 m, does not have any considerable effect on the accuracy of the estimations, and thus as a general guidance we suggest a fixed d value of 25 m for all the LU categories. On the contrary, for optimal accuracy results, the c parameter value needs to be chosen separately for each LU category. For the selection of the c value, a calibration is suggested. Such a calibration can be performed by the application of the methodology in a sample of 5% of randomly selected building blocks of the study area, for which there is ground truth data. The optimal parameter values that have been found in the accuracy assessment phase of the sample can then be applied to the whole case study area. To test whether that calibration method is valid, we generated 20 estimated BBU datasets using c parameter values as is specified in the 20 different calibrations and a fixed d parameter value d = 25. Figure 17 shows that the majority of the 20 estimated BBU datasets that were produced using the calibration method had, when compared to the reference BBU dataset, kappa coefficient values slightly lower than the BBU dataset that was estimated using the optimal parameter values.
The kappa coefficient value of the BBU datasets that was estimated using parameter values d = 25 and c as defined by calibrations on 20 randomly selected samples of the Amsterdam case study.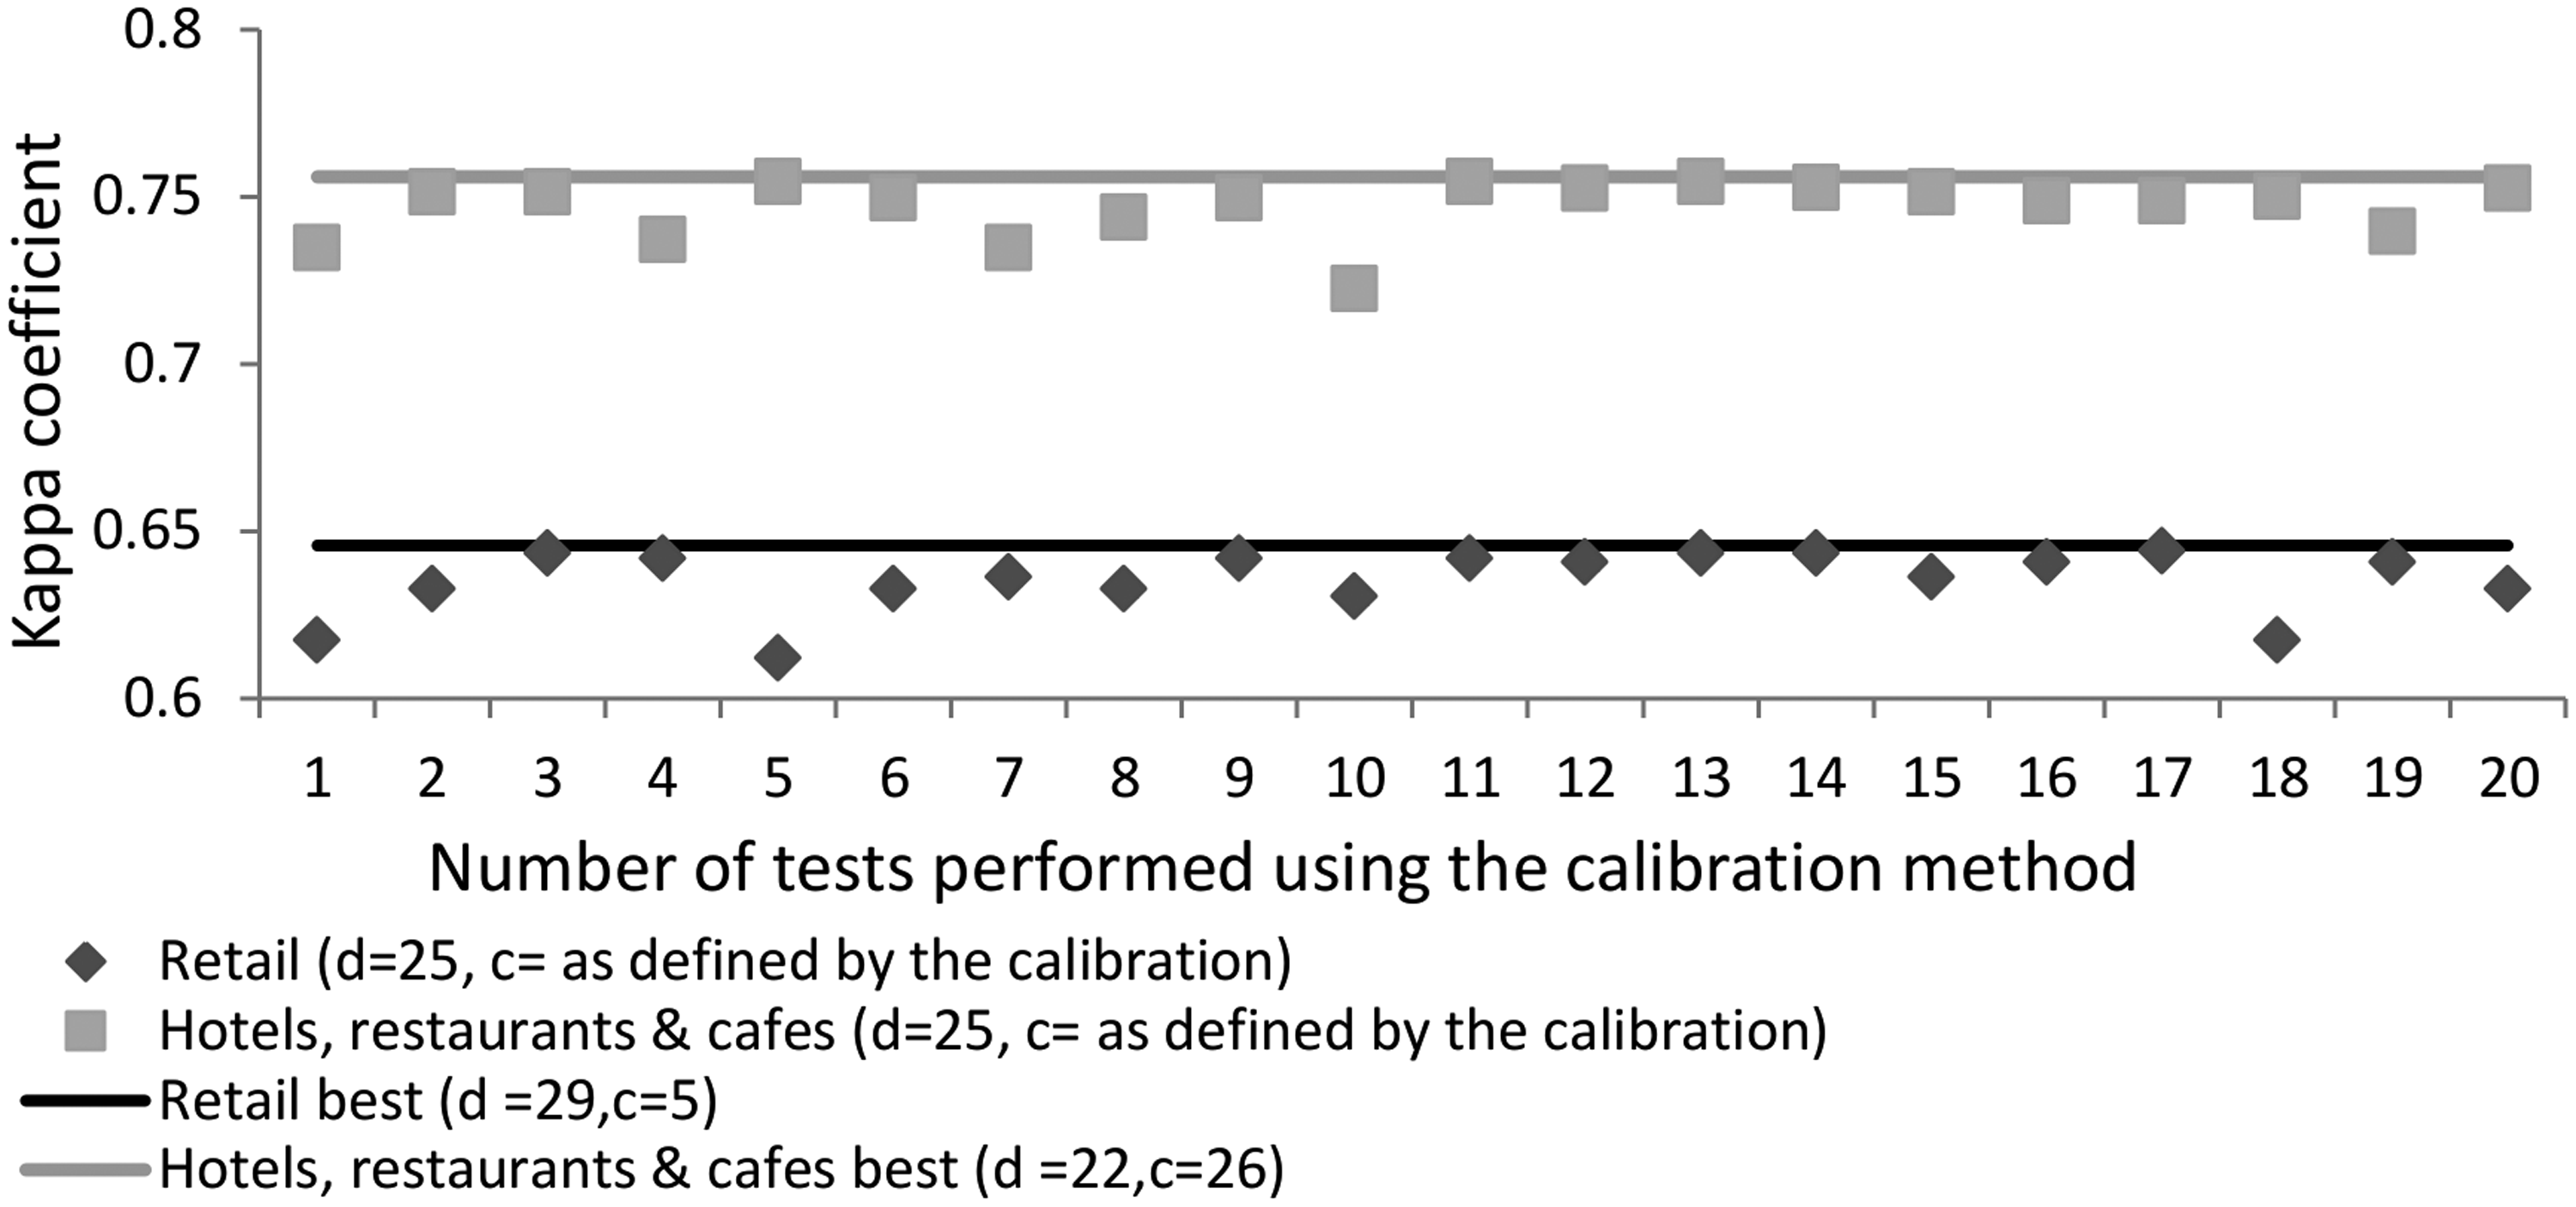
Discussion
There is an important difference between the estimated BBU dataset and the reference BBU dataset. Since the estimated BBU dataset is constructed using place data, it reflects how space is experienced and subjectively perceived by the Foursquare users. The reference BBU dataset reflects how space is observed by the LU surveyors. According to Tuan (1979: 389) “the space that we perceive and construct, the space that provides cues for our behaviour, varies with the individual and cultural group.” For example, the Starbucks stores are perceived by the majority of their users as coffee shops, but some individuals experience them as co-working spaces. The variety of how people perceive and experience space is potentially expressed in the place datasets but not in traditional LU surveys that do not involve the space users through questionnaires or interviews.
Apart from the above-described conceptual difference of the reference and estimated BBU datasets, their comparison led in a series of interesting scientific results. As an outcome of the accuracy assessments, using the proposed methodology we identified with high confidence the urban building blocks of the case study areas with at least one “retail” or “hotels, restaurants and cafes” use. On the contrary, our methodology failed to reliably identify building blocks with “industries,” “storage and unclear” or “parking and public transport” use. The reason for the low identification rate of some LU categories (Table 3) is that many Foursquare places that belong to these categories are missing from the Foursquare place dataset. The completeness of the Foursquare place dataset varies depending on the LU category (Figure 5), since the Foursquare users, who are mostly young smartphone owners (Zickuhr, 2013), decide independently about which places, of what type and from which area, they will add in the Foursquare dataset. Therefore, recreational and commercial places, which are the places of the Foursquare users’ main interest, are better represented in the Foursquare place dataset compared to other types of places.
In addition to the above-described limitation of the Foursquare place dataset, as shown in Figure 7, the positional accuracy of the Foursquare places’ location is low. Many places are falsely described to be located in other building blocks or close to building blocks they belong but not inside their footprint (Figure 6). As it is also valid in general for crowd-sourced data, the positional and thematic accuracy of the Foursquare place data is not assured and in-situ controlled through an established quality assurance and quality control mechanism. The resolution of errors in the description and the location of places rely on the willingness of Foursquare users, who might also not possess the required scientific and technical skills for describing the category and the location of a place accurately, or who might experience space in different ways. Apart from the characteristics of the Foursquare place dataset, the accuracy results of the Amsterdam case study are negatively affected by limitations introduced from the use of the nonresidential use dataset as a reference. These limitations include: (a) the fact that the LU survey was limited to the exterior of the buildings; (b) the fact that the nonresidential use dataset is outdated in some areas; and (c) the fact that the “storage and unclear” category includes, under a single nondifferentiable category, surfaces that have storage, unclear, or no use.
Conclusions
In this study, we evaluated the use of Foursquare places for estimating the use of urban building blocks. The main case study has been conducted in the city of Amsterdam, and an additional one has been conducted in the city of Varese, Italy. Based on Foursquare place data, and particularly on the type of these places (like, for example, offices), we assigned to each building block LU categories that describe the types of the activities that are hosted in it. For the estimation of the LU categories of each building block, two parameters were used. These are the distance between a Foursquare place and its nearest building block, and the number of Foursquare users that have checked in a Foursquare place. The distance was used in order to geometrically allocate places to their nearest building blocks, and the number of checked in users in order to assess whether a Foursquare place is accurately described. The estimated BBU dataset, which represents how Foursquare users experience space, has been compared to the reference BBU dataset which represents how LU surveyors observe space.
Our evaluation metric is the kappa coefficient, which determines if the classification results are significantly better than a random result (Congalton, 1991). Among the accuracy assessment outcomes, for both the Amsterdam and Varese case studies, the highest kappa coefficient values were achieved for the individual LU categories “hotels, restaurants and cafes” and “retail.” This is because places of the above two categories are well represented in the Foursquare place dataset, since these places are of the Foursquare users main interest. On the contrary, the methodology failed to identify building blocks with “industries,” “storage and unclear,” and “parking and public transport” use. This is because for the above three LU categories many places are missing from the Foursquare dataset.
The proposed methodology can be used for the generation of up-to-date, low cost, and globally harmonized datasets about urban building blocks with “hotels, restaurants and cafes” or “retail” LU. In the near future, technological and social developments are expected to increase the quality of citizen-contributed data. The increased educational attainment, the diffusion of smartphone devices and the emergence of indoor position systems are expected to further increase the use of location-based social media applications and the precision of citizen-contributed data. In our future work, we will examine the use of other datasets, such as business directories, with an aim to improve the identification rate of LU categories that are underrepresented in the Foursquare place dataset.
Footnotes
Acknowledgments
We would like to thank Massimo Craglia, Sven Schade, Elena Roglia, Chris Jacobs-Crisioni, Henk Scholten the editor and two anonymous reviewers for their valuable comments and suggestions. Additionally we thank Klaas-Bindert de Haan for supporting us regarding the nonresidential use dataset of Amsterdam.
Declaration of conflicting interests
The author(s) declared no potential conflicts of interest with respect to the research, authorship, and/or publication of this article.
Funding
The author(s) declared the following potential conflicts of interest with respect to the research, authorship, and/or publication of this article:This research has been supported through a Ph.D. research grant of the Joint Research Centre of the European Commission.