
Abstract
Previous research has established the essential role of aural lexical knowledge (ALK) in second language (L2) listening comprehension; however, from a measurement perspective, it remains underexplored how best to measure ALK and which word frequency bands show the strongest predictive power for L2 listening comprehension. This study examines the effectiveness of three item formats in an aural vocabulary test (Yes/No, first language meaning-recall, or meaning-recognition) in predicting variance in L2 listening comprehension among 176 English as a Foreign Language (EFL) learners. Following a vocabulary levels test (VLT) format, 300 words representing the first 5000 flemmas of a television and movie transcript-based word frequency list were tested across the three item formats. The results indicated that the meaning-recall VLT was significantly more difficult than the Yes/No and meaning-recognition formats. Overall scores for all three tests significantly correlated with scores on a standardized L2 English listening comprehension test (TOEIC®), with the strongest correlations observed for the meaning-recall (r = .63) and recognition formats (r = .65). The vocabulary bands that provide significant predictive power across each format are identified, and implications for language teachers and vocabulary knowledge testing are discussed.
Keywords
Introduction
The essential role of lexical knowledge in second language (L2) listening comprehension is well established in the research literature (e.g., Vafaee & Suzuki, 2020; Vandergrift & Baker, 2015; Wallace, 2022). However, despite this strong empirical foundation, a more nuanced understanding of which specific dimensions of lexical knowledge are most closely associated with L2 listening comprehension and how these dimensions can be reliably assessed remains necessary (McLean et al., 2024; Uchihara et al., 2024). In Nation’s (2022) lexical knowledge framework, he highlights (p. 87) that one of the most valuable aspects of lexical knowledge for an L2 learner is the receptive capacity to map an L2 word to its corresponding first language (L1) meaning—the form–meaning link. Nation’s framework and related research (e.g., Cheng & Matthews, 2018; Milton & Hopkins, 2006; van Zeeland, 2013) make clear that receptive vocabulary knowledge mediated through the aural modality (i.e., while listening) is a distinct construct from that mediated through the written modality (i.e., while reading). The current study concerns the former and will focus on evaluating knowledge of the form–meaning link mediated through the aural modality. Different terminology has been used to define this dimension of lexical knowledge, such as spoken receptive vocabulary knowledge and phonological word knowledge, but the current study adopts the term aural lexical knowledge (ALK). ALK, according to McLean et al. (2024, p. 148), represents an L2 learner’s capacity to “map the phonological shape of words encoded in fluent speech onto an appropriate semantic representation (meaning).”
Drawing on connectionist theories of L2 acquisition (e.g., Ellis, 1996), ALK is built on learners’ capacity to register and store phonological, lexical, and grammatical sequences in a manner that reflects their frequency of occurrence in the target language. Second language acquisition is primarily driven by input, with learners gradually acquiring new word knowledge and extracting underlying patterns that eventually emerge as rules (Ellis, 2002). If the acquisition of ALK is driven by exposure to L2 input, it is therefore essential that L2 teachers have the tools to select aural input appropriately matched to their learners’ ALK development. Lexically appropriate listening materials, often defined as meaning-focused input, are input where (1) only a very small proportion of the words in the text are unfamiliar to learners, and (2) the listening or viewing content is familiar and interesting to learners (Nation, 2007). Two tools central to selecting lexically appropriate listening materials are vocabulary levels tests (VLTs) and lexical profilers (McLean, 2021). Importantly, VLTs assess knowledge mastery across the highest-frequency 1000-word (1K, 2K, 3K, etc.) bands, while a lexical profiler examines the proportion of high-, mid-, and low-frequency words in a prospective text. The current study concerns the first of these tools, VLTs, specifically. It aims to identify which item format for an aural VLT best predicts L2 listening comprehension: Yes/No, meaning-recall, and meaning-recognition. Earlier evaluations of written receptive lexical knowledge have clarified the unique predictive capacities of the different VLT item formats for L2 reading comprehension (e.g., McLean et al., 2020; Stewart et al., 2024; Zhang & Zhang, 2022). Less is known, however, about VLTs’ capacity to measure ALK and the predictive capacity of different item formats for listening comprehension. A secondary objective of this study is to examine the long-standing use of VLTs to assess lexical mastery in 1000-word (1K) bands, particularly whether the predictive capacities of 500-word (5C) band size significantly differ from the traditional 1K bands. Answers to these questions will provide valuable information for language testers, teachers, and researchers interested in evaluating ALK.
Currently, the only validated VLT targeting ALK is the meaning-recognition or multiple-choice listening vocabulary levels test (LVLT) (McLean et al., 2015). The LVLT assesses mastery of the first 5000-word families (five bands of 1000 words—1K–5K) from Nation’s (2012) British National Corpus (BNC)/Corpus of Contemporary American English (COCA)—BNC/COCA word list. Despite showing a medium correlation with L2 listening comprehension, (r = .52, p < .001; McLean et al., 2015), several elements of the LVLT’s design have come under scrutiny in recent research. These include (1) its meaning-recognition format, (2) the word frequency lists used to sample test items, (3) the word-counting unit, and (4) item sampling from 1000-word–1K vocabulary bands. It is argued that each element can independently or collectively contribute to overestimating lexical knowledge (Kim et al., 2023; Gyllstad et al., 2021; Kremmel, 2016; Stewart, et al., 2021; Stoeckel et al., 2021). Knowledge overestimation is a serious concern for classroom teachers using a VLT to help pair their learners with lexically appropriate listening materials. Overestimated lexical mastery would prompt language teachers to select listening texts that are too difficult (i.e., a text containing too many unknown words), which limits comprehension and learners’ capacity to learn from the input. Reviewing several of these perceived design limitations, the current study seeks to clarify which item format and band sizes provide teachers with the most reliable assessment of English as a Foreign Language (EFL) learners’ functional ALK.
Literature review
Tests of ALK
Several tests have been developed to measure L2 learners’ knowledge of the form–meaning link for words presented in the aural modality (ALK). This section will examine three specific test item formats—Yes/No, L1 meaning-recall, and meaning-recognition —each of which will be discussed in detail over the following paragraphs.
The Yes/No test format has been used in several research projects (e.g., Masrai, 2022a; Milton et al., 2010), with one notable example of this format being the Aural-Lex (Milton & Hopkins, 2006), which is a computer-delivered vocabulary size test (estimate of total word knowledge) aimed at assessing knowledge of the most frequently occurring 5000 English lemmas. Test takers play the target word as often as needed before confirming whether they know (“Yes”) or do not know (“No”) the L2 word. There are 20 randomly selected words from each 1000-word frequency band and 20 pseudowords, implemented as a control for guessing or overestimating word knowledge across each band. The number of “Yes” responses to these pseudowords facilitates a score correction on the real words. Although the Yes/No format is easy to create and efficient in assessing many words per band (Masrai, 2022b), the item format has been criticized for emphasizing recognition of word forms while not directly capturing test takers’ capacity to connect those forms to their meanings (e.g., Read, 2000; Stewart et al., 2024). In a recent study by Masrai (2022a), Aural-Lex showed a medium to strong correlation (r = .59) with IELTS listening test scores among Arabic-speaking English learners. However, in Masrai’s hierarchical regression model, the Aural-Lex accounted for only a trivial amount of variance in L2 listening comprehension (R² = 1.3%) when added to scores from a spoken form recall test (R² = 54%).
Uchihara et al. (2024) evaluated the predictive capacity of three item formats for measuring ALK: (1) a lexicosemantic judgment task (LJT), (2) meaning-recognition, and (3) meaning-recall. They found that all three item formats combined explained 58% of the variance in listening comprehension, with the LJT explaining the most variance (R2 = 29%), followed by meaning-recall (R2 = 17%). meaning-recognition was not a significant predictor. The authors selected 80 Word Families from a TOEIC® listening test script that would pose lexical and phonological difficulty to Japanese learners. Therefore, all tests are not modeled on VLTs and cannot be used to match learners with lexically appropriate materials. Notwithstanding this methodological difference, Uchihara et al. found that an aural, meaning-recall format explained greater variance (28.95%) in listening comprehension than an aural, meaning-recognition format (21.09%).
The LVLT, developed by McLean et al. (2015), is a meaning-recognition test evaluating mastery of the first five 1000-Word Family bands (i.e., 1K, 2K, 3K, etc.) of Nation’s (2012) BNC/COCA Word Family list. Across each band of 1000-Word Families, 24 items are used to estimate mastery. The test format requires test takers to listen to the target English word in isolation, and then the target word is articulated as part of a non-defining contextual sentence. After hearing the prompt, test takers select the L1 definition closest to the target English word from a list of four options (written in learners’ L1). In their test validation with a sample of university-aged Japanese EFL learners, McLean et al. reported that LVLT scores had a medium correlation with participants’ scores on the first two sections of the TOEIC listening test (r = .52, p < .001).
Concerns relating to VLT design
Recently, various approaches to VLT design have faced tighter scrutiny (e.g., Kremmel, 2016; Stoeckel et al., 2021), raising concerns about their accuracy as a tool for matching L2 learners with suitable listening or viewing materials. The first concern is that, in past studies, the word frequency list used for item sampling has typically not aligned with the target language use domain. The LVLT and the tests developed by Uchihara et al. (2024), for example, utilized the BNC/COCA word list. Although the BNC/COCA is a common list used in L2 teaching, it is neither a list of the most frequently spoken word families nor the most accurate reflection of the words EFL learners typically know (Pinchbeck et al., 2022). According to Nation (2017a), only the first 2K bands of the BNC/COCA were informed by spoken word frequency data (e.g., television transcripts and radio interviews), while all other frequency bands were derived from a primarily written corpus. Furthermore, words in the BNC/COCA are ranked not only by frequency but also by range (i.e., how widely a word appears across different text types) and by subjective judgments regarding their overall utility in language use. Therefore, although the BNC/COCA is helpful as a pedagogical word list, it does not systematically represent the word knowledge fundamental to listening comprehension.
Second, many VLTs rely on word families as the basis for counting words, which several experts have cautioned could lead to an overestimation of lexical knowledge (e.g., Brown, 2018; Kim et al., 2023; Matthews et al., 2023; Stoeckel et al., 2021). The Word Family unit does not distinguish a word’s part of speech and typically encompasses a base word, its inflections, and derivational forms, following Bauer and Nation’s (1993) Level 6 affix criteria. The Word Family for watch in Nation’s (2017b) BNC/COCA Word Family list, for example, includes the base word, watch; its inflections, watches, watched, and watching; and the derivational forms watcher, watchers, watchful, watchfully, and watchfulness, among others. In a VLT, learners are generally assessed on the base form of a Word Family, with a correct response assumed to indicate knowledge of the entire group (Stoeckel et al., 2021). Because research from various L2 English learning contexts has shown that knowledge of a base word can often be a poor indicator of knowledge of its derivational forms (e.g., Kim et al., 2023; Milliner et al., 2024; Stoeckel et al., 2024), systemic overestimation of lexical knowledge in VLTs on account of the Word Family unit has been noted in several recent commentaries (e.g., Brown et al., 2021; Kremmel, 2016; Stoeckel et al., 2021). Accordingly, these researchers advocate for using lemma or flemma-based VLTs for all learners who have not mastered derivational morphology, as they do not infer knowledge of derivational forms (e.g., Brown et al., 2022; Kremmel, 2016).
Recent research has also questioned the reliability of inferences derived from VLTs using a meaning-recognition or multiple-choice format. As opposed to a meaning-recall format where test takers provide an L1 translation of the L2 form, guessing has been shown to exert a demonstrable influence on test scores (e.g., Stewart, 2014; Stewart & White, 2011), and students may use construct-irrelevant test-taking strategies (e.g., Gyllstad et al., 2015; Kremmel & Schmitt, 2016; Stoeckel & Sukigara, 2018). Another argument against the meaning-recognition format concerns its construct validity. While listening, learners do not have access to an explicit orthographic representation of possible words to map onto candidates in their mental lexicon, nor do they have the time to pause and search for possible word meanings (Gyllstad et al., 2015; Kremmel & Schmitt, 2016). Although meaning-recognition tests may be very efficient due to their ease of marking and familiarity for learners, important questions still remain regarding their effectiveness in assessing ALK.
A final concern for a VLT’s design is its focus on measuring knowledge mastery of 1000-word (1K) frequency bands. While an easy-to-follow design principle, sampling 30 words from a band of 1000 words offers only a partial appraisal of the lexical knowledge essential to L2 comprehension (Gyllstad et al., 2015; Stoeckel et al., 2021). Lexical coverage research has underscored the critical importance of high-frequency word knowledge for L2 comprehension—a finding that holds even greater significance in studies of the kinds of texts learners are most likely to encounter in L2 listening (see McLean et al., 2024, or Yu & Wen, 2024 for summaries of spoken corpora). Consequently, it is argued that VLTs sample more words from the higher frequency bands because knowledge of these words is so essential to comprehension (e.g., Kremmel, 2016; McLean, 2021). To illustrate, Milliner and Pinchbeck (2025) found that the first 500 lemmas provided approximately 80% coverage of the audio in English film and television transcripts, while Yu and Wen (2024) found that the first 1000-word families of the BNC/COCA provided 88.42 % coverage of popular English language podcasts. In addition to confirming the large contribution of the highest-frequency word bands, these studies demonstrated that word bands beyond the 2K level contribute only marginally, typically a single percentage point or less, to overall lexical coverage across various spoken corpora. Therefore, if a VLT is being used to evaluate a learner’s capacity for listening comprehension, a much more rigorous appraisal of the words most essential for listening comprehension is needed. Webb et al. (2017) recommended higher mastery-level cutoffs for the highest-frequency bands of their uVLT (i.e., 29/30), while Kremmel (2016) proposed narrowing the band sizes to 5C words for the highest-frequency words.
Previous research has explored the implications of different item formats in assessing ALK and their predictive capacities for listening comprehension. However, significant limitations remain. Apart from the work of Milton and Hopkins (2006), Masrai (2022a), and Milton et al. (2010), there is little information on the predictive capacity of an aural Yes/No format, highlighting an underexplored area in ALK assessment. While McLean et al. (2015) reported a medium correlation between the meaning-recognition LVLT and L2 listening comprehension (r = .52, p < .001), they did not evaluate the Yes/No or meaning—recall formats, leaving a gap in understanding the relative effectiveness of a multiple-choice test. Furthermore, Uchihara et al. (2024) found that a single-word meaning-recall format, in which learners hear an L2 word and write an L1 translation, accounted for a higher variance in listening comprehension (28.95%) than a meaning-recognition format (21.09%). This finding aligns with results from Zhang and Zhang's (2022) meta-analysis, which showed that meaning-recall formats yielded a slightly stronger correlation with L2 listening comprehension (r = .58) than meaning-recognition (r = .50), and that meaning-recall measures might offer a more reliable assessment of vocabulary knowledge essential to L2 listening comprehension. These limitations in prior research underscore the need to comprehensively examine the connections between the three widely used ALK item formats—Yes/No, meaning-recall, and meaning-recognition—and their effectiveness in predicting listening comprehension. Additionally, understanding how these test formats perform across narrower lexical knowledge bands (e.g., 1K vs. 5C) could provide valuable insights for vocabulary levels testing and aligning learners with lexically suitable materials.
Building on this rationale, the current study addresses the following research questions (RQs):
RQ1. What is the relative magnitude of the correlation between the scores from three ALK test formats (Yes/No, meaning-recall, and meaning-recognition) and L2 English listening comprehension scores?
RQ2. To what extent do Yes/No, meaning-recall, and meaning-recognition formats, individually or combined, predict variance in L2 listening comprehension?
RQ3. Across each item format, do any specific 1K or 5C vocabulary bands have greater utility in explaining variance in L2 listening comprehension?
In the spirit of open research practices (e.g., Kremmel & Isbell, 2024), this article shares the materials, data, and analysis code used to examine each item format via the Open Science Framework (OSF) repository page (Milliner et al., 2026) and on the Instruments and Data for Research in Language Studies (IRIS). Data analysis was performed using the freely available software R to ensure that the analysis approaches are reusable.
Methods
Participants
A sample of 176 Japanese university students aged between 18 and 23 took a TOEIC test and three versions of an aural vocabulary levels test (AVLT) (Yes/No, meaning-recall, and meaning-recognition). Participants came from a public university in rural Japan (n = 61) and a private university in Tokyo (n = 115). The research was approved by the research ethics committee at each host institution, and all participants provided informed written consent. A wide range of English language proficieny was represented in the sample, with a mean TOEIC Listening and Reading Test score of 415 (SD = 128.48) points, corresponding to Common European Framework of Reference for Languages (CEFR) bands A1–B2. For the listening section of the TOEIC test, the mean score was 247 (SD = 72.51). In 2023, the mean TOEIC listening section score for test takers in Japan was 309 (SD = 91; Educational Testing Service, 2023), indicating the sample was below the national average.
Construction of three versions of the AVLT
The AVLT was designed to measure L2 English learners’ ALK of the first 5000 most frequent flemmas from a word frequency list derived from a corpus of family-genre film and television transcripts (The OPUS family-genre corpus; Milliner & Pinchbeck, 2025). Whereas published VLTs (e.g., LVLT & uVLT) typically adopt the Word Family as the lexical unit of analysis, the present study uses the flemma unit, which is considered a more appropriate choice for learners with L2 English proficiency below advanced levels. The flemma unit includes a base word (e.g., cook) and its inflectional forms (e.g., cooking, cooked, cooks), and it is insensitive to the word’s part of speech; for example, the verb cook and the noun cook (i.e., a family name or chef-like role in a kitchen) are treated as the same word unit. Accordingly, applying the flemma unit in a VLT, a test user or teacher would assume that because a learner demonstrated knowledge of the base word (e.g., cook), their understanding would extend to its inflectional forms (e.g., cooking, cooked, cooks) and across different parts of speech (e.g., the cook in the kitchen). Applying the flemma unit also has important implications for teachers trying to match learners with lexically appropriate listening or viewing materials. By profiling a text with a flemma-based word list and then considering their students’ VLT scores, teachers can make a more objective judgment on the text’s appropriateness (lexical load) for their learners. This approach is adopted in this study, in light of recent evidence suggesting that reliance on the Word Family unit may overestimate learners’ lexical knowledge (e.g., Brown et al., 2022; Kim et al., 2023; Stewart et al., 2024; Stoeckel et al., 2021). This is because Word Family extends across a word’s inflectional forms, different parts of speech, and importantly, its derivational forms (e.g., recooked, undercook, cookable). Recent research indicates that all but the most advanced EFL learners (C2 and above) struggle to comprehend derivational forms when reading (e.g., Milliner et al., 2024; Stoeckel et al., 2024) and listening (e.g., Kim et al., 2023). Therefore, we align with the growing body of research that advocates for the use of narrower word-counting units, such as the flemma, in vocabulary size and levels’ test design.
Regarding the selection of target words, six words were selected for each C-level (i.e., six flemmas selected per 100 words), 30 words for a 5C band, and 60 items for a 1K band, making the entire test 300 items long (NB. the Yes/No test had an additional 100 pseudowords). The same 300 words (Appendix 1) were tested across each format, and the test delivery system randomized the order of words to help control for test-related learning effects.
The online AVLT
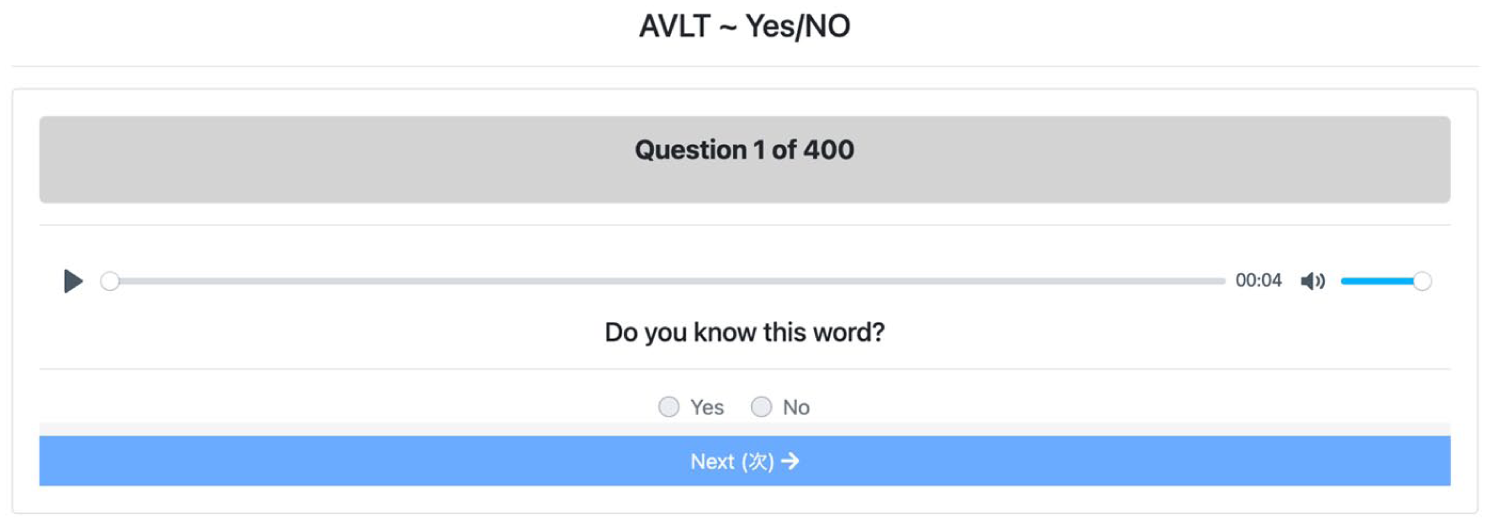
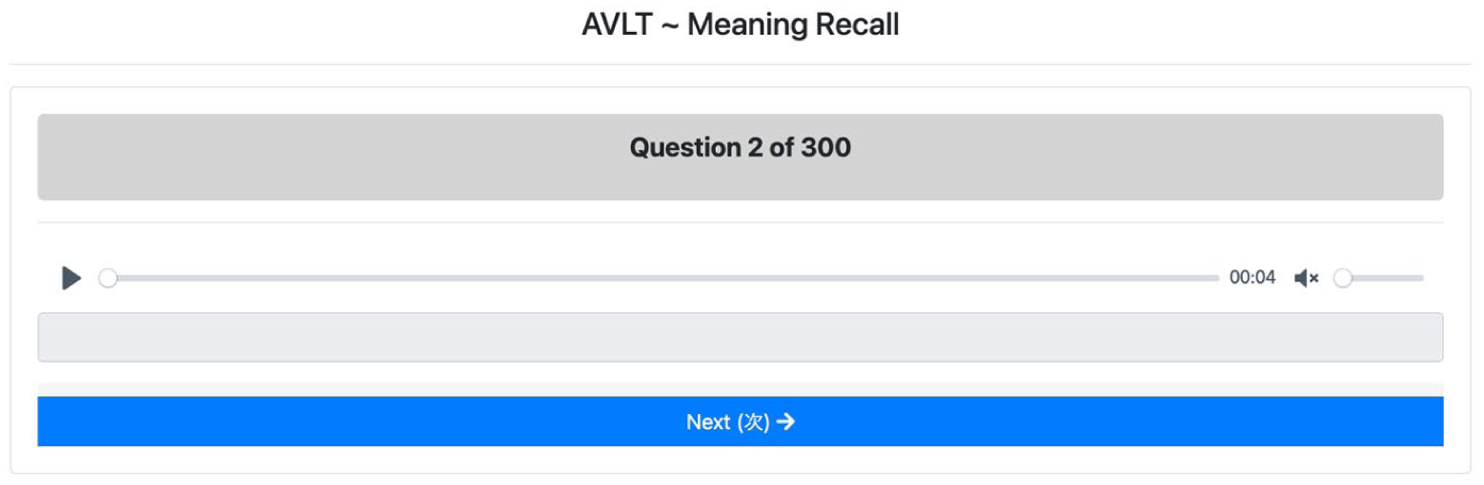
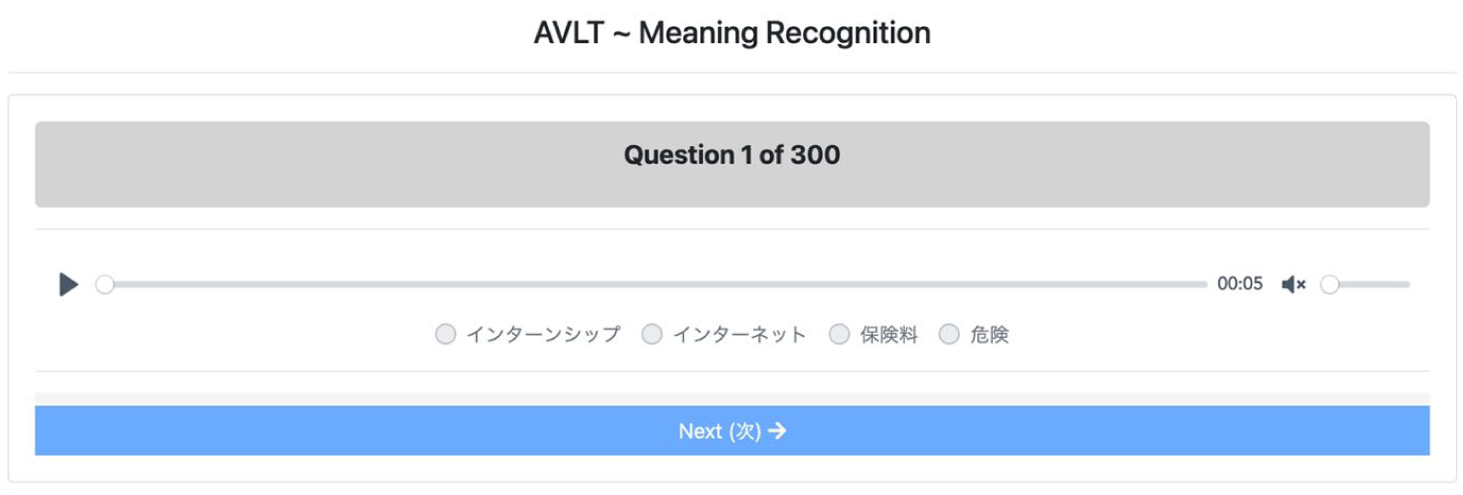
All three versions of the 300-item AVLT were delivered through VLT.carleton.ca, a non-commercial platform for English language teachers and researchers to implement self-marking VLTs. During all test administrations, learners sat the tests under the supervision of their classroom teacher. To limit unwanted test-taking learning effects, the order of test items for each VLT was shuffled by the VLT.carleton.ca system. Additionally, participants completed the tests in the order of (1) Yes/No, (2) meaning-recall, and (3) meaning-recognition, with a 1-week gap between each. The usage logs showed that students, on average, spent less than an hour finishing each test. The meaning-recall test took the longest at 52 minutes, compared to 39 minutes for the Yes/No test and 42 minutes for the meaning-recognition test. All versions of the AVLT require test takers to listen to the target word, followed by a two-second pause, and then the target word in a non-defining stem phrase. For example, learners heard, “Insurance. The insurance is expensive.” To preserve construct validity, learners received this information only aurally and not presented in written form, as illustrated in Figures 1, 2, and 3. Participants were able to play the listening prompt only once. Stem phrases were rigorously checked to ensure no stem phrase contained words from a lower frequency band. For example, a stem for an item in the 5C–1K band (i.e., words ranked 501–1000) only included words from the 5C band (i.e., words ranked 1–500). Second, to ensure the word's meaning could not be derived from the stem sentence, a cloze test for all stems was created and normed with 10 L1 English speakers. If the target word was correctly provided by the L1 speakers, the stem sentence was changed and rechecked. This process continued until target words could not be systematically guessed from the surrounding context.
The Yes/No AVLT.
The meaning-recall AVLT.
The meaning-recognition AVLT.
After all target words and stems were checked, the audio recording for the test was produced using Amazon Polly Text-To-Speech software (https://aws.amazon.com/). Given learners' familiarity with the North-American accent and the sheer volume of English listening material using a North-American accent, a neural, 1 male, American voice (Matthew) was selected. This voice was checked for speed and clarity, and each test item was piloted with Japanese and native English speakers.
The design of three test formats
Yes/No
The Yes/No test consisted of 400 items. To prevent guessing, 100 pseudowords were added to the 300-word question pool. For pseudowords to effectively control for guessing, it is recommended to select non-words that have many phonological or orthographic neighbors (e.g., Zhang et al., 2020). The pseudowords for this study were selected from the ARC Nonword Database (Rastle et al., 2002), and the website’s data on phonological neighbors were referred to. All selected words needed to have a minimum of two phonological neighbors, and each word was cross-checked with the COCA (Davies, 2008-) to ensure that the pseudowords never appeared as low-frequency words. L1 English speakers were recruited to check the words and stem sentences to ensure that (1) the pseudowords did not appear too similar to a real English word and (2) the pseudowords were not too unbelievable. The Yes/No test was scored dichotomously, awarding one point when participants answered “Yes” for real words. The average false alarm rate, meaning the cases where participants responded “Yes” to 100 pseudowords, was 28%. Three participants were excluded because their false alarm rates exceeded 70%. Due to limited guidance in the literature on managing false alarms in listening tests or excessively long VLTs, this study adopted the approach of McLean et al. (2020) and did not apply a correction formula for false alarms. An example of a Yes/No item as applied in the current study is displayed in Figure 1.
Meaning-recall
Illustrated in Figure 2, the meaning-recall test takers were asked to write a simile or definition of the target word in their L1 (Japanese) after hearing the prompt. All responses to the meaning-recall AVLT were checked independently by two L1 Japanese professors with PhDs in applied linguistics. In the dichotomous scoring system, raters were instructed to award one point if they believed the participant understood the meaning of the target word. No points were given for partial knowledge. The inter-rater reliability analysis indicated a high level of agreement (Cohen, 1960) between the two raters (kappa = .98). The measure of internal consistency (Cronbach’s alpha; conducted in R) for Rater 1 ( α = .970) and Rater 2 ( α = .971) was almost identical. In line with previous research using meaning-recall vocabulary knowledge tests (e.g., Matthews et al., 2023; McLean et al., 2020; Stewart et al., 2024), the scores from the rater with the highest Cronbach’s alpha (Rater 2) were used to analyze meaning-recall results.
Meaning-recognition
Figure 3 illustrates how the meaning-recognition test appeared on the test taker’s screen. After hearing the prompt, test takers had 1 minute to select the appropriate response. All distractors were adapted from the VLT.carleton.ca database, which hosts distractors used in previously validated VLTs for Japanese learners of English (e.g., McLean et al., 2015). Only distractors sharing the same part of speech and the same frequency band as the target word were selected for piloting. If this was not possible, distractors from a higher frequency band were selected. After initial piloting by the authorship team, these words were reviewed by two panels of L1 Japanese speakers. The first panel reviewed the distractors as part of a written VLT. The second group reviewed all distractors in the AVLT format.
TOEIC listening test
All students sat the TOEIC (Listening and Reading) within 3 months of the AVLTs. The 45-minute, 100-item, multiple-choice listening test is reported to be reliable ( α = .94) across four sections: (1) photo descriptions, (2) question responses, (3) dialogue listening, and (4) monologue listening, and robust according to a variety of psychometric properties such as difficulty, discrimination, and reliability (Cid et al., 2017). Although the TOEIC is labeled as a test for business English communication, it possesses ecological validity in the context of this study (Japan) since it is the most widely taken English proficiency test in the country. Additionally, the TOEIC listening test has often been used as a criterion measurement for L2 listening proficiency in several studies concerning ALK and L2 listening comprehension (e.g., McLean et al., 2015; Uchihara et al., 2024).
Data analysis
This study used the langtest.jp website (Mizumoto, 2015), which runs on R to analyze the test results. The R codes used for the analysis are available on the OSF database (Milliner et al., 2026). All data were cleaned and then analyzed using a four-step process. Initially, test scores derived from the three vocabulary tests and TOEIC were analyzed to generate descriptive statistics and estimates of internal reliability. It is important to note that this research focuses on learners’ overall test scores rather than mastery within individual vocabulary bands, which is the primary focus of standard VLTs. Second, to determine the magnitude of the relationships between scores derived from each item format and TOEIC listening scores, a Pearson correlation analysis was undertaken. To answer RQ2, hierarchical regression was used to evaluate the capacity of each item format to predict variance in L2 listening comprehension. Predictor variables were added to the model based on the correlation strength between the item format and the dependent variable, TOEIC listening test scores. Regarding RQ3, which was exploratory in nature, a series of multiple regression analyses was conducted for each item format and its application of the 1K (i.e., 1K–5K; five predictors) and 5C bandwidth frameworks (5C–5K; 10 predictors). As in RQ2, TOEIC listening test scores were the dependent variable. The standardized beta values were assessed to determine if specific bands had significantly stronger connections to listening comprehension than others. Since intercorrelations among predictors can influence beta values, we further examined these values using the methods recommended by Mizumoto (2023), including a dominance analysis and random forests, via an R-based web application (https://langtest.jp/). The R code used for each regression model, dominance analysis, and random forest (including the Boruta algorithm) analyses can be found on OSF. 2
Before conducting the analysis for RQ1, RQ2, and RQ3, assumption checks essential for correlation and regression analyses were performed. Power analysis for our sample was checked using Green’s (1991) rule of thumb (i.e., n > 50 + 8p). For our regression model with the largest number of predictor variables (RQ3), our sample size (n = 176) is sufficiently large (i.e., n > 50 + 8*10) to detect significant effects in our regression models. Outliers and influential data points were identified and reviewed across all four tests in SPSS. Our analysis of outliers revealed four extreme outlying scores in the meaning-recognition tests (i.e., scores lying more than three times the first or third interquartile range), prompting the research team to remove these four participants from the sample. Upon removing these four outliers from the sample, checks for normality (skewness and kurtosis) revealed values between −1 and +1 for all three measures of ALK, indicating that the data were a good fit for regression analysis. To reconfirm that no overly influential data points were included in the analysis, Cook’s distance was calculated for each regression model.
Results
Descriptive statistics
Descriptive statistics for the sample across all four tests are reported in Table 1. All three versions of the AVLT demonstrated robust internal consistency, with Cronbach’s alpha coefficients above .95. The skewness and kurtosis values indicate that scores were normally distributed to an acceptable level. The mean scores indicate that the meaning-recall test was considerably more demanding than the Yes/No and meaning-recognition tests. A paired-sample t-test also confirmed that the meaning-recognition scores were significantly higher than the Yes/No (t = 15.22, 95% confidence interval [CI] = [.96, 1.34], p < .001, d = 1.15) and meaning-recall scores (t = 56.26, 95% CI = [3.77, 4.71], p < .001, d = 4.24).
Descriptive statistics for participants’ test scores (n = 176).
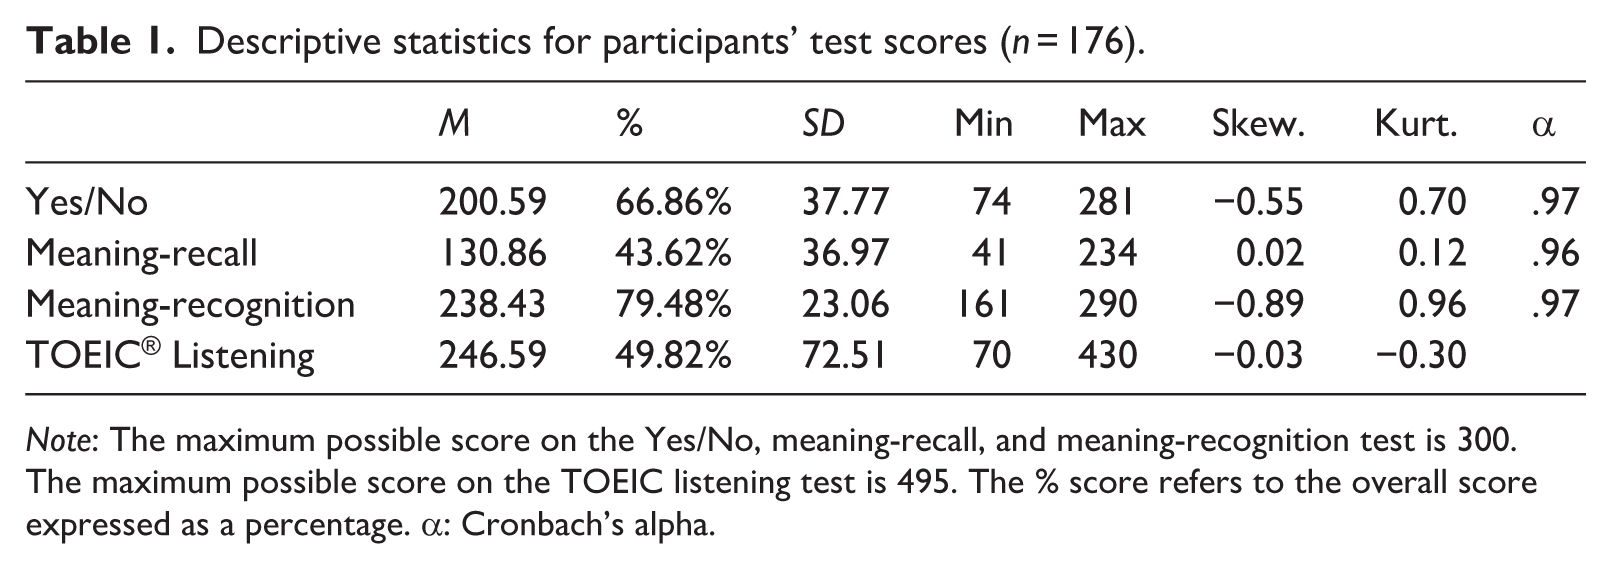
Note: The maximum possible score on the Yes/No, meaning-recall, and meaning-recognition test is 300. The maximum possible score on the TOEIC listening test is 495. The % score refers to the overall score expressed as a percentage. α: Cronbach’s alpha.
RQ1: What is the relative magnitude of the correlation between the scores derived from three ALK test formats (Yes/No, meaning-recall, meaning-recognition) and test scores for L2 English listening comprehension?
The Pearson correlation revealed that all three measures of ALK are significantly correlated with L2 listening comprehension (see Table 2). Following Plonsky and Oswald’s (2014) field-specific benchmarks for interpreting correlation coefficients in L2 research (i.e., small: r ≤ .25; medium: r ≥ .40; large: r ≥ .60), the meaning-recall (r = .63, p < .001) and meaning-recognition (r = .65, p < .001) formats displayed similarly strong correlations with listening comprehension. The Yes/No test’s correlation with listening comprehension was medium (r = .55, p < .001). The correlation between meaning-recall and recognition was also strong (r = .74, p < .001), a result that is not unexpected since both item formats measure the capacity to link a word’s phonological form to its meaning (i.e., ALK).
Intercorrelations for item formats and L2 listening comprehension (N = 176).
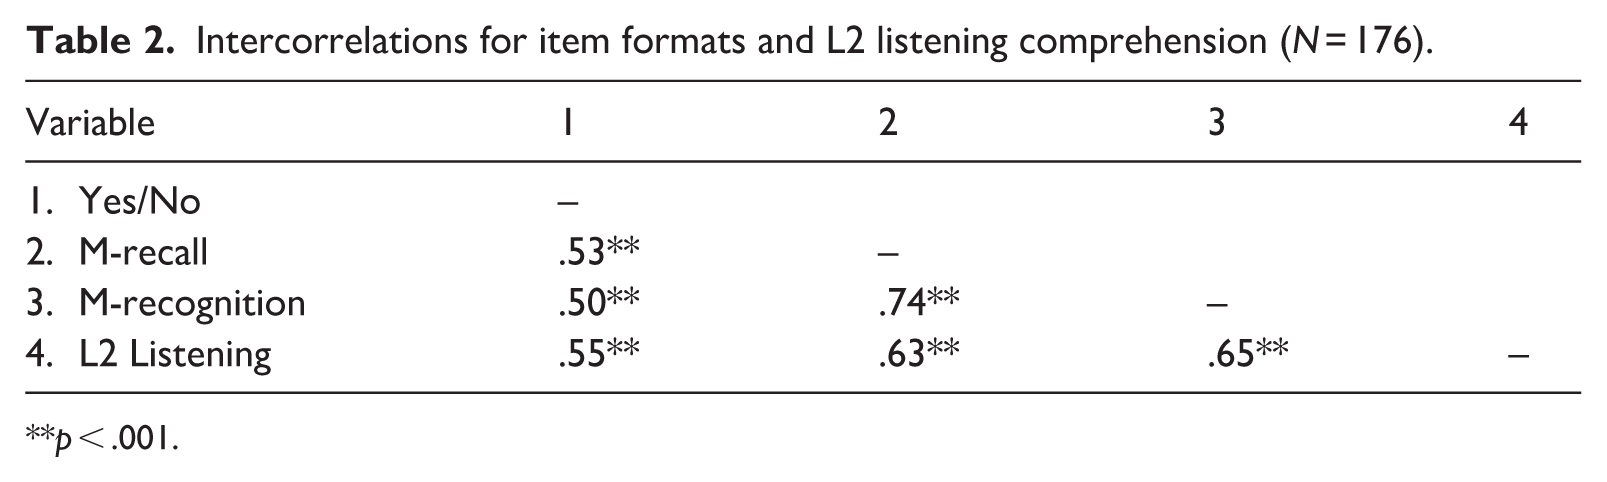
p < .001.
RQ2: To what extent can Yes/No, meaning-recall, and meaning-recognition item formats, individually or in combination, predict the variance observed in L2 listening comprehension?
A hierarchical regression analysis was conducted to determine the predictive power of the Yes/No, meaning-recall, and meaning-recognition measures of ALK in explaining variance in L2 listening comprehension test scores. Because the magnitude of the correlation between L2 listening comprehension and meaning-recognition (r = .65) approximated the correlation between L2 listening comprehension and meaning-recall (r = .63), two hierarchical regression models were built to confirm the relative predictive value of the two item formats. The predictor variables (AVLT scores) were included in the first model in the following order: meaning-recall, meaning-recognition, and Yes/No. In the subsequent model, the order was changed to meaning-recognition, meaning-recall, and Yes/No. For each regression analysis, we verified that the regression models were free from multicollinearity, as evidenced by tolerance levels well above .20. A visual inspection of the residuals and predicted values confirmed that the homoscedasticity requirement was met. The regression results indicated that the best-performing model, explaining 52% of the variance in listening test scores, included all three ALK test scores as predictors. In the first step of the hierarchical model (see Table 3), the meaning-recall format alone explained 40.2% of the variance in L2 listening comprehension. When the meaning-recognition format was added in the second step, the variance explained by the model increased to 47.7%. In the third step, the inclusion of the Yes/No format further raised the total variance explained to 51.7%. In summary, the unique contribution of the meaning-recall format in predicting variance in L2 listening was substantial (40.2%), with recognition (7.5%) and Yes/No (4.0%) adding small but statistically significant contributions to the model.
Hierarchical regression model results for item format (meaning-recall entered first).
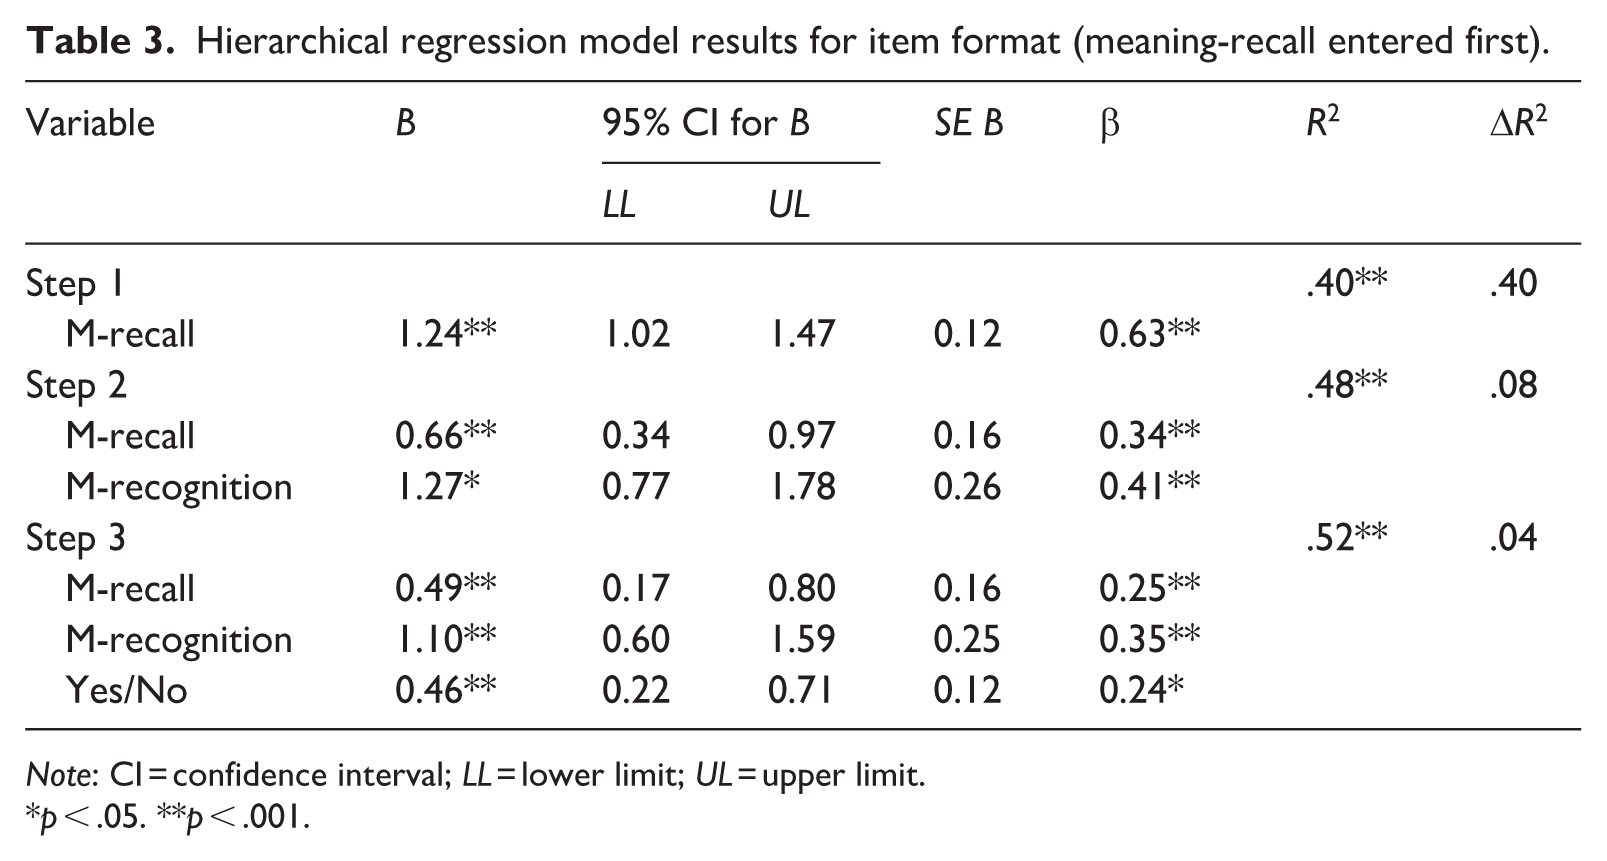
Note: CI = confidence interval; LL = lower limit; UL = upper limit.
p < .05. **p < .001.
In the second model (see Table 4), meaning-recognition was entered in the first step, followed by meaning-recall and Yes/No. The first step showed that meaning-recognition alone accounted for 42.5% of the variance, slightly higher than the figure observed for meaning-recall when it was added first in Model 1 (Table 3; 40.2%). When meaning-recall was entered second in Model 2, an additional 5.2% of variance could be explained, which is less than the variance explained by meaning-recognition in Model 1 (7.5%). This second model, therefore, provided confirmation that a meaning-recognition measure of ALK explained the greatest amount of variance in L2 listening comprehension, accounting for approximately 2% more variance than when meaning-recall was entered into the model first (i.e., Model 1). Although to a lesser degree, the Yes/No format also has the capacity to explain variance in listening comprehension, both independently and in combination with meaning-recall and recognition.
Hierarchical regression model results for item format (meaning-recognition entered first).
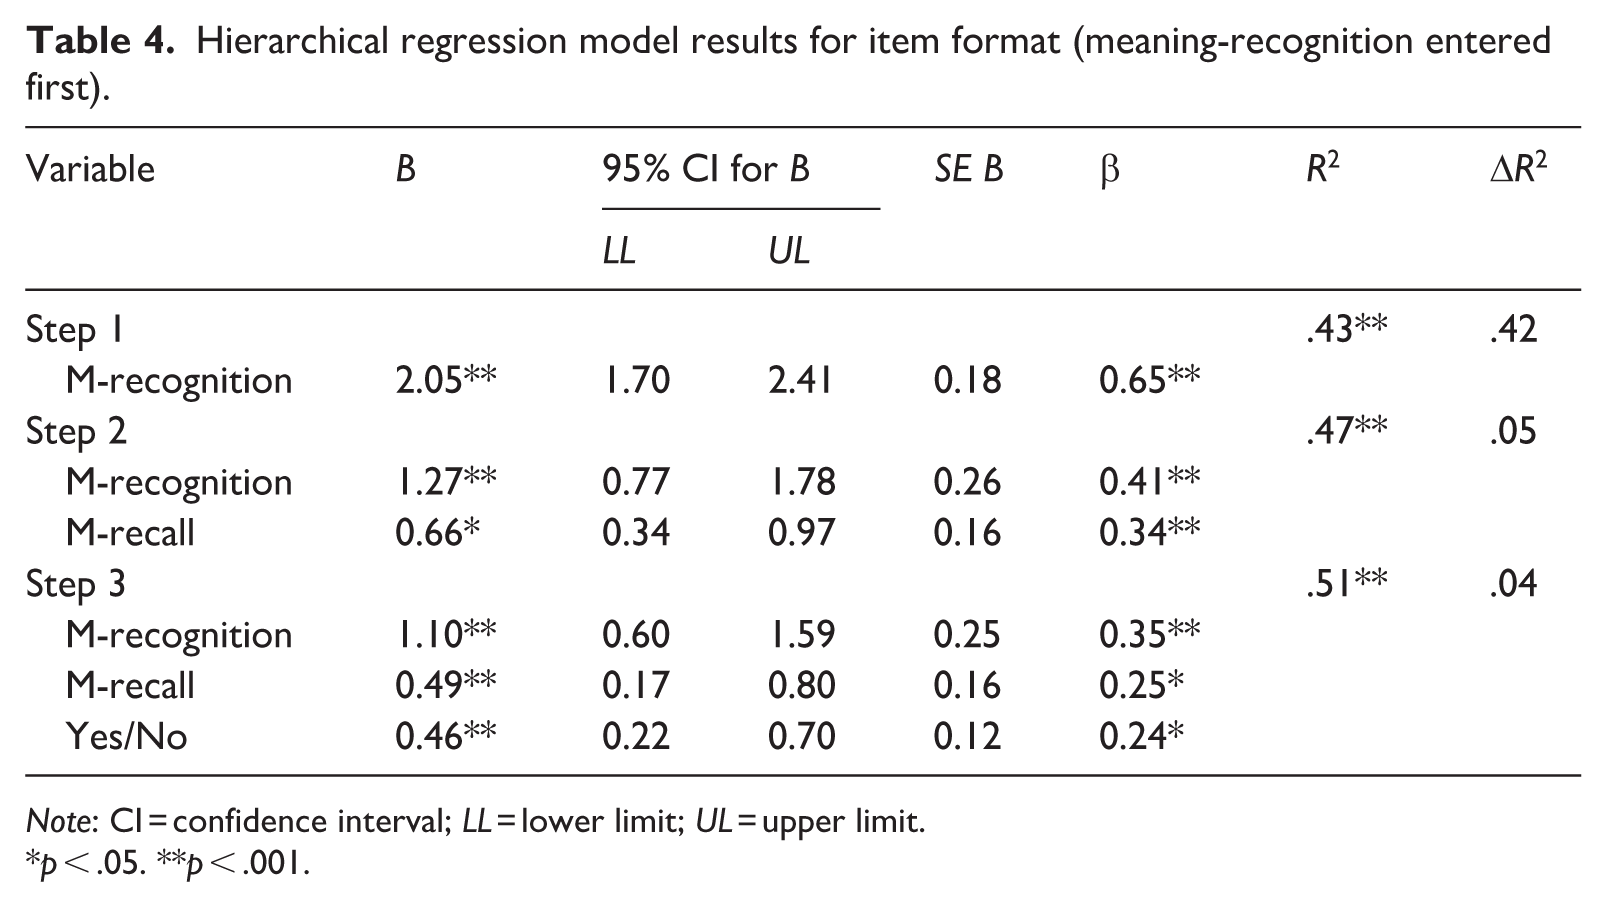
Note: CI = confidence interval; LL = lower limit; UL = upper limit.
p < .05. **p < .001.
RQ3: Across each item format, do any specific 1K or 5C vocabulary bands have greater utility in explaining variance in L2 listening comprehension?
Regarding RQ3, which was exploratory in nature, a series of multiple regression models was built to examine the predictive power of lexical knowledge at different frequency levels for listening comprehension. For the 1K framework, three models were built using knowledge at the 1K, 2K, 3K, 4K, and 5K frequency bands as predictors of TOEIC listening scores separately for the Yes/No, meaning-recall, and meaning-recognition tests. For the 5C framework, three parallel models were constructed using knowledge at each 500-word increment (i.e., 1–5C, 5C–1K, 1K–1.5K, etc.) as predictors for the same three test formats. Results from the regression analysis, including beta weights and dominance analysis, are presented below for the 1K and 5C frameworks, respectively. Diagnostic checks for each multiple regression analysis revealed tolerance levels comfortably surpassed .20, and an evaluation of scatterplots for residuals and predicted values confirmed the maintenance of homoscedasticity. Our evaluation of Cook’s distance results confirmed that there were no overly influential data points in any of the six models (i.e., all Cook’s distance results < 1.0). Multicollinearity was checked across all six models, with all tolerance values well below 1.0. Some 1K bands from the Yes/No (3) and meaning-recall tests (4) exhibited variance inflation factors (VIFs) between 5.0 and 6.8, indicating a relationship between some of these predictor variables. Nevertheless, these bands were retained because the VIF scores are not excessively high (i.e., >10.0). Importantly, multicollinearity was controlled for in our analysis, as the importance of predictors was assessed using dominance analysis and random forests, which complemented our evaluation of beta weights.
1K band framework
All correlations between the predictor variables (i.e., 1K vocabulary bands) and the criterion variable are reported in the Supplementary Materials on OSF (Milliner et al., 2026). Figure 4 presents the reports for the regression results and beta values for the 1K to 5K bands, organized by item format (R-Code applied in the analysis is reported in the Supplementary Materials on OSF (Milliner et al., 2026)). The model with the greatest predictive capacity was the meaning-recognition model (R² = .423, p < .001), which was closely followed by the meaning-recall model (R² = .398, p < .001). The Yes/No format model exhibited noticeably lower performance (R² = .311, p < .001). A review of the respective beta weights across the three item formats revealed that for this group of EFL learners, the bands with the most significant predictive capacity included the 2K from the Yes/No (β = .417, p = .006) and meaning-recall (β = .379, p = .005) tests. In the meaning-recognition test, the 3K band was the only band with significant predictive power (β = .330, p = .004).
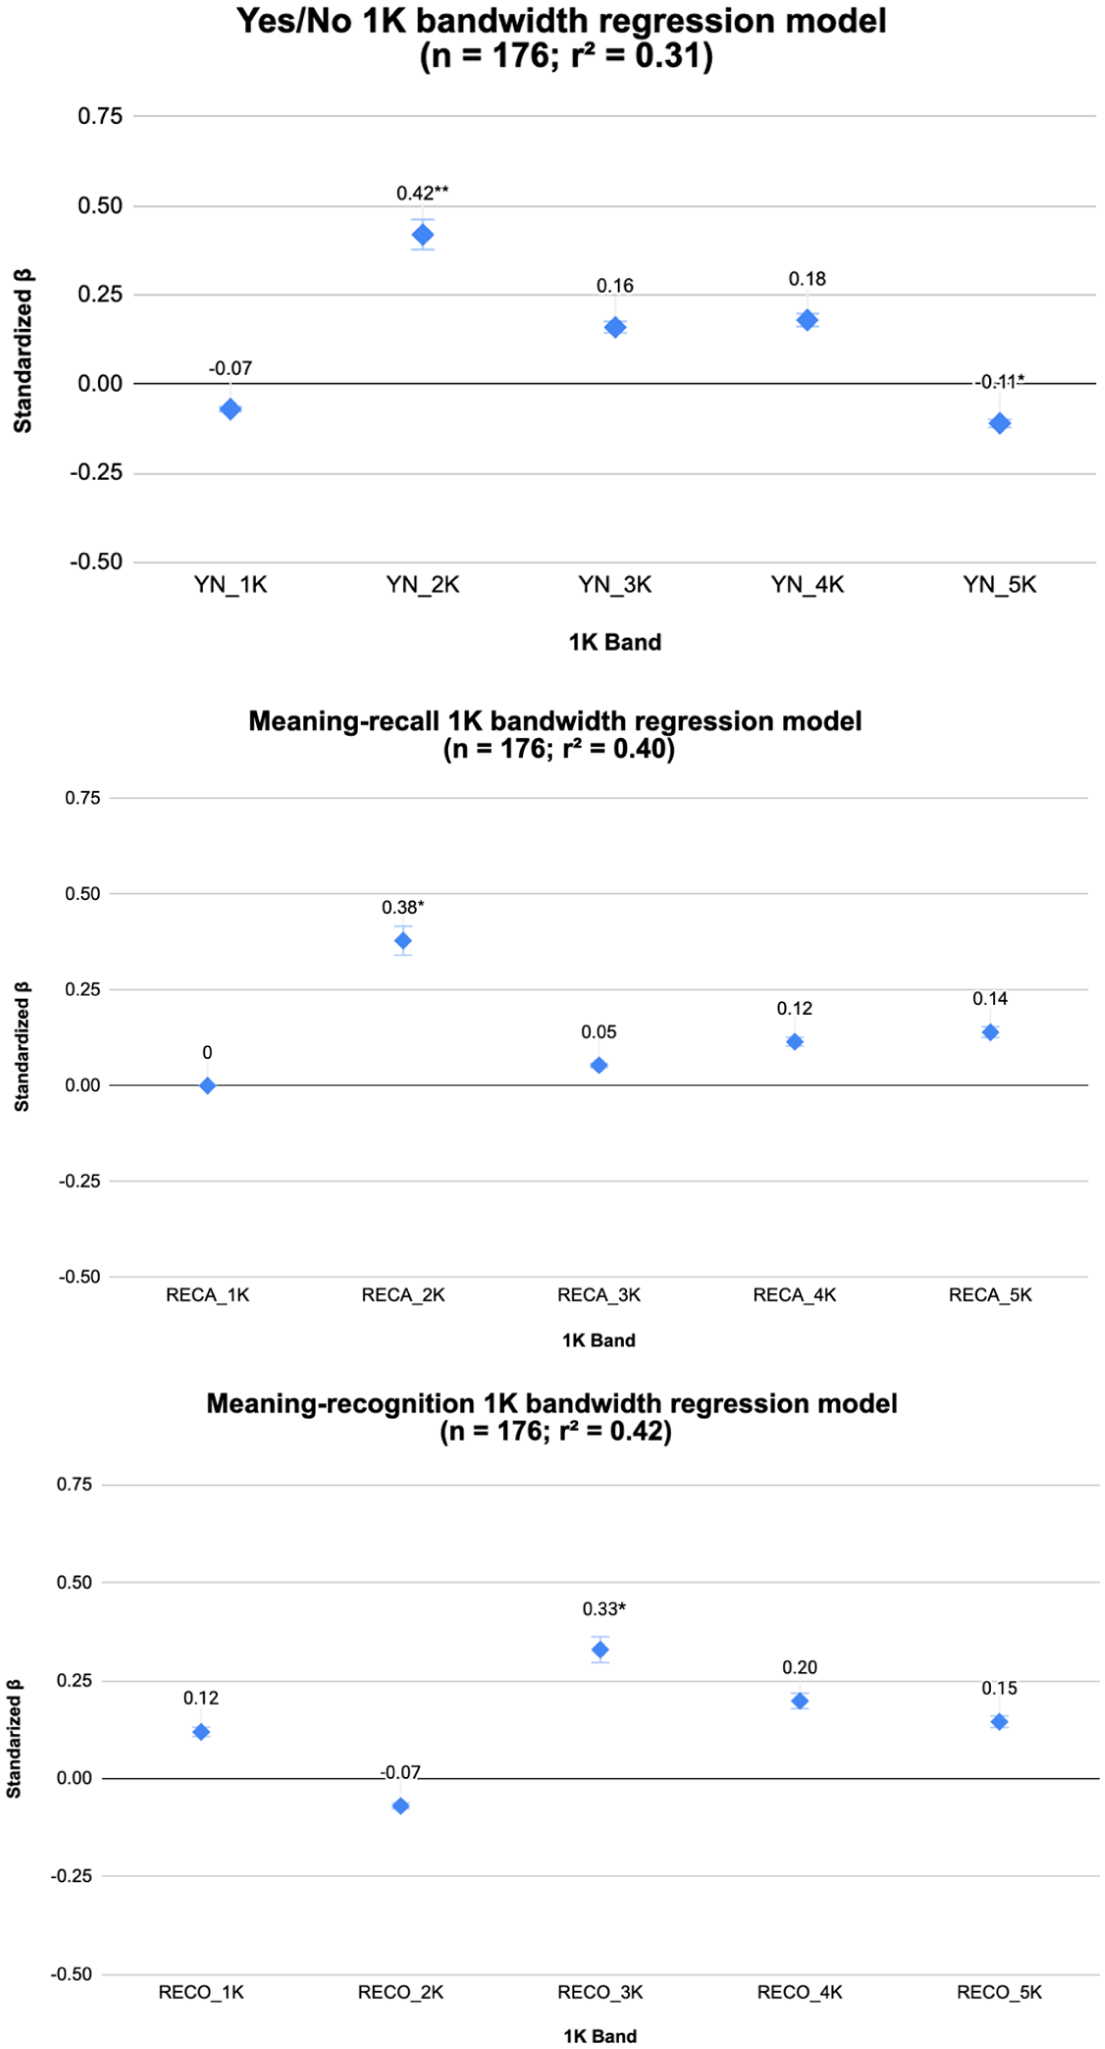
Multiple regression results with 1K bands as predictors for all AVLT item formats.
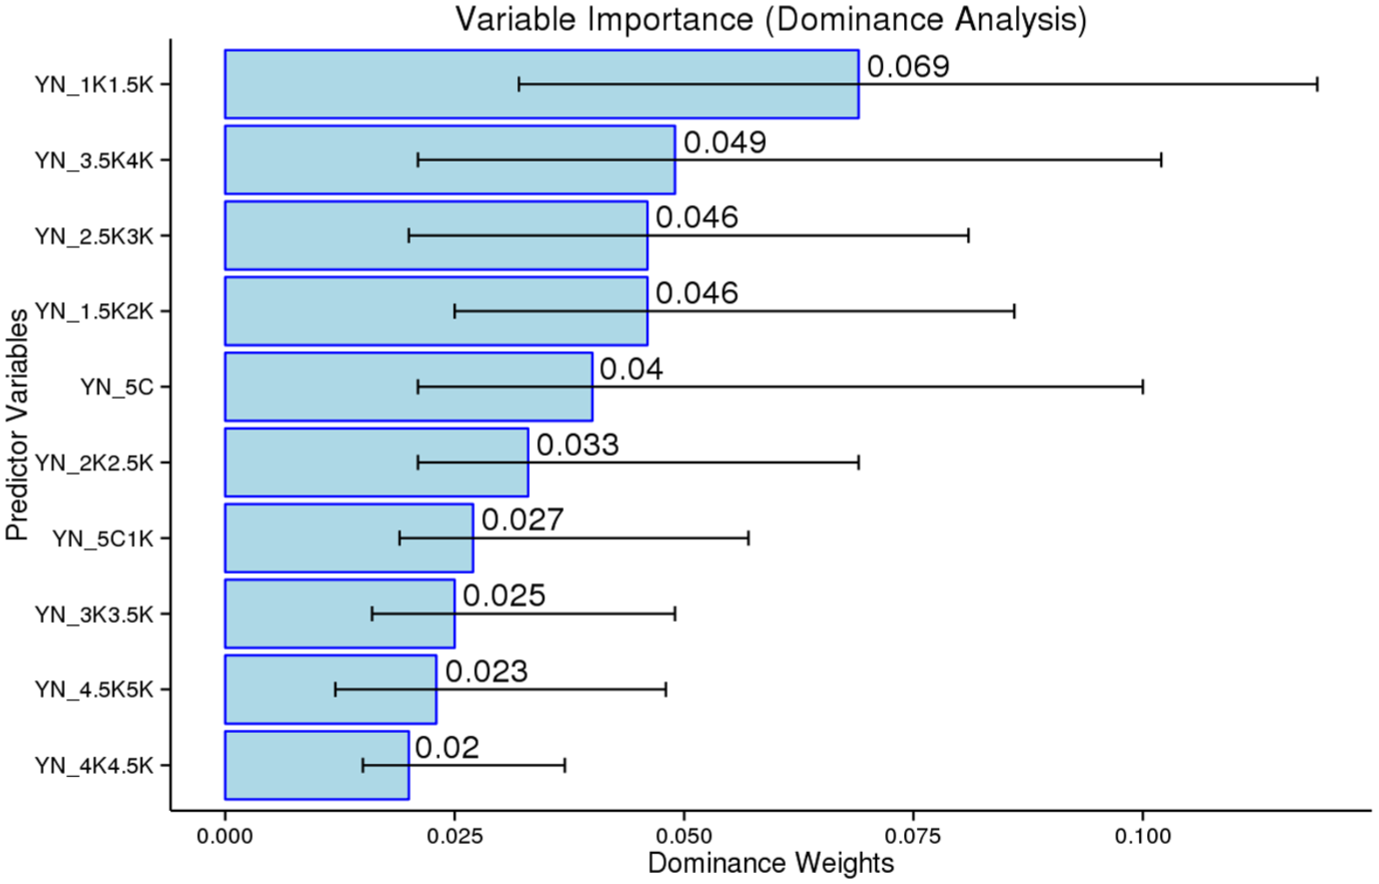
The beta values observed for each band were then examined using dominance analysis and random forests (see Supplementary Materials on OSF; Milliner et al., 2026). Regarding the Yes/No test, the dominance analysis showed that all bands contributed to the model, with the 2K band being the most influential, making up 33% of the R2, followed by the 3K, 4K, 1K, and 5K bands, in that order (Figure 5). The dominance of the 2K band was also significantly higher than that of the 1K and 5K bands.
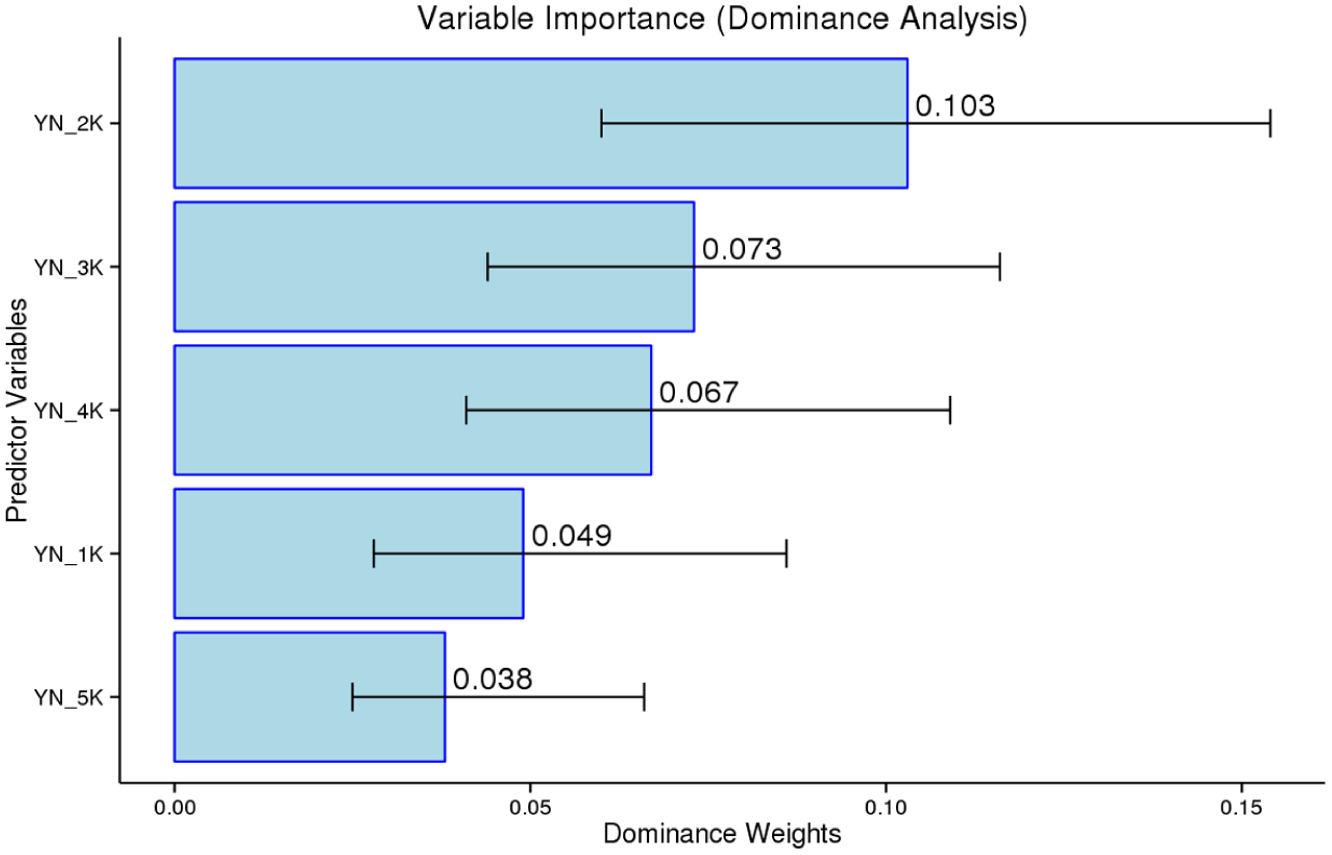
Dominance analysis of 1K bands as predictors for the Yes/No test.
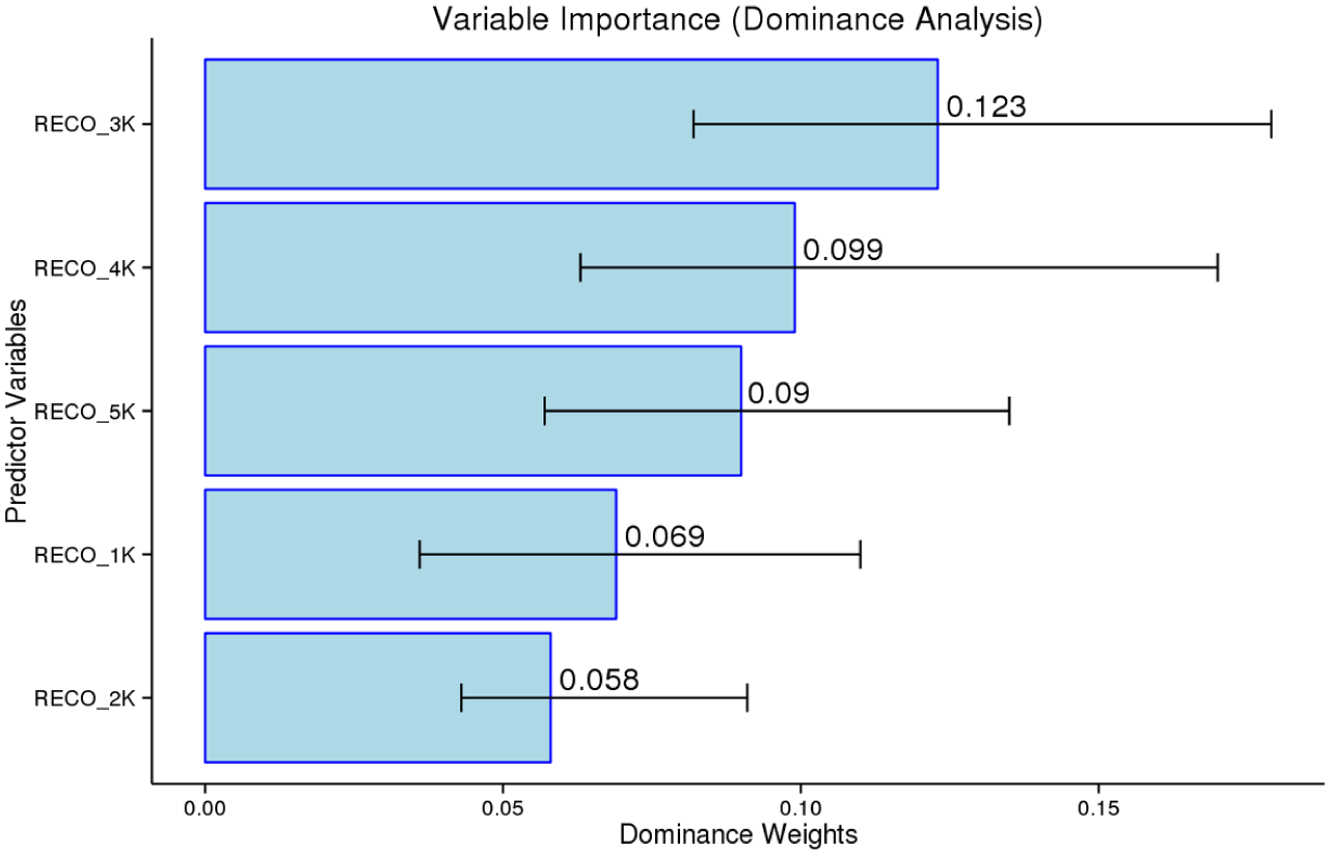
For the meaning-recall test, all bands contributed to the regression model, with the 2K band being the most influential (explaining 29% of R2), followed by the 3K, 5K, 4K, and 1K bands, in that order (Figure 6). The only significant difference between dominance values was observed in the most dominant predictor, the 2K band, and the least dominant predictor, the 1K band.
Dominance analysis of 1K bands as predictors for the meaning-recall test.
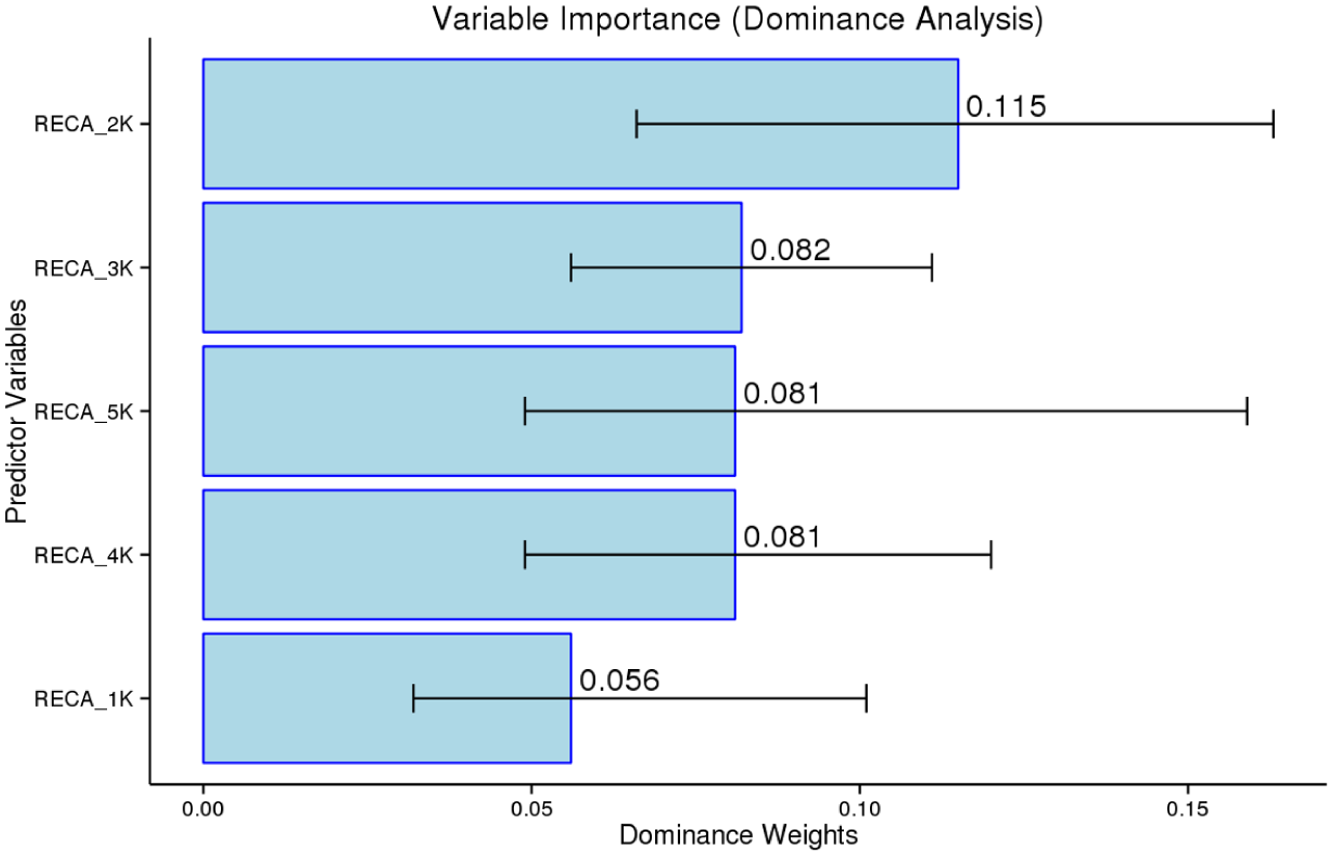
Focusing on the meaning-recognition test, all bands contributed to the regression model, with the 3K band being the most dominant predictor (explaining 29% of R2), followed by the 4K, 5K, 1K, and 2K bands, respectively (Figure 7). The 3K band was the most dominant contributor to the model for the current test-taking group, with a contribution that was significantly greater than that of the least dominant predictor, the 2K band.
Dominance analysis of 1K bands as predictors for the meaning-recognition test.
5C band framework
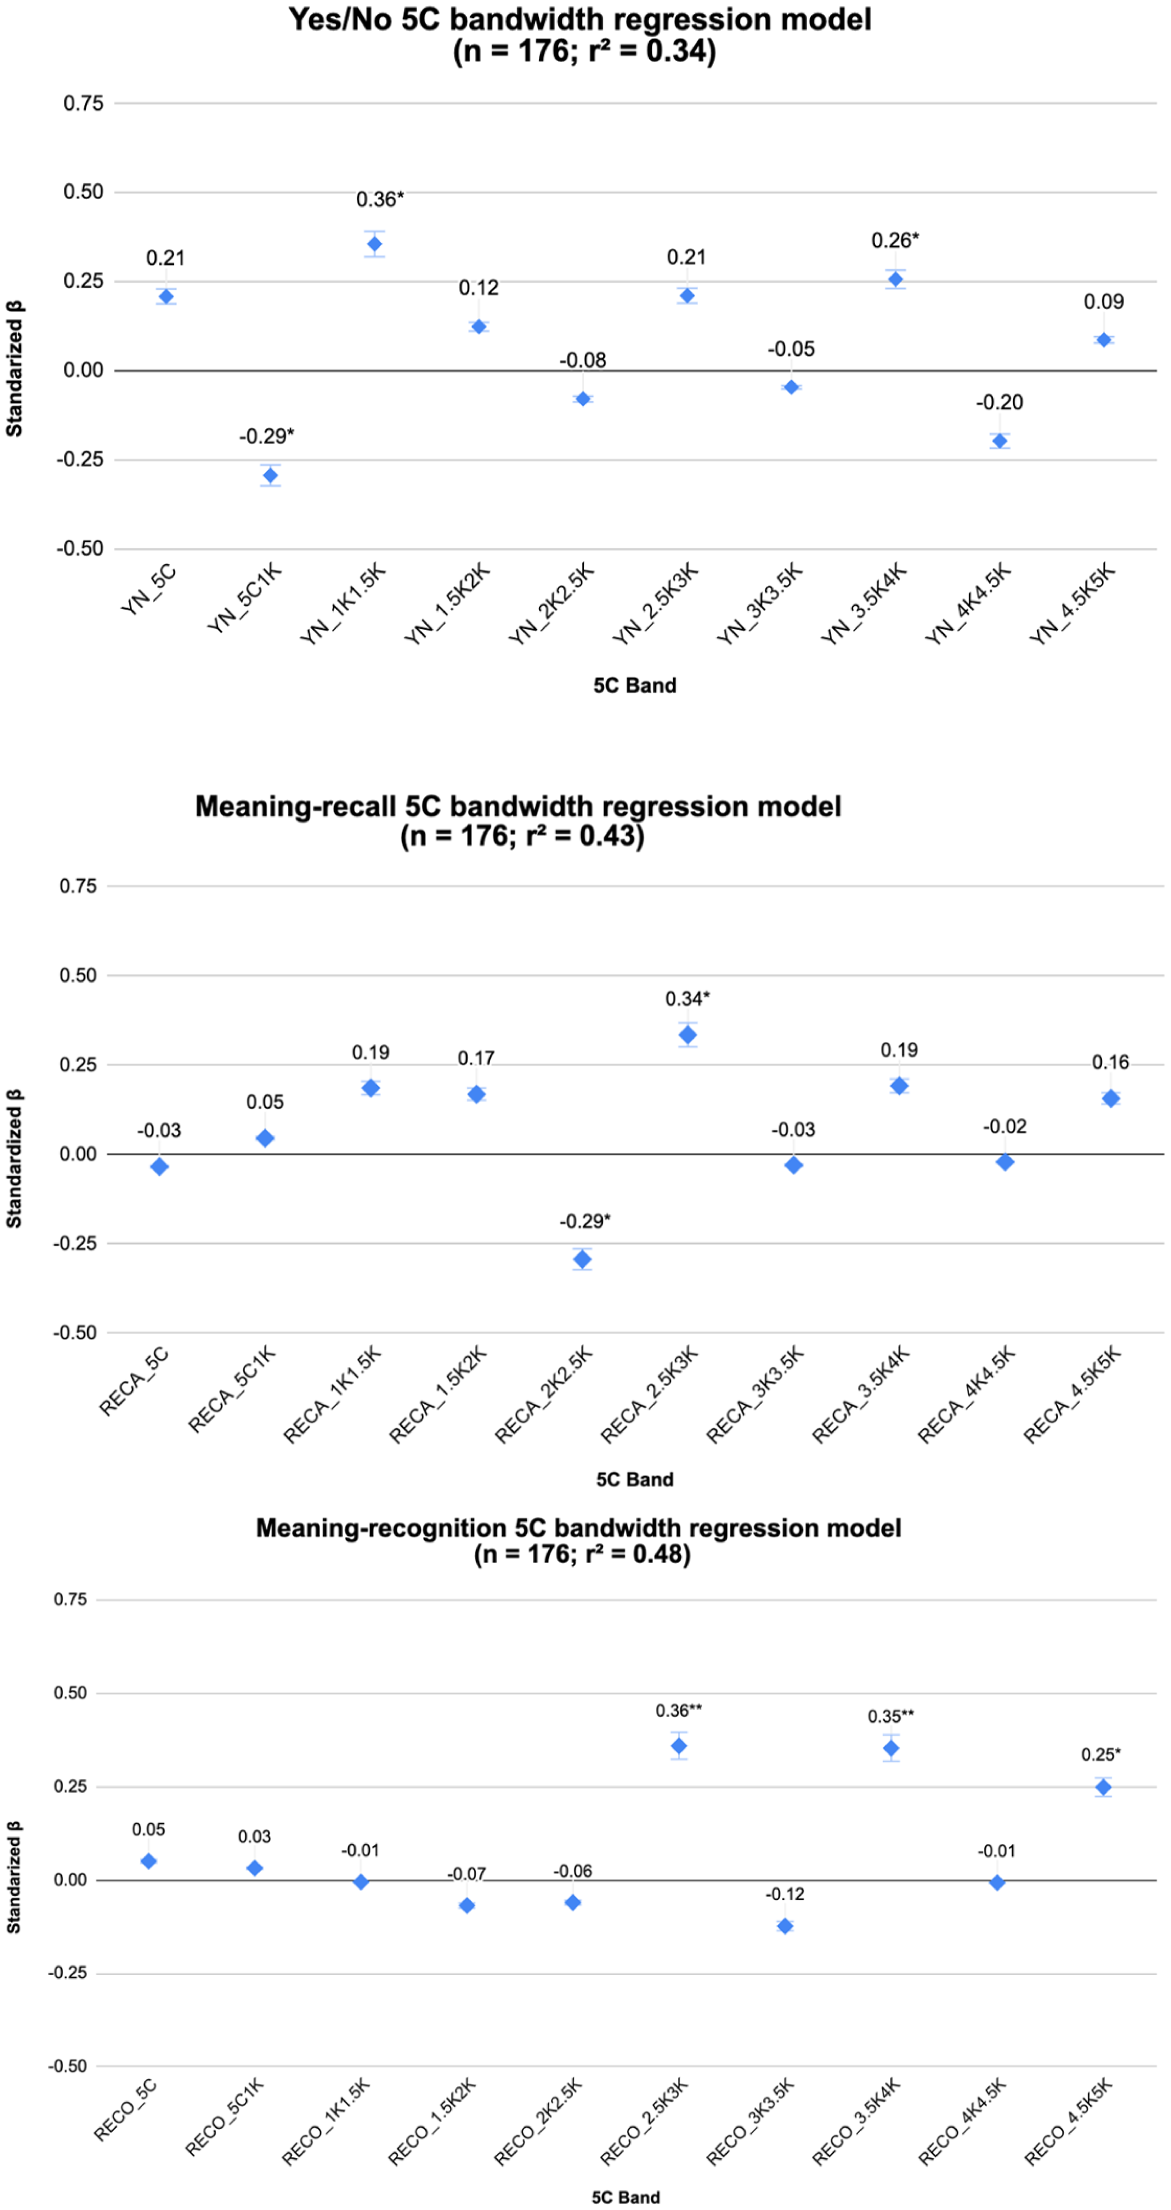
Examining the models for the 5C bandwidths (Figure 8; correlations and R-Code reported in the Supplementary Materials on OSF, (Milliner et al., 2026)), each corresponding to its specific item format, explained more variance than the regressions for the 1K–5K framework. The models for the meaning-recognition (R² = .480, p < .001) and meaning-recall (R² = .431, p < .001) formats were again stronger than those for the Yes/No format (R² = .341, p < .001). A review of the beta weights across the three models revealed significant beta values in the 5C–1K (β = −.293, p = .015), 1K–1.5K (β = .356, p = .004), and 3.5K–4K (β = .257, p = .043) from the Yes/No, 5C–1.5K (β = −.293, p = .015) and 2.5K–3K (β = .257, p = .043) from the meaning-recall, and 2.5K–3K (β = −.293, p = .015) and 3.5K–4K (β = .356, p = .004), from the meaning-recognition.
Multiple regression results with 5C bands as predictors for all AVLT item formats.
The beta values for each predictor were then verified using dominance analysis and random forest. The order of dominance weights for each item format is reported in Figure 9 and largely confirms the order of predictive capacity found in the beta weights. The bands with significant negative beta values (i.e., 5C–1K form the Yes/No, and 2K–2.5K from the meaning-recall) can be interpreted as predictors having strong intercorrelations with the other predictors, and the dominance analysis and random forests helped establish that these predictors were some of the weakest predictors when the strong intercorrelations were accounted for.
Dominance analysis of 5C bands as predictors for the Yes/No test.
Focusing specifically on the Yes/No test, the 1K–1.5K band was the most dominant, accounting for approximately 20% of the variance. This band was followed by the 3.5K–4K (14%), 2.5K–3K (13.5%), and 1.5K–2K (13.5%), respectively. The random forest analysis revealed that all bands except the 3K–3.5K band were considered important for the model, with the 1K–1.5K band being the most influential. No 5C band had significantly greater predictive capacity than the other bands.
Regarding the meaning-recall test, the 2K–2.5K (β = −.293, p = .013) and 2.5K–3K (β = .335, p = .008) bands demonstrated significant predictive capacities in the original regression analysis (Figure 8). The dominance analysis (Figure 10) and random forests provided additional explanation for this finding, revealing that the 2.5K–3K band was the most influential predictor, accounting for 18.6% of the R². The 2K–2.5K band, however, was less dominant, accounting for only 8.4% of R². The random forest also concluded that the 2K–2.5K and 3K–3.5K bands were not important predictors in the model. A key conclusion from our analysis of the meaning-recall test is that the 2.5K–3K band had significant predictive power, along with the 1K–1.5K and 1.5K–2K bands, which together comprise the 2K band, the most influential predictor in the earlier 1K analysis.
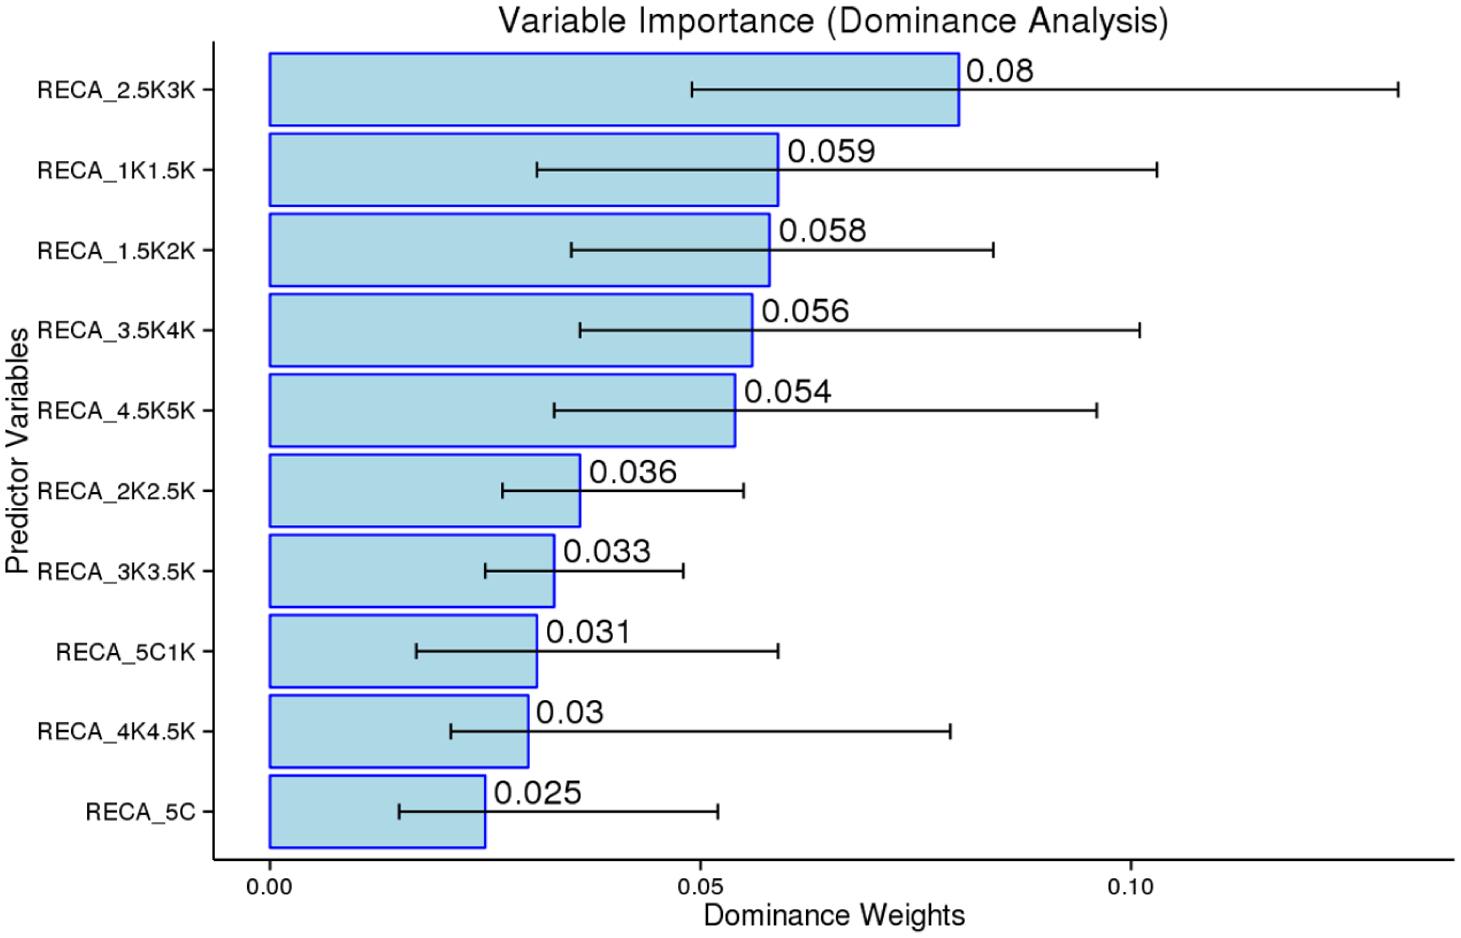
Dominance analysis of 5C bands as predictors for the meaning-recall test.
Lastly, after the regression analysis, three bands from the meaning-recognition test had significant predictive capacities: the 2.5K–3K (β = .360, p < .001), the 3.5K–4K (β = .354, p < .001), and the 4.5K–5K (β = .249, p = .003). These results were examined using dominance analysis and random forests to verify that the 2.5K–3K (24%), 3.5K–4K (18.75%), and 4.5K–4K (16.25%) were the most dominant predictors (Figure 11). These bands were also significantly more dominant than several 5C bands (i.e., 0–5C, 5C–1K, 1K–1.5K, 1.5K–2K, 3K–3.5K, and 4K–4.5K). The random forest analysis revealed that eight bands were important predictors, while the 5C–1K and 3K–3.5 were deemed to offer only a trivial contribution to the model. In sum, for the meaning-recognition format, there were three standout bands (i.e., 2.5K–3K, 3.5K–4K, 4.5K–5K). These bands were also the dominant performers in the Yes/No and meaning-recall test as well. Comparing the meaning-recognition and meaning-recall formats directly, it appears that for the current sample of EFL learners, the higher frequency word bands (i.e., 1K–3K) offer greater predictive power in the meaning-recall test.
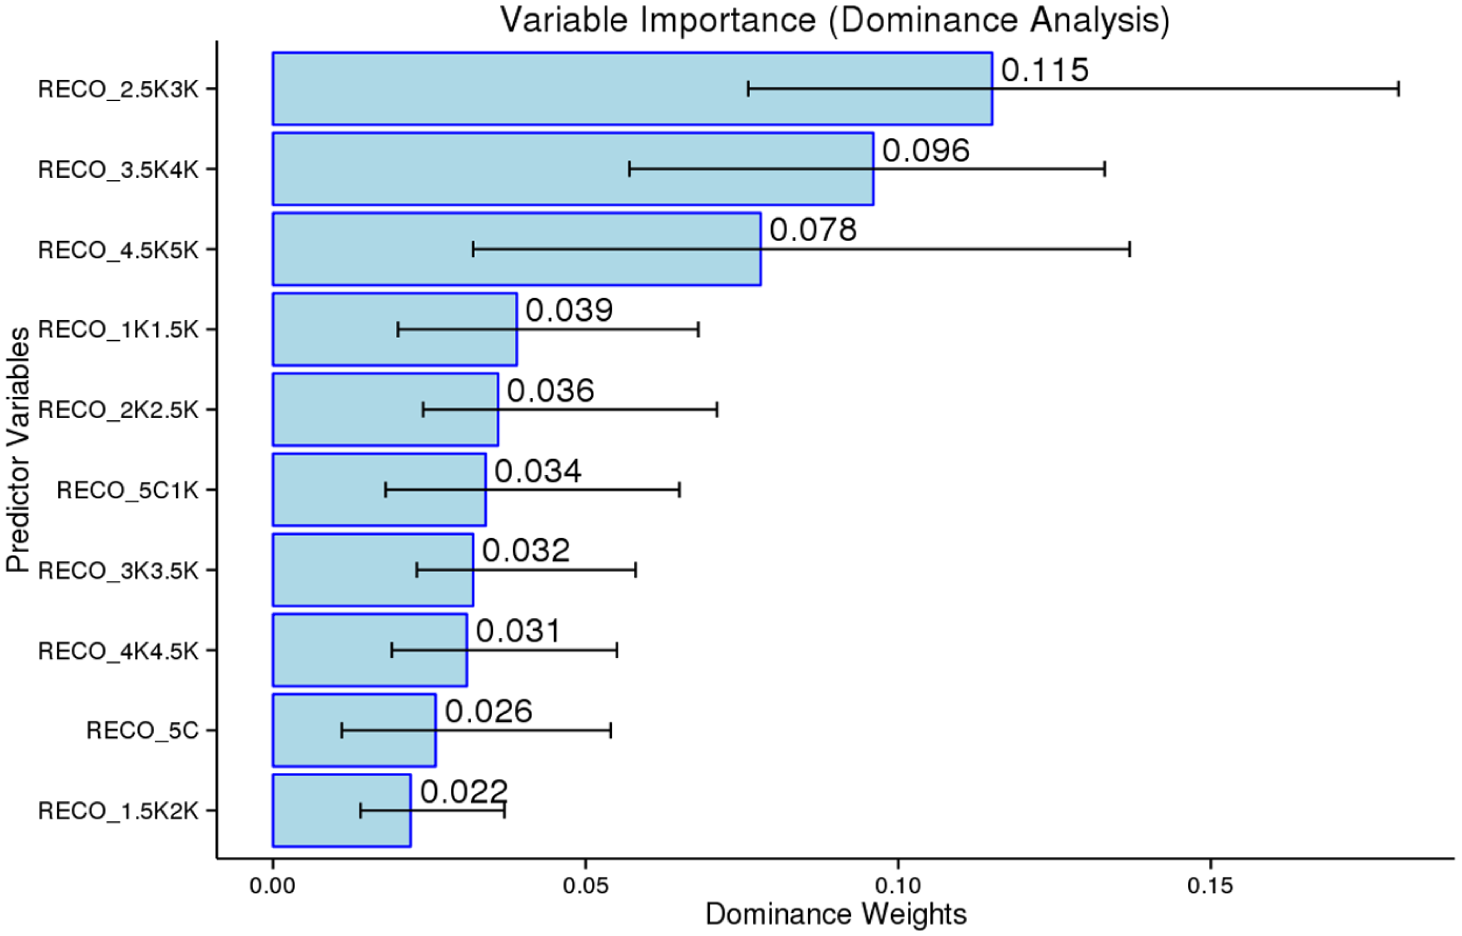
Dominance analysis of 5C bands as predictors for the meaning-recognition test.
Discussion
The current study evaluated which item format in an aural VLT (Yes/No, meaning-recall, meaning-recognition) most reliably predicted L2 learners’ listening comprehension. Unlike the primary focus of standard VLTs, which is to evaluate mastery within specific vocabulary bands, our analysis of overall mean scores showed that the AVLT’s meaning-recall format was much more challenging than the Yes/No and meaning-recognition tests. A paired-samples t-test also indicated a significant difference among the three measurements. Simply put, our three measurements of ALK revealed a hierarchy of difficulty: meaning-recall > form-recognition (Yes/No) > meaning-recognition. In Uchihara et al. (2024, p. 21), meaning-recognition scores were also significantly higher than meaning-recall scores, t = 25.27, p < .001, d = 2.37, 95% CI = [2.01, 2.72], and our observed hierarchy for measurements of ALK mirrors the one for written receptive lexical knowledge (e.g., González-Fernández & Schmitt, 2020; Laufer & Goldstein, 2004; McLean et al., 2020; Stewart et al., 2024). Our research indicates that a meaning-recall format taps into a much deeper level of L2 learners' ALK than if a VLT user applied a Yes/No or meaning-recognition format.
In response to RQ1, the total scores from all three AVLTs showed a significant correlation with L2 English listening comprehension. The Yes/No format showed a medium correlation (r = .55), while the correlations for meaning-recall (r = .63) and meaning-recognition (r = .65) were strong (Plonsky & Oswald, 2014). These medium-to-strong correlations between AVLT scores and L2 listening comprehension further support ALK’s central role in L2 listening comprehension (Vafaee & Suzuki, 2020; Vandergrift & Baker, 2015). The significantly stronger correlations observed for the meaning-recall and recognition tests also indicate that these formats are more effective at assessing L2 learners’ ability to connect a word’s phonological form with its meaning (i.e., ALK).
Despite our participants scoring almost twice as high on the meaning-recognition test (M = 238.43) compared to the meaning-recall test (M = 130.86), the strong correlation between these two measures (r = .74) and their almost identical correlations with L2 listening comprehension (i.e., r = .63 and r = .65) are noteworthy. Strong correlations between meaning-recall and recognition measurements of ALK are not unique to this study. Uchihara et al. (2024), for example, reported correlations of r = .62 and r = .57 with TOEIC listening scores for meaning-recall and recognition tests, respectively. Additionally, a meta-analysis of research assessing English learners’ receptive knowledge of ALK (Zhang & Zhang, 2022) reported average correlations of r = .58 (p < .001) and r = .50 (p < .001) for meaning-recall and recognition measures with L2 listening comprehension. The close correlations between meaning-recall and recognition with L2 listening comprehension in these studies and the current one suggest that both formats assess similar aspects of ALK. Still, a more thorough understanding of how these two item formats differ qualitatively is essential, especially in vocabulary levels testing, where the goal is to assess mastery across various vocabulary bands, not overall scores. Our discussion of the results for RQ3 offers preliminary insights into this question.
Our analysis for RQ2 revealed that meaning-recognition was the predictor variable that explained the greatest variance in L2 listening comprehension (42.5%). The item format with the second-strongest correlation with L2 listening comprehension and meaning-recall also explained a large amount of variance on its own, 40.2%. Notably, the overall variance explained by the hierarchical regression, in which we added meaning-recall first (51.7%), was slightly higher than when we added meaning-recognition first (50.9%). Our results for RQ2 also reinforced our findings from RQ1—all three item formats could explain variance in listening comprehension, with the meaning-recognition test explaining the most. Meaning-recognition also explained the most variance when added in the second step of the hierarchical model (7%), suggesting that it can explain variance above and beyond that explained by the Yes/No and meaning-recall formats.
Regarding RQ3, our multiple regression analysis reconfirmed that all three item formats could predict a significant amount of variance in our criterion measurement of L2 listening comprehension. The Yes/No version of the AVLT, regardless of the bandwidth parameters, explained the least variance in EFL learners’ listening comprehension (i.e., 1K R2 = .31; 5C R2 = .34) compared to the meaning-recall and recognition tests. The R2 values for the meaning-recall and meaning-recognition tests (i.e., 1K: R2 = .40 and .42; 5C: R2 = .43 and .48) are relatively similar across the 1K and 5C bandwidths. Notably, these R2 values across the two bandwidth frameworks are larger than the median R2 values reported for linguistic predictors in L2 research (i.e., R2 = .39; Plonsky & Ghanbar, 2018), indicating that the predictive capacity of the meaning-recall and meaning-recognition formats across the two bandwidth frameworks was large.
The 5C bandwidth framework exhibited larger R2 values than the 1K across all three item formats. This outcome was anticipated because models with more predictor variables generally explain more variance (Plonsky & Ghanbar, 2018). Regarding the bands with notable predictive capacity, the 2K band (i.e., words ranked 1001–2000) and the 2.5K–3K band (i.e., words ranked 2501–3000) from the meaning-recall test demonstrated predictive strengths for L2 listening comprehension that exceeded those of the other bands. In meaning-recognition, the 3K, the 2.5K–3K, the 3.5K–4K, and the 4.5K–5K could significantly predict L2 listening comprehension, suggesting that the predictive capacity of 3K, 4K, and 5K bands is greatest when words are selected from the lower frequency levels of a 1K band (i.e., 2.5K–3K, 3.5K–4K, and 4.5K–5K).
Implications for language teachers and testers
Our research extends our field’s understanding of vocabulary knowledge testing and VLT implementation in several ways. Most importantly, it showed that (1) the meaning-recall format offers the most rigorous approach to measuring learners’ functional ALK, (2) meaning-recognition still has useful applications for measuring ALK, and (3) narrower bands of words can be focused on in testing to rank learners in terms of their functional ALK.
Regarding the item formats, our findings show that meaning-recall and meaning-recognition tests of ALK are more effective in predicting the listening proficiency of L2 English learners than the Yes/No format. While an aural Yes/No test may be more efficient to administer, it only gauges a learner’s perceived familiarity with spoken words, not the ability to map phonological forms to semantic representations in real time. Therefore, we advise against using Yes/No formats to assess the ALK construct. Teachers or testers applying a Yes/No AVLT will likely yield an inaccurate assessment of learners' text-range size (Ha et al., 2025) or band-mastery (McLean, 2021) if it is used to measure learners’ functional ALK for listening or viewing comprehension.
Notwithstanding the construct validity argument against meaning-recognition tests, which holds that L2 listeners lack the opportunity to select the correct L1 meaning from a set of options in real-life listening (McLean et al., 2024), our findings suggest that meaning-recognition vocabulary assessments of ALK are highly relevant to L2 vocabulary research and pedagogical practices. A meaning-recognition format is more effective at capturing partial lexical knowledge (Laufer & Goldstein, 2004; Nation, 2022; Schmitt, 2010), a point that may be especially relevant in a listening test, where each question is available for a fleeting moment. The meaning-recognition format may also have primed ALK retrieval, as learners could read the four L1 answer options before listening to a test item. Likewise, the answer options could be used to cross-check the information they had just heard. A synthesis of these arguments suggests that, unlike the Yes/No and meaning-recall formats, the meaning-recognition format provides a rudimentary level of contextual information, which is almost always present during L2 listening. In all face-to-face communicative encounters, or when viewing or listening, an L2 listener will have access to some understanding of the surrounding context. Unfortunately, we did not elicit data relating to test takers’ perceptions or experiences while taking the three tests; however, it is clear from our results that the meaning-recognition test may have provided the best conditions for learners to effectively deploy their ALK, including their partial knowledge related to target words (i.e., listening with some contextual information).
Although the strong correlation results and perceived efficiency of the meaning-recognition AVLT suggest that the test would be a valuable option for busy teachers aiming to match students with lexically appropriate listening or viewing materials, it should be used only after the meaning-recall test has been experimented with. The major limitation of meaning-recall tests—that they are too time-consuming to grade—is no longer the concern it once was. Modern test systems are developing answer banks to automatically grade meaning-recall responses (e.g., vocableveltest.ca). Recent research by Stewart et al. (2025) has demonstrated that various AI tools can reliably grade meaning-recall vocabulary test responses. More importantly, however, meaning-recall responses provide teachers with a wealth of insights into their learners’ listening and ALK. To provide an example from our sample, among responses to the aural prompt “Lead. They lead very well,” 114 (65%) provided the Japanese translation for read [読む], suggesting that focused listening and pronunciation instruction on distinguishing the R/r/ and L/l/ sounds when listening (e.g., minimal pairs training) would be beneficial in this context. Meaning-recall tests are also a useful tool for vocabulary retrieval practice, in which learners recall word meanings without L1 translations rather than studying them alongside their L1 forms (paired-associates training). Retrieval practice requires greater mental effort, and preliminary research shows it produces superior vocabulary learning outcomes for both written and spoken words (e.g., Uchihara, 2023). Alongside the empirical arguments of our research findings, these practical arguments highlight the value for teachers applying an aural meaning-recall format in their classrooms.
Lastly, because the meaning-recall format was much more challenging for our L2 learners, it may offer the extra rigor required to evaluate learners’ ability to apply their ALK across diverse listening scenarios. Unlike L2 reading, L2 listening requires coping with varying speech rates and accents and often offers few opportunities to rehear what was said, underscoring the need for an item format that ensures accuracy and verifies that learners can use their ALK across diverse listening situations. In other words, when a teacher uses a VLT to help predict a learner's capacity for listening comprehension, there is a concern that a Yes/No or meaning-recognition test might overestimate ALK. Overestimating ALK can lead teachers to assign materials that are too lexically challenging for students. Therefore, we believe that to better align learners’ functional ALK with appropriate listening materials, it is preferable to underestimate ALK through a meaning-recall assessment rather than overestimate it with a Yes/No or meaning-recognition test.
Our findings regarding the 1K and 5C frameworks offer some practical implications for implementing VLTs more efficiently. In contexts where L2 learners’ proficiency is at lower-intermediate levels (i.e., CEFR bands A1–B2), rather than administering a complete meaning-recall AVLT covering the first 5000 words, a test focusing on the first 2K, or words ranked between the 1K and 3K bands, could be used to rank learners in terms of their ALK. Likewise, a meaning-recognition test of the 3K band could effectively rank our sample according to their functional ALK. Our results for RQ3 also showed that individual 1K bands predicted slightly more variance in L2 listening comprehension, as expected, since they included twice as many questions. However, the variance explained by the 5C bands was within 5% of that explained by the 1K bands, and the dominance analysis indicated that the meaning-recall test bands 1K–1.5K, 1.5K–2K, and 2.5K–3K could be used to rank learners by their ALK. In the meaning-recognition test, the 2.5K–3K, 3.5K–4K, and 4.5K–5K bands had significant predictive capacities. Still, it is important to note that our analysis did not assess mastery of knowledge for each band. Rather, we only considered learners’ overall test scores. Future research to advance Kremmel’s (2016) recommendation to use narrower bandwidths when estimating learners’ capacity for L2 comprehension will build on Ha et al.’s (2025) work in L2 reading and examine how effectively band-mastery assessment predicts learners’ capacity to comprehend spoken and audiovisual texts.
Limitations
While our research yielded significant findings, readers should consider its methodological limitations. First, we used the TOEIC Listening Test as our criterion measure of L2 listening proficiency. Although the test has ecological validity in our context and has been used in several studies on L2 English learners’ listening comprehension (e.g., McLean et al., 2015; Uchihara et al., 2024), it is specifically designed for international business communication. 3 Consequently, TOEIC may not provide the best indication of a learner’s capacity to listen outside of a business context or their ability to listen to extended talks, such as an academic lecture. Second, most VLTs contain half as many items as the AVLTs used in the current study. Future research should focus on ecological validity by testing if similar outcomes are achieved when shorter, classroom-appropriate versions of VLTs are used in ways that mirror their real-world application by teachers. Third, the sample collected from two Japanese universities includes English learners, all from a single L1 background (Japanese), with English proficiency levels spanning from A1 to B2 on the CEFR scale. To determine whether our findings can be applied to other groups of learners, this research should be replicated across multiple sites (Vitta et al., 2022) with English learners outside Japan and with higher proficiency levels (e.g., CEFR C2). Lastly, our analysis focused on learners’ overall scores across the three VLTs, rather than on whether learners achieved mastery of the different word bands. How language teachers can effectively evaluate band-mastery in VLTs to more accurately pair learners with lexically appropriate materials is a question for language testing researchers with far-reaching implications for the language classroom.
Conclusion
Evaluating three different item formats for measuring ALK, including Yes/No, meaning-recall, and meaning-recognition, we found that the meaning-recall and meaning-recognition formats best predicted L2 listening comprehension. However, contrary to previous research, the predictive capacity of the meaning-recognition test was slightly higher than that of the meaning-recall test. The current study also identified meaning-recall mastery of flemmas in the 2K and 2.5K–3K bands, and meaning-recognition of the 3K and 2.5K–3K, 3.5K–4K, and 4.5K–5K bands had the strongest predictive capacities for L2 listening comprehension. Our exploratory research revealed that a narrower bandwidth (i.e., 5C) explained greater variance than the more commonly applied 1000-word band framework. We, therefore, see merit in pursuing the efficacy of aural VLT designs that evaluate knowledge mastery of 500-word bands up to 3000. That way, teachers can make more reliable predictions about their learners’ capacity to comprehend the words most essential for listening comprehension—the highest-frequency ones.
Supplemental Material
sj-csv-1-ltj-10.1177_02655322261428738 – Supplemental material for Exploring the capacity of three item formats for an aural vocabulary levels test (VLT) to predict L2 listening comprehension
Supplemental material, sj-csv-1-ltj-10.1177_02655322261428738 for Exploring the capacity of three item formats for an aural vocabulary levels test (VLT) to predict L2 listening comprehension by Brett Milliner, Joshua Matthews and Stuart McLean in Language Testing
Supplemental Material
sj-docx-2-ltj-10.1177_02655322261428738 – Supplemental material for Exploring the capacity of three item formats for an aural vocabulary levels test (VLT) to predict L2 listening comprehension
Supplemental material, sj-docx-2-ltj-10.1177_02655322261428738 for Exploring the capacity of three item formats for an aural vocabulary levels test (VLT) to predict L2 listening comprehension by Brett Milliner, Joshua Matthews and Stuart McLean in Language Testing
Footnotes
Author contributions
Declaration of conflicting interests
The authors declared the following potential conflicts of interest with respect to the research, authorship, and/or publication of this article: The tests administered in this study were delivered via vocableveltest.ca, a freely available vocabulary testing platform for which one of the co-authors, Dr. Stuart McLean, holds the copyright.
Funding
The authors received no financial support for the research, authorship, and/or publication of this article.
Open Practices
Supplemental material
Supplemental material for this article is available online.
Notes
References
Supplementary Material
Please find the following supplemental material available below.
For Open Access articles published under a Creative Commons License, all supplemental material carries the same license as the article it is associated with.
For non-Open Access articles published, all supplemental material carries a non-exclusive license, and permission requests for re-use of supplemental material or any part of supplemental material shall be sent directly to the copyright owner as specified in the copyright notice associated with the article.