
Abstract
The main aim of this study was to investigate how oral fluency is assessed across different levels of proficiency in the Test of English for Educational Purposes (TEEP). Working with data from 56 test-takers performing a monologic task at a range of proficiency levels (equivalent to approximately levels 5.0, 5.5, 6.5, and 7.5 in the IELTS scoring system), we used PRAAT analysis to measure speed, breakdown, and repair fluency. A multivariate analysis of variance and a series of analyses of variance were used to examine the differences between fluency measures at these different levels of proficiency. The results largely replicate previous research in this area suggesting that (a) speed measures distinguish between lower levels (5.0 and 5.5) and higher levels of proficiency (6.5 and 7.5), (b) breakdown measures of silent pauses distinguish between 5.0 and higher levels of 6.5 or 7.5, and (c) repair measures and filled pauses do not distinguish between any of the proficiency levels. Using the results, we have proposed changes that can help refine the fluency rating descriptors and rater training materials in the TEEP.
Fluency has been one of the main assessment criteria in testing second language speaking ability since the 1930s when the College Board’s English Competence Examination included fluency as one of its eight key aspects of the speaking construct (Fulcher, 2003). Since then, many international tests of English as a second language have included fluency in their speaking criteria either as an independent aspect of the speaking construct (e.g., Pearson Test of English Academic, see https://www.pearsonpte.com) or in combination with other qualities of spoken performance (e.g., “fluency and coherence” as one criterion in the International English Language Testing System, or IELTS test, see https://www.ielts.org). While there is a general consensus that fluency is an important characteristic of successful oral communication, there is little agreement among test providers about how fluency is defined, understood, and measured or what features of test-takers’ speech better represent their fluency at each level of proficiency (see Tavakoli & Wright, 2020, for a full discussion). The range of fluency features stated in the rating descriptors of different testing organisations (e.g., pace, hesitation, pause, repetition, and speed) and the different conceptualisations of fluency in their rating scales (e.g., as part of coherence, delivery, pronunciation, etc.) reflect the variance in the conceptualisation and assessment of fluency.
Existing research evidence suggests that fluency rating is affected by a range of factors such as the rating descriptors, rating scales, and task type (Nakatsuhara, 2012). These influences make the assessment of fluency a challenging task. Reviewing rating descriptors from a number of key test providers, Tavakoli and Wright (2020, p. 110) noted that the existing rating descriptors (a) are often unspecific, allowing for a degree of personal interpretation of fluency, (b) are expressed in “unrealistic or confusing language” leading to raters’ confusion, and (c) are not in line with the findings of fluency research in second language acquisition (SLA). Several researchers (De Jong, 2018; Fulcher, 1996) have argued that the basis for the development of most of the rating scales is not empirical; others concede that fluency descriptors in speaking tests are based on limited empirical validation (Brown et al., 2005; Tavakoli et al., 2017). These arguments highlight the need for adopting an evidence-based and data-driven approach to developing fluency rating descriptors and scales with the aim of making the assessment of fluency more reliable and accurate. The study reported in this paper is aimed at providing empirical evidence about the assessment of fluency across different levels of proficiency in an internationally recognised test of English, the Test of English for Educational Purposes, or TEEP, which, as will be explained in more detail below, was developed by International Study and Language Institute at the University of Reading. The study also aims to offer practical implications of the findings that can help refine fluency rating descriptors and rater training materials.
Literature review
Fluency in SLA
Fluency or the ability “to communicate the intended meaning successfully and coherently in real-time” (Tavakoli & Wright, 2020, p. 103) has become an important research topic in which many sub-disciplines of applied linguistics are interested. Research in second language acquisition (SLA) has been particularly dynamic in examining the nature and construct of fluency and the factors that affect it. The attention given to fluency in SLA can be attributed to the increasing importance of fluency in oral language ability (Suzuki & Kormos, 2020), the relationship between fluency and automaticity (DeKeyser, 2007; Tavakoli, 2019), and the key role fluency plays as an indicator of global language ability (Révész et al., 2016). Interest in examining fluency has recently increased as research in artificial intelligence suggests fluency is an aspect of performance that lends itself well to automated assessment of oral language ability (Davis & Papageorgiou, 2021; De Jong et al., 2021). From an SLA perspective, fluency is particularly important as a window that allows researchers to investigate a set of cognitive processes underlying speech production (Segalowitz, 2010; Skehan, 2009; Suzuki, 2021). With all this interest in the concept of fluency, it is not surprising that over the past decades, a considerable amount of research has been conducted and major developments have been made in understanding fluency and the factors that contribute to its development.
One widely accepted claim in SLA is that fluency is a complex and multidimensional construct that is difficult to define, operationalise, and measure (De Jong, 2018; Segalowitz, 2010; Skehan, 2009; Tavakoli & Wright, 2020 among others). Early on, Lennon (1990) highlighted this complexity by identifying both a broad and a narrow use of the term. In his classification, the broad sense of fluency refers to the overall spoken ability or global proficiency of a speaker, whereas the narrow sense of fluency represents the measurable aspects of delivery including speed and interruptions. Lennon (1990) argued that for language teaching and testing purposes, it is imperative to adopt a narrow perspective to understanding fluency and to use objective measures to assess it. Following from Lennon (1990, 2000), several other researchers examined the narrow perspective of fluency (Freed et al., 2004; Gatbonton & Segalowitz, 2005) and made valuable contributions to the fields of language teaching and testing. This narrow perspective to measuring fluency, as will be discussed below, is particularly beneficial for the assessment of fluency.
A significant development in understanding this complex construct has been Segalowitz’s triadic model of fluency. Segalowitz (2010) argued that fluency should be viewed with regard to its three different but interrelated aspects: cognitive, utterance, and perceived fluency. In Segalowitz’s (2010) model, cognitive fluency refers to “the efficiency of the operation of the cognitive mechanisms underlying performance.” It also represents “the ability to efficiently mobilize and integrate the underlying cognitive processes responsible for producing utterances” (p. 48). The second aspect of fluency in this model, utterance fluency, is linked to those aspects of fluency that are measurable, for example, hesitation, speed, and pausing. The third aspect, perceived fluency, refers to listeners’ views about the speaker’s fluency (i.e., how smoothly the speakers talk, how efficiently they communicate their message, etc.). From a language testing perspective, raters are influenced by these different aspects of fluency when evaluating a speaker’s performance. By listening to samples of a test-takers’ speech, raters pay attention to the observable aspects of the speech sample (utterance fluency measures such as speed, hesitation, pausing, etc.), make assumptions about the difficulty the speaker is experiencing during performance (i.e., cognitive fluency), and provide their evaluation of the speaker’s fluidity (i.e., perceived fluency). Raters’ perceived fluency is inevitably affected by issues related to the speakers’ cognitive fluency, for example, when a speaker makes a long pause in search of the right lexical item or syntactic structure. Raters’ views may also be influenced by a range of other factors, some of which will be discussed below.
Measuring utterance fluency objectively and systematically has been an area of development in SLA research. While historically fluency has been calculated as an index of the number of words per minute or the total number of pauses longer than a second (Oppenheim, 2000), recent research has shown that a more fine-tuned approach to measuring fluency is needed to shed light on the complex nature of fluency and to tease out any differences between groups of L2 speakers. Skehan (2003) and Tavakoli and Skehan (2005) demonstrated that utterance fluency can best be represented in terms of speed, breakdown, and repair features of speech. This three-factor model was recently validated by Suzuki and Kormos (2022) who investigated the construct of utterance fluency of 128 participants across four different tasks. Their results “indicated the generalizability and robustness of Tavakoli and Skehan’s (2005) triad model of UF [utterance fluency] across different speaking tasks” (Suzuki & Kormos, 2022, p. 33). The triadic model of utterance fluency (Suzuki & Kormos, 2022; Tavakoli & Skehan, 2005) suggests that speech perceived as fluent is associated with a natural speed, short and infrequent pauses, especially in mid-clause positions, and few repair features such as repetitions and self-corrections.
Other important findings of this body of research suggest that it is necessary to (a) measure pause at a lower threshold, for example, 250 ms (Bosker et al., 2013); (b) measure speed independent of the pauses (i.e., articulation rate) and in combination with pauses (i.e., speech rate and mean length of run) (Kahng, 2014; Skehan, 2014); (c) distinguish between pauses at mid-clause versus end-clause positions (Tavakoli, 2011); and (d) examine pause in terms of quality (i.e., filled and silent pauses), frequency, and length (Hunter, 2017). Such issues in the measurement of fluency are of particular interest to recent research in SLA (Davis & Papageorgiou, 2021; Isaacs, 2018) which considers fluency as a durational aspect of speech that is appropriate for machine scoring.
Another important finding of SLA research is the impact of L1 speaking style on L2 fluency. Several studies (Duran-Karaoz, & Tavakoli, 2020; Peltonen, 2018; Suzuki, 2021) have shown that L2 speakers’ fluency is to some extent a function of their L1 fluency, implying L2 fluency can be partially predicted from L1 fluency behaviour. Cultural differences are also reported to have an influence on the speakers’ fluency behaviour. For example, Tian et al. (2017) have reported variations in the use of filled pauses among American, British, Chinese, and Japanese speakers of English. In practice, raters can only base their judgement on what they observe because they normally have no knowledge of a candidate’s individual L1 speaking style or cultural background. As such, it is currently not easy to account for such factors affecting the test-takers’ fluency in an international test.
Fluency in language testing
Language testing as a field of research and practice has continuously had high stakes in ensuring an objective and reliable assessment of fluency. Despite this importance, only a few studies have so far examined the assessment of fluency across different levels of proficiency. An early study in this area belongs to Brown et al. (2005) who examined 198 Test of English as a Foreign Language (TOEFL; see https://www.ets.org/toefl) iBT test-takers’ performances at five levels of proficiency. The prime aim of the study was to explore which features of speech distinguished each proficiency level. Analysing the data for a range of fluency features (e.g., length of run, speech rate, number of repairs, filled pauses, and number of silent pauses), the authors found significant differences across the levels for total pause time, silent pauses, and speech rate. These findings were significant as a source of validation for the TOEFL iBT rating scales as they indicated that speed and breakdown measures consistently distinguished different levels of proficiency. While this study offered the first empirical evidence supporting the validity of the assessment of fluency in a major test of English, its findings should be interpreted with caution as the fluency measures examined in the study were too generic. For example, the authors did not examine pause location, pause quality, or articulation rate in their study, and therefore, the findings are limited.
A second validation study investigating fluency across different levels of proficiency was done by Ginther et al. (2010), who examined 150 test-takers taking the Oral English Proficiency Test (OEPT; see https://www.purdue.edu/oepp/oept). Analysing speech samples in terms of speed and breakdown measures, the researchers found strong correlations (Pearson’s r) between OEPT scores and measures of speech rate (.72), articulation rate (.61), and mean length of run (.72). However, no significant correlations were found between OEPT scores and filled pause ratio (.04) or length of filled pauses measures (.01). The authors argued that the significant correlations between longer runs and OEPT scores should be scrutinised carefully: This is because raters may have been assigning a higher score to test-takers who produced longer runs because longer runs often corresponded with test takers’ use of more complex language.
The final study reported here is by Tavakoli et al. (2020), who examined fluency across different tasks and levels of proficiency in the British Council Aptis Speaking test (see https://www.britishcouncil.org/exam/aptis). The main aim of the study was to examine which measures characterised the construct of fluency across four levels of A2–C1 (in the Common European Framework of Reference, or CEFR; Council of Europe, 2014) and which consistently distinguished one level from the next. Analysing 128 speech samples from 32 test-takers taking the Aptis Speaking paper, the researchers used a wide range of measures to examine different aspects of fluency. PRAAT software (Boersma & Weenink, 2013) was used to ensure the accuracy and precision of the analysis of fluency measures. In order to avoid the limitations of previous research (e.g., Brown et al., 2005), the authors followed the findings of SLA research on fluency when measuring different aspects of utterance fluency. For example, pauses were examined in relation to their location, character, frequency, and length; measures of speed and composite fluency were separately calculated; and a range of repair measures were examined in the samples. The results of their study suggested that speed and composite measures consistently distinguished fluency from the lowest to upper-intermediate levels (A2–B2), and some pausing measures differentiated between the A2 and the higher proficiency levels. The study, however, failed to identify a clear pattern of repair measures used in relation to proficiency, concluding that a more complex process might be at play. Tavakoli et al. (2020) highlighted a few issues in the assessment of fluency in the Aptis speaking test. The findings of the study showed that some, but not all, measures of fluency clearly distinguished test-takers at different levels of proficiency. They also reported that a developmental pattern was observed for only some fluency features and only across some proficiency levels or both. For example, speed measures improved across proficiency from A2 to B2 level, but there was no further increase above the B2 level, implying a ceiling effect may have been at work. For repair measures, the absence of a developmental pattern from A2 to C1 suggested that there may be a nonlinear relationship between this aspect of fluency and proficiency development, questioning prior uses of correlational analyses in this line of investigation.
Notably, Tavakoli et al.’s (2020) was the first study to adopt a detailed and thorough perspective to examine utterance fluency and compare it to raters’ perceived fluency at different levels of proficiency in a standardised test. However, the findings should be interpreted cautiously as their dataset was small (8 participants at each proficiency level). Although these findings shed light on the complex nature of fluency and its assessment in a specific test, more research evidence is certainly needed before generalising these results further. First, further research with a larger sample is needed to examine whether the same results can be reproduced in a different testing context, with a different test task or with other test-taker populations. Doing so would widen the generalisability of the results from Tavakoli et al.’s (2020) study and accumulate more detailed information to further define fluency assessment. Second, it is necessary to highlight the practical implications of research findings that can potentially lead to making meaningful changes in rating scales and rater training materials. The current study is motivated by these two research agendas.
Aims and research questions
The study reported in this paper aims to add value to the field’s knowledge of fluency assessment by conceptually replicating (see Porte & McManus, 2019, p. 83) Tavakoli et al.’s (2020) study is in a different testing context (i.e., Test of English for Educational Purposes, TEEP), with a different task type (a face-to-face extended monologue) and a new group of participants. This should allow us to build upon Tavakoli et al.’s prior results and investigate which fluency features characterise fluency at each level of proficiency in this part of the TEEP speaking exam. It will also provide information to help us validate or modify the rating scale descriptors and rater training materials. The research will additionally help us develop a better understanding of the construct of fluency and its assessment in TEEP and provide us with an opportunity to improve the scoring validity of TEEP Speaking by indicating fluency performance benchmarks at different bands. It is worth noting that a distinctive characteristic of the current study is that it has brought SLA researchers and language testing specialists together to investigate the assessment of fluency; this should enhance the research impact as the findings can be meaningfully translated to changes in the rating scales and/or rater training materials. The research question that guides the study is:
Method
Providing a detailed linguistic analysis of the language performances produced by test-takers has recently become an insightful and informative approach to examining test-takers’ speech and validating language descriptors that define the test-takers’ linguistic performances at different levels of the rating scales (e.g., Brown et al., 2005). This approach to examining spoken performance is particularly useful as it enables researchers to explore whether these measures differentiate between adjacent levels of proficiency in a given set of rating scales. The current study builds on this approach by using a range of measures in order to examine fluency in terms of speed, silence, and repair fluency. PRAAT (Boersma & Weenink, 2013) software was used to ensure the accuracy and reliability of the measurement of the temporal aspects of fluency.
TEEP Speaking test
TEEP (see https://www.reading.ac.uk/isli/english-language-tests/teep) is a standardised test of English proficiency used and accepted by several universities in the United Kingdom as an assessment of test-takers’ proficiency before starting their university degree. TEEP was initially developed by Cyril Weir in the 1980s as part of his PhD (Weir, 1983). Since then, it has been continually refined and validated by assessment specialists and regularly taken by thousands of undergraduate and post-graduate students. Last year, TEEP was taken by 600 test-takers in the United Kingdom, China, and Malaysia.
The TEEP speaking test includes three interrelated tasks that focus on the same topic/question. The second task, an extended monologic task, requires the test-taker to speak for 3 minutes about a given topic. Test-takers are given a 4-minute planning time before they start performing the task. This time is provided to help test-takers plan for their performance, which is expected to decrease the potential cognitive load and communicative pressure involved in task performance. Table 1 provides an overview of the three tasks within the TEEP speaking test.
Structure of the TEEP speaking test.
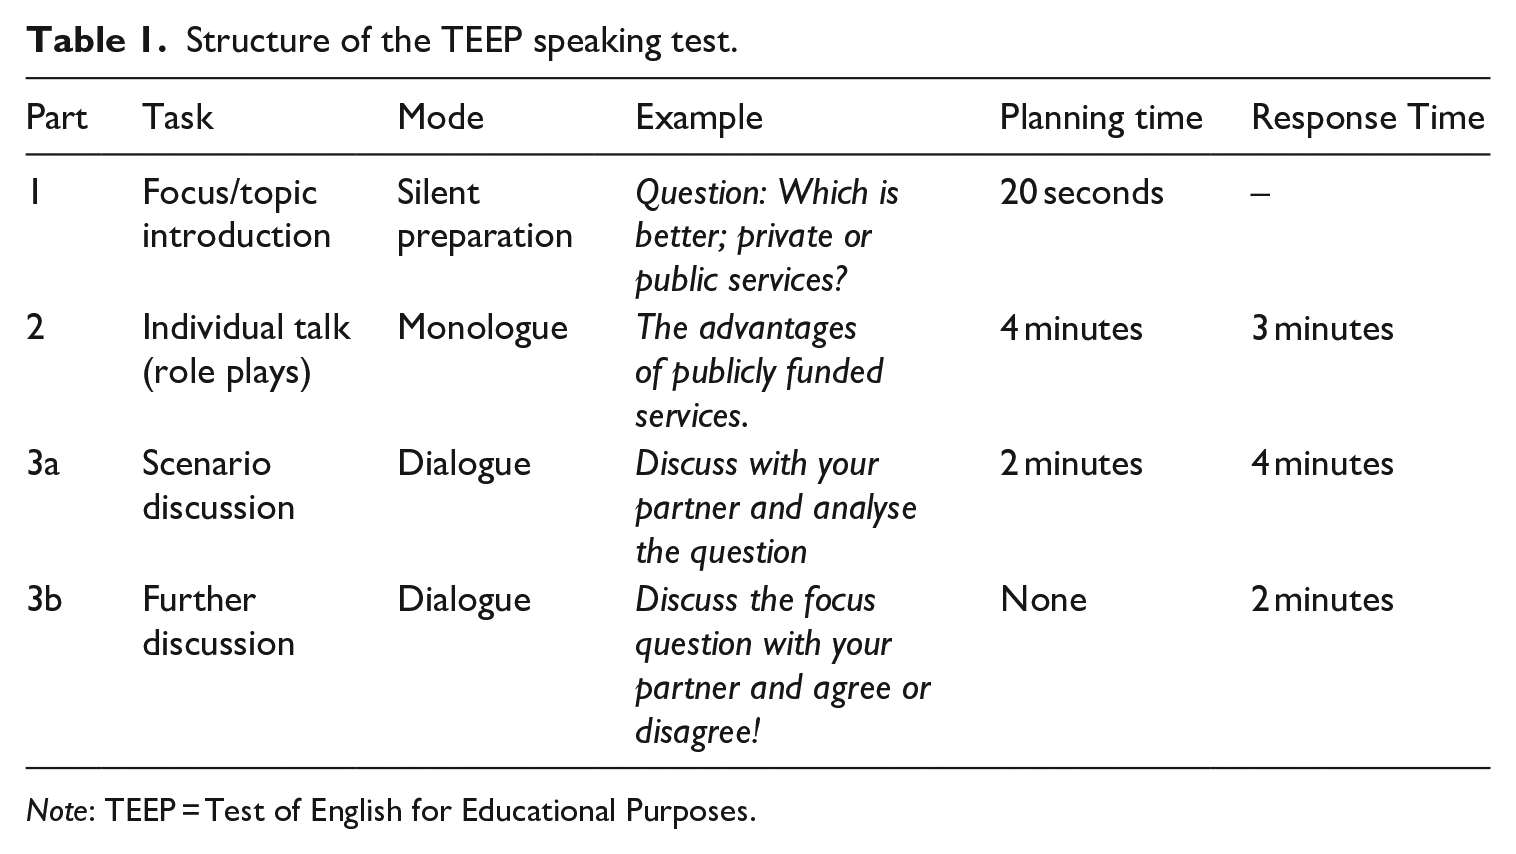
Note: TEEP = Test of English for Educational Purposes.
The speaking section of the test is rated on a 9-point scale ranging from 0 to 8 in which zero represents a speaker who makes no attempt to speak and 8 showcases a proficient speaker. Levels 3 and below are considered “limited speaker[s],” and Level 8 is considered a “very good speaker.” The TEEP speaking rating scales use both global and analytic rating scales against these criteria: explaining ideas and information, interaction, fluency, accuracy + range of vocabulary and grammar, and intelligibility. Two 1 trained examiners assess the candidates’ performance where one acts as an interlocutor and the other as an assessor. The interlocutor is responsible for introducing the questions and providing guidance before the speaking paper of the test starts. However, the interlocutor does not take part in the actual conversation. The Assessor acts as an observer, sitting quietly at the back of the room while listening and examining the test. The role of the interlocutor is to use the criteria for explaining ideas and information and interaction to provide holistic grades. On the other hand, the assessors are expected to produce both holistic grades and analytical grades for fluency, accuracy and range, and intelligibility. The common point about the assessors and interlocutors is that in order to assess the candidate’s performance, they both rely on a set of validated marking scales and marking descriptors for each of the five criteria mentioned earlier. The seven marks 2 given by the examiners are averaged, thereby giving more weight to the holistic criteria. The interrater reliability is calculated based on the explanation of ideas and interaction sub-scores awarded by both raters. In addition, internal test consistency is monitored to make sure that all criteria, including fluency, are distinguishing between proficiency levels reliably.
There are two important issues to consider in relation to the TEEP scales for fluency. First, it is necessary to note that, similar to many other international tests of English (e.g., IELTS), the fluency criterion does not only reflect fluency in the sense described in this article; the TEEP fluency criterion also describes what might be termed effectiveness of communication. This overlap between fluency and effectiveness of communication is related to the interrelationship between fluency and communicative adequacy (see a full discussion of the relationship in Révész et al., 2016). Second, although examiners award half-band marks (e.g., 5.5, 6.5, etc.), rating descriptions are only available for whole bands. This approach has been adopted to reduce the cognitive load on examiners who need to make decisions under time pressure. 3
Materials
A key challenge in the choice of the materials in the current study was selecting proficiency levels for the purpose of analysis. The data provided by ISLI ranged from 5.0 to 8.0 with adequate samples for all levels between 5.0 and 7.5. However, given the small scope of the study, it was impossible to analyse 15 participants at each level of proficiency. For this reason, a strategic decision was made. The selection was based on the proficiency levels that were key entrance points to university studies in the United Kingdom. For example, 5.0 is considered the minimum recommended entry requirement for English-language programmes, 5.5 is the minimum component score required to meet visa requirements for university study, and overall scores of 6.5 to 7.5 are required for entry to degree courses depending on the particular programme. The study therefore examined 15 (except for level 5.0 where there were only 11) test-takers’ audio-recorded performance in TEEP Speaking task 1 at each different level of proficiency (5.0, 5.5, 6.5, and 7.5), totalling 168 minutes of recordings (i.e.,15 × 4 levels × 3 minutes) from 56 test takers. The samples were selected based on the fluency criterion score. The sample included performances of candidates from 16 countries, with Chinese, Thai, Kazakh and Saudi Arabian students being the 4 largest nationality subgroups. Other nationalities included in the sample were Brazilian, Japanese, Cypriot, Greek, Indian, Italian, Jordanian, Korean, Omani, Taiwanese, and Turkmen. The candidates’ age ranged between 19 and 47.
Measures of analysis
Our choice of fluency measures in this study is based on the findings of previous research. In a meta-analysis of research on L2 fluency, Suzuki et al. (2021) concluded that perceived fluency (including ratings of fluency) is strongly associated with speed and pause frequency and moderately with pause duration. They also suggested that perceived fluency is only weakly related to repair fluency. The only study that specifically examined fluency across levels of proficiency, Tavakoli et al. (2020), included a range of measures of fluency reported in recent L2 studies including pause length, pause frequency, pause location, mean length of run, speech rate, and a selection of repair measures. However, many of these measures were not sensitive enough to differentiate speakers at neighbouring proficiency levels. Special care, therefore, was taken to include measures that reflected the features of performance relevant to the fluency construct defined within the TEEP Speaking rating scale. This allowed us to investigate whether these analytic measures were truly representative of the proficiency levels assessed in the test. The measures adopted in this study are:
Speed
Articulation rate: mean number of syllables per minute divided by mean amount of phonation time (excluding pauses)
Speech rate 4 : mean number of syllables per minute divided by total time (including pauses)
Breakdown
Frequency of silent pauses per 60 seconds at mid-clause and end-clause positions
Mean length of silent pauses per 60 seconds at mid-clause and end-clause positions
Repair
Total number of repair measures per 60 seconds (repairs included repetitions, false starts, reformulations, and self-corrections)
Procedures
Before subjecting the data to analyses using the PRAAT speech editing software, the data were transcribed. A total of 10% of the transcriptions were second coded to ensure the accuracy of transcriptions for which a 95% agreement was achieved. PRAAT analysis was then used to identify the fluency measures. A brief overview of the use of our PRAAT analysis is presented below.
We used PRAAT’s “textgrid to silences” feature (e.g., de Jong & Perfetti, 2011) which automatically detects silence in a speech sample. All task performances were converted to .wav format to be compatible with PRAAT. To identify silent and filled pauses, one of the researchers listened to small stretches of the recording repeatedly while inspecting the spectrograms visually. Following this careful inspection, we marked silences of .25 of a second or longer and considered them as pauses. Many L2 fluency researchers count syllables from orthographic transcriptions of the speech and use this count as the basis of calculating speed measures (e.g., Tavakoli & Skehan, 2005). While this approach to measuring speed can be useful, we have argued that in spontaneous speech, especially speaking samples from language learners, counting syllables may not be a reliable measure as the number of syllables a learner produces orally may not conform with the syllables that are expected (e.g., when the learners add a vowel at the end of all final consonants). For this reason, we decided to use a manual-counting approach to calculating the number of syllables while listening to the original recordings. We also considered non-verbal fillers of shorter than .25 seconds in length and words that were partially produced as a syllable. All test-takers’ spoken performances were analysed a second time to ensure intrarater reliability of the measurement.
Results
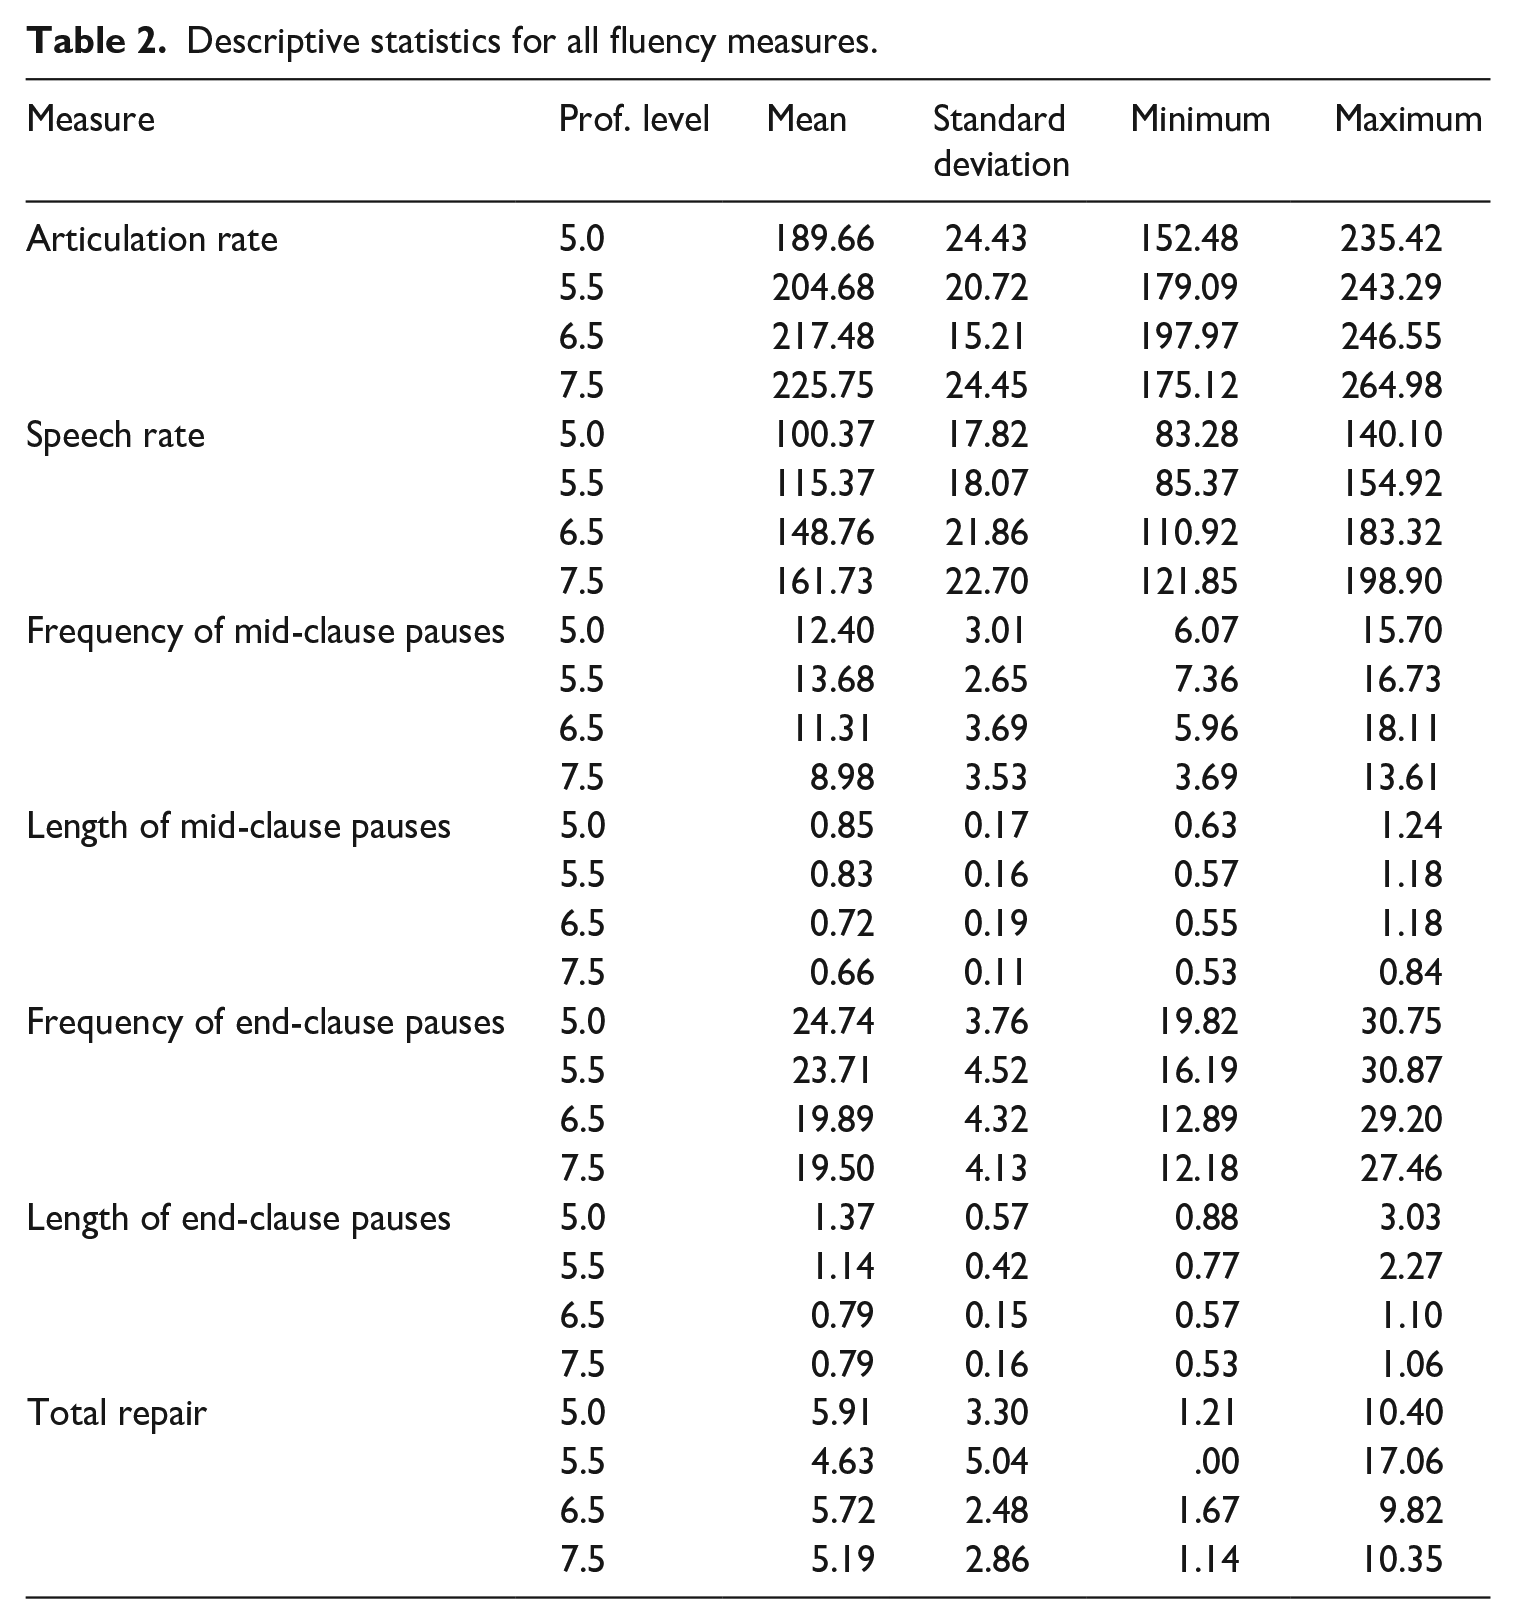
Given the numerous dependent variables of the study, a multivariate analysis of variance (MANOVA) was used to investigate the effects of the independent variable of the study (i.e., proficiency level) on different aspects of oral fluency. As we used a range of different fluency measures in this study, a MANOVA allowed us to explore whether the between-group effect of proficiency level on the combination of dependent variables was statistically meaningful. When running a MANOVA, the relationship between sample size and the number of variables entered in the analysis should be carefully considered. According to Tabachnick and Fidell (1996), the number of subjects in each cell of the multivariate analysis should not be fewer than the number of variables entered in the MANOVA. For this reason, a decision was made to enter one measure for each aspect of fluency. Following previous research in this area (Kahng, 2014; Skehan, 2014; Tavakoli et al., 2017; Tavakoli & Skehan, 2005), the measures reported to be most representative of each dimension was chosen: Articulation rate to reflect speed fluency, speech rate to indicate composite fluency, frequency of mid-clause and end-clause pauses to demonstrate breakdown fluency, and the total number of repairs to show repair fluency. The descriptive statistics for all fluency measures across different proficiency levels is provided in Table 2 below.
Descriptive statistics for all fluency measures.
If the results of the MANOVA reveal significant differences between different measures of fluency across levels of proficiency, we will continue to run one-way analyses of variance (ANOVAs) to investigate the differences across different proficiency levels. Effect sizes were calculated to show the power of the significant results. To interpret effect sizes, we adopted Plonsky and Oswald’s (2014) framework that suggests effects sizes below .4 should be considered as small and above .7 as large. In what follows, we first present a summary of the results of the MANOVA. Then, the major findings of the ANOVAs will be reported.
Multivariate analysis of variance
We checked multivariate normality through a linear regression analysis. The result of the Mahalanobis 5 distances showed that our largest Mahal distance figure was 20.06 which is only slightly lower than the critical value of 20.52 suggested for a five-dependent variable test (Pallant, 2014), implying that no substantial multivariate outliers were detected in the dependent variables. We also ran Pearson correlations to examine the multicollinearity of the data set. The results of the correlation analysis showed that the dependent variables were moderately correlated (correlation coefficients ranging between r = .164 and r = .665). Levene’s Test of Equality of Error Variances reassured us that the assumption of equality of variance was not violated for any of the measures of the analysis. Despite these findings, we decided to consider a more strict alpha level to ensure the reliability of the findings (i.e., a Bonferroni-corrected alpha level of .05/5 = .01).
The Multivariate test indicated that there was a significant main effect of proficiency level on performance (Wilks’ λ = .330; F = 4.37, p = .001; η2 = .310). When further results were inspected, four significant differences were observed. These significant results were for: (a) articulation rate (F = 6.98, p = .001; η2 = .287); (b) speech rate (F = 25.98, p = .001; η2 = .600); (c) frequency of mid-clause pauses (F = 5.50, p = .002; η2 = .241); and (d) frequency of end-clause pauses (F = 5.30, p = .003; η2 = .234). These results allowed us to continue with further analysis (e.g., ANOVAs) to identify whether there were statistically meaningful differences for individual measures across proficiency levels, and if so, where these differences were located.
Analyses of variance
A number of ANOVAs were run to examine the effects of proficiency level on each of the fluency measures. Bonferroni post hoc comparison and a corrected α level of 0.01 were used to explore the significant differences across different levels. A summary of the findings is presented below for speed, breakdown, and repair fluency. Each analysis is followed by a corresponding figure that visually demonstrates the fluency patterns for all four levels.
Speed fluency
Below, we present the results of the analyses for measures of articulation rate and speech rate.
Articulation rate
A significant difference was observed for articulation rate across different levels of proficiency (F = 6.98, p = .001, η2 = .287). The post hoc analysis showed that the 5.0 level was not statistically different from 5.5, but there was a significant difference between 5.0 and the other higher levels (i.e., 6.5 and 7.5). Similarly, 5.5 was not different from 6.5 or 7.5. It is important to note that although the articulation rate consistently increased across all different levels (7.5 > 6.5 > 5.5 > 5.0), the difference was not significant for adjacent levels. Since articulation rate, as discussed earlier, is the only pure measure of speed (i.e., it is not combined with pauses), the finding may suggest that a statistically meaningful difference is only observed for speed when comparing levels that are more than a band apart (e.g., between 5.0 and 6.5, and 5.5 and 7.5). The results can be seen in Figure 1.
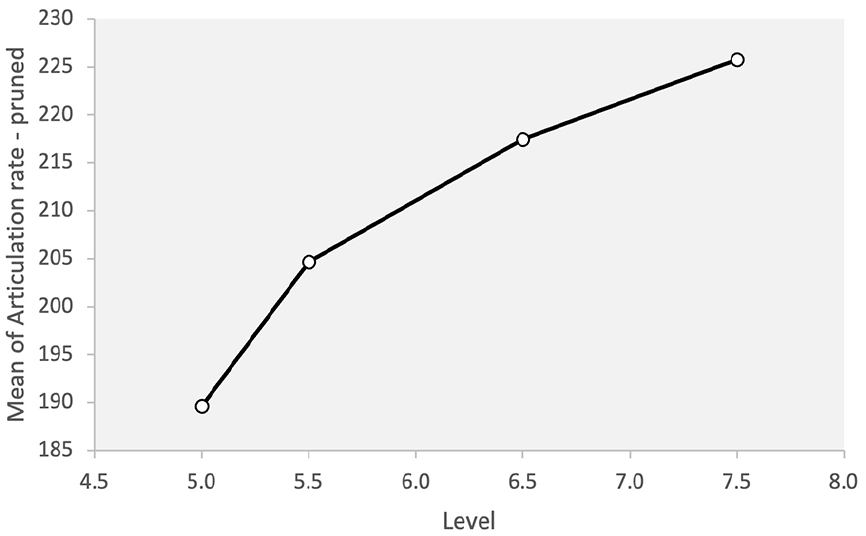
Articulation rate across proficiency levels.
Speech rate
A significant difference was observed for speech rate across different levels of proficiency (F = 25.98, p = .001, η2 = .600). The post hoc analysis showed that 5.0 and 5.5 levels were not different from one another, but they were both statistically different from 6.5 and 7.5 levels. However, the two upper levels were not different from one another. This is to say, when speech rate was considered, the higher proficiency levels acted differently from the lower levels but not from one another. The speech rate at different levels was 7.5 > 6.5 > 5.5 > 5.0. Figure 2 shows the results for speech rate across different levels.
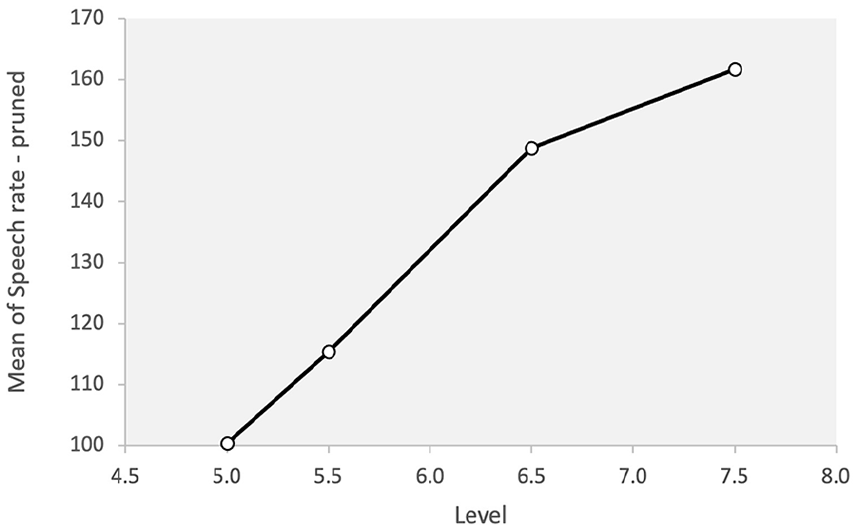
Speech rate across proficiency levels.
Breakdown fluency
In what follows in this section, we present the results of the analyses for measures of frequency of mid-clause pauses, length of mid-clause pauses, frequency of end-clause pauses, and length of end-clause pauses.
Frequency of mid-clause pauses
A significant difference was observed for the frequency of mid-clause pauses across different levels of proficiency (F = 5.51, p = .002; η2 = .241). The post hoc analysis showed that level 7.5 was statistically different from 5.5 but not from level 5.0 or 6.5. In fact, no other significant difference was observed. This indicates that although the high proficiency group paused less frequently than the 5.5 level, the frequency of mid-clause pausing did not distinguish between the other levels. Interestingly, the frequency of this type of pause was lower for the 5.0 group than the 5.5 group, suggesting the 5.5 level paused more frequently in mid-clause positions. The relationship was 5.5 > 5.0 > 6.5 > 7.5. Figure 3 shows the results for the frequency of mid-clause pauses.
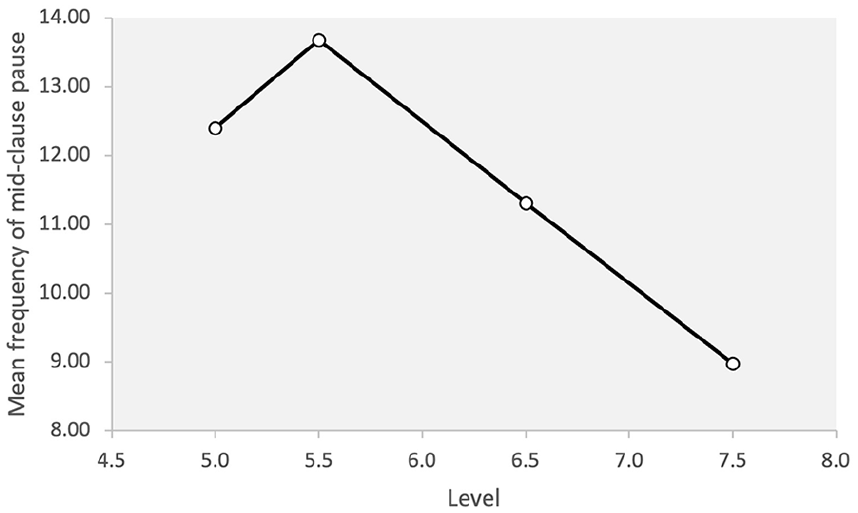
Frequency of mid-clause pauses across proficiency levels.
Length of mid-clause pauses
A significant difference was observed for the length of mid-clause pauses across different levels of proficiency (F = 4.59, p = .006, η2 = .209). The post hoc analysis showed that the 7.5 level was significantly different from the two lower levels, 5.0 and 5.5, although there was no significant difference between the 6.5 and the other levels. That is, in terms of the length of mid-clause pauses, the highest proficiency group produced significantly shorter pauses in mid-clause positions than the lowest two levels. There was a steady decrease in the length of mid-clause pauses across different levels with the length of pause decreasing with an increase in proficiency 5.0 > 5.5 > 6.5 > 7.5 (Figure 4).
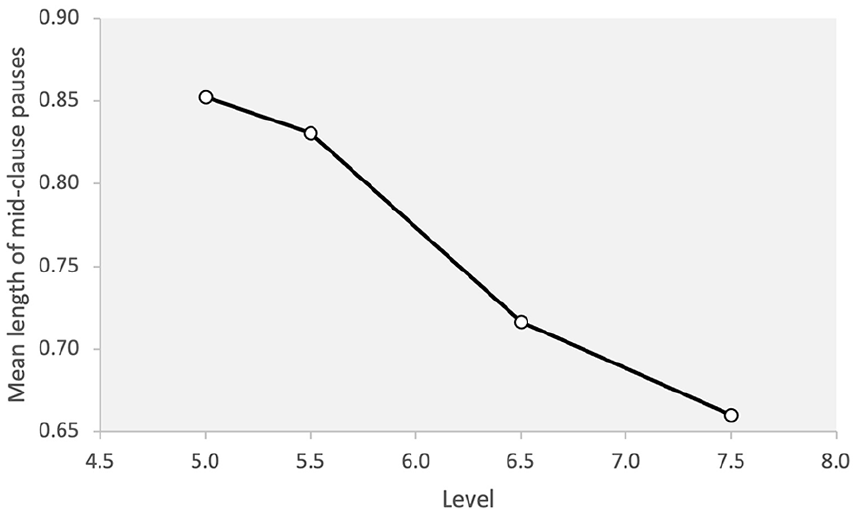
Length of mid-clause pauses across proficiency levels.
Frequency of end-clause pauses
A significant difference was observed for the frequency of end-clause pauses across different levels of proficiency (F = 5.31, p = .003, η2 = .234). The post hoc analysis showed that the difference is significant between the lowest proficiency level, 5.0, and the two highest levels although there was no significant difference between the 5.5 level and the other groups. Overall, there was a steady decrease in the frequency of end-clauses pauses across all the levels 5.0 > 5.5 > 6.5 > 7.5. The results are demonstrated in Figure 5.
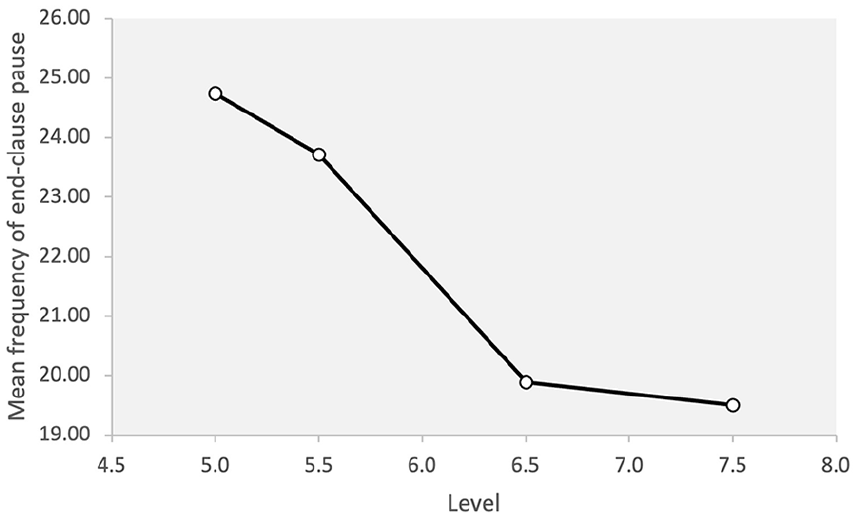
Frequency of end-clause pauses across proficiency levels
Length of end-clause pauses
A significant difference was observed for the length of end-clause pauses across different levels of proficiency (F = 8.45, p = .001, η2 = .328). The post hoc analysis showed that the difference between the lowest level, 5.0, and the highest two levels, 6.5 and 7.5, was significant. The speakers in the lowest proficiency level group paused for longer than those in the highest two proficiency levels. There was no significant difference between the 5.5 level and the other groups. The length of end-clauses pauses decreased across the low and mid-levels with 5.0 > 5.5 > 6.5 while the mean values for the two highest levels were very similar (Figure 6).
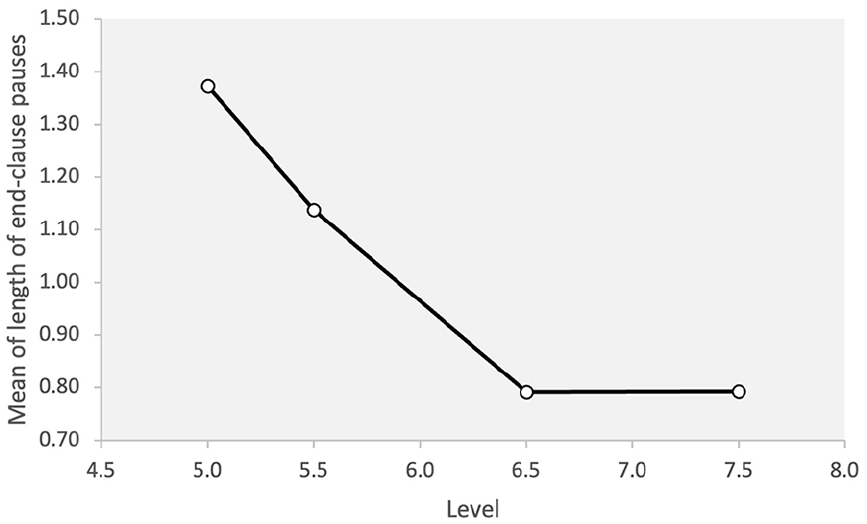
Length of end-clause pauses across proficiency levels.
Repair fluency
Below, the results of the analyses are presented for total repair.
Total repair
A significant difference was not observed for the total amount of repair across different levels of proficiency (F = .352, p = .778, η2 = .020). The descriptive statistics for total repair shows that there was a large variation among the test-takers in the repair measures they used in each of the four levels. The relatively large standard deviations and the far-apart minimum and maximum scores for total repair reflect such variance. Figure 7 shows the use of total repair across the four levels of proficiency in the data.
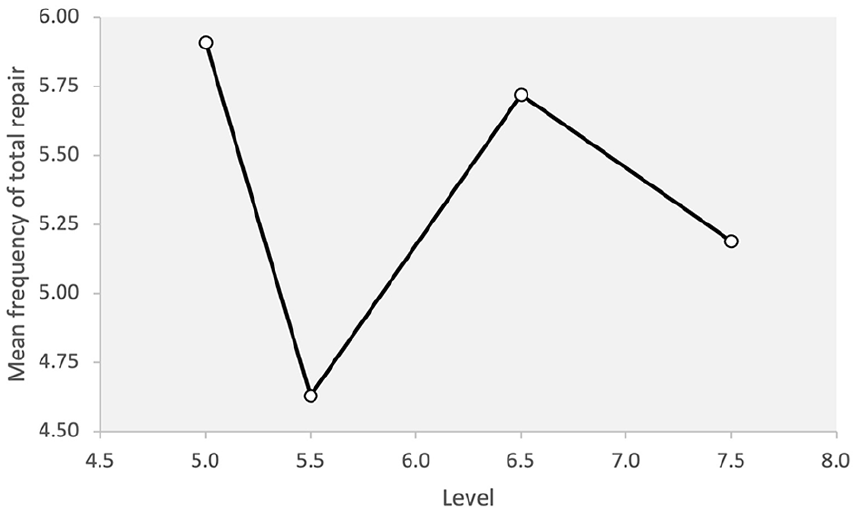
Total repair across proficiency levels.
Given the interest of this paper in the assessment of fluency in TEEP speaking test, we analysed the results for length and frequency of filled pauses and other repair measures (repetitions, false starts, reformulations, and self-corrections) across the four proficiency levels. The analyses indicated non-significance results for length of filled pauses (F = 0.16, p = .921, η2 = .009), frequency of filled pauses (F = 2.37, p = .081, η2 = .021), repetitions (F = .044, p = .987, η2 = .003), self-corrections (F = 1.306, p = .282, η2 = .070), and false start and reformulations (F = .185, p = .906, η2 = .011).
Discussion
The findings of the study for RQ1 are summarised and discussed below in relation to previous research in this area. We will then discuss the changes proposed in the TEEP fluency scales. Overall, the results of the analysis indicated that (a) measures of speed and breakdown fluency demonstrate a linear relationship with proficiency, (b) speed and breakdown measures distinguish across some levels of proficiency, and (c) measures of filled pauses and repair do not distinguish across any levels of proficiency; neither do they demonstrate a linear relationship between proficiency and repair fluency. The obtained significant differences for speed and breakdown fluency measures showed small to moderate effect sizes (Plonsky & Oswald, 2014) ranging from .209 to .600, suggesting a considerable amount of the variance in the raters allocating test-takers to each proficiency level can be explained by the speed and breakdown aspects of the test-takers’ performance. The results of the analyses for repair and filled pauses, however, indicated that a consistent pattern of use across the different levels of proficiency could not be established. We will discuss the findings for different aspects of fluency separately.
Speed measures
The analysis suggested that speech rate, a global measure of fluency, distinguished the lower levels, that is, 5.0 and 5.5 from the higher levels of 6.5 and 7.5, but there were no statistically significant differences between the two levels of 5.0 and 5.5, or between the higher levels of 6.5 and 7.5. These findings are in line with previous research in this area (e.g., Tavakoli et al., 2020) in which lower proficiency levels were statistically slower than those in higher levels, but in each group, the individual levels were not different. As for the articulation rate, the 5.0 level is different from all, but the other three levels were not different from one another. In other words, when considering pure speed (speed excluding pauses), articulation rate only distinguished very low-level speakers from the higher levels. Although a consistent pattern of increase can be seen in speed-oriented fluency measures (speech rate and articulation rate), it is intriguing to note that the two higher levels of 6.5 and 7.5 are not statistically different. The lack of distinction between the speed in the higher proficiency groups is reported in previous research in this area (Tavakoli et al., 2020) and has been interpreted in the light of a ceiling effect.
We measured speech rate and articulation rate separately, as they reflect two aspects of speed, with the former considering speed including pauses and the latter providing “a speed-only view of fluency” (Tavakoli et al., 2017, p. 28) by excluding pauses. The results also suggest that the two measures can help distinguish two different qualities of speech in proficiency groups. Speech rate provides an overall/global view of the speed with which language is produced, whereas articulation rate disregards pausing patterns and behaviours of individuals and focuses on only speed. While both measures provide a useful insight into how language is produced, from a language testing perspective, speech rate might be considered as a quality of speech that is more central to communicating the intended message.
Breakdown measures
The results of the analysis of silent pauses showed that for the length of mid-clause silent pauses, the two lower levels were different from higher levels suggesting that low-proficiency speakers make longer mid-clause pauses than those at a higher level. Interestingly, the consistent pattern of decrease in the length of mid-clause pausing as proficiency increases suggests that the test takers produced shorter mid-clause pauses at higher levels. For end-clause pauses, the 5.0 level was different from both higher levels (6.5 and 7.5), whereas the 5.5 level was not different from the others. End-clause pauses made at 6.5 and 7.5 levels were almost identical, implying that the key difference for end-clause silent pausing behaviour exists between the lowest and highest proficiency levels.
The analyses of the frequency of silent pauses suggested that speakers at lower levels pause more frequently at both mid and end-clause positions. For mid-clause position, 5.5 level paused most frequently and 7.5 paused the least. It seems surprising that the 5.5 level paused more frequently than the lowest level (5.0). This can perhaps be explained in the light of the fact that at the lowest level (5.0), fewer clauses were generally produced, and therefore there were fewer opportunities to pause at a mid-clause position. This highlights the need for a more qualitative evaluation of pausing behaviour across different levels of proficiency. For end-clause pauses, there was a steady pattern of decrease in the number of end-clause pauses from 5.0 level to 7.5 levels, with the 5.0 level being statistically different from the other three.
It is worth noting that the results of the ANOVAs for length and frequency of filled pauses did not show any significant differences across proficiency levels, suggesting that filled pauses cannot be used as a feature of speech that distinguishes different proficiency levels. This finding is in line with previous research in this area (e.g., Tavakoli et al., 2020).
Repair measures
The results of the ANOVAs showed no statistically significant differences across proficiency levels for total repair (or any other repair measures). We have made some interesting observations in the repair behaviour of the speakers across proficiency levels. First, although higher proficiency level speakers produced fewer repetitions, there was very little difference between the means of the groups (e.g., a mean of 3.70 for the lower and 3.90 for the higher group). Second, it is interesting to see the 5.5 and 7.5 levels produced more reformulations. The overuse of repair measures at 5.5 level, also observed in Tavakoli et al.’s (2020) study, has interesting interpretations. First, it can be argued that learners’ language monitoring processes (reformulation, self-correction, etc.) become active at this level of proficiency. Learners at lower levels may not be able to notice the need to reformulate their output or self-correct their utterances; it is also possible to postulate that the learners at lower levels may not have the knowledge and skills to do so. Tavakoli et al. (2020, p. 28) interpreted the high number of repair measures at the 5.5 level as “activation of repair processes” at this stage of proficiency. Another interpretation of this finding is that the frequent repair measures produced by the test-takers at the 5.5 level might be linked to their pausing patterns. As demonstrated above, test-takers at a 5.5 level of proficiency produced the highest frequency of mid-clause silent pauses as well as the most repetitions. Taking these results together, one can argue that test-takers at the 5.5 level paused more frequently when repeating words and expressions.
An interesting observation we have made is that the 7.5 level produced the highest number of reformulations; this was followed by Level 5.5 which produced the second highest number of reformulations. There is research evidence to suggest that the reformulations made by the two groups are different in nature and purpose, as test-takers at lower levels reformulate their language to improve accuracy, whereas at the 7.5 level, test-takers reformulate to achieve other goals including appropriacy and communicative intention (Nakatsuhara et al., 2019).
Our results also indicate that some temporal fluency measures seem to lend themselves well to automated assessment of fluency. Speech rate and mid-clause pause length distinguishing lower proficiency from higher levels, for example, can be used as representative features of fluency to train the machine during the feature extraction phase of the automated scoring of fluency (Xu et al., 2021). While it has been described as “an opaque black box” by Khabbazbashi et al. (2021, p. 333), findings of studies such as ours can shed light on the automated scoring of fluency.
In sum, our findings support previous research in this area suggesting ratings of fluency are strongly linked with speed and pause measures and have a weak relationship, if any, with repair fluency measures. The most important findings of our study suggest that
Speech rate distinguishes 5.0 and 5.5 from 6.5 and 7.5 levels reasonably consistently. The two levels of 6.5 and 7.5 are not different in terms of speed fluency.
The articulation rate distinguished 5.0 from the other groups.
The length of mid-clause silent pauses distinguishes 5.0 and 5.5 levels from the 7.5 level. The length of end-clause pauses distinguishes 5.0 from higher levels of 6.5 and 7.5.
The frequency of mid-clause silent pauses distinguishes 5.5 from the 7.5 level. The frequency of end-clause silent pauses distinguishes 5.0 from 6.5 and 7.5.
The repair measures and measures of filled pauses do not distinguish between proficiency levels.
Practical implications of the findings
The current study was keen to examine whether any changes were needed to align the existing TEEP fluency descriptors with the empirical findings of the study. The findings have yielded useful research evidence to support the current fluency descriptors by confirming that the rating scale covers many of the fluency measures identified as important by fluency research (e.g., speed of articulation and breakdown measures at relevant band levels). In band 6.0 of the TEEP Speaking, for example, the descriptors refer to ‘search[ing] for words and hesitat[ing] at times.’ 6 The empirical evidence from the present study also lead us towards the expansion and refinement of elements of the fluency descriptors in the TEEP speaking scale. Such revisions will help us achieve a more comprehensive and consistent construct coverage across all levels of proficiency. For example, speed measure descriptors for TEEP levels 7.0 and above are to be revised to refer more explicitly to the rate of articulation, reflecting the findings that speed distinguishes the higher (TEEP 6.5–7.5) levels from the lower levels (TEEP 5.0–5.5). The descriptors for breakdown measures should also be enhanced by differentiating between mid-clause and end-clause pauses at each proficiency level, as these have been shown to be key.
In addition to the abovementioned changes to the scale, the study findings can be used to enhance the existing rater training programme which provides more scope for including useful detail and examples. These would be harder to include in the rating scale without making it less concise or user-friendly. First, the rater training materials should be revised to raise raters’ awareness of TEEP level 5.5 being a repair measures activation threshold. Second, the fluency descriptors of breakdown measures for levels 5.0 – 7.5 should be expanded to include references to the frequency and position of pauses. Raters should also be sensitised to the fact that filled pauses do not tend to distinguish between proficiency levels, and therefore cannot be used as a measure to award higher grades for candidates’ performance.
Conclusion
The study reported here is a good example of interdisciplinary research that is of interest to both SLA and language testing disciplines. It is also a good example of an initiative that can bring SLA researchers and language testing specialists together to work on areas of mutual interest and to reduce the gap between research and practice. Most importantly, the current study should be perceived as impactful as it has practical implications for refining fluency rating scales and rater training materials, enhancing the assessment of fluency in TEEP in particular.
The current study contributes to research on the assessment of fluency through conceptually replicating and building upon the findings of previous research (Tavakoli et al., 2020) with a larger sample, new task, and different testing context, suggesting consistency of the results can be used in assessing fluency not only for TEEP but for other L2 speaking tests. The findings are also in line with recent research in this area (Suzuki & Kormos, 2020, 2022; Tavakoli et al., 2020) that suggests studies of this kind “reinforce the original hypothesis or clearly build upon its underlying theory” (Porte & McManus, 2019, p. 94) and help with the development of a more systematic approach to measuring and assessing fluency. The results confirm previous research in this area and demonstrate that speed and breakdown measures are capable of distinguishing proficiency levels, but repair measures do not show either a linear relationship with proficiency level or a clear pattern of development as proficiency develops. Suzuki and Kormos (2022) have argued that repair measures are, to a great extent, moderated by the effects of task type, and therefore, it is highly probable that different results might be achieved when examining performance in a rather different task. This finding (i.e., lack of consistency of repairs across proficiency levels) is rather striking as many international language tests draw on repair measures in distinguishing proficiency levels. Observing a ceiling effect for speed fluency is also an important finding to be considered by rating scale/descriptor developers. The findings of the study are important as they strengthen the existing evidence that enables researchers to develop automatic scoring of fluency for the purpose of language assessment (Davis & Papageorgiou, 2021; De Jong et al., 2021; Isaacs, 2018).
It is necessary to note some limitations of the current study. While its sample size is larger than previous studies in this area (e.g., Tavakoli et al., 2020), it still draws on a relatively small sample taken from some (but not all) key proficiency levels. It also focuses on a monologic task and therefore it leaves us with the question of how dialogic performance is assessed in terms of fluency. Finally, this study draws on a linguistic analysis of fluency in terms of speed, breakdown, and repair. Bringing other perspectives (e.g., a discourse analysis view) will undoubtedly enhance ours and the field’s understanding of fluency at each level of proficiency.
Footnotes
Acknowledgements
We are grateful to the International Study and Language Institute at the University of Reading for funding the study and making the data available to us. We would also like to thank Dr. Ann-Marie Hunter for her invaluable help with the measurement of fluency and her insightful comments on the first draft of the manuscript. We are particularly grateful to the journal editor and anonymous reviewers for their constructive feedback.
Declaration of conflicting interests
The authors declared no potential conflicts of interest with respect to the research, authorship, and/or publication of this article.
Funding
The authors disclosed receipt of the following financial support for the research, authorship, and/or publication of this article: The authors received University internal funding from International Study and Language Institute to support the research and authorship of this article.