
Abstract
The Peabody Picture Vocabulary Test (PPVT) is a widely used test of receptive vocabulary, but no researchers to date have examined the performance of low-educated, low-literate L2 adults, or compared these individuals’ performances to their more highly educated peers. In this study, we used many-facet Rasch analysis and mixed-effects linear regression to determine the impact of educational background and other demographic variables on PPVT test performance. The analyses rely on the performance data of 1,014 adult learners of Dutch as a second language on the Dutch version of the PPVT (PPVT-III-NL). The results show that a substantial proportion of score variance can be attributed to educational background variables and to the educational tracks the participants followed. These tracks, which cater to the needs of different L2 learner profiles, appear to exacerbate rather than mediate any performance differences. Although this study provides evidence of performance differences and differential item functioning resulting from linguistic, demographic, and educational variables, it offers no data to invalidate the use of the PPVT on low-educated L2 adults.
Keywords
Given the predominance of college-educated participants from western societies in applied linguistic research, it is unsure whether the instruments, theories, and hypotheses that are central to second language acquisition (SLA) are valid for all second language learners (Andringa & Godfroid, 2020; Tarone & Bigelow, 2012). One group for which it might be difficult to generalize research findings is low-literate learners (Boltzmann et al., 2013; Dehaene et al., 2015; Demoulin & Kolinsky, 2016). Although low-literate participants cannot typically be included in studies in which reading or writing is an integral part of the design, useful work can be done in the domain of orally assessed vocabulary (Carlsen, 2017). The goal of the current study is to assess whether learners with diverging literacy levels perform differently on a standardized receptive vocabulary test. In this paper, we examine test performance variability as a function of literacy and educational background, using a widely employed test of receptive vocabulary: the Peabody Picture-Vocabulary test, or PPVT (Dunn et al., 2005)
In this study, we operationalize three levels of alphabetic literacy: full functional literacy, functional illiteracy, and illiteracy. For legibility purposes, we will omit the word alphabetic from these terms for the remainder of this article. Thus, when the terms “full functional literacy,” “functional illiteracy,” and “illiteracy” are used, the qualifier “alphabetic” will be implied. We define illiteracy as the inability to read or write letters or short words (World Literacy Foundation, 2015). Functional illiteracy refers to the ability to use or understand written language in the alphabetic script to a very limited extent, which is insufficient to participate in society or meet the writing or reading demands of one’s daily life (Eme et al., 2014; Vagvoelgyi et al., 2016). Full functional literacy allows people to use the written language in the pursuit of one’s goals (UNESCO, 2018a).
The continuum that ranges from illiteracy through functional illiteracy has been termed low literacy (Rüsseler et al., 2021). The global number of low-literate people is estimated around 3.2 billion, 1.3 billion of whom people have not attended school beyond primary education (UNESCO, 2017, 2018a, 2018b; World Bank, 2018). Among adult migrants, low literacy is deeply connected with households having, or living in conditions marked by, reduced access to formal education, exposure to armed conflict, and the presence of limited financial resources (UNESCO, 2017, 2018b, 2018a; UNHRC, 2017).
Since low-literate learners with reduced educational opportunities account for a substantial proportion of the global migrant population, they are a de facto part of adult language classes and of high-stakes language tests that are an increasingly common component of migration policies (International Organization for Migration, 2019). Nevertheless, it is uncertain whether applied linguists, educators, and language assessment specialists know enough about this population to teach or assess them adequately. Therefore, in this paper, we examine the performance of illiterate, functionally illiterate, and full functional literates on a widely used test of receptive vocabulary: the Peabody Picture Vocabulary Test, in its Dutch-medium edition (PPVT-III-NL, Dunn et al., 2005). This test requires participants to listen to a prompt in the form of a word or a collocation and to select the drawing which best represents that target word from a series of four options.
Vocabulary tests and low-educated, low-literate adults
Although the research on the impact of alphabetic print literacy on language test performance is scant in the field of language testing, neuropsychological research offers convincing evidence to show that literacy may markedly and negatively impact language test performance (Rüsseler et al., 2021). Alphabetic literacy positively impacts phonological awareness and phonological processing, but its effect on semantic processing is less pronounced (Demoulin & Kolinsky, 2016; Kurvers, 2015; Ventura et al., 2007). In other words, literates and illiterates perform at a similar level on tasks that require identifying concrete words that are semantically related. This is not the case in tasks that are focused on the phonemic qualities of words, where literates significantly and substantially outperform illiterates (da Silva et al., 2004; Demoulin & Kolinsky, 2016). Taken together, the evidence convincingly shows that low literates process oral language differently from literates. Indeed, the way in which low literates process oral language is more in line with their reading age than with their actual age (Eme et al., 2014; Kurvers, 2015). Low literacy also negatively impacts processing speed and verbal short-term memory (Deygers, 2020; Huettig, 2015; Huettig & Mishra, 2014), when controlling for educational background (Kosmidis et al., 2011).
As low literacy and reduced educational access are known covariates (Perry et al., 2018; Vagvoelgyi et al., 2016), their combined effect may negatively impact language test scores. It is possible that test results in part reflect test takers’ experience with a testing situation, which would benefit higher educated learners (Allemano, 2013; Huettig & Mishra, 2014). Moreover, a reduced access to books and educational materials may impact the processing of drawings and other figurative representations (Huettig et al., 2011). A reduced access to classroom education often results in a reduced attention span in formal testing situations. Importantly, the impact of education on attention span and memory functions is not linear but cumulative: the differences between people who attended a few years of primary school and those who finished lower secondary are vast (Gómez-Pérez & Ostrosky-Solís, 2006, p. 491).
Although it is clear that low literacy and reduced access to education may have a substantial impact on test performance, very few tests have been designed to meet the needs of low-literate participants (Carlsen, 2017; Windisch, 2015). As such, there is a sound rationale for re-examining existing language tests that are used on, but have not been validated for, low-literate learners. A good starting-point is oral vocabulary tests, because they are a relatively robust proxy for oral language proficiency (Mainz et al., 2017) and are widely used in linguistic and psycholinguistic research. Different picture-based receptive vocabulary tests are in circulation (Duñabeitia et al., 2018; Nation & Anthony, 2016), but for this study we focus on the Dutch version of the Peabody Picture-Vocabulary test (PPVT-III-NL; see Dunn et al., 2005).
The PPVT is a meaning recognition test that requires candidates to select one of four drawings that best matches a verbal stimulus. Stimuli are typically one-word prompts (nouns, verbs, adjectives) but may also be multi-word units (e.g., “to the top”). The PPVT is composed of 12-item sets, which progressively contain more low-frequency items and more abstract terms. Since the PPVT does not directly require any literacy skills, it appears to pose few limitations in terms of candidature or literacy level in English (Goriot et al., 2018; Krasileva et al., 2017) and Dutch (Mainz et al., 2017), irrespective of L1, although a cognate effect has been noted. In psychology, the PPVT has served to gauge scholastic aptitude, literacy, receptive vocabulary, and verbal intelligence (Webb, 2008; Welham et al., 2010; Williams, 1999). In applied linguistics, it has been employed to measure receptive vocabulary in L1 and in SLA research (De Wilde et al., 2019; Goriot et al., 2018). Studies employing differential item functioning (DIF) to validate PPVT for L2 learners typically find evidence of L1 bias and a rather minimal gender bias (Pae et al., 2012; Williams, 1999). Very few studies have compared the performance of participants with different educational backgrounds, with the study by Mainz et al. (2017) being a notable exception in the field of L1 research. The outcomes of Mainz et al.’s (2017) research are somewhat inconclusive regarding the impact of educational background on vocabulary score, potentially resulting from the conceptualization of lower educated participants. The lower and higher educated participants in their study respectively consisted of university college students and university students. From a global perspective, casting university college students as lower educated could be seen as underrepresenting the issue of access to organized education. In SLA, no studies have yet described the impact of low literacy and educational access on PPVT scores.
Research questions
In the current study, we aim to describe and compare the PPVT-III-NL performance of L2 learners with diverging degrees of education and literacy. In doing so, we address a gap in SLA research while contributing to the validity argument for a widely used test for use among an under-explored population of L2 learners. The central aim of our study was to determine whether the PPVT test (in its Dutch edition: PPVT-III-NL) can produce scores that are appropriately meaningful for measuring the vocabulary knowledge among low-educated, low-literate learners. Two research questions were identified:
Do learners with different educational backgrounds, but in L2 learning tracks at the same CEFR level, perform differently on the PPVT-III-NL?
To what extent might educational background variables impact test scores?
Context of the study
In Flanders, the northern half of Belgium where Dutch is the official language, all migrants are required to attain A2 proficiency in Dutch, one of the proficiency levels on the Common European Framework of Reference for Languages (CEFR – Council of Europe, 2018). To achieve this level in reading, writing, listening, and speaking, L2 learners are typically assigned to one of three track types: slow, standard, or fast (these terms are the literal translation of the Dutch track names: traag, standaard, snel). A class attendance rate of 80% is a minimum requirement in all track types.
Learners in the slow track receive a minimum of 480 hours of instruction in Dutch as a second language to achieve the A2 level. Typically, slow track learners have not studied beyond primary school or lower secondary, and have a primary- or lower-school-equivalent cognitive skill level. Learners who potentially fit the profile of a slow track learner are required to sit the COVAAR test, which is a cognitive ability test consisting of verbal and symbolic analogies and figurative series (Magez, 2007; Verschueren et al., 2011). Those who score 22 or less on this 48-point test do not exceed the cognitive ability of a child at the end of Flemish primary education, and are required to attend the slow track. A specific subgroup within the slow track is the alpha track, which caters to fully illiterate L2 learners who have typically not studied beyond primary education. At the end of the alpha track, learners will have received minimally 1750 hours of language and literacy instruction, at which point they are assumed to have attained A2 in speaking and listening, and A1 in written skills.
Standard track learners are literate in an alphabetic script and have attended lower secondary or upper secondary education. They receive 240 hours of instruction to achieve A2. Fast track learners are alphabetically literate and have attended university, or are planning to do so at a Dutch-medium university. The fast track to A2 takes 120 hours of instruction. Table 1 summarizes the main differences between the tracks. In all tracks (Alpha excepted) learners are expected to demonstrate A1 proficiency before being able to start the A2 level course.
Comparison of DSL tracks.
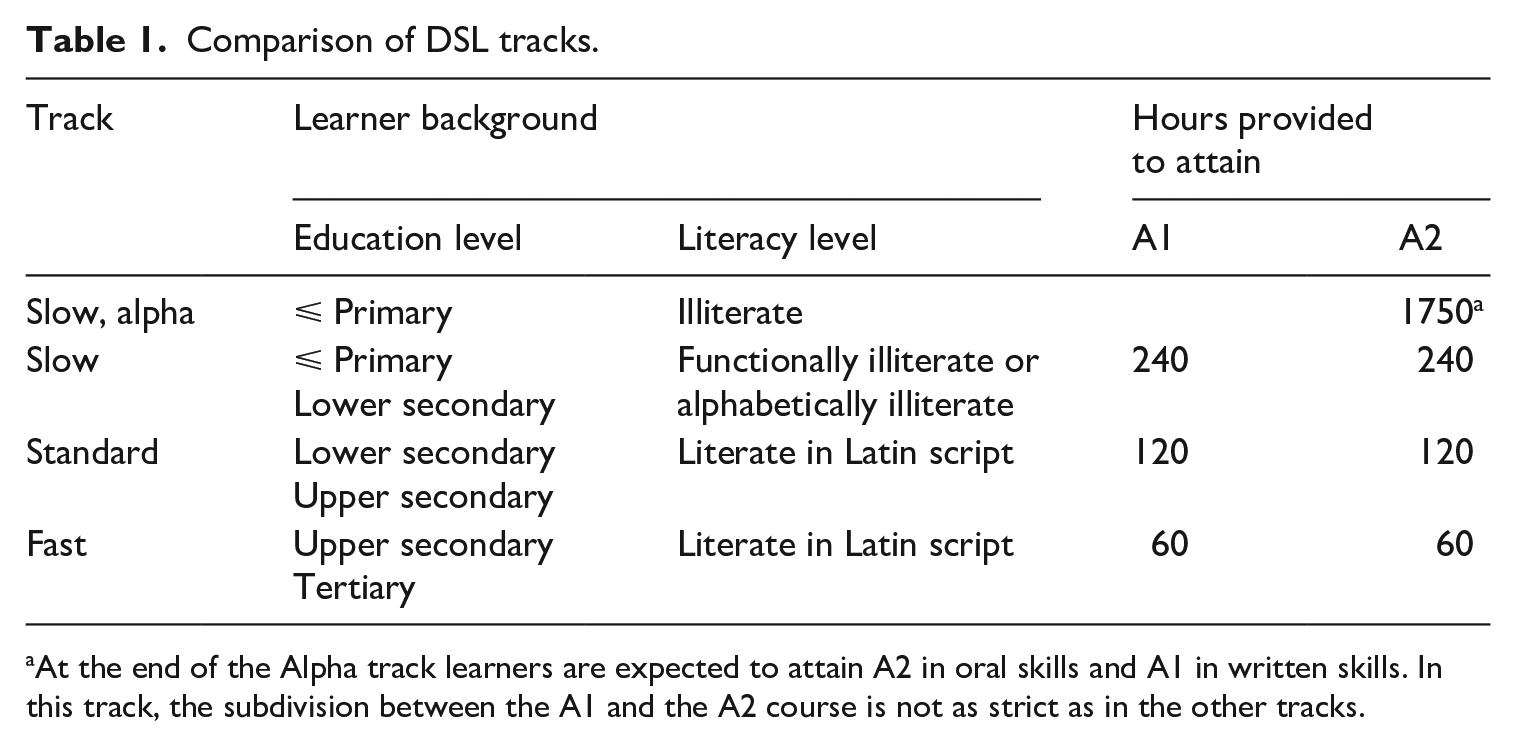
At the end of the Alpha track learners are expected to attain A2 in oral skills and A1 in written skills. In this track, the subdivision between the A1 and the A2 course is not as strict as in the other tracks.
Method and materials
Participants
This study relies on the PPVT-III-NL results of 1014 learners of Dutch as a second language, who took the PPVT-III-NL in the last week before the end of the course after giving oral (low-literate learners only) or written informed consent. No remuneration was given as compensation for participation, but all participating teachers received feedback on the relative performance of their class groups, and all school boards received feedback on school level performance. Prior to data collection, IRB approval was obtained. Table 2 displays key background variables of the participants by track.
Population variables by track (n = 1014).
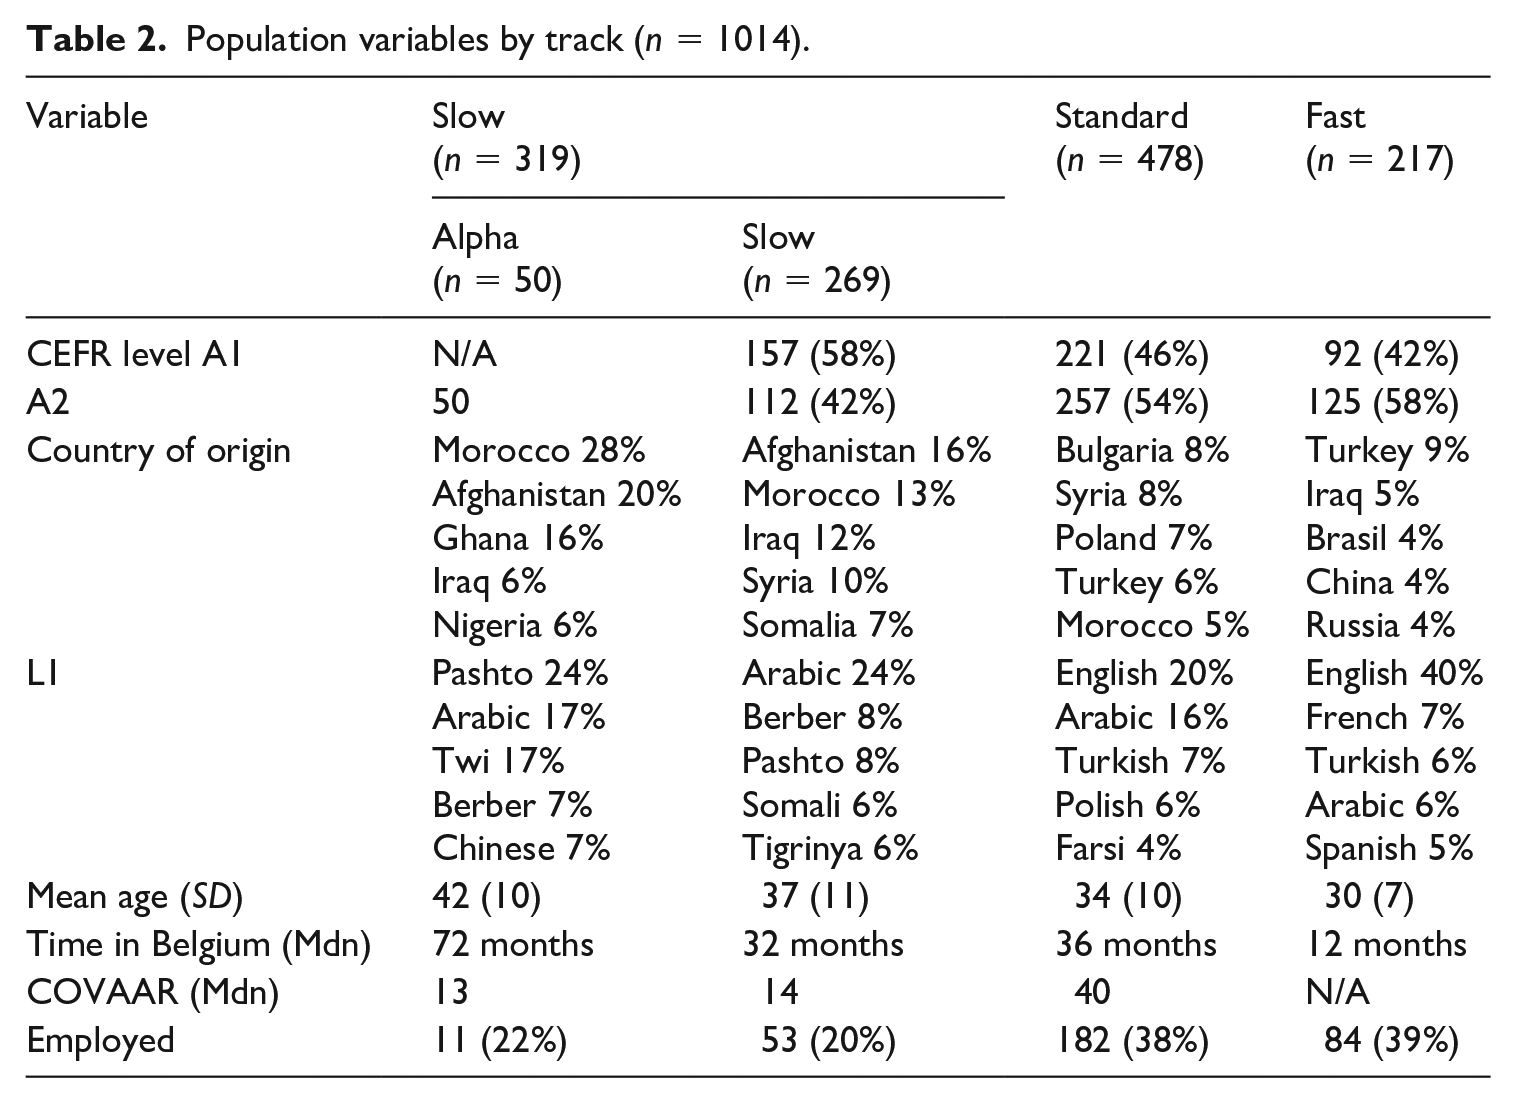
All participants were enrolled in the slow, standard, or fast tracks across 11 geographically dispersed language schools in Flanders. In addition to the 269 functionally illiterate lower educated learners, the study also examined the performance of 50 illiterate learners attending the alpha track.
In line with the recent trends in Belgian immigration and family reunification programs (Lafleur & Marfouk, 2018; OECD, 2018), the main countries of origin in the full dataset were Afghanistan (7.9%), Morocco (7.8%), and Syria (7.6%). Because the fast track is geared towards students and graduates, the average fast track participant was significantly younger than the average standard track learner (W = 41126, p < .000, d = −0.39). The slow track population was significantly older than the standard and fast track populations (e.g., slow – standard: W = 74178, p < .000, d = −.28). Fast track participants had spent significantly less time in Belgium than any other group (p < .000). The median COVAAR score among standard track learners significantly and substantially surpassed the slow track score (W = 25353, p < .000, d = 2.29), signaling a substantial difference in cognitive abilities. The data show significantly different employment rates in the slow and alpha tracks versus the other tracks (e.g., slow – standard: W = 75671, p < .000, d = 0.41), reflecting the actual situation on the job market (Departement Werk en Sociale Economie, 2018).
PPVT-III-NL and survey
The PPVT-III-NL was designed for both children and adults, and has been validated for L1 speakers and L2 learners (Dunn et al., 2005). The Dutch version is based on the original English version but also contains a substantial amount of new additions (e.g., because of translation issues, cultural differences, shifts in meaning). PPVT-III-NL consists of 17 12-items sets that contain increasing proportions of low-frequency words. Since the participants were beginner adult L2 learners, it was impossible to determine a correct starting set, so the assessment started at the first item (for a similar use of PPVT, see Pichette et al., 2019) and ended after the ninth set. There were three motivations for not continuing beyond the 108th item.
First, word frequency: Figure 1 shows the word frequency distribution in the first nine sets, based on the SUBTLEX-NL corpus (Keuleers & Brysbaert, 2010). The proportion of low-frequency words increases substantially after set 7 and the number of highly frequent items is reduced to one in sets 8 and 9. Second, the study was piloted among 111 standard track learners, using the first eight sets. The descriptive statistics indicated a negative skew (skewness: −.53; mean: 61(9); range: 34–83), and so to avoid ceiling effects with fast track participants it was decided to include the ninth set. Third, because attention span is linked to educational background (Gómez-Pérez & Ostrosky-Solís, 2006) and because the maximum recommended duration of tests for illiterate learners is around 20 minutes (Paddick et al., 2017), administering all items was not deemed feasible nor conducive to construct relevant measurement.
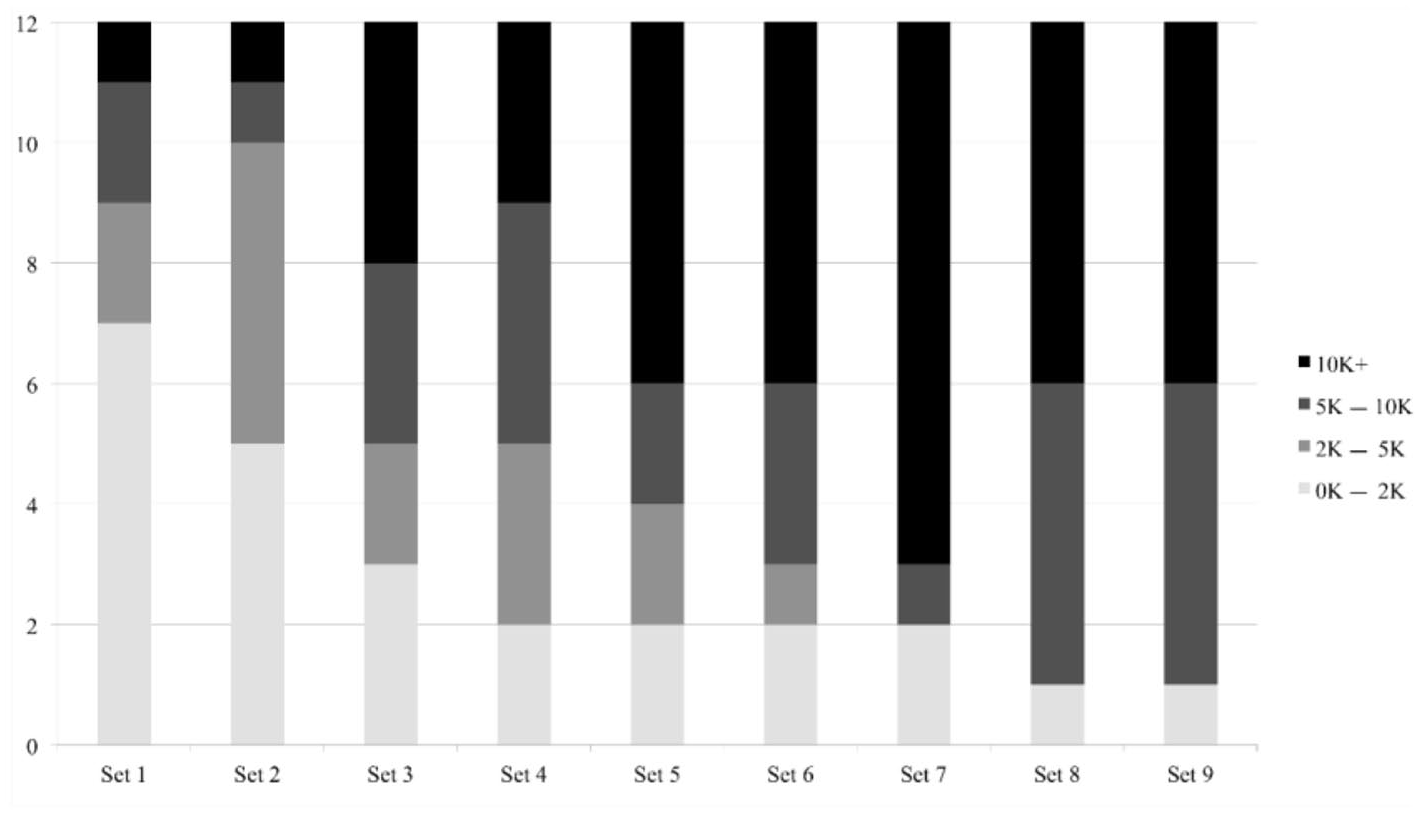
Word frequency distribution in PPVT-III-NL.
The tests were administered by the first author in the participants’ classroom during class hours in the presence of their tutor (see also Pichette et al., 2019; Puimège & Peters, 2019). To avoid construct-irrelevant variance that may result from changes in the pronunciation of the items during live reading, all prompts were pre-recorded (see also Traxel & Zhang, 2008). There was a 13-second time window for each item (Dunn et al., 2005), resulting in a total administration time of 23 minutes for the nine sets, excluding introduction and practice. Each prompt was repeated twice while the four options were projected on a large screen. The answer sheets showed the same four pictures that were projected, and participants marked the option of their choice on their paper. Apart from one slow track participant (whose results were removed from the dataset), all participants understood the testing procedure after it had been explained to them and after solving four practice items.
The answer sheets were centrally scored by four raters trained to rate this test by the first author. Since the PPVT is a selected-response test with a clear answer key, the training is relatively straightforward. Both the rater training and the rating process took place in a meeting room adjacent to the first author’s office. The remuneration for taking part in the training and the rating process conformed with university wage scale regulations. Ten percent of all performances were double scored and scoring reliability was determined via a many-facet Rasch analysis. As can be expected for this type of test, inter-rater agreement was high (99%; X2(4) = 2.2, p =.69).
Participants also completed a brief survey of their Dutch language use, their exposure to Dutch-medium media, and their perception of their host society. The survey questions were formulated in Dutch, French, English, Spanish, Russian, Polish, Turkish, Pashto, Arabic, and Mandarin. In addition, all surveys in the slow and alpha track were administered individually to avoid problems with the interpretation of the questions. The survey questions focused on language use at home (use of Dutch and other languages) and media usage (exposure to Dutch-medium radio and TV, having internet access, owning a smartphone or computer).
Analysis
Inferential statistics were conducted in R, version 3.6.2 (R Core Team, 2018), using the packages effsize (Torchiano, 2017), ggplot2 (Wickham, 2016), and psych (Revelle, 2018). FACETS (Linacre, 2015) was used for the many-facet Rasch (MFR) analyses. A mixed-effects linear regression model was constructed using MLwiN, version 2.31 (Hox, 2010).
Histograms, QQplots, and the Shapiro-Wilk test of normality showed that the overall dataset and the three main subsets (slow, standard, fast) were normally distributed (Shapiro-Wilk p > .05), but the alpha track subset was not (Shapiro-Wilk = 0.948, p = .03). Figure 2 shows the score distributions in the four groups.
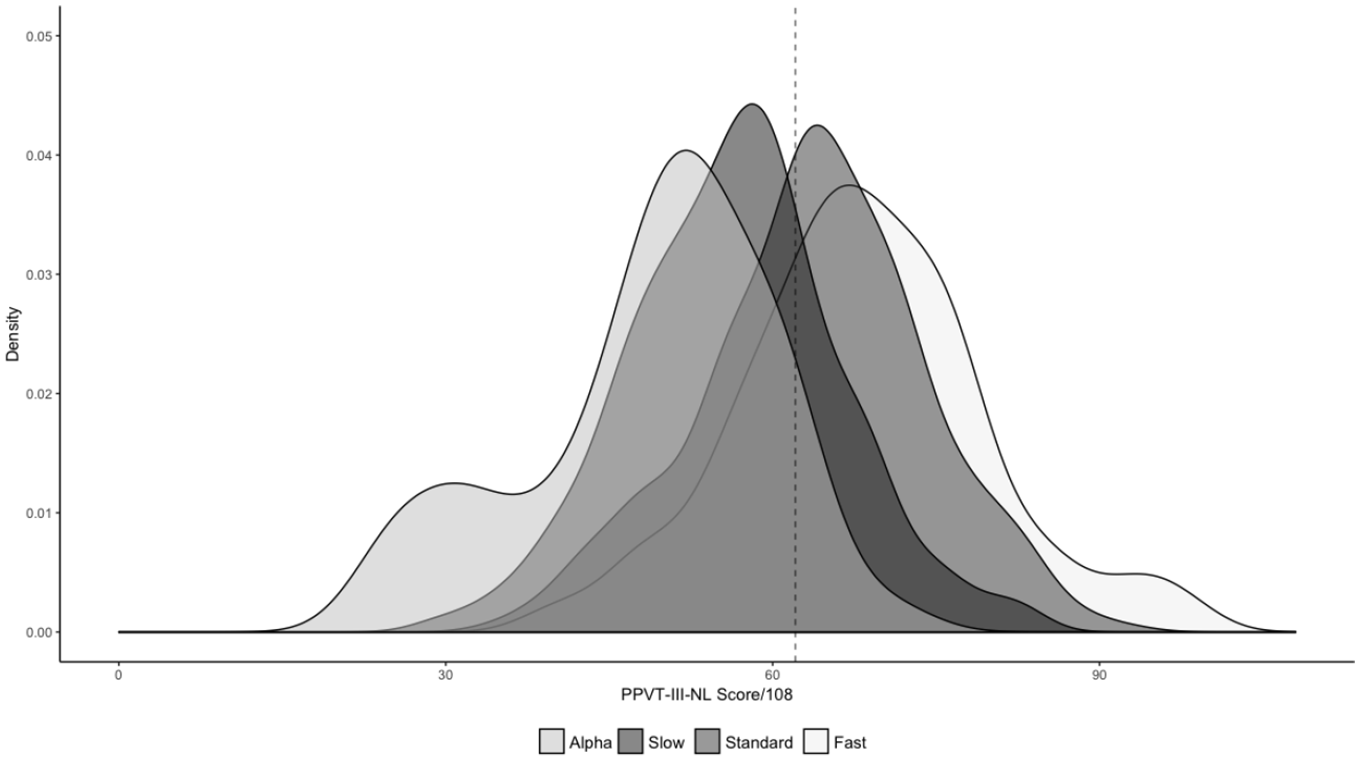
Density plot of score distributions in alpha, slow, standard, and fast track participants.
The ability levels of candidates and tracks were compared using MFR measurement. In MFR analysis, ability estimates are a function of task performance, which may be positively or negatively affected by task difficulty, rater leniency, or other sources of impact. Furthermore MFR analysis facilitates the generalization from a performance of a group of participants on a sample of items to the performance of an entire population on similar items (McNamara et al., 2019). Of primary interest in the output of MFR analyses are model fit and ability measures. Although ability measures are relative, higher measures indicate increased ability levels in people or participant groups, or increased difficulty in items. Regarding model fit, items with Infit ⩽ .70 can be considered redundant, whereas Infit values ⩾ 1.3 signal items that potentially disrupt the statistical model (McNamara et al., 2019).
Differential item functioning (DIF) occurs in items that are systematically more difficult or easier for specific groups of candidates, also when controlling for test taker ability (Aryadoust et al., 2011). Bias occurs when this over- or under-performance stems from construct-irrelevant background variables, such as gender, L1, or educational background (McNamara & Roever, 2006). To conduct DIF analyses, we supplemented the original MFR model with the following demographic variables:
region of origin (North Africa; Sub-Sahara Africa; Eastern Europe; Latin America and Caribbean; Western Europe, USA, and Australia; Central Asia; East, South, and Southeast Asia; Middle East; Western Asia; for categorization see UN Department of Economic and Social Affairs Statistics Division, 1999);
age group (15–24; 24–39; 40–54; 55+; for categorization see OECD, 2019);
sex;
educational background (primary; secondary; tertiary);
employment status;
duration of stay in Belgium (<1 year; 1–2 years; 2–5 years; 6+ years);
L1 (recoded into a nominal variable, encompassing six language family groups: Afro-Asiatic; Austro-Asiatic, Koreanic, Kra-dai; Indo-European; Niger-Congo, Mande; Sino-Tibetan; Turkic).
In addition, we constructed a mixed-effects linear regression model to gauge the impact of the tracks on learner scores. The PPVT raw score functioned as the dependent variable, and individual learners, teachers (or classroom; there was one teacher per classroom) and schools were included as random effects. We included seven learner-level fixed effects: age (M = 34.17, SD = 10.01), educational background (1 = primary or lower, 2 = secondary, 3 = tertiary), gender (0 = female, 1 = male), time in Belgium (M = 4.33, SD = 4.96), employment status (dummy for having a job), home language (Indo-European home language/ not), and whether they spoke Dutch at home (dummy for yes). Track level (A1/A2) and track type (1 = slow, 2 = standard, 3 = fast, 4 = alpha) were included as teacher-level fixed effects. Continuous independent variables were all mean-centered (e.g., time in Belgium, age). Models were built in a stepwise manner and the distribution of the residuals was iteratively checked for normality on all levels. The responses of two participants could be considered outliers (standardized residual > 3) and were excluded from the analyses. No other deviations from normality were found. We built three models. First, an empty model containing no explanatory variables was calculated in order to determine the degree of variation that exists at the school, teacher and student level. Next, learner background variables were added to the model as control variables (Model 2). In a third model we investigated the impact of track level and track type on learner receptive vocabulary skills. Only those variables that significantly contributed to the model were retained.
Results
Do learners with different educational backgrounds but in L2 learning tracks at the same CEFR level perform differently on the PPVT-III-NL?
Table 3 indicates that A2 fast track learners score higher than all other groups and alpha learners lower than all other groups. Within-track differences between A1 and A2 are smaller in the standard track, t(425.2) = −1.6699, p = .09; d = −.15, than in the fast, t(209.4) = −5.043, p = .000; d = −.64, and slow track, t(214.3) = −7.7836, p = .000; d = −.98.
Overall PPVT-III-NL scores a .
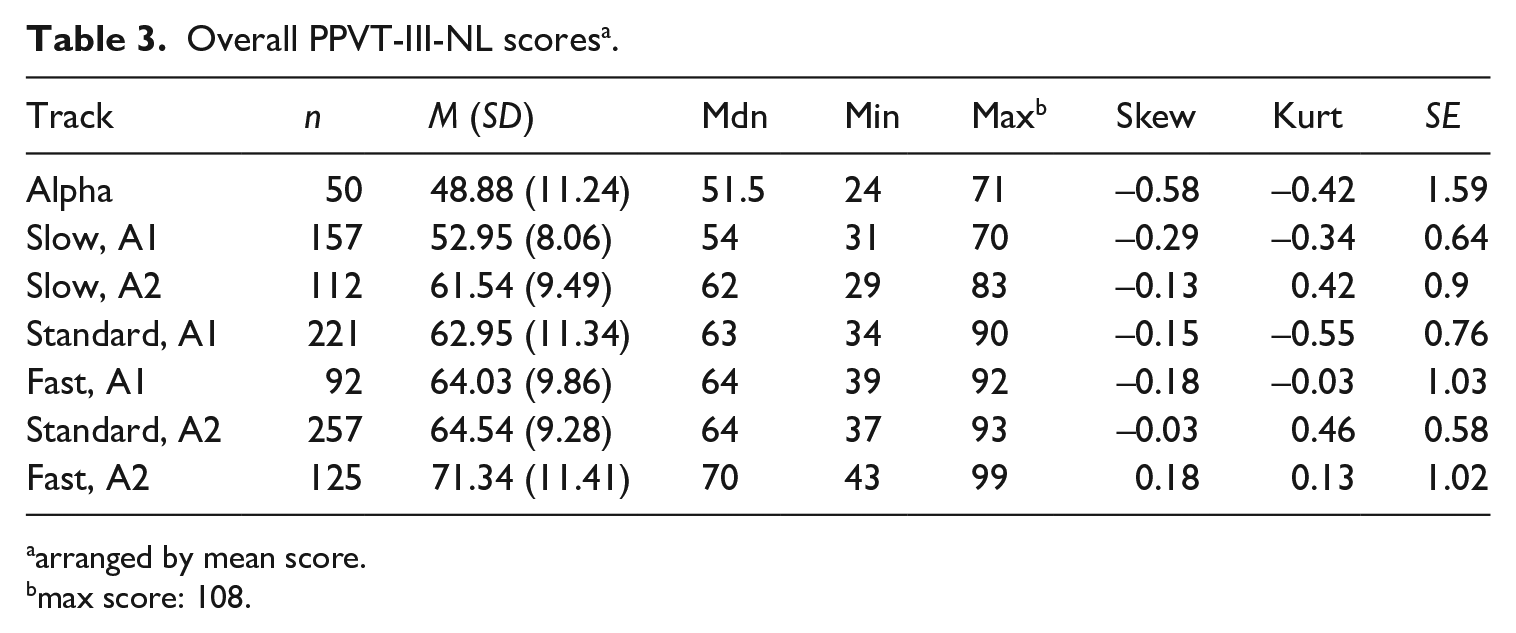
arranged by mean score.
max score: 108.
At the A1 level, the differences between the fast and the standard track did not reach statistical significance, but those between fast and slow, t(162) = 9.14, p < .000; d = 1.26, and standard and slow, t(376) = 10, p < .000; d = .989, did, with large effect sizes. Comparing between-track differences at the A2 level yielded significant differences and medium to large effect sizes (fast – standard: t[216]= 4.44, p < .0000, d = 0.51 / fast – slow: t[234.9] = 7.3, p < .0000, d = 0.943 / fast – alpha: W = 5834.5, p < .0000, d = 2.02 / standard – slow: t[207.57] = 4.33, p < .0000, d = 0.494 / standard – alpha: W = 11471, p < .0000, d = 1.776 / slow – alpha: W = 4513.5, p < .0000, d = 1.239).
The MFR output by track type and CEFR level differentiated between six performance levels (strata = 6.17, reliability = .95, X2 [6] = 552, p < .000). Table 4 shows that fast track A2 learners outperformed standard track A2 learners, and the standard track A2 learners achieved a higher measure than slow track A2 learners. Without taking into consideration any background variables, the MFR measures logically align with the mean scores in Table 3.
MFR measures in A1 and A2 tracks.
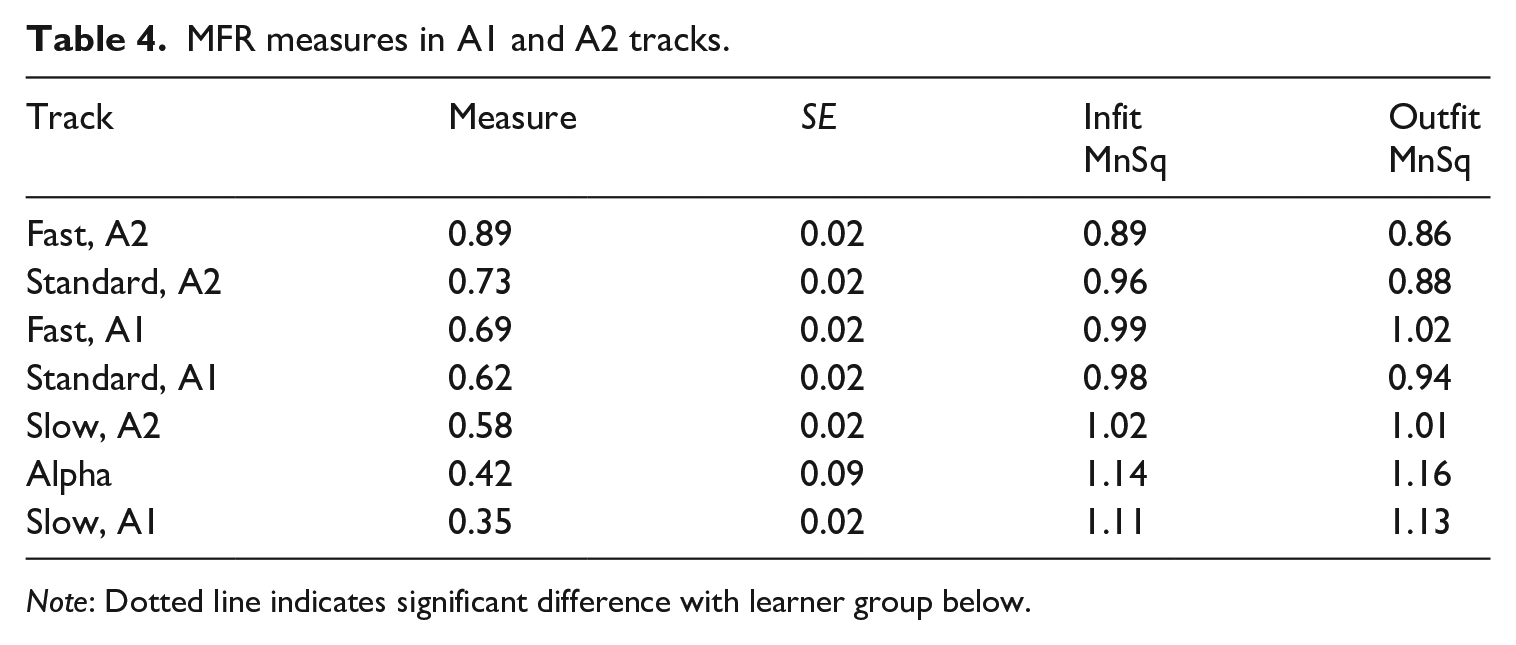
Note: Dotted line indicates significant difference with learner group below.
To what extent might educational background variables impact test scores?
The MFR model explained 38.5% of the score variance and showed no overfitting or underfitting items (Infit MnSq: .89 − 1.3). The nine sets (Infit MnSq: .98 − 1.03) covered 38 statistically distinct difficulty levels (strata = 38.47, reliability = 1.00). Figure 3 shows that the difficulty level of the sets reflects the intended increasing difficulty level of the test, with sets 3 and 5 disturbing the pattern.
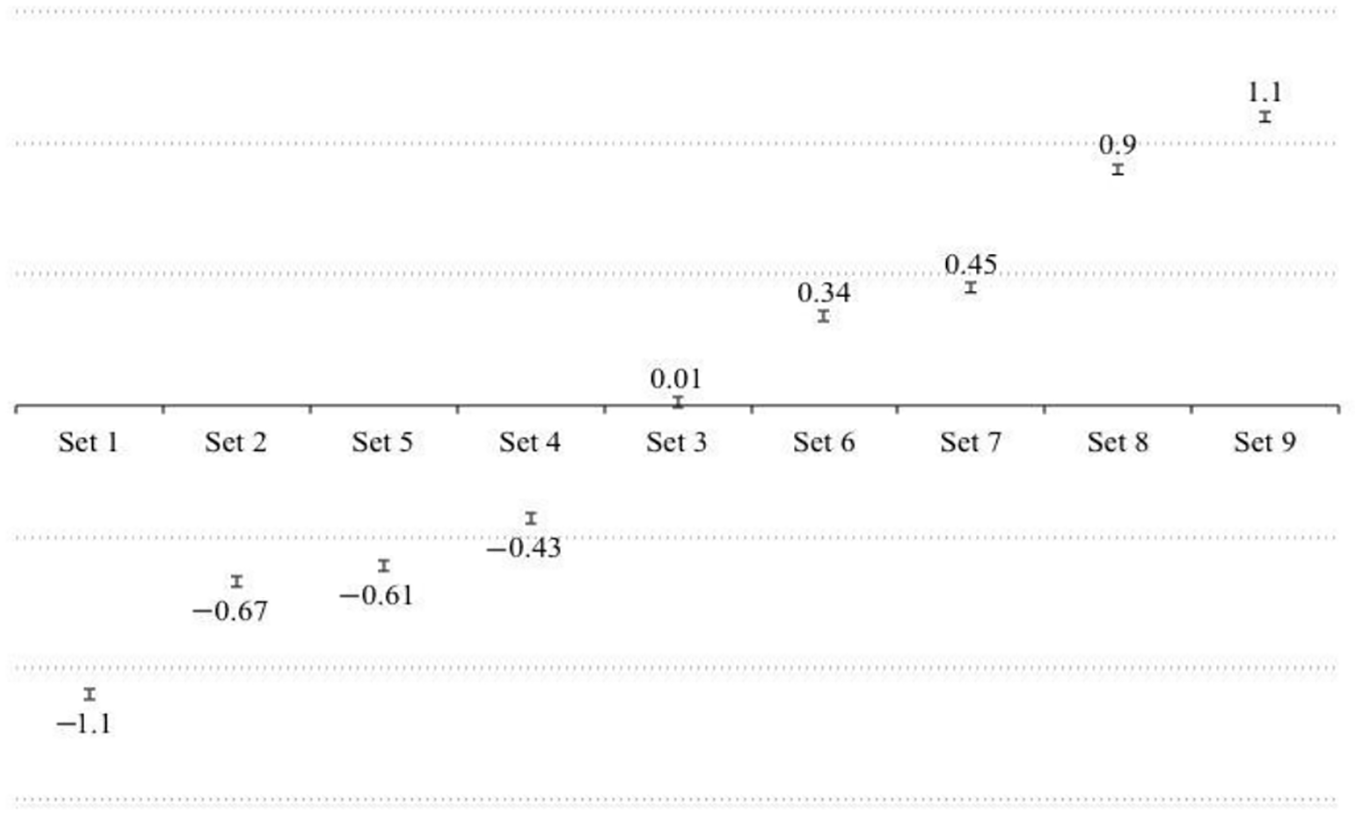
MFR difficulty measures of PPVT-III-NL, sets 1–9.
The MFR DIF analysis showed no significant age effect and no significant effect of speaking multiple languages at home. Other demographic variables (Table 5), however, together accounted for 12.3% of the explained variance.
Variance explained by DIF.
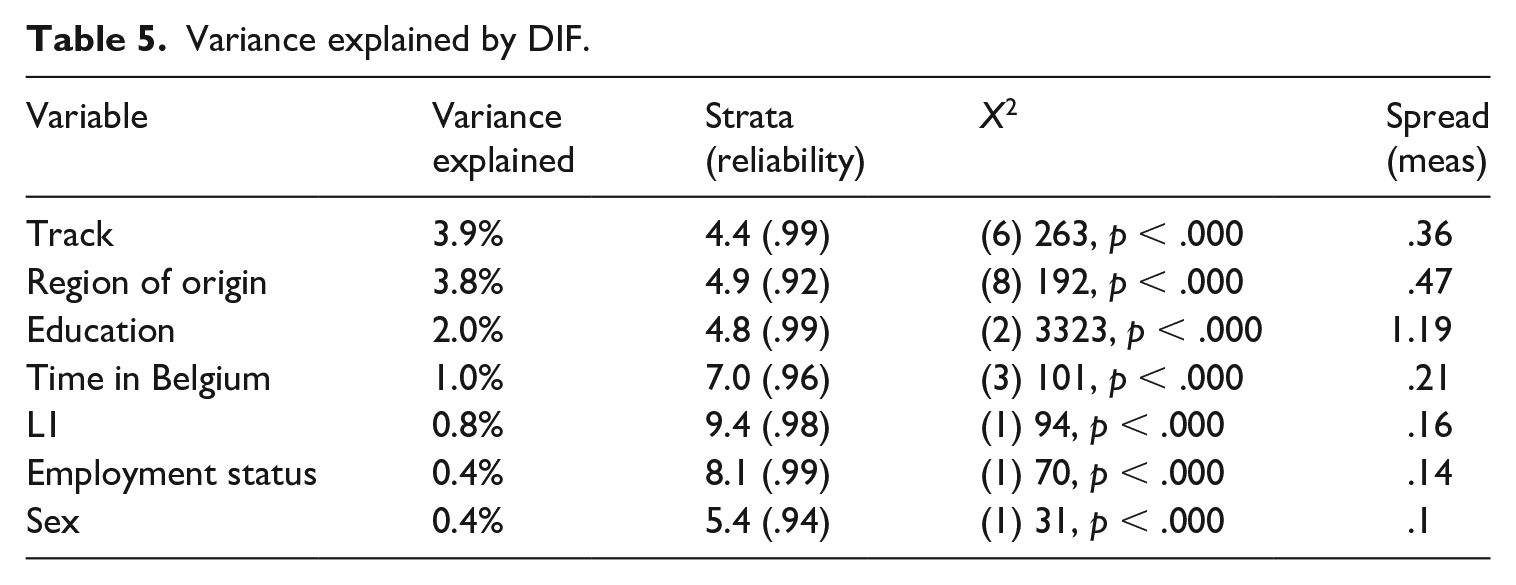
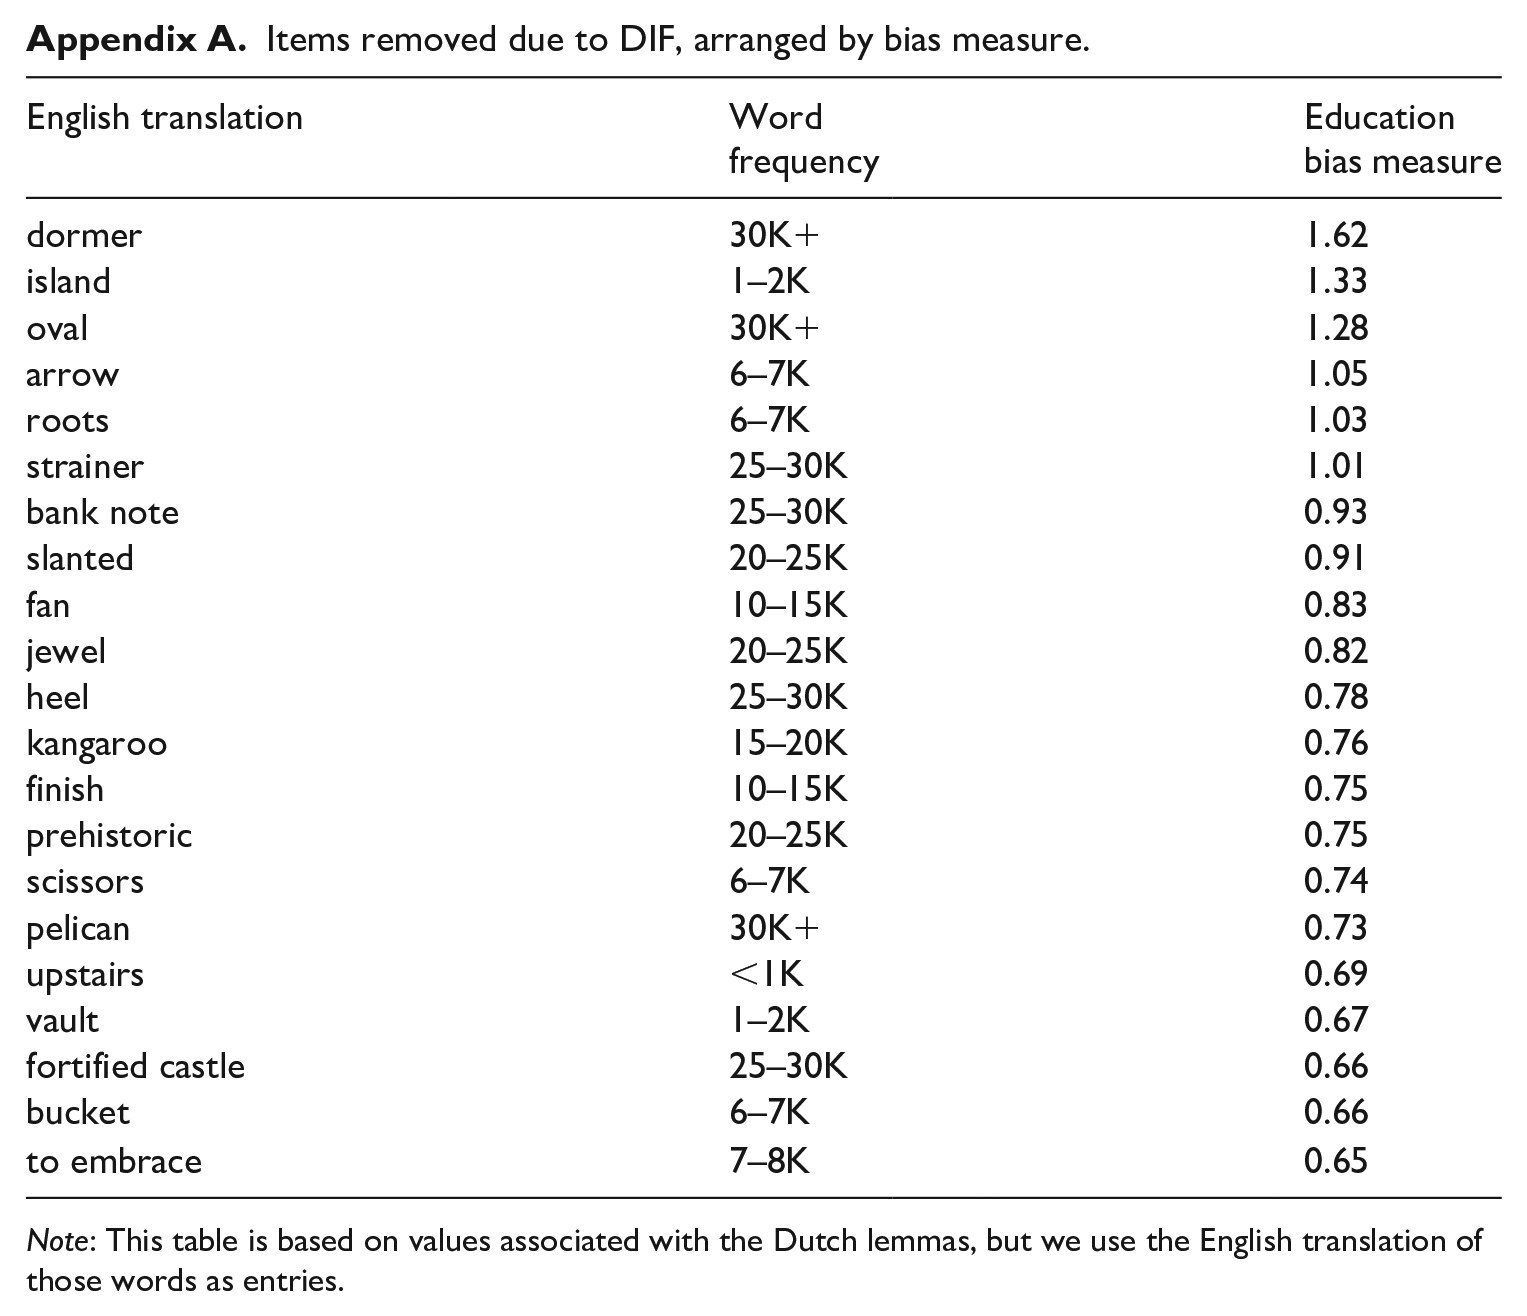
Track and region of origin explained most of the additional variance, but the ability spread for region was larger, with participants from Sub-Saharan Africa obtaining the lowest measure (−.24). The largest spread was found for educational background; in addition when we controlled for other background variables, people with a primary education alone scored significantly and substantially lower in terms of ability (−.74) than people with a secondary or tertiary degree. To identify the items with the most consistent DIF, we investigated which of the items showed DIF for the four background variables, wherein each accounted for at least 1% of additional explained variance (i.e., track, region of origin, education, time in Belgium). Of the 108 items of the first nine sets, 47 items showed significant DIF across these four variables. As a cut-off to determine whether DIF was substantial, we used one standard deviation of the person ability estimation (.64), which resulted in 20 items to be omitted from the dataset. Appendix A shows the approximate word frequency in the SUBTLEX-NL corpus (Keuleers & Brysbaert, 2010), and the DIF measure for educational background. Owing to copyright restrictions, the actual lemmas cannot be disclosed. Half of these items were cognates (as defined by COSP method; Kohnert et al., 2004) with English, German, French, or multiple Western European languages. After removing the 20 items with consistent and substantial DIF, the MFR model showed a better fit (variance explained: 41%, compared to 35% before removal), which, together with the variance explained by bias, meant that the model explained over 50% of the score variance.
Lastly, to account for the fact that score variance may result from the schools the participants attended, or the teachers they had, a mixed-effects linear regression model was constructed on the basis of the PPVT-III-NL scores, after removing the items with considerable and consistent bias (Appendix A). Table 6 presents the results of the mixed-effects linear regression. The empty model indicated that substantial differences exist between learners within classrooms (ICC = .620, p < .001), but also between learners from different classrooms (ICC = .236, p < .001) and from different schools (ICC = .144, p < .05). These findings suggest that characteristics of the school and classroom or teacher have an influence on PPVT-III-NL scores, when also controlling for the variables specified above and listed in Table 6.
Mixed-effects linear regression: Models 0, 1, and 2.
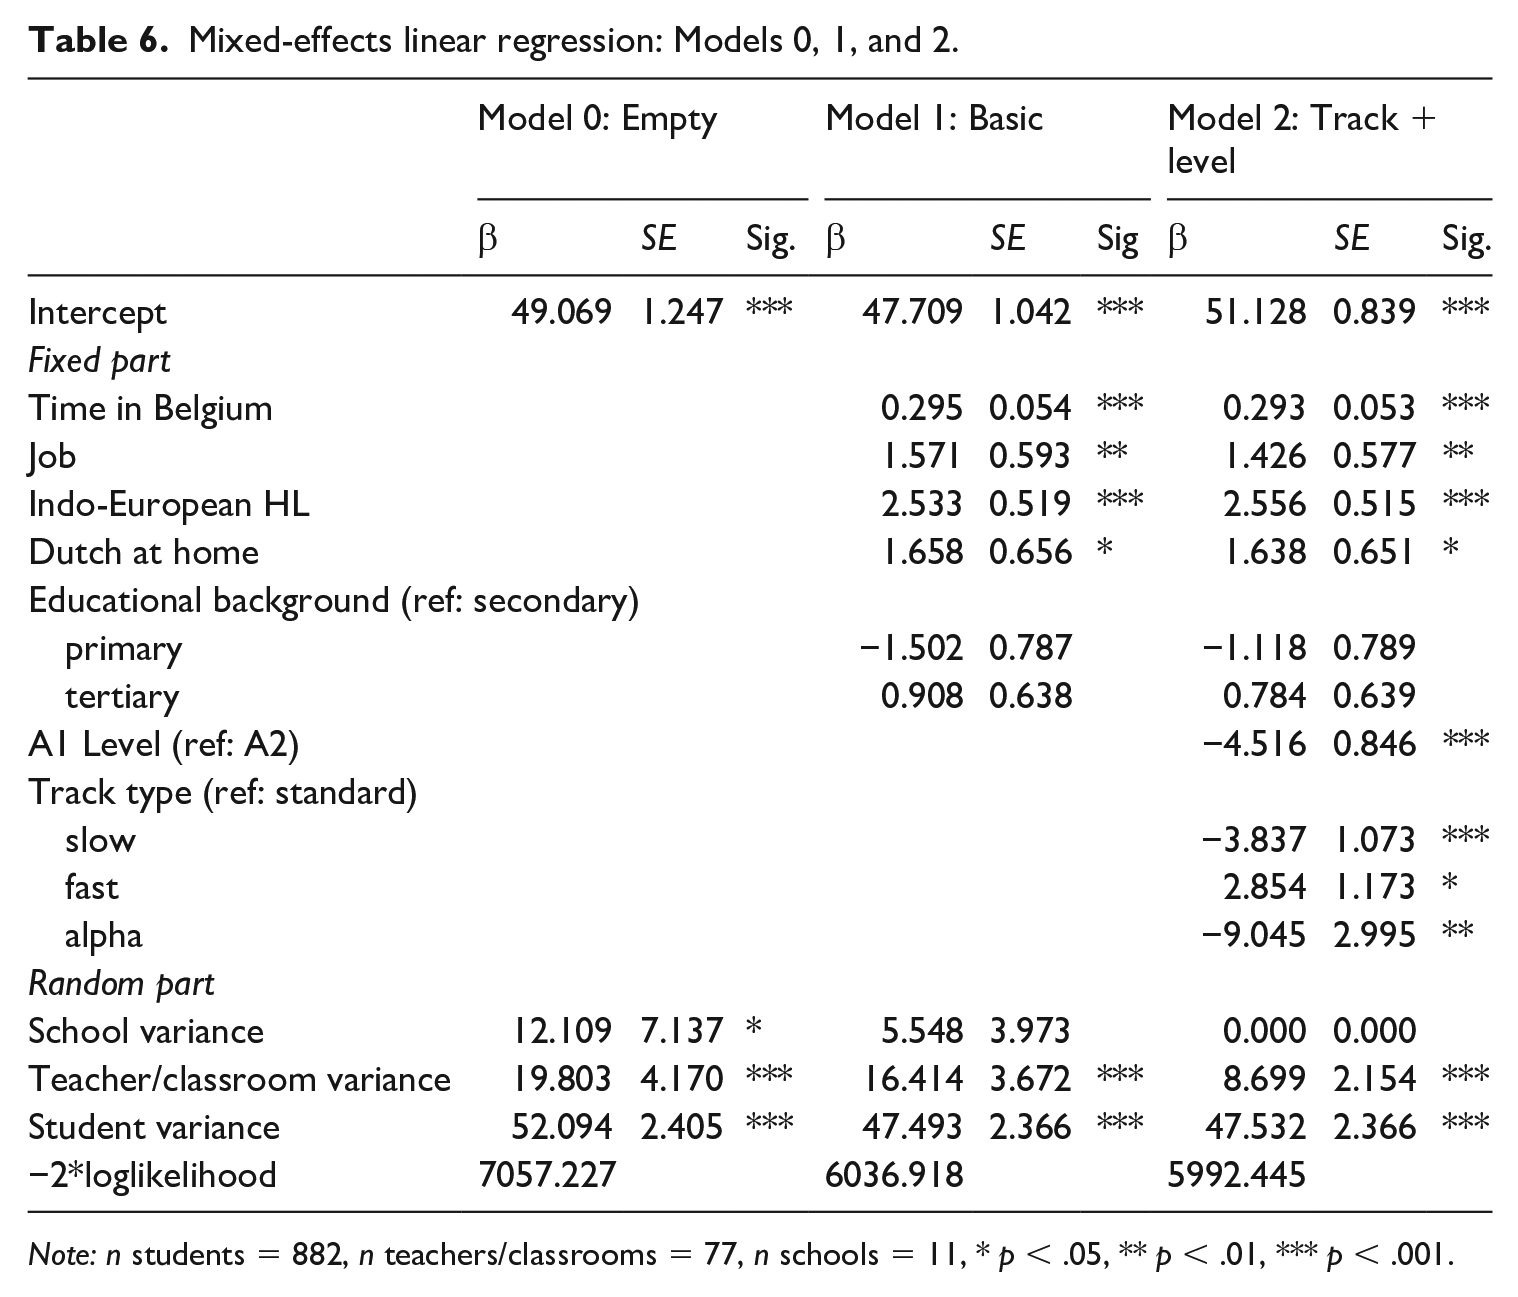
Note: n students = 882, n teachers/classrooms = 77, n schools = 11, * p < .05, ** p < .01, *** p < .001.
Individual learner characteristics explained 44.6% of the variance between learners from different schools, which is comparable to the 41% explained variance in the second MFR model. These characteristics could not explain differences between learners in different classrooms or between learners within the same classroom, however. Age and gender did not significantly affect learners’ PPVT-III-NL score, whereas length of residence in Belgium (d = .36), having a job (d = .18), an Indo-European home language (d = .35), and speaking Dutch at home (d = .18) were all found to be positively related to higher scores (Model 1, Table 6). It is interesting to note that educational background was not found to be significantly related to learners’ vocabulary when other factors were taken into account (Cohen’s d = .11), but it is important to stress that the most biased items (n = 21) had been removed from the dataset. Model 1 shows a remaining variance of 23.6% at the teacher (or classroom) level and around 8% at the school level.
The outcome of Model 2 indicates that both track level and type are significant predictors PPVT-III-NL scores, even when individual learner characteristics are taken into account. As could be expected, on average, learners in A1 tracks attain lower scores than A2 track learners (β = −4.516, p < .001, Cohen’s d = .36). Significant differences were still present between learners in different types of tracks as well (Cohen’s d = .38). Learners in the alpha and slow track attained significantly lower scores than learners in the standard and fast track (Cohen’s d between .20 and .32). No significant differences were found between learners in the slow track or alpha track, χ²(1) = 3.009, p > .05, Cohen’s d = .10, whereas learners in the fast track performed significantly better on the Peabody than learners in the standard track, β = 2.854, p < .05, Cohen’s d = .15. Even tough track type and track level explained all remaining differences between learners in different schools and around 34.5% of the differences between learners in different classrooms with different teachers, around 15% of significant differences (p < .001) remained at the teacher (classroom) level.
Discussion
The PPVT is a test of receptive vocabulary that has been widely used on children and adults, but it has not been used to compare the performance of adult L2 learners with a different educational and literacy background. Rare exceptions notwithstanding (e.g., Muth, 2007), PPVT-based SLA research has devoted little attention to low-educated, low-literate learners. In line with recent calls for a participant selection that better reflects the global community of second language learners (Andringa & Godfroid, 2020), this study examined the PPVT-III-NL performance of 1014 learners of Dutch as a second language. These participants attended different educational tracks that were designed to cater to their educational background and literacy profile. The PPVT-III-NL test was administered at the end of the A1 and the A2 level.
At the A1 level, slow track learners scored significantly lower than standard and fast track learners, with large effect sizes. At the A2 level, score differences between the four participant groups were significant, with medium to large effect sizes. The descriptive statistics outcomes were confirmed in the MFR analysis, which showed that slow track learners at the A1 and A2 level scored significantly below their level-matched standard and fast track peers. In other words, the data showed that PPVT-III-NL performance did differ substantially and significantly between groups. The data also showed that the performance gap appeared to grow from the A1 level to the A2 level. Bias analysis showed clear indications of differential item functioning, which accounted for over 12% of the score variance in the MFR model. In line with previous studies, no significant age effect was found in the DIF analysis, and the impact of gender was rather small but significant (Pichette et al., 2019). Primary sources of DIF were L2 learning track (3.9%), region of origin (3.8%), educational background (2%), and time spent in Belgium (1%). The data thus show that a performance difference between track types exists and increases between A1 and A2, when also controlling for educational background. They also indicate that the test scores reflect, at least in part, the educational background of the test taker. This is not necessarily, however, a sign of bias or construct irrelevance: as the PPVT test advances through its subsets, lemmas are increasingly sourced from the upper ranges of frequency lists. As the proportion of low frequency target words increases, it is only logical that more specialized lexical items become more frequent, offering an advantage to more highly educated participants.
In order to determine whether the increased performance gap between track types at the A2 level results from educational background alone or from elements within the tracks themselves, we ran a mixed-effects linear regression, after omitting 20 items that showed substantial and significant DIF. We found that, when also controlling for individual learner characteristics, significant differences between the tracks and levels persisted. No differences were found between slow and alpha track learners, who were outperformed by standard and track learners. Fast track learners significantly outperformed any other group, and A2 learners outperformed A1 learners. It is important to note, however, that substantial variance remained at the level of the individual teacher. In other words, with all else being equal, individual teachers can have a substantial impact on learners’ receptive lexicon.
There may be various reasons for these results. First, reduced attention span could have caused low-educated learners’ attention to drop over time (Gómez-Pérez & Ostrosky-Solís, 2006), but this is unlikely since the test time was limited to account for loss of attention and since the performance drop is not discernible across all items in the later sets. Second, a cognate effect could have disadvantaged learners without knowledge of Western European languages (Goriot et al., 2018). The DIF analysis showed evidence of a cognate effect and of L1 bias, offering corroborating evidence to earlier studies which found that the PPVT might be easier for people with an Indo-European L1 (De Wilde et al., 2019; Goriot et al., 2018; Leśniewska et al., 2018). Given the relatively high lexical similarity between English, French, German, and Dutch (Schepens et al., 2016), this is not altogether surprising, nor should it immediately give rise to questions regarding the test’s validity. Third, the fact that items related to spatial objects, fauna, and musical instruments displayed education bias does not necessarily offer ground for validity concerns either. Lemmas stemming from a more specialized lexicon may offer an advantage to participants with more knowledge of the world (see also Mainz et al., 2017) or a larger educational background, but again, these may also be typical effects of frequency-based item sampling. Quite probably, the combined effects of education, literacy, test-wiseness, memory, attention span, phonological processing, and word segmentation did impact the test performance of low-educated, low-literate learners (Bengtsson et al., 2005; Dehaene et al., 2015; Demoulin & Kolinsky, 2016; Tarone & Bigelow, 2005; van Linden & Cremers, 2008). When faced with an unknown prompt, more highly educated participants can utilize their more advanced metalinguistic awareness (Kurvers, 2015) and test wiseness (i.e., finding correct answers by deduction, etc.) to make a reasoned guess in a way that slow track learners would have been less likely to do.
Not all variance can be explained by learner-internal characteristics. Context matters too. The mixed-effects linear regression showed that length of residence, employment status, and speaking Dutch at home positively impact test scores. This testifies to the impact of incidental (i.e., out-of-class), non-instructed vocabulary development (De Wilde et al., 2019). Importantly, the findings also shed light on the mediating impact of the L2 learning track. They signal that, independent of track type and learner background, the individual teacher may have a substantial impact on the receptive vocabulary of L2 learners.
Based on the outcomes of the analysis, one could argue that initial score differences between tracks appear to be further exacerbated as learners continue their training. The slow tracks do not appear to be effective in bridging the score gap with the other tracks, in spite of having twice as many hours of instruction. In line with earlier research, this study shows that although targeted L2 learning tracks may yield language gains, these gains are not equally distributed across all tracks. Especially in tracks that cater to lower-educated learners, language gains may prove elusive (Windisch, 2015), and merely providing more hours of language instruction will not necessarily result in measurable test score gains (Condelli & Spruck, 2006; Kurvers, 2015). The lack of measurable score gains does not mean that no gains are being made, however. It is possible that the vertical scale of a test does not capture the growth that the slow-track learners are achieving in other domains that are not part of the test construct.
Conclusion
This is the first study to examine PPVT performance as a function of educational background and literacy. One limitation of this study is the lack of an external measure of language proficiency. However, given the sample size of this study and the variability in terms of background, administering a second language test to all learners was not considered feasible. Moreover, introducing a second test would have opened up new questions regarding validity and bias.
The findings of the current study show that learners from different L2 learning tracks do not perform equally well on PPVT-III-NL. Learners in slower tracks are outperformed by more highly educated learners in faster tracks. The results show that education-based DIF as well as a cognate effect may have impacted the results, but also that the track types themselves do not appear to lessen the impact of educational background on test scores. Indeed, the study even provided evidence to show that track types and teachers may contribute to increasing the differences between learners with different educational backgrounds. All in all, however, this study did not find convincing evidence to discount the use of the PPVT on low-educated, low literate learners.
Future research could focus on how teacher behavior impacts vocabulary learning in lower-educated L2 adults. In K12 contexts, class composition (Belfi et al., 2012; Verhaeghe et al., 2018) and teacher expectations (Agirdag et al., 2013) have been observed to impact learners’ performance. Among L2 students, teacher expectations have been shown to impact willingness to speak and language gains (Kang, 2014; Morita, 2004). Similar effects might asymmetrically impact adult L2 learners with diverging educational and literacy profiles.
Footnotes
Appendix
Items removed due to DIF, arranged by bias measure.
| English translation | Word frequency | Education bias measure |
|---|---|---|
| dormer | 30K+ | 1.62 |
| island | 1–2K | 1.33 |
| oval | 30K+ | 1.28 |
| arrow | 6–7K | 1.05 |
| roots | 6–7K | 1.03 |
| strainer | 25–30K | 1.01 |
| bank note | 25–30K | 0.93 |
| slanted | 20–25K | 0.91 |
| fan | 10–15K | 0.83 |
| jewel | 20–25K | 0.82 |
| heel | 25–30K | 0.78 |
| kangaroo | 15–20K | 0.76 |
| finish | 10–15K | 0.75 |
| prehistoric | 20–25K | 0.75 |
| scissors | 6–7K | 0.74 |
| pelican | 30K+ | 0.73 |
| upstairs | <1K | 0.69 |
| vault | 1–2K | 0.67 |
| fortified castle | 25–30K | 0.66 |
| bucket | 6–7K | 0.66 |
| to embrace | 7–8K | 0.65 |
Note: This table is based on values associated with the Dutch lemmas, but we use the English translation of those words as entries.
Acknowledgements
We would like to thank all participants, teachers, and administrative staff for their collaboration. We are indebted to the reviewers and editors of Language Testing and to Professor Elke Peters and Professor Steven Verheyen for their constructive comments on early drafts.
Declaration of conflicting interests
The authors declared no potential conflicts of interest with respect to the research, authorship, and/or publication of this article.
Funding
The authors disclosed receipt of the following financial support for the research, authorship, and/or publication of this article: This study was funded by Research Foundation Flanders (FWO) under grant number 12Q6717N.